Embed Size (px)
Citation preview

A Web‐based Open‐source Geoinformation Tool for Regional WaterResources Assessment
Susanna Grasso1,2& Pierluigi Claps1 & Daniele Ganora1 & Andrea Libertino1
Received: 30 June 2020 /Accepted: 21 December 2020/# The Author(s), under exclusive licence to Springer Nature B.V. part of Springer Nature 2021
AbstractTo reduce the impact of droughts and increase the resilience of regional water systems,various competing demands, such as hydropower, supply, irrigation and river ecosystems,need to be reconciled. In this perspective, for a sustainable and efficient management ofthe water resources, planners and practitioners would benefit from using the most recentdata and easily accessible analysis tools, that can make hydrological model applicationseasier to apply. In this paper, a web-based open-source geoinformation tool for estimatingFlow Duration Curves (FDCs) in ungauged basins is presented. The FDC estimationderives from a regional statistical model, that relates basin topographic parameters,climatic characteristic and other environmental factors to FDC features via multivariateregression. The software tool has the primary function of simplifying the GIS-intensiveapplication of the multivariate methodology, allowing computation of the necessary basinfeatures through web services. These are developed in compliance with the OGCspecifications for geospatial Web Processing Service (WPS), while scripting and modelimplementation are developed server-side, which ensures the user access to alwaysupdated data, and to procedures free from software client compatibility issues. Anoperational application is available for the North-Western Italy.
Keywords FlowDurationCurve .WaterResources .WebProcessingService (WPS) . PyWPS4 .
Web-GIS tool . Docker
Water Resources Managementhttps://doi.org/10.1007/s11269-020-02750-x
* Susanna [email protected]
* Daniele [email protected]
1 Department of Environment, Land and Infrastructure Engineering, Politecnico di Torino, corso Ducadegli Abruzzi, 24, 10129 Torino, Italy
2 Present address: ARPA Lombardia, Milan, Italy

1 Introduction
Increase in the frequency, duration, and severity of extreme droughts associated with climatechange have raised global concern on the need of better management of the available waterresources. Several studies have shown how global aridity has increased substantially since1970, and climate models predict more droughts in the 21st century over many denselypopulated areas of the world (a complete review can be found in Dai 2011). In temperatehumid climates, management of resources in regional water systems needs to face increasingconflicts of water uses, also due to more strict rules for the preservation of the environment.Tools and methodologies for a systematic assessment of the water availability at large scalesare thus required to ensure reliable and harmonized water allocation.
Flow Duration Curves (FDCs) are among the most commonly adopted tools for water resourceassessment (see e.g. McMahon 1993). A FDC indicates the percentage of time that a specifieddischarge in a river section is equaled or exceeded, which is substantially equivalent to drawing afrequency distribution of flow values in a river. A FDC computed for each calendar (or hydrologic)year is called “annual” while, if it includes the observations of all the years merged together, it isreferred to as “long-term” or “period-of-record” (see e.g. Berton et al. 2016). This type ofinformation is commonly adopted for hydropower potential assessment and for environmental flowevaluation, but is also a useful support for impact assessment and risk management. Furthermore,the FDC allows to assess minimum flows as the low end of the curve (Ling Lloyd et al. 2015).
For a gauged basin, the empirical FDC is easily built by plotting the sorted observations(usually at the daily scale) versus their exceedance frequency, computed with a plottingposition formula (e.g., Weibull). Where gauged data are either limited or not available,regional statistical models for predicting FDCs are commonly adopted (e.g. Nruthya andSrinivas 2015; Vogel and Fennessey 1994). In this work we refer to the regional model forFDC prediction in ungauged basins developed by Ganora et al. (2016). It has been initiallycalibrated for the upper Po river basin in North-Western Italy (Fig. 1) but it can be easily re-calibrated for other regions. The model is one of the products of the RENERFOR project(“Cooperation initiatives for the development of renewable energy sources in the western Alps,energy saving and emissions reduction”) co-funded by EU under the ALCOTRA fundingprogram, primarily focused on the possibility to exploit renewable energy sources.
The Piedmont region has suggested to practitioners to adopt the model proposed by Ganoraet al. (2016) when submitting water withdrawal requests for new or revamped hydropowerplants. However, practitioners have to face a consistent workload to apply the method, thatrequires the application of several GIS-based procedures.
The aim of the present work is to provide different kind of users with an open, scalable andreproducible web GIS procedure for FDC reconstruction over large areas, able to support bothinstitutional regulations and private initiatives of sustainable development of mini-hydropowerplants. The underlying scientific objectives are twofold: on one side, to promote a knowledgetransfer, by developing an interactive web procedure for reproducing and applying a regionalstatistical model; on the other side, to assess the robustness of the SSEM model to multipleapplications, in order to better check its concrete transferability to other areas.
This paper is organized as follows: in Sect. 2 we recall the regional methodology toestimate FDCs at ungauged sites; in Sect. 3, the GIS implications of the procedure arediscussed; Sect. 4 presents the client experience in producing the FDC curve via web-GISand the details of the free and open-source web platform architecture realized. A conclusionsection closes the paper.
S. Grasso et al.

2 The SSEM Regional Statistical Analysis for FDC Estimation
The regional model for FDC prediction adopted in the RENERFOR Project, fully described byGanora et al. (2016), is adapted from a spatially-smooth procedure originally developed by Laioet al. (2011) in the flood frequency context. The output of the procedure is the mean annual FDC inanalytical form. The obtained curve can be considered as “natural”, i.e., not affected by possibleupstream water abstractions, which should be later accounted for to define the actual wateravailability. The model is also topological-consistent, being the average annual flow downstreama confluence equal to the sum of the average annual estimates just upstream the confluence.
The practical application of the model in ungauged basins requires a number of stepsschematically depicted in Fig. 2. First, the river section of interest is identified, and thecorresponding basin boundary is extracted. This task can be performed by several standardGIS procedures; however, we have implemented it as an optional step in our web-basedprocedure to make it fully reproducible and independent from the user’s software.
Secondly, the basin boundary is used to extract a set of basin-scale descriptors, i.e.morphologic, climatic, soil, vegetation type, land use, etc. characteristics of the basin. Theseare obtained by clipping a number of maps developed in a regional hydrological atlas (Ganoraet al. 2013). In particular, the model uses: A, the basin area [km2];MAP, the mean areal annualprecipitation [mm]; zm and zmax, the mean and maximum basin elevation [m a.s.l.]; fourierB1and CVrp, regime parameters for the mean monthly rainfall; clc2 and clc3, land use parameters(the percentage of the basin area classified as group 2 and group 3 in the Corine Land Cover,
Fig. 1 The case-study area in Northwestern Italy and map of the 129 available gauging stations used in theAlcotra RENERFOR Project. Original source: Ganora et al. 2016
A Web‐based Open‐source Geoinformation Tool for Regional Water Resources...
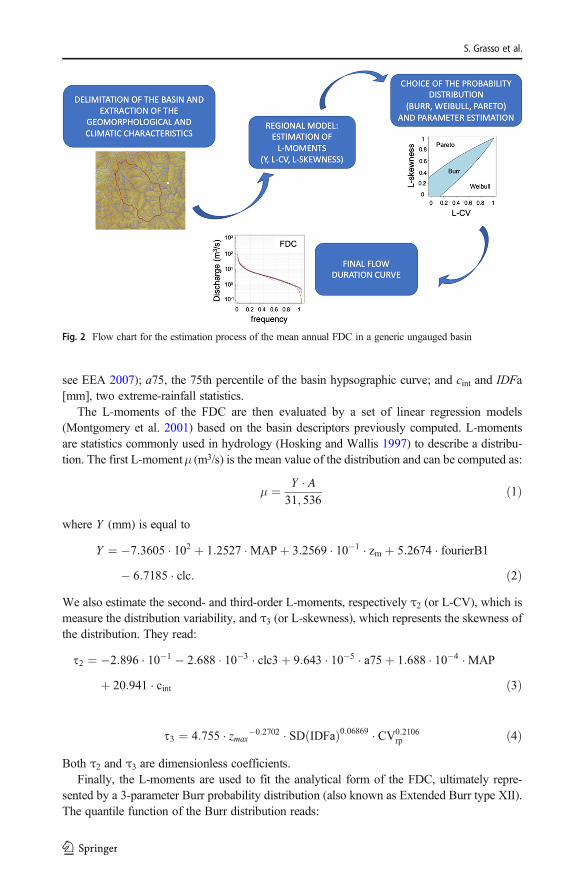
see EEA 2007); a75, the 75th percentile of the basin hypsographic curve; and cint and IDFa[mm], two extreme-rainfall statistics.
The L-moments of the FDC are then evaluated by a set of linear regression models(Montgomery et al. 2001) based on the basin descriptors previously computed. L-momentsare statistics commonly used in hydrology (Hosking and Wallis 1997) to describe a distribu-tion. The first L-momentμ (m3/s) is the mean value of the distribution and can be computed as:
μ ¼ Y � A31; 536
ð1Þ
where Y (mm) is equal to
Y ¼ �7:3605 � 102 þ 1:2527 �MAPþ 3:2569 � 10�1 � zm þ 5:2674 � fourierB1� 6:7185 � clc: ð2Þ
We also estimate the second- and third-order L-moments, respectively τ2 (or L-CV), which ismeasure the distribution variability, and τ3 (or L-skewness), which represents the skewness ofthe distribution. They read:
t2 ¼ �2:896 � 10�1 � 2:688 � 10�3 � clc3þ 9:643 � 10�5 � a75þ 1:688 � 10�4 �MAP
þ 20:941 � cint ð3Þ
t3 ¼ 4:755 � zmax�0:2702 � SD IDFað Þ0:06869 � CV0:2106rp ð4Þ
Both τ2 and τ3 are dimensionless coefficients.Finally, the L-moments are used to fit the analytical form of the FDC, ultimately repre-
sented by a 3-parameter Burr probability distribution (also known as Extended Burr type XII).The quantile function of the Burr distribution reads:
Fig. 2 Flow chart for the estimation process of the mean annual FDC in a generic ungauged basin
S. Grasso et al.

Q Pð Þ ¼ λ1� 1� Pð Þ�k
k
" #1c
ð5Þ
where Q is the discharge value (m3/s), P is the non-exceedance (also P ¼ d=ð365þ 1Þ with dthe duration expressed in days for year); k and c are the shape parameters and λ is the locationparameter. Complete and simplified equations to compute the parameters from the L-momentsare discussed in Ganora and Laio (2015). The Burr distribution was chosen among othercandidate functions for its performances and its convenient flexibility properties. For somepairs of τ2 and τ3 the Burr distribution collapse to the two-parameter Pareto or Weibull (seeinset in Fig. 2), which are special cases of the Burr. The location parameter is estimated as afunction of k,c and the mean µ.
3 GIS Implications of the FDC Estimation
In the section above we have described to which extent the SSEM procedure relies on GISanalyses. This is consistent with similar approaches (Palla et al. 2016; Sammartano et al. 2019and references therein) and with the fact that, in recent decades, the use of data obtained bygeographic information systems (GIS) has grown rapidly in many sectors and applications.These applications more and more require the use of complex GIS management systems, tocollect, integrate, share and display different spatial data and compute geospatial analysis(Yang et al. 2010). With the progressive improvement of open geospatial databases, the use ofInternet and of the Web technologies have expanded the scale and scope of the GIS domains,moving traditional desktop applications to web mapping solutions and to the global sharing ofboth spatial data and geoscience models (Fu and Sun 2011).
In the same time, with the high number of different GIS and WebGIS tools, to enable softwarecompatibility it is important to provide published data and processing services in linewith the alreadyavailable standards. Based on these considerations, data and procedures are increasingly suppliedthrough geospatial web services by using the Web Processing Service (WPS) standard given by theOGC (Open Geospatial Consortium), that provide easy access and interoperability from heteroge-neous platforms and GIS software. This solution has been adopted in our system, as it resolves thetechnical issues associated with software interoperability, allows users to access calculations inde-pendently from the operating system and the installed software and also without specific knowledgeof GIS technologies. This can happen since our geospatial analysis and calculations are performedserver-side, limiting the data traffic and returning only the expected results to the user. For the WPSservice implementation we heve used PyWPS 4 (i.e. the newest version of the server-side imple-mentation of the OGCWPS standard, based on the Python programming language). In addition, theprocedures have been set up using a Docker container solution.
It is worth noting that, even if PyWPS provides an effective standard method for web-basedgeoprocessing, only few applications have actually used it (e.g. Ninsawat et al. 2007; Landaet al. 2017, Hempelmann et al. 2018, Laza 2018; the National Geoportal of the Italian Ministryof Environment 2020). A recent implementation of PyWPS 4 (De Sousa et al. 2019) bringsnew improvements and provides a number of advanced features that present an important leapin the range of modes in which PyWPS can be used and deployed. What we actually proposeis a procedure for estimating the mean FDC in a generic watershed through a scalable andreproducible (using a Docker container with Nginx and Gunicorn as WSGI server for a pywps-
A Web‐based Open‐source Geoinformation Tool for Regional Water Resources...

Flask application) PyWPS 4 server development. The details of the tool developed arepresented in the following sections.
4 The Geoinformation Framework
4.1 The Local and Web Interfaces
The whole procedure for estimating the mean FDC in a generic watershed can be executed via webthanks to the implementation of two customized web processing services that automate thecalculations. The services can be accessed from the client side in two ways: directly from theweb-mapping application accessible form the project website or from anyGIS desktop software thatsupports the use of WPS protocols. Some software may require external plugins to use WPScapabilities. In both cases, a password is required to access the procedure (see the project website inFig. 3 and at the link http://www.idrologia.polito.it/piattaformarenerfor). For example, if the open-source desktop software QGIS is used, a WPS plugin is required, and the user can execute theprocess with reference to a specific watershed layer taken from the list of vector layers available inthe QGIS project. After executing the process, the outputs of the procedure are returned into a resultsconsole (Fig. 4) and the user can download the FDC’s graph as an SVG file. The alternative, andsimpler, access to the procedure is reproduced in Fig. 5a, that shows how the user can execute theprocedure using the WPS panel specifically developed on the WebGIS page. In both cases theprocedure returns an URL that allows to download a complete PDF report. (Fig. 5b).
4.2 The Platform Architecture
In this sub-section we describe the elements that form the structure of the software platform.Detailed explanations of the meaning of each specific part are provided in the appendix.
The remote application of the geospatial analyses required for the estimation of the FDC isrealized on a “WPS server”, that uses PyWPS 4 (4.2.8 version) on the top of GRASS GIS(7.8.2 version) as backend to access all the geoprocessing functionalities. PyWPS is deployedusing Nginx and Gunicorn inside a Docker container, i.e. a solution that isolates portion ofcode from the interaction with most of the requests from the users. The complete project sourcecode to setting up the containerized WPS server is hosted into the open platform GitHub at theaddress: https://github.com/SusannaGr/POLITO_PyWPS_Docker. Documentation alsocontains the scripts that reproduce the results of the model, as reported above.
The second pillar of the procedure, that allows to deploy the mapping contents from aWebGIS application (accessible through client browsers), is a web platform. It has beendeveloped with free and open-source software, using GISClient3 as the web mapping tool,Apache2 (2.4.18 version) as web server, Ubuntu 16.04.4 LTS as Server OS.
To illustrate the architecture of the software system, we have depicted all parts in the sketchof Fig. 6.
4.3 Input Data and Implementation of the Procedure
The basin boundary delimitation and the computation of catchment descriptors described inSection 2 require the input dataset containing (raster and vector) maps used in the RENERFOR
S. Grasso et al.

project. The most important input map is the digital elevation model (DEM), which allows todelimit the catchment area and to compute the average slope and the hypsographic curve. Weused the NASA SRTM (Shuttle Radar Topography Mission) DEM, locally corrected to obtainan accurate flow drainage network). All the required geospatial input data (e.g. Corine Land
Fig. 3 Homepage of the Project website where visitor can access to the registration and documentation pages ofthe offered services
A Web‐based Open‐source Geoinformation Tool for Regional Water Resources...

Cover vector maps, regime rainfall parameters raster maps) were set up in the GRASS GISdatabase.
The whole procedure is divided into two different PyWPS scripts: Basin BoundaryExtraction and Estimation of the analytical naturalized FDC.
The first one represents an optional procedure (as the basin boundary can be also uploadedindependently, using any GIS software) aimed at extracting the basin boundary from the DEM.This operation requires that the outlet section coordinates strictly belong to the drainagenetwork generated from the RENERFOR DEM. The network is provided in the onlinegeodatabase. Using the GRASS algorithm r.water.outlet, the WPS procedure returns thewatershed boundary from the drainage direction map (also available in the database) startingfrom the outlet coordinates given by the user.
The second procedure, aimed to estimate the FDC curve, operates in three steps:
Fig. 4 Result of the procedure called up from QGIS using a WPS plugin
(a) (b)
Fig. 5 Access by web browser to the procedure from (a) the web-mapping application (b) and to the PDFreporting the results obtained from the Estimation of the analytical FDC procedure
S. Grasso et al.

1. Using a PyWPS-GRASS-bridge, the basin boundary is imported into a GRASSsession, where the spatial averages of the basin descriptors layers are computed frompre-determined raster maps using r.univar and r.stats GRASS algorithms.
2. The regional L-moments for the given basin are estimated using Eqs. (1)-(4); the correctprobability distribution is selected and the distribution’s parameters are computed from theL-moments values.
Fig. 6 Project architecture where the PyWPS server is realized using the Docker technology (the container isbuild up with GRASS GIS support, Gunicorn and Nginx) and a WebGIS Platform is implemented on a LinuxServer to test the usability by browser of the web processing services
A Web‐based Open‐source Geoinformation Tool for Regional Water Resources...
3. The whole average FDC curve is computed using Eq. (5) and its plot is produced with theMatplotlib library.
Once the process is completed, the server-side procedure provides an URL pointing to thelocation of a PDF file that summarizes the results, i.e. the basin descriptors, the estimatedregional L-moments, the distribution parameters, the FDC curve. If the procedure is called by aGIS software (i.e., not using the web browser), the results are directly reported also in textformat together with the SVG graph of the FDC.
5 Conclusions
The estimation of Flow Duration Curves in ungauged basins is related to several key activitiesin water resources and water systems management. Nowadays, extensive FDC assessment ispossible in large areas, and this can valuably support responses to the Water FrameworkDirective (2000/60/EU) planning requirements. The regional model developed within theRENERFOR-ALCOTRA Project, for the North-Western Italy, represents a common anduseful guidance for practitioners to evaluate FDCs. Its application requires spatial data analysisand is not straightforward to apply. To make the application of this procedure easier, a WPSservice has been built, based on the PyWPS using GRASS for geoprocessing operations. Thetool allows the computation of the average FDC in any basin within the North-Western Italyregion by providing an outlet section location, encompassing an area of more than 25,000 km2.
A server-side scripting has been used in the software design, with the great advantage that userscan access data and calculations in real time and independently of the underlying software, alsoreducing the time required for the analysis and the risk ofmiscalculations. A pdf reporting procedureis also implemented, which provides the results of the analysis, i.e. a summary of the numericalresults of the descriptors, L-moments, parameters and the graphical representation of the FDC. Thesystem has been set up with a versatile modular structure, aimed at making it easily reproducible inother spatial domains and other WPS server implementation.
The easy accessibility to a free service, which does not require special programming skillsor computational resources, can offer significant incentives for cooperation between thescientific community and the end-users in tackling water resources related issues. The appli-cation case illustrated for the North-Western Italy, can thus act as a guideline for similarimplementations in other regions of the world.
The project source code referred to WPS server implementation is accessible online onGitHub at https://github.com/SusannaGr/POLITO_PyWPS_Docker; while the userdocumentation and a WebGIS platform to access online the WPS services is available athttp://www.idrologia.polito.it/piattaformarenerfor.
Author Contributions All authors contributed to the study conception and design. SG developed the webplatform and wrote the first draft of the manuscript. All authors contributed to the revised version, read andapproved the final manuscript.Data AvailabilityData are available from the RENERFOR Project.
Compliance with Ethical Standards
Conflicts of Interest/Competing Interests Authors declare no conflicts of interest.
S. Grasso et al.

Code Availability The web-based tool is built with open source software described in the article text.
Appendix Glossary of the Main Components of the WPS Platform
A brief description of the individual tools making up the system is presented hereafter.DOCKER is an open-source software designed to create, deploy, and run applica-
tions by using container technology. Docker provides repeatable development, test andproduction environments that allows developers to pack up different applications inindependent and isolated way. Briefly, a Docker container consists of a Docker image,an execution environment, and a standard set of build instructions. Multiple containerscan share the access to the same image and make container-specific changes on awritable layer. A Docker image can be built by reading the instructions from aDocker file that usually consists of commands to install packages, calls to customedscripts, setting environmental variables and permissions. Building up a container anddeploy it into any other system where Docker is running, is easy enough.
Containerization improves encapsulation, scalability, reproducibility, portability, maintain-ability and offers new possibilities concerning execution security and isolation of resourcesbut, in contrast to virtual machines, faces the issues of high overhead due to hardwareemulation obtaining better performance in sharing the host OS kernel.
The use of this technology makes development process more agile and responsive andmakes hassle-free the code reuse (Docker 2020).
Web Processing Service (WPS) is one of the OGC (OGC WPS 2020) specifications toprovide access to GIS data or functionality over the internet in a standardized way, on the basis ofXML/GML communication encoding, used for serving and executing geospatial processes,algorithms, and calculations. WPS standard defines how a client can request the execution of aprocess, and how the output from the process is handled. The data that the process uses can bedelivered through the network or made available at the server level and can include vector orimage formats such as GeoTIFF, GML, KML etc. Client applications work with a WPS serviceby appending parameters to the service’s URL. The Request may be made as a HTTP GET, or aHTTP POST with an XML request document. The inputs and outputs required depend on theprocess being executed. Response is delivered as an XML document. GRASS (GeographicResources Analysis Support System) is a free and open-source desktop GIS software (GRASS2020). It can handle all geospatial data format such as: raster, vector, image, tabular data, etc.Furthermore, GRASS offers many spatial modeling algorithms focused on hydrological analysis.This software has an intuitive graphical user interface but can also be used through the systemcommand line, so it can be easily integrated in other services through designated scripts.
PyWPS is a Python-based WPS implementation. It provides a native support for manygeospatial tools like GRASS GIS, R-Project and GDAL. Python is recognized as the most geo-positive scripting language currently available: therefore GIS software are evolving more andmore to take advantage of it. Initially started in 2006, PyWPS version 3 has been completelyre-written to PyWPS-4 in order to provide new and useful features. The current versionimplements the WPS 1.0 standard (PyWPS 2020).
GISCLIENT3 is an open source software, offered by the Italian company GisWeb s.a.s.,written in AJAX, Javascript, PHP/MapScript that offers an innovative way to manage complexGIS projects. It is composed by two components: GisClient Author, a component that allowsadministrators to build and manage data and GIS projects and GisClient Viewer, a Web-GIS
A Web‐based Open‐source Geoinformation Tool for Regional Water Resources...

interface, based on OpenLayers, which allows the typical client-side mapping operation andexecution.
References
Berton R, Driscoll CT, Chandler DG (2016) Changing climate increases discharge and attenuates its seasonaldistribution in the northeastern United States. J Hydrol 5:164–178. https://doi.org/10.1016/j.ejrh.2015.12.057
Dai A (2011) Drought under global warming: a review. Wiley Interdiscip Rev Clim Chang 2(1):45–65De Sousa LM, De Jesus JM, Čepicky J, Kralidis AT, Huard D, Ehbrecht C, Barreto S, Eberle J (2019) PyWPS:
overview, new features in version 4 and existing implementations. Open Geospat Data Softw Stand 4(1):13.https://doi.org/10.1186/s40965-019-0072-0
Docker (2020) Docker online resource and documentation. https://www.docker.com/. Accessed Apr 2020EEA (2007) European Environment Agency. Corine land cover. https://www.eea.europa.eu/publications/COR0-
landcover/page001.html. Accessed Apr 2020Fu P, Sun J (2011) GIS in the Web Era. Web GIS: Principles and applications. ESRI Press, Redlands, pp 1–24Ganora D, Laio F (2015) Hydrological applications of the burr distribution: Practical method for parameter
estimation. J Hydrol Eng 20:67–77. https://doi.org/10.1061/(ASCE)HE.1943-5584.0001203Ganora D, Gallo E, Laio F, Masoero A, Claps P (2013) Analisi idrologiche e valutazioni del potenziale
idroelettrico dei bacini piemontesi, Progetto RENERFOR Regione Piemonte. http://www.idrologia.polito.it/web2/open-data/Renerfor/analisi_idrologiche_LR.pdf. Accessed Apr 2020
Ganora D, Laio F, Masoero A, Claps P (2016) Spatially-smooth regionalization of flow duration curves in non-pristine basins. In: Proceedings of the International Association of Hydrological Sciences 373:73–80. https://doi.org/10.5194/piahs-373-73-2016
National Geoportal of the Italian Ministry of Environment (2020) Servizio WPS di Trasformazione diCoordinate. URL http://www.pcn.minambiente.it/mattm/servizio-wps/. Accessed Apr 2020
GRASS (2020) GRASS GIS online official resource and documentation URL https://grass.osgeo.org/. AccessedApr 2020
Hempelmann N, Ehbrecht C, Alvarez-Castro C, Brockmann P, Falk W, Hoffmann J, Vautard R (2018) Webprocessing service for climate impact and extreme weather event analyses. Flyingpigeon (Version 1.0).Comput Geosci 110:65–72
Hosking JRM, Wallis JR (1997) Regional frequency analysis: an approach based on L-moments. CambridgeUniversity Press, Cambridge
Laio F, Ganora D, Claps P, Galeati G (2011) Spatially smooth regional estimation of the flood frequency curve(with uncertainty). J Hydrol 408:67–77. https://doi.org/10.1016/j.jhydrol.2011.07.022
Landa M, Kavka P, Strouhal L, Cepicky J (2017) Building a complete free and open source GIS infrastructure forhydrological computing and data publication using GIS.LAB and GISQUICK platforms. ISPRS -International Archives of the Photogrammetry, Remote Sensing and Spatial Information Sciences XLII-4/W2: 101–105.
Laza A (2018) Process isolation in PyWPS framework. Master’s Thesis, Czech Technical University in PragueLing L, Yusop Z, Askari M (2015) Assessment of Flow Duration Curve fitting equations. In: UTM Press Book
Chapter Title: Stochastic hydrological modelling in water management, 1st edn. Universiti TeknologiMalaysia, UTM Press Editors, Publisher
McMahon TA. . Maidment (1993) Hydrologic design for water use. In: Handbook of Hydrology. D. R.McGraw-Hill, New York
Montgomery D, Peck E, Vining G (2001) Introduction to linear regression analysis, 3rd edn. Wiley-Interscience,New York
Ninsawat S, Raghavan V, Masumoto S, Chemin Y (2007) WebProcessing Service for Spatial Analysis usingPyWPS and GRASS GIS. Int J Geoinform 3(4):19–25
Nruthya K, Srinivas VV (2015) Evaluating methods to predict streamflow at ungauged sites using regional flowduration curves: A case study. Aquat Procedia 4:641–648
OGC WPS (2020) OGC Web Processing Service. https://www.ogc.org/standards/wps. Accessed Apr 2020Palla A, Gnecco I, La Barbera P, Ivaldi M, Caviglia D (2016) An integrated GIS approach to assess the mini
hydropower potential. Water Resour Manage 30(9):2979–2996. https://doi.org/10.1007/s11269-016-1318-6PyWPS (2020) PyWPS online official documentation. https://pywps.org. Accessed Apr 2020Sammartano V, Liuzzo L, Freni G (2019) Identification of potential locations for run-of-river hydropower plants
using a GIS-based procedure. Energies 2019:12. https://doi.org/10.3390/en12183446
S. Grasso et al.
Vogel RM, Fennessey NM (1994) Flow-duration curves. New interpretation and confidence intervals. J WaterResour Plan Manag 120:485–504. https://doi.org/10.1061/(ASCE)0733-9496(1994)120:4(485)
Yang C, Wong D, Miao Q, Yang R (2010) Advanced geoinformation science. CRC Press, Boca Raton. ISBN-10: 1439810605
Publisher’s Note Springer Nature remains neutral with regard to jurisdictional claims in published maps andinstitutional affiliations.
A Web‐based Open‐source Geoinformation Tool for Regional Water Resources...