Embed Size (px)
Citation preview
American Journal of Geographic Information System 2013, 2(3): 37-46 DOI: 10.5923/j.ajgis.20130203.02
A Visual Aided DSS Prototype Development to Mitigate the Flood Hazards
Nasly M. A.*, Faisal Nadeem Saher
Faculty of Civil Engineering & Earth Resources, University Malaysia Pahang, Malaysia
Abstract Flood hazards caused by extreme rain events or unplanned watersheds is a problem and it has become a growing concern under impact of climate change. There is a dire need to develop new paradigm to combat flood hazards and operational decision-making process. Effective decision is a challenge, in a context to select best-suited option for mitigation. The general objective of this paper is to propose a visual aided decision support platform providing an ease but acceptable level of strategy. Presented prototype includes modelling and GIS based visual aids. A study of Pahang River in Malaysia conducted, to explain the applications of the prototype. This study affirms two major conclusions: First, there is great potential to adopt the proposed methodology at a level of decision-making authorities, leading to selection of actual measures for flood mitigation. Second, integration of model, Water Evaluation and Planning (WEAP), Global Mapper and GIS proved as a salient feature of Decision Support System as visual aided scenario generation. This paper has given an account of and the reasons for the use of prototype for flood hazards.
Keywords Visual A ided DSS, W EAP, Pahang River, Scenarios Generation, Flood Mitigation
1. Introduction A decision support system (DSS) helps the users to
resolve the complex problems interactively for reliab le decision development[1]. However, the complexity of the problems can simplify to come up with understandable action plan. The professional community has put considerable efforts to develop more sophisticated DSS through an attempt of integrating different models with GIS. Under similar case, a hybrid approach for flood risk zones mapping and impact of flood occurrences by integrating GIS and HEC-RAS testified with reliable outputs[2]. It is becoming d ifficu lt to ignore the current systems of decision analysis, which consider policy concerns. A web based DSS prototype tool developed by[3] is an example o f, to focus on consequences of relevant policies for river management. Another leading cause is a shift from flood protection towards flood risk management. Th is shift is a progressive change to avoid uncertainties in different decision situations [4].
In recent years, there has been discussed a methodology at improving the interactions between the professionals and other stakeholders for decision-making processes in water management[5]. Keep ing in v iew all the part icipants concerned with decision , it shows the importance o f a
* Corresponding author: [email protected] (Nasly M. A.) Published online at http://journal.sapub.org/ajgis Copyright © 2013 Scientific & Academic Publishing. All Rights Reserved
system capable to depict the datasets with visual aids. During study of flood behaviour of rivers, the impact of
tidal would not spare, as it becomes necessary to predict the routing of floods under tidal in fluence. This issue highlighted by[6]. The problem is to include these factors at one platform to forecast flood risk and accordingly preparation of mitigation plan. The present study designed to determine the problem solution: as to adopt more sophisticated decision-making tools. In future, the risk of floods to our lives is dependant to the existing flood measures[7]. As a policy for future p lanning, a system of water monitoring would be required to improve the decision support systems, as an effective source of planning[8]. Several attempts made to develop user-friendly system of DSS at windows environment with a capacity to select the appropriate model for analysis[6, 9]. The limitation of these systems is the demonstration of the decision options as dynamic v iews. This dynamic v isualization would enhance the mapping features[10]. Some other researcher uses the concept of dynamic graphing tools and dynamic 3D flood informat ion[11, 12]. Simultaneously, use of the integration concept is stimulated through the growing tendency of visual enhancement processes. In decision sciences, the decision process involves different tools such as artificial intelligence, data min ing, online analytical processing, and knowledge management[13]. The DSS may focus into four categories: i) on data ii) on improving the user interface iii) models and iv) development of web-based applications[14]. The current study has considered the enhancement of user interface with dynamic d isplay of data and results.

38 Nasly M. A. et al.: A Visual Aided DSS Prototype Development to Mitigate the Flood Hazards
Malaysia has been subjecting to the hazard of flooding due heavy rainfall during monsoon. In Malaysia maximum rainfall occurs during the months of November, December and January, while June and July are the driest months[15]. Excessive rainfall during monsoon and other development activities results heavy soil erosion and landslides causing siltation of rivers which makes floods severe in magnitude [16]. During floods, evacuation to min imize life losses is a good strategy at the time of hazard.
In this paper, we will describe the conceptual design of the visual aided DSS. To demonstrate the potential of adopting the proposed prototype elaborated and integration of WEAP model, Global Mapper and GIS proved as a salient feature of DSS as visual aided scenario generation. This paper has discussed the reasons for the use of prototype for flood hazards.
2. Integration of Model with Visuals The reliable o f the identified mit igation measure for flood
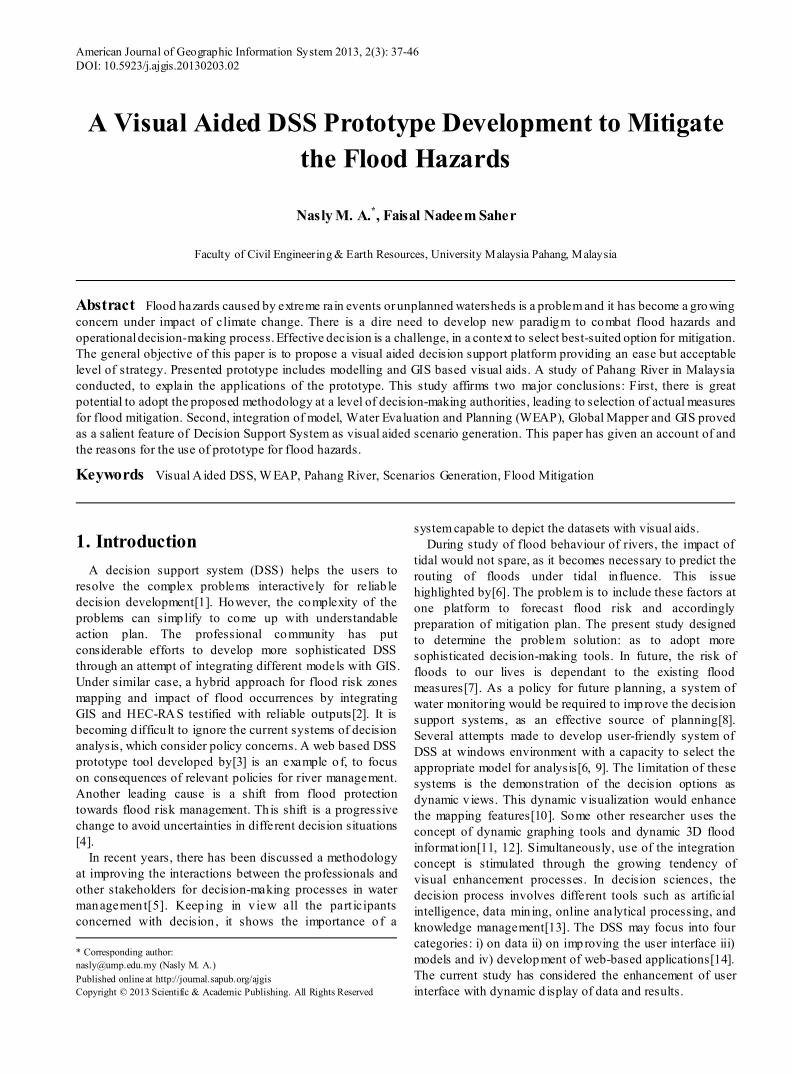
depends upon the accuracy of input datasets and method of analysis. Keeping in v iew this fact spatial data layers were acquired from secondary source (Department of Irrigation and Drainage, Malaysia) and get verified through collecting GPS field data. After collection and preparation of all datasets, layers were exported to geodatabase format of ArcGIS.
The relat ionship between decision making and interactive graphics was investigated by[17]. Under this study, an interactive graphics based problem was structured and cognitive psychology incorporated into a decision support system. It confirmed that understanding complex problems influenced by visual-thinking, verbal, and logical reasoning skills. The general prototype design presents to brief the structure of proposed DSS and to define some terms used in the DSS as shown in figure 1.
Figure 1. General schematic structure of Visual aided DSS
The flow diagram to generate a system of decision to identify the flood mitigation measure is provided in figure 2.
Figure 2. Flow diagram for development of DSS

American Journal of Geographic Information System 2013, 2(3): 37-46 39
Figure 3. Scenarios generation module with data visuals
Pahang River is a richest source of water resources due to its large length of 459 km length and water utilizat ion. Pahang River database generated using Arc GIS. The attribute data from this geodatabase then imported into WEAP model for simulat ion and generation of different scenarios. These scenarios were dependent on different sets of condition. Different factors including population growth rate, improvement of river system and annual mean flows of Pahang River considered. In figure 3 scenario generation module of W EAP model shown. This module has feature to change dependent variables for different scenarios using slide bars as provided on interface.
Figure 4. Flood inundation as 3D dynamic visuals
The WEAP model has an advantage over other available models. This model includes consumptive use, water demand forecasting, and economic factors related to water cost[18]. For decision maker, it becomes very easy to see the relation between different variable and their impact on overall change of river behavior. This visual enhancement
continues and dynamic views generated in Global Mapper. These 3D dynamic views demonstrated inundation areas under different water flows of river, see figure 4.
Integrating the 3D module of Global Mapper is due to the cause as reported by[19] that Arc GIS prone to different issues while handling dynamic modeling. However, there are future developments, which would include enhancing the dynamic modeling visuals in Arc GIS. It is also important to mention here that inundation under different flow of rivers performed on DEM but this is not enough to simulate the reality. Therefore, it observed that 3D in frastructure would also merge over DEM for actual situation. In this context, Arc GIS has its strengths to generate this kind o f 3D environment. After developing this enhanced terrain then it would import at 3D module of Global Mapper.
3. Visual Aided DSS Prototype Dynamically display of terrain parameters discussed in
earlier section. Other important aspect is to simulate the datasets and results visualizat ion. Figure 5 g ives the simulated results for the Pahang River flows under impact of flood mitigation programs. This simulation testified using WEAP model and results as shown in figure 5.
As a comparat ive, other study demonstrated that combin ing with GIS outputs and XP-SWMM for hydrodynamic simulation, the obtained results would prove to be more sophisticated as a tool for flood forecasting and flood warning system[18]. In this case, we may consider these facts, to involve the flexibility in proposed prototype so that users would be able to use different models. This situation will lead to more adoptive system of integration for improved DSS process.

40 Nasly M. A. et al.: A Visual Aided DSS Prototype Development to Mitigate the Flood Hazards
Figure 5. Simulated results for Pahang River flow predictions under Impact of flood mitigation
Figure 6. Integrated Interface of WEAP modules with arc GIS display
4. Application Potential of Prototype This section will show the proposed design and interface
of DSS prototype. An example of application described below in figure 6. This integrated interface has been design to propose prototype display arrangement, under user - friendly environment.

American Journal of Geographic Information System 2013, 2(3): 37-46 41
5. Discussion and Conclusions There would be several possible modifications in the
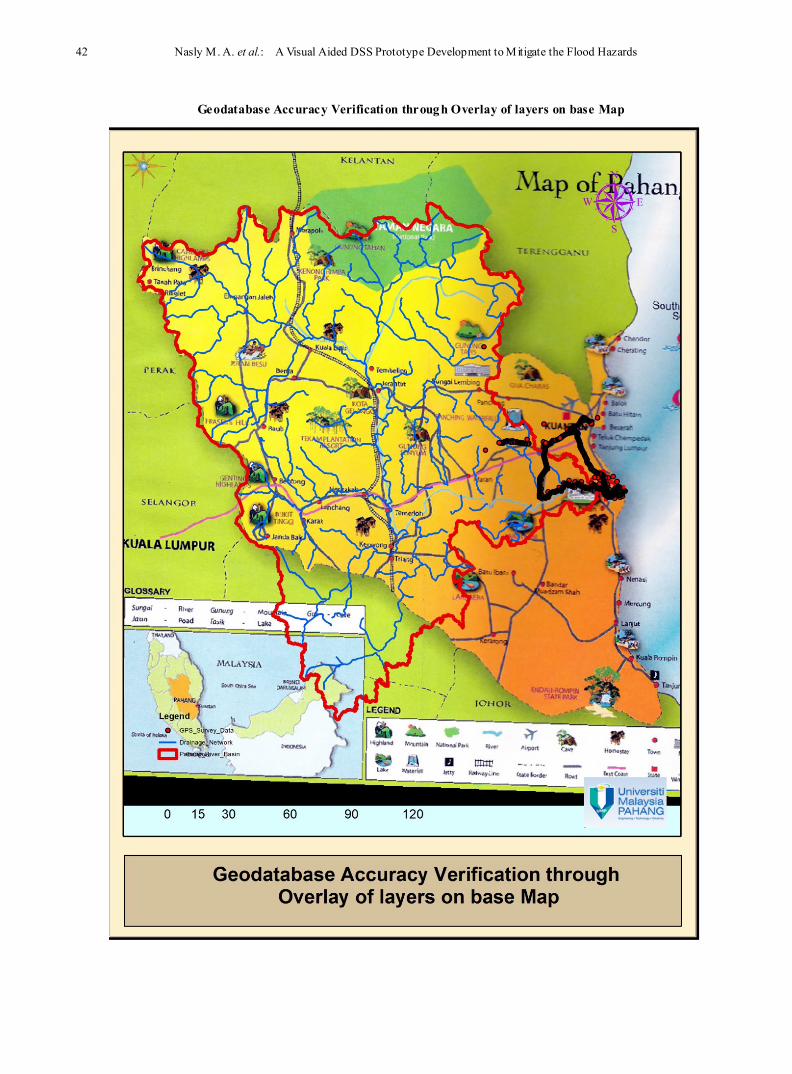
design of prototype as proposed. These changes truly suggested for localized validation of models for better output result. However, the concept of dynamic visual aided DSS would remain same. For a case of flood risk simulat ions for major events expose the people to higher vu lnerability. To make the system sustainable and more resilient to natural disasters, it requires proper decisions for floodplains as a planning process[2]. In general, it can concluded, that an inappropriate model selection leads, towards satisfactory foundations to decide over best of the available options. In this study, an underestimation of the quantitative results based on the secondary data of hydrology and river flows. It also observed that the accuracy and validation of the generated scenarios is directly dependent on the accuracy of DEM. The improved development of 3D v isual user interface attempted by[19], which facilitates users to participate actively in the process of visualizing flood forecasting. Current study added an aspect of DSS through integrating the 3D visuals. This study affirms that there is great potential to adopt the proposed methodology at a level of decision-making and integrated approach for DSS
prototype including WEAP model, Global Mapper and GIS. This system provides users to take advantage to review the scenarios for post processing simulations. This provides a mean to fine-tune results, required to manage rivers and preparation plans prior to flood occurrences. The study concept would be adopted for the regions having similar climate, however, parameters of hydrological calcu lations may vary from basin to basin.
ACKNOWLEDGEMENTS University Malaysia Pahang funded this work under
research grant GRS 110334 and provision of modelling software supported by Department of Irrigation and Drainage Malaysia. The authors would like to thank these both institutions and indebted to Centre fo r Earth Resources Research & Management (CERRM) for provid ing the facilit ies during field verifications.
Appendix MAPPING LAYERS OF GEODATABAS E
Drainage Network and Catchment Area of Pahang River
42 Nasly M. A. et al.: A Visual Aided DSS Prototype Development to Mitigate the Flood Hazards
Geodatabase Accuracy Verification through Overlay of layers on base Map

American Journal of Geographic Information System 2013, 2(3): 37-46 43
Geodatabase Accuracy Verification through Overlay of layers on base Map

44 Nasly M. A. et al.: A Visual Aided DSS Prototype Development to Mitigate the Flood Hazards
Isohyet Map overlay on Pahang River Basin
American Journal of Geographic Information System 2013, 2(3): 37-46 45
Digital Elevation Model of Pahang Catchment Area
REFERENCES [1] Turban, E., et al., Decision support and business intelligence
systems 2007: Pearson Education India.
[2] Yerramilli, S., A Hybrid Approach of Integrating HEC-RAS and GIS Towards the Identification and Assessment of Flood Risk Vulnerability in the City of Jackson, MS. American Journal of Geographic Information System, 2012. 1(1): p. 7-16.
[3] Salewicz, K.A. and M. Nakayama, Development of a web-based decision support system (DSS) for managing large

46 Nasly M. A. et al.: A Visual Aided DSS Prototype Development to Mitigate the Flood Hazards
international rivers. Global Environmental Change, 2004. 14: p. 25-37.
[4] Liu, Y., et al., Efficient GIS-based model-driven method for flood risk management and its application in central China. Natural Hazards and Earth System Sciences Discussions, 2013.
[5] Ceccato, L., V. Giannini, and C. Giupponi, Participatory assessment of adaptation strategies to flood risk in the Upper Brahmaputra and Danube river basins. Environmental Science and Policy, 2011. 14(8): p. 1163-1174.
[6] Leung, Y., et al., An environmental decision support system for the management of water pollution in a tidal river network. International Journal of Geographical Information Science, 2005. 19(4): p. 483-500.
[7] Mirfenderesk, H., Flood emergency management decision support system on the Gold Coast, Australia. Australian Journal of Emergency Management, 2009. 24(2): p. 50-58.
[8] Dlamini, E.M., Decision support systems for managing the water resources of the Komati River Basin. International Journal of River Basin Management, 2007. 5(3): p. 179-187.
[9] De Martino, T., B. Falcidieno, and S. Haßinger, Design and engineering process integration through a multiple view intermediate modeller in a distributed object-oriented system environment. Computer-Aided Design, 1998. 30(6): p. 437-452.
[10] Kubíček, P. and K. Staněk. Dynamic visualization in emergency management. in Proceedings of First international conference on cartography and GIS. Sofia: Sofia Univerzity. 2006.
[11] Halls, J., River run: an interactive GIS and dynamic graphing website for decision support and exploratory data analysis of water quality parameters of the lower Cape Fear river. Environmental Modelling & Software, 2003. 18(6): p. 513-520.
[12] Schulte, C. and V. Coors. Development of a CityGML ADE for dynamic 3D flood information. in Joint ISCRAM-CHINA and GI4DM Conference on Information Systems for Crisis Management. 2008.
[13] Rayed, C.A., Using GIS for Modeling a Spatial DSS for Industrial Pollution in Egypt. American Journal of Geographic Information System, 2012. 1(3): p. 33-38.
[14] Aggarwal, A., A taxonomy of sequential decision support systems. Informing Science, 2001. 4(4).
[15] MMD, (2012). Malaysian Meteorological Department - General Climate of Malaysia. Available at: http:// www. met. gov.my/index.php?option=com_content&task=view&id=75&Itemid=1089&limit=1&limitstart=0
[16] Hazwani, S.N., (2011). Flood hazard in Malaysia. , p.Siti Nurul Hazwani. Available at: http:// www. scribd. com/ doc/ 46442262/Flood-Hazard-in-Malaysia
[17] Loy, S.L., The Interaction Effects Between General Thinking Skills and an Interactive Graphics Based DSS to Support Problem Structuring. Decision Sciences, 1991. 22(4): p. 846-868.
[18] Yates, D., et al., WEAP21—A Demand-, Priority-, and Preference-Driven Water Planning Model: Part 1: Model Characteristics. Water International, 2005. 30(4): p. 487-500.
[19] Sinnakaudan, S.K., et al., Flood risk mapping for Pari River incorporating sediment transport. Environmental Modelling & Software, 2003. 18(2): p. 119-130.
[20] Mastura, S.A.S., et al., Integration of 1-d Hydrodynamic Model and GIS Approach in Flood Management Study in Malaysia. Research Journal of Earth Sciences, 2009. 1: p. 22-27.
[21] Jern, M., Web-Based 3D Visual User Interface to a Flood Forecasting System, in Geo-information for Disaster Management, P. Oosterom, S. Zlatanova, and E. Fendel, Editors. 2005, Springer Berlin Heidelberg. p. 1021-1039.