Embed Size (px)
Citation preview

A publication of PwC’s Financial Services Institute (FSI)
A View from the Top:Credit Risk Management Dashboard Reporting for Financial InstitutionsReporting for Financial Institutions

ContentsContents
S ti PSection Page
1. Point of view 2
C titi i t lli 2. Competitive intelligence 10
3. A framework for response 12
4 How PwC can help 194. How PwC can help 19
Appendix Select qualifications 25

Section 1Section 1
Point of view
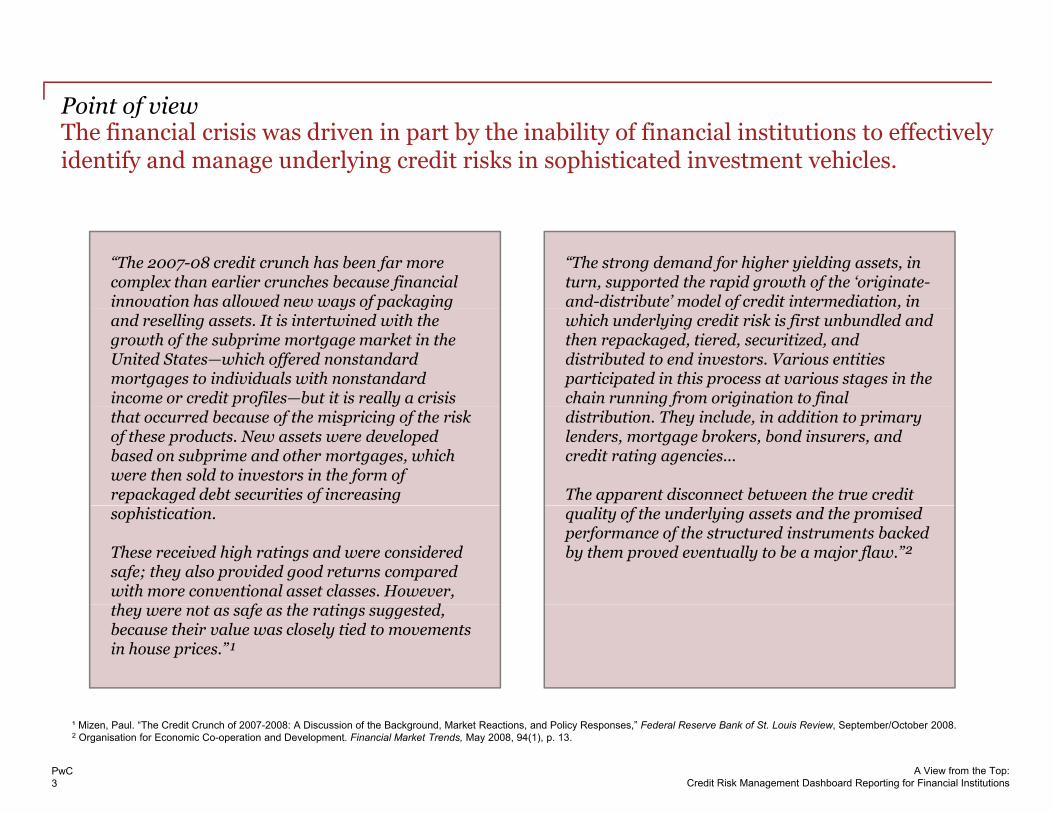
Point of viewPoint of viewThe financial crisis was driven in part by the inability of financial institutions to effectively identify and manage underlying credit risks in sophisticated investment vehicles.
“The 2007-08 credit crunch has been far more complex than earlier crunches because financial innovation has allowed new ways of packaging
“The strong demand for higher yielding assets, in turn, supported the rapid growth of the ‘originate-and-distribute’ model of credit intermediation, in y f p g g
and reselling assets. It is intertwined with the growth of the subprime mortgage market in the United States—which offered nonstandard mortgages to individuals with nonstandard income or credit profiles—but it is really a crisis
f ,which underlying credit risk is first unbundled and then repackaged, tiered, securitized, and distributed to end investors. Various entities participated in this process at various stages in the chain running from origination to final
that occurred because of the mispricing of the risk of these products. New assets were developed based on subprime and other mortgages, which were then sold to investors in the form of repackaged debt securities of increasing
distribution. They include, in addition to primary lenders, mortgage brokers, bond insurers, and credit rating agencies...
The apparent disconnect between the true credit sophistication.
These received high ratings and were considered safe; they also provided good returns compared with more conventional asset classes. However, h f h i d
quality of the underlying assets and the promised performance of the structured instruments backed by them proved eventually to be a major flaw.”²
they were not as safe as the ratings suggested, because their value was closely tied to movements in house prices.”¹
PwC3
A View from the Top:Credit Risk Management Dashboard Reporting for Financial Institutions
¹ Mizen, Paul. “The Credit Crunch of 2007-2008: A Discussion of the Background, Market Reactions, and Policy Responses,” Federal Reserve Bank of St. Louis Review, September/October 2008.2 Organisation for Economic Co-operation and Development. Financial Market Trends, May 2008, 94(1), p. 13.

Point of viewPoint of viewTechnology and reporting constraints were partly to blame for the lack of early warning indicators during the crisis. Going forward, success will depend on the ability of risk managers to accurately assess and address evolving changes in risk.
Within financial institutions, the risks being taken by individual lines of business may have been well understood. However, how those risks were correlated, and their cumulative impact on the organizational risk profile, were not. The lack of a portfolio view of risk is due, in part, to fragmented technology and inadequate risk reporting.
As discussed in the PwC Viewpoint Risky Business: Why Managing the Risks of Evolving Business Models Is the Key to Avoiding the Next Financial Crisis, “In many cases, senior management lacked a portfolio view of risks across the organization. For example, a number of financial institutions had several business units that were engaged in similar strategies, trading, or selling similar products. Often, there was no organization-wide understanding of the combined effects of these product offerings. The lack of a portfolio view of risk was often hampered by fragmented technology and/or inadequate risk reporting g p p y g gy / q p gacross the organization. Some institutions did not account for risk premiums when performing balance sheet analyses; as such,risky assets were not closely monitored. This led to refinancing and other transactions that were based upon asset values that may have been either overstated or not adequately hedged against losses.”¹
Effective credit risk management requires the ability to accurately assess and address evolving risks over time.
Risk managers are challenged to distill vast quantities of data into concise, actionable, and forward-looking views of risk, which facilitates risk mitigation activities and creates opportunities to capitalize on market conditions. For example, organizations that have undertaken FDIC-assisted transactions face significant challenges in understanding the future impact of mandated accounting and loss-sharing treatments on portfolio quality and overall performance trends. The failure to respond quickly and appropriately to changes in risk dynamics at both the customer and portfolio level can have devastating results in this volatile environment. For example, banks that failed to fully appreciate the risks that were building up in their mortgage exposures to residential development and commercial real estate experienced higher-than-expected defaults, which in some cases threatened their capital adequacy. From January 1, 2008 to April 15, 2011, the FDIC closed 356 banks.²In order to gain a full understanding of operating results and respond effectively to changing risk dynamics, risk managers
PwC4
A View from the Top:Credit Risk Management Dashboard Reporting for Financial Institutions
must be able to quickly assimilate significant portfolio issues and drill into relevant data as necessary.
¹ “Risky Business: Why Managing the Risks of Evolving Business Models Is the Key to Avoiding the Next Financial Crisis,” January 2011, www.pwc.com/fsi.² FDIC Failed Bank List. www.fdic.gov Accessed April 27, 2011.
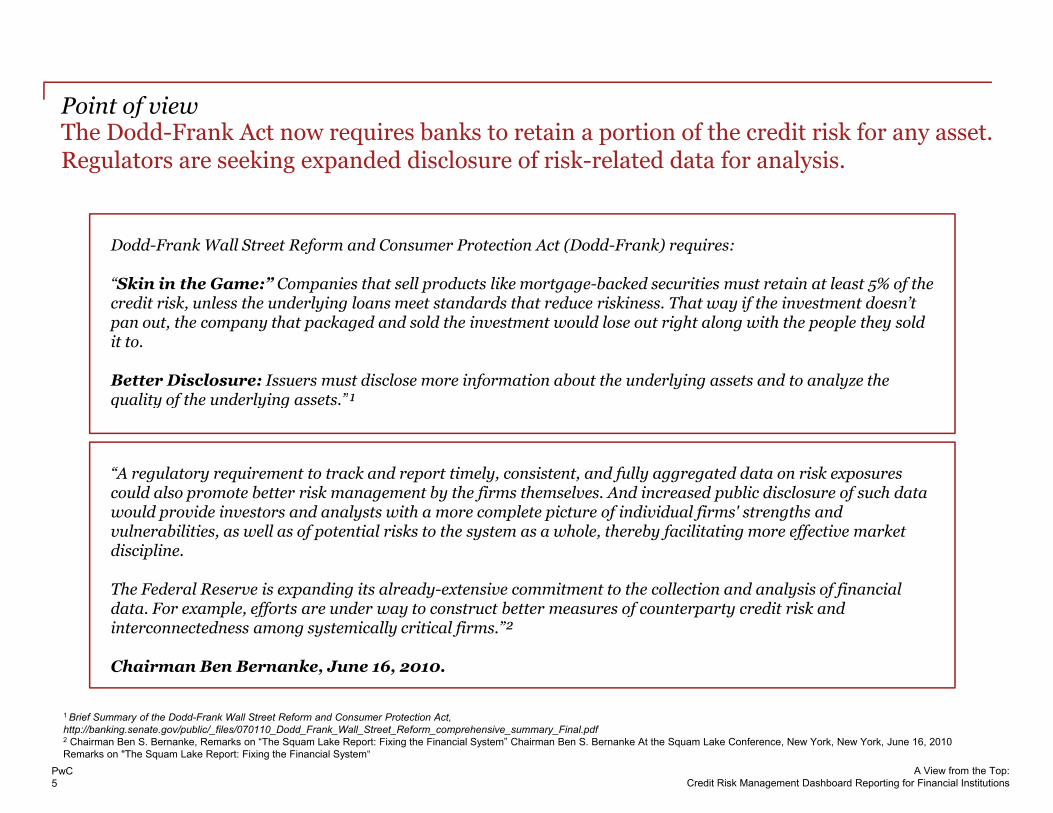
Point of viewPoint of viewThe Dodd-Frank Act now requires banks to retain a portion of the credit risk for any asset. Regulators are seeking expanded disclosure of risk-related data for analysis.
Dodd-Frank Wall Street Reform and Consumer Protection Act (Dodd-Frank) requires:
“Skin in the Game:” Companies that sell products like mortgage-backed securities must retain at least 5% of the credit risk, unless the underlying loans meet standards that reduce riskiness. That way if the investment doesn’t credit risk, unless the underlying loans meet standards that reduce riskiness. That way if the investment doesn t pan out, the company that packaged and sold the investment would lose out right along with the people they sold it to.
Better Disclosure: Issuers must disclose more information about the underlying assets and to analyze the quality of the underlying assets.”¹q y f y g
“A regulatory requirement to track and report timely, consistent, and fully aggregated data on risk exposures could also promote better risk management by the firms themselves. And increased public disclosure of such data
ld id i d l i h l i f i di id l fi ' h dwould provide investors and analysts with a more complete picture of individual firms' strengths and vulnerabilities, as well as of potential risks to the system as a whole, thereby facilitating more effective market discipline.
The Federal Reserve is expanding its already-extensive commitment to the collection and analysis of financial d t F l ff t d t t t b tt f t t dit i k d data. For example, efforts are under way to construct better measures of counterparty credit risk and interconnectedness among systemically critical firms.”²
Chairman Ben Bernanke, June 16, 2010.
PwC5
A View from the Top:Credit Risk Management Dashboard Reporting for Financial Institutions
1 Brief Summary of the Dodd-Frank Wall Street Reform and Consumer Protection Act, http://banking.senate.gov/public/_files/070110_Dodd_Frank_Wall_Street_Reform_comprehensive_summary_Final.pdf2 Chairman Ben S. Bernanke, Remarks on “The Squam Lake Report: Fixing the Financial System” Chairman Ben S. Bernanke At the Squam Lake Conference, New York, New York, June 16, 2010 Remarks on "The Squam Lake Report: Fixing the Financial System“

Point of viewPoint of viewMarket participants, in addition to regulators, are demanding higher levels of transparency. Better credit risk management data is crucial to this.
The marketplace now demands high levels of transparency around risk trends and management practicesThe marketplace now demands high levels of transparency around risk trends and management practices.
Firms listed on the New York Stock Exchange must now reveal their risk assessment policies.¹
Standard & Poor's has incorporated risk management capabilities as a factor in assigning ratings.²
Other stakeholders, including executives, board members, investors, shareholders, and customers are now demanding accurate and timely views into the drivers of future performance.
Global mortgage investors will likely remain on the sidelines until they perceive improvements in the reliability of credit-risk assessments. These improvements will largely be driven by enhancements in mortgage credit policies, data management, and analytics.
Data integrity, both in terms of completeness and accuracy, has been an industry challenge; such problems continue to persist as data passes through lenders' operations and to third-party service providers, mortgage investors, and guarantors. However, leading practitioners are focused on improving data quality.
To manage data generated from multiple systems and stored in multiple databases in a variety of formats, leading practitioners have implemented better information technology (IT). These fixes are improving credit analytics and practitioners have implemented better information technology (IT). These fixes are improving credit analytics and management reporting, helping to prevent extensive delays in information reaching senior management because of expensive aggregation and error-checking processes.
Leading practitioners have improved their credit decision-making policies to satisfy the transparency requirements of third parties with vested interests in the decisions made by lenders.
Because good data and better reporting help senior management identify problems early, leading practitioners are making IT investments in loss mitigation and other IT initiatives. These lenders recognize that such investments may lead to revenue generation if they help to avert big-dollar credit losses.
PwC6
A View from the Top:Credit Risk Management Dashboard Reporting for Financial Institutions
1 http://www.nyse.com/pdfs/finalcorpgovrules.pdf² Standard & Poor's. 2010. Guide to Credit Rating Essentials: What are Credit Agencies and how do they work. Standard & Poor's Financial Services LLC.

Point of viewPoint of viewLeading financial institutions are upgrading technology infrastructure and risk reporting capabilities.
Financial institutions have made tremendous investments in both time and money to gather detailed riskFinancial institutions have made tremendous investments, in both time and money, to gather detailed risk-centric data.
Detailed customer, transactional, and product data have been collected in response to management improvement initiatives related to FDIC-assisted transactions and regulatory requirements such as Basel II.
In many cases financial services firms have only recently fully scrubbed standardized and consolidated such data into a In many cases, financial services firms have only recently fully scrubbed, standardized, and consolidated such data into a single central repository. This repository facilitates credit risk management at an enterprise level.
Many organizations have not yet leveraged this repository of data beyond basic reporting and regulatory compliance considerations. For these organizations, the true value of these investments has yet to be realized.
Well-designed credit risk management dashboards can enable firms to further leverage their data-related Well-designed credit risk management dashboards can enable firms to further leverage their data-related investments to improve and accelerate decision making, and require little additional investment.
Reporting capabilities have evolved and become more sophisticated over time, enabling end users to better manage and interpret complex information.
Dashboard reporting coupled with drill-down capabilities enables users to:Dashboard reporting, coupled with drill down capabilities, enables users to:– Summarize the most relevant metrics.– Call attention to key areas of concern.– Access detailed information that is required to understand root causes and underlying trends.– Identify, escalate, and potentially mitigate the impact of newly arising credit risk concerns earlier in the process.
Information used in risk management decisions should be comprehensive, accurate, accessible, and based on high-quality data.
Data should be transformed into meaningful metrics that are reflective of the nature of the business and key risk drivers andthat can readily understood by all business process participants.M i h ld d ll f i l i k id ifi i i k dj d f f li
PwC7
A View from the Top:Credit Risk Management Dashboard Reporting for Financial Institutions
Metrics should measure and allow for essential risk identification, risk-adjusted performance measures, portfolio management activities, and capital allocation decisions.
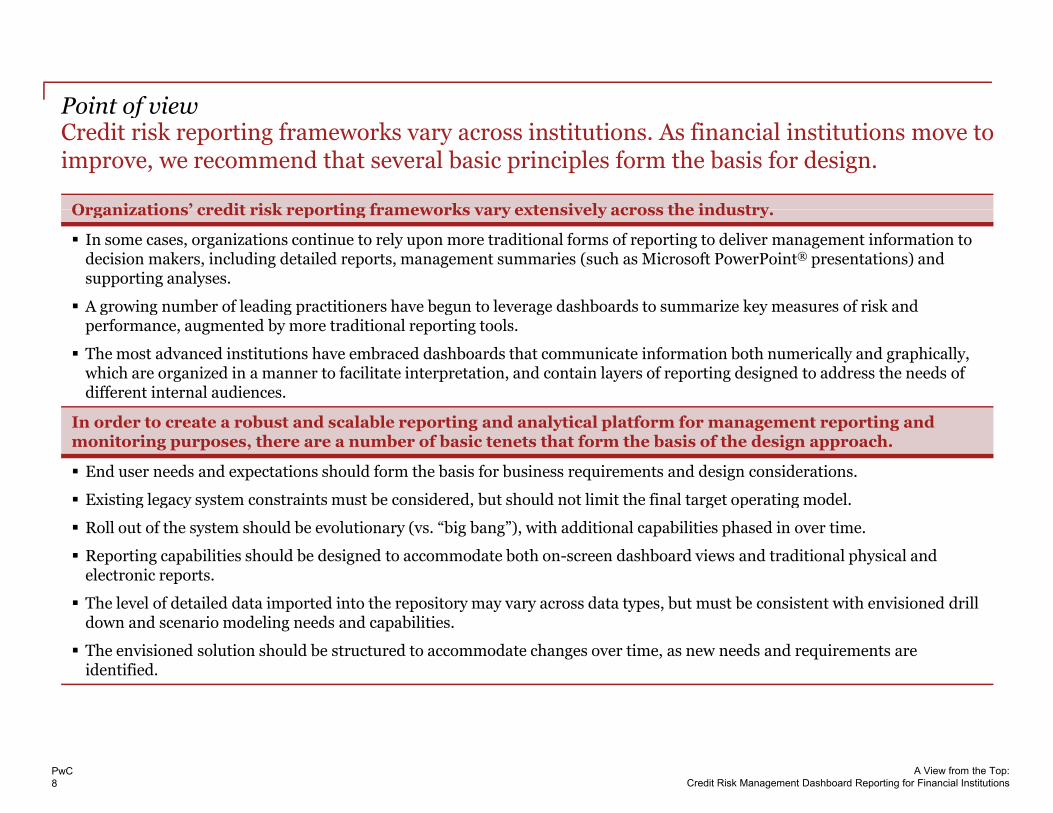
Point of viewPoint of viewCredit risk reporting frameworks vary across institutions. As financial institutions move to improve, we recommend that several basic principles form the basis for design.
Organizations’ credit risk reporting frameworks vary extensively across the industryOrganizations credit risk reporting frameworks vary extensively across the industry.
In some cases, organizations continue to rely upon more traditional forms of reporting to deliver management information to decision makers, including detailed reports, management summaries (such as Microsoft PowerPoint® presentations) and supporting analyses.
A growing number of leading practitioners have begun to leverage dashboards to summarize key measures of risk and A growing number of leading practitioners have begun to leverage dashboards to summarize key measures of risk and performance, augmented by more traditional reporting tools.
The most advanced institutions have embraced dashboards that communicate information both numerically and graphically, which are organized in a manner to facilitate interpretation, and contain layers of reporting designed to address the needs of different internal audiences.
In order to create a robust and scalable reporting and analytical platform for management reporting andmonitoring purposes, there are a number of basic tenets that form the basis of the design approach.
End user needs and expectations should form the basis for business requirements and design considerations.
Existing legacy system constraints must be considered, but should not limit the final target operating model.g g y y , g p g
Roll out of the system should be evolutionary (vs. “big bang”), with additional capabilities phased in over time.
Reporting capabilities should be designed to accommodate both on-screen dashboard views and traditional physical and electronic reports.
The level of detailed data imported into the repository may vary across data types but must be consistent with envisioned drillThe level of detailed data imported into the repository may vary across data types, but must be consistent with envisioned drilldown and scenario modeling needs and capabilities.
The envisioned solution should be structured to accommodate changes over time, as new needs and requirements are identified.
PwC8
A View from the Top:Credit Risk Management Dashboard Reporting for Financial Institutions
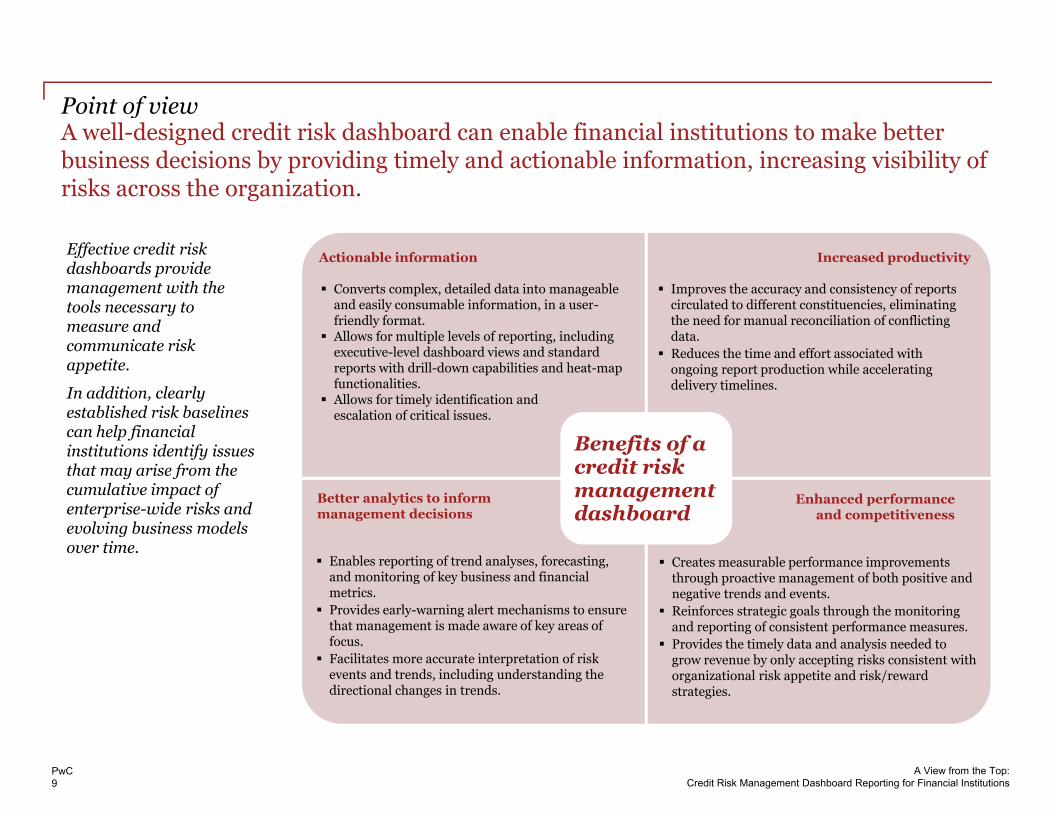
Point of viewPoint of viewA well-designed credit risk dashboard can enable financial institutions to make better business decisions by providing timely and actionable information, increasing visibility of risks across the organization.
Converts complex, detailed data into manageable and easily consumable information, in a user-
Improves the accuracy and consistency of reports circulated to different constituencies, eliminating
Actionable information Increased productivityEffective credit risk dashboards provide management with the tools necessary to and easily consumable information, in a user
friendly format. Allows for multiple levels of reporting, including executive-level dashboard views and standard reports with drill-down capabilities and heat-map functionalities. Allows for timely identification and
circulated to different constituencies, eliminating the need for manual reconciliation of conflicting data. Reduces the time and effort associated with ongoing report production while accelerating delivery timelines.
tools necessary to measure and communicate risk appetite.
In addition, clearly bli h d i k b li
Benefits of a credit risk management d hb d
escalation of critical issues.
Better analytics to inform Enhanced performance
established risk baselines can help financial institutions identify issues that may arise from the cumulative impact of
t i id i k d dashboard
Enables reporting of trend analyses, forecasting, and monitoring of key business and financial metrics.
Creates measurable performance improvements through proactive management of both positive and negative trends and events.
management decisionsp
and competitivenessenterprise-wide risks and evolving business models over time.
Provides early-warning alert mechanisms to ensure that management is made aware of key areas of focus.Facilitates more accurate interpretation of risk events and trends, including understanding the directional changes in trends.
Reinforces strategic goals through the monitoring and reporting of consistent performance measures.Provides the timely data and analysis needed to grow revenue by only accepting risks consistent with organizational risk appetite and risk/reward strategies.
PwC9
A View from the Top:Credit Risk Management Dashboard Reporting for Financial Institutions

Section 2Section 2
Competitive intelligence

Competitive intelligenceMany sophisticated financial institutions are advancing their capabilities to manage risk-centric information by embracing core dashboarding concepts.
Examples of what we see in the industry
Competitive intelligence
Examples of what we see in the industry
Core dashboarding concept Financial institution A Financial institution B Financial institution C
Infrastructure Implemented an integrated/ consolidated data mart to house all data
Leveraged quarterly and monthly reports to gather and consolidate historical data into centralized data repository implemented for
Leveraged existing processes to extract data from various sources and store in centralized data repository
repository, implemented for prospective data capture
Data management Developed a “customer run book” to organize and socialize key corporate definitions and terminology
Reconstructed historical data through the development of derivation rules comprised of available data points
Performed data gap analysis to identify alternate sources for historical and prospective data capture
M d di i I l t d h d it f D fi d t l d D fi d l di d l i k Measures and dimensions Implemented a shared repository for all standard metrics/measures, including definitions and calculations
Defined control measures and reporting formats at the enterprisewide level and at each business unit across geographic regions
Defined leading and lagging key performance indicators aggregated at the portfolio level and filtered to the product level
Reporting (storyboarding) Implemented solution to extract data Implemented a reporting tool with Implemented reporting tool with heat p g ( y g) pin meaningful chunks across key performance metrics
p p gdrill-down capabilities and heat map functionality
p p gmap capabilities that automatically update each time the underlying data change
Traceability Implemented solution to drill down from high-level data into customer-level details (accounts balances
Designed, piloted, and implemented solution to support roll-up and drill-down analysis of risk and controls
Designed one-time data entry point for data capture to enable the automated calculation of roll up and level details (accounts, balances,
activities)down analysis of risk and controls automated calculation of roll-up and
drill-down views
Policies and standards Streamlined corporate policies and procedures framework
Streamlined the business risk, compliance, and control reporting framework used globally across business units and at the corporate
Delivered standard credit risk management reporting framework used across the consumer lending and mortgage portfolio
PwC11
A View from the Top:Credit Risk Management Dashboard Reporting for Financial Institutions
level
Section 3Section 3
A framework for response
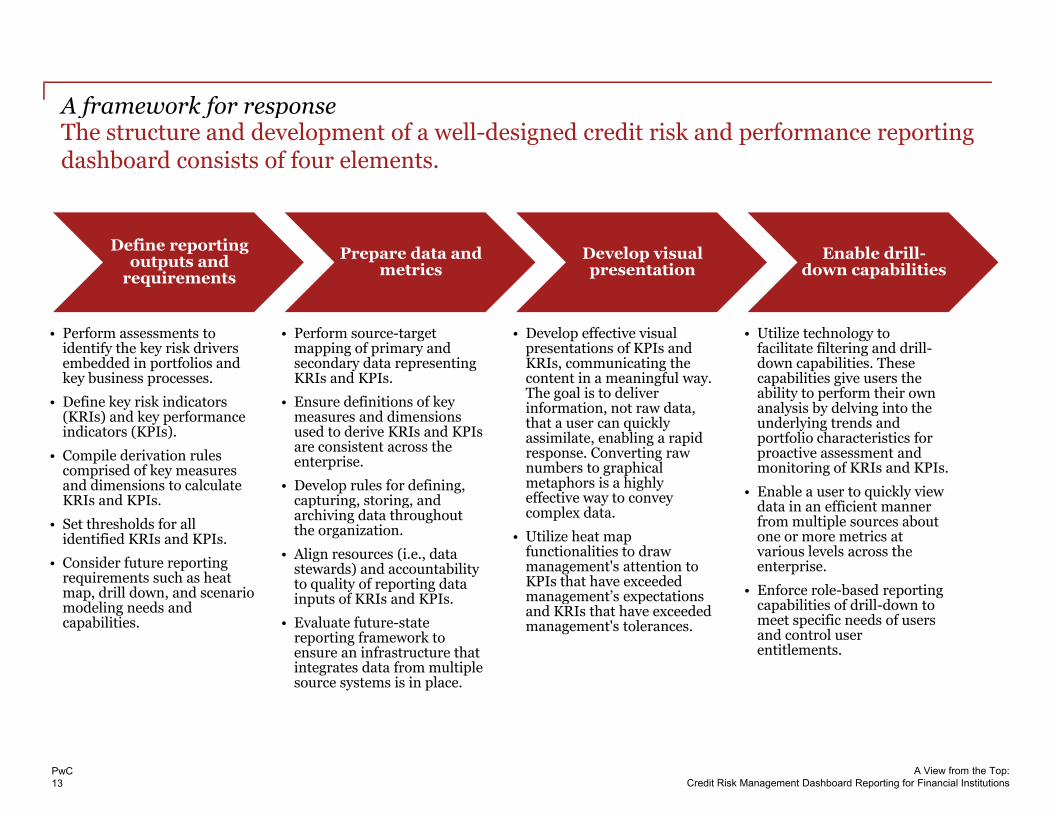
A framework for responseThe structure and development of a well-designed credit risk and performance reporting dashboard consists of four elements.
A framework for response
Define reporting outputs and
requirementsPrepare data and
metricsDevelop visual presentation
Enable drill-down capabilities
• Perform assessments to identify the key risk drivers embedded in portfolios and key business processes.
• Define key risk indicators
• Perform source-target mapping of primary and secondary data representing KRIs and KPIs.
• Ensure definitions of key
• Develop effective visual presentations of KPIs and KRIs, communicating the content in a meaningful way. The goal is to deliver information not raw data
• Utilize technology to facilitate filtering and drill-down capabilities. These capabilities give users the ability to perform their own analysis by delving into the e e ey s d ca o s
(KRIs) and key performance indicators (KPIs).
• Compile derivation rules comprised of key measures and dimensions to calculate KRIs and KPIs.
su e de o s o eymeasures and dimensions used to derive KRIs and KPIs are consistent across the enterprise.
• Develop rules for defining, capturing, storing, and
information, not raw data, that a user can quickly assimilate, enabling a rapid response. Converting raw numbers to graphical metaphors is a highly effective way to convey
analysis by delving into the underlying trends and portfolio characteristics for proactive assessment and monitoring of KRIs and KPIs.
• Enable a user to quickly view data in an efficient manner
• Set thresholds for all identified KRIs and KPIs.
• Consider future reporting requirements such as heat map, drill down, and scenario
d li d d
p g, g,archiving data throughout the organization.
• Align resources (i.e., data stewards) and accountability to quality of reporting data inputs of KRIs and KPIs.
y ycomplex data.
• Utilize heat map functionalities to draw management's attention to KPIs that have exceeded management’s expectations
data in an efficient manner from multiple sources about one or more metrics at various levels across the enterprise.
• Enforce role-based reporting capabilities of drill down to modeling needs and
capabilities.
p
• Evaluate future-state reporting framework to ensure an infrastructure that integrates data from multiple source systems is in place.
g pand KRIs that have exceeded management's tolerances.
capabilities of drill-down to meet specific needs of users and control user entitlements.
PwC13
A View from the Top:Credit Risk Management Dashboard Reporting for Financial Institutions

A framework for response— Linking risk and performance Well-designed dashboards support the identification of key risks and trends and the evaluation of root causes in order to draw linkages to key performance considerations.
A framework for response Linking risk and performance
When defining the desired dashboard reporting outputs, internal as well as external metrics should be considered.
Leading credit risk reporting suites incorporate common performance measures, such as growth, risk, return and external drivers (e.g., agency ratings, industry statistics). Report suites then apply the measures across g y p pp ythe credit risk management lifecycle, from acquisition to servicing and portfolio management to collections.
Reporting should organize and deliver information in a manner consistent with how management runs the business.
hb d h ld f f l k d d Ow
ned
ann
el
Au
die
nce
*
Ow
ned
nn
el
Au
die
nce
**
Growth
Dashboards should inform management of evolving risk trends andrelated performance issues from various stakeholder perspectives:
Internal stakeholders - Business owners and risk management will assess performance against policies, business plans, and longer-term strategic goals by business, product, and channel (e.g., economic capital, RAROC, EBITA, limits, and market penetration vs. risk profile). an
aged
vs.
O
Ch A
anag
ed v
s. O
Ch
an A
Risk*
Return*cap ta , OC, , ts, a d a et pe et at o vs. s p o e).External stakeholders - Shareholders, regulators, and analysts will focus on broader performance measures such as ROE, ROA, growth, and risk.
The end-state vision of a dashboard solution should not be dictated by existing data constraints.
d i i h d hb d id l ll i di
Ma
Ma
External Drivers
In designing the dashboard, consider longer-term as well as immediate requirements:
Fully articulate current and future reporting needs.Design an end-state solution that addresses all requirements, with phased delivery of functionality and content.Identify gaps in the currently available data.
*Basel II Embedded** Includes Corporate Risk, Executive Mgmt, Line of Business and Business Risk
PwC14
A View from the Top:Credit Risk Management Dashboard Reporting for Financial Institutions
y g p yPrioritize data needs.Design and implement processes to capture new data requirements.

A framework for response— Prepare data and metricsLeveraging credit risk management dashboard reporting as part of a data governance framework is essential to data management and the monitoring and remediation of data quality.
A framework for response Prepare data and metrics
Data management Data quality monitoring Data quality remediation
Consolidated enterprisewide credit data into a single, structured centralized data repository.Homogenize data into a single
Ensure supply chain is well equipped to manage large volumes and types of data through a ready response system of data quality checks.
Publish accurate and consistent data impacting organizational decisions enterprisewide.Agree to and present accurate and timely reporting of g g
enterprisewide view to ensure agreement and acceptance of data characteristics and usage.Enforce SPOT (single point of truth), via common data definitions metadata and
y q yDesign a scalable and repeatable process to standardize and update data, eliminate duplicate records, and create a single view of data.E l d d b i
and timely reporting of business drivers and metrics to key stakeholders, internally and externally.
definitions, metadata, and metric calculations.Enforce consistency and control in the ongoing maintenance and application of data usage enterprisewide h h d di d l d
Employ a data steward to be in charge of data quality to ensure alignment to standards and identification of issues for remediation.
through standardized tools and techniques.
Data go ernance frame ork
PwC15
A View from the Top:Credit Risk Management Dashboard Reporting for Financial Institutions
Data governance framework

A framework for response—Develop visual presentationA robust dashboard solution enables organizations to tailor credit risk reporting for individual audiences, allowing each audience to view relevant key risk indicators and drill down into the details as needed.
A framework for response Develop visual presentation
IllustrativeEnterprisewide risk dashboards are designed “top down” to highlight key areas of risk and avoid over-monitoring.avoid over monitoring.
Credit risk dashboards encompass multiple tiers.
Tier 1 reporting dashboards are designed to
Tier 1 Q3 05 Q4 05 Q1 06 Q2 06 Q3 06
Loan Outstandings ($ in Millions) NPL % NCO % EL % Product 1 7,247 8,052 7,943 7,849 7,800 0.49% 0.042% 3.0%Product 2 647 719 723 724 729 0.45% 0.032% 2.8%Product 3 2,418 2,686 2,859 2,999 1,857 0.37% 0.047% 2.9%Product 4 10,461 11,623 11,704 11,727 11,771 0.29% 0.024% 3.1%Product 5 2,246 2,495 2,511 2,565 2,701 0.33% 0.032% 2.5%Product 6 412 458 452 450 448 0.49% 0.047% 2.9%
Total Loan Outstandings 23 431 26 034 26 193 26 314 25 305
October, 2007Key Portfolio Metrics Tier 1 Q3 05 Q4 05 Q1 06 Q2 06 Q3 06
Loan Outstandings ($ in Millions) NPL % NCO % EL % Product 1 7,247 8,052 7,943 7,849 7,800 0.49% 0.042% 3.0%Product 2 647 719 723 724 729 0.45% 0.032% 2.8%Product 3 2,418 2,686 2,859 2,999 1,857 0.37% 0.047% 2.9%Product 4 10,461 11,623 11,704 11,727 11,771 0.29% 0.024% 3.1%Product 5 2,246 2,495 2,511 2,565 2,701 0.33% 0.032% 2.5%Product 6 412 458 452 450 448 0.49% 0.047% 2.9%
Total Loan Outstandings 23 431 26 034 26 193 26 314 25 305
October, 2007Key Portfolio Metrics
- Tier 1 reporting dashboards are designed to reflect the key business drivers, metrics, and risk budget components impacting organizational decision making at the executive level.Tier 2 reporting dashboards are the first layer
Tier 1 Q3 05 Q4 05 Q1 06 Q2 06 Q3 06
Loan Outstandings ($ in Millions) NPL % NCO % EL % Product 1 7,247 8,052 7,943 7,849 7,800 0.49% 0.042% 3.0%
October, 2007Key Portfolio Metrics Tier 1 Q3 05 Q4 05 Q1 06 Q2 06 Q3 06
Loan Outstandings ($ in Millions) NPL % NCO % EL % Product 1 7,247 8,052 7,943 7,849 7,800 0.49% 0.042% 3.0%
October, 2007Key Portfolio Metrics Tier 1 Q3 05 Q4 05 Q1 06 Q2 06 Q3 06
Loan Outstandings ($ in Millions) NPL % NCO % EL % Product 1 7,247 8,052 7,943 7,849 7,800 0.49% 0.042% 3.0%
October, 2007Key Portfolio Metrics
Total Loan Outstandings 23,431 26,034 26,193 26,314 25,305 Total Production Volume 1,184 1,316 1,208 1,561 1,297
Key Summary Measures ($ in Millions)Trend(YoY)
Actual to Tolerance
Actual to Target / Budget(YTD)
% 30+ DPD of O/S 2.4% 1.9% 1.6% 1.5% 1.5% Decreasing Favorable Neutral% 90+ DPD of O/S 0.48% 0.38% 0.33% 0.30% 0.30% Increasing Unfavorable WatchNon-Accrual % 0.31% 0.30% 0.31% 0.32% 0.31% Watch Unfavorable WatchNet Charge-Off Rate % 0.020% 0.012% 0.007% 0.016% 0.021% Increasing Unfavorable Watch% NPA 0.31% 0.30% 0.31% 0.32% 0.31% Increasing Unfavorable% O/S LTV < 80% (RE Secured) 73% 74% 73% 71% 71% Neutral NeutralExpected Loss % 2.95% 2.97% 2.97% 2.98% 2.97% Watch Neutral Neutral
Total Loan Outstandings 23,431 26,034 26,193 26,314 25,305Total Production Volume 1,184 1,316 1,208 1,561 1,297
Key Summary Measures ($ in Millions)Trend(YoY)
Actual to Tolerance
Actual to Target / Budget(YTD)
% 30+ DPD of O/S 2.4% 1.9% 1.6% 1.5% 1.5% Decreasing Favorable Neutral% 90+ DPD of O/S 0.48% 0.38% 0.33% 0.30% 0.30% Increasing Unfavorable WatchNon-Accrual % 0.31% 0.30% 0.31% 0.32% 0.31% Watch Unfavorable WatchNet Charge-Off Rate % 0.020% 0.012% 0.007% 0.016% 0.021% Increasing Unfavorable Watch% NPA 0.31% 0.30% 0.31% 0.32% 0.31% Increasing Unfavorable% O/S LTV < 80% (RE Secured) 73% 74% 73% 71% 71% Neutral NeutralExpected Loss % 2.95% 2.97% 2.97% 2.98% 2.97% Watch Neutral Neutral
- Tier 2 reporting dashboards are the first layer of drill-down into specific portfolios, bringing tabular and graphical data together around KPIs, KRIs, and risk budget components in a dashboard view to focus attention on relevant issues.
Product 2 647 719 723 724 729 0.45% 0.032% 2.8%Product 3 2,418 2,686 2,859 2,999 1,857 0.37% 0.047% 2.9%Product 4 10,461 11,623 11,704 11,727 11,771 0.29% 0.024% 3.1%Product 5 2,246 2,495 2,511 2,565 2,701 0.33% 0.032% 2.5%Product 6 412 458 452 450 448 0.49% 0.047% 2.9%
Total Loan Outstandings 23,431 26,034 26,193 26,314 25,305 Total Production Volume 1,184 1,316 1,208 1,561 1,297
Key Summary Measures ($ in Millions)Trend(YoY)
Actual to Tolerance
Actual to Target / Budget(YTD)
% 30+ DPD of O/S 2.4% 1.9% 1.6% 1.5% 1.5% Decreasing Favorable Neutral% 90+ DPD of O/S 0.48% 0.38% 0.33% 0.30% 0.30% Increasing Unfavorable WatchNon-Accrual % 0.31% 0.30% 0.31% 0.32% 0.31% Watch Unfavorable WatchNet Charge-Off Rate % 0.020% 0.012% 0.007% 0.016% 0.021% Increasing Unfavorable Watch% NPA 0.31% 0.30% 0.31% 0.32% 0.31% Increasing Unfavorable% O/S LTV < 80% (RE Secured) 73% 74% 73% 71% 71% Neutral NeutralExpected Loss % 2.95% 2.97% 2.97% 2.98% 2.97% Watch Neutral Neutral
Credit risk standard reports provide graphs and tables designed to facilitate analysis at more granular levels, to improve, diagnose, and
PwC16
A View from the Top:Credit Risk Management Dashboard Reporting for Financial Institutions
g p gevaluate the drivers of trends.

A framework for response—Develop visual presentationThe design of the credit risk management dashboard should reflect the requirements of all end users to provide meaningful, actionable information that can be assimilated quickly.
A framework for response Develop visual presentation
Several key success factors should be considered in the design process.
Reporting should reflect the unique risk drivers and characteristics of the business. Data should be synthesized in a manner that focuses attention on the key messages underlying the numbers.Reporting should be timely to be valuable
Visuals should:
Leverage a tiered model enabling a series of management, operational and functional views that drive Reporting should be timely to be valuable.
Reports should be tailored to accommodate the specific needs of each user group. Visual tools (such as heat maps) accentuate KPIs and KRIs that warrant further attention, such as heat maps highlighting metrics and directional changes in trends outside of management’s tolerances.
functional views that drive decision making.
Enable easy navigation for all levels of management and functional staff to effectively
Customizing the CRM dashboard helps ensure relevance to the end user.
The level of customization will depend on:– Target audience – Anticipated reporting needs
use the technology.
Look and feel are a function of the client need, corporate culture and related business investment in technology.
– Complexities of the organization and its product offeringsKey requirements for customization: – Understand and capture the business drivers and decision criteria of each
audience– Identify and capture leading and lagging indicators related to business drivers
gy
Layouts should be tailored to maximize visual impact through graphical use including items such as tables, charts, speedometers and traffic y p g gg g
– Deliver the information in a manner that facilitates analysis and decision making speedometers, and traffic signals.
PwC17
A View from the Top:Credit Risk Management Dashboard Reporting for Financial Institutions
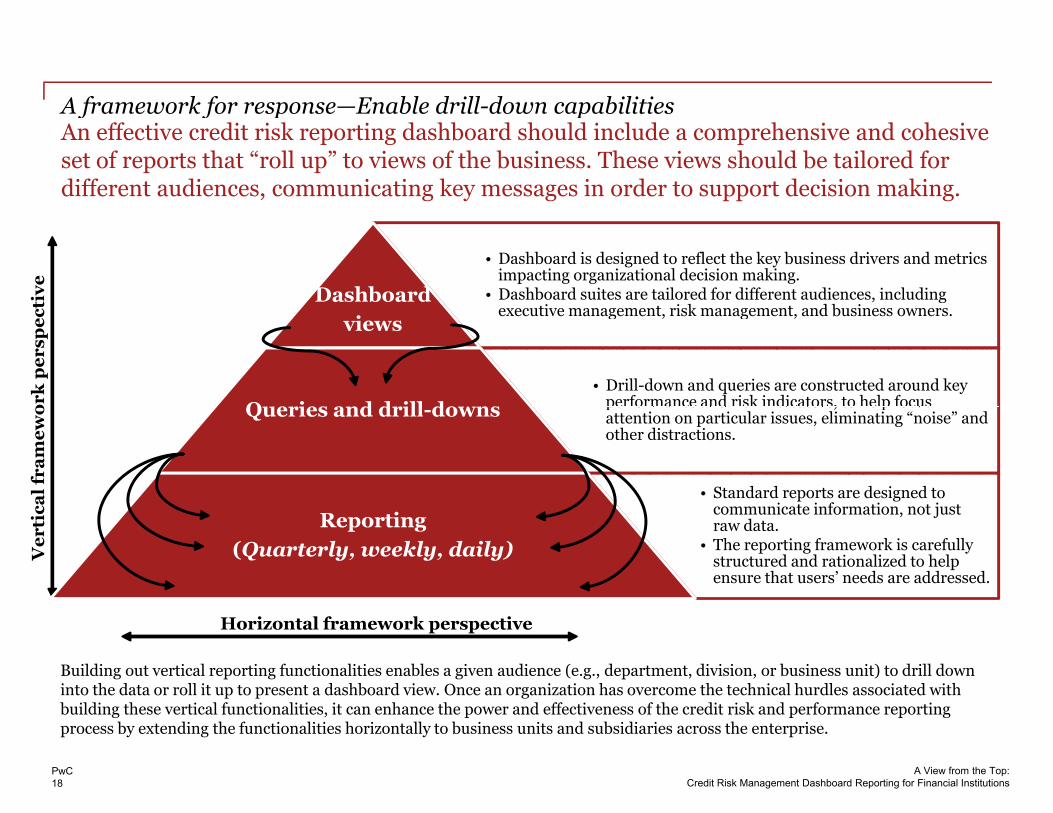
A framework for response—Enable drill-down capabilitiesAn effective credit risk reporting dashboard should include a comprehensive and cohesive set of reports that “roll up” to views of the business. These views should be tailored for different audiences, communicating key messages in order to support decision making.
A framework for response Enable drill down capabilities
tive
• Dashboard is designed to reflect the key business drivers and metrics impacting organizational decision making.
• Dashboard suites are tailored for different audiences, including e ec ti e management risk management and b siness o ners
Dashboard
Dashboard
ork
per
spec
t executive management, risk management, and business owners.views
• Drill-down and queries are constructed around key performance and risk indicators, to help focus Queries and drill downs
Queries & Drill Downs
cal f
ram
ewo performance and risk indicators, to help focus
attention on particular issues, eliminating “noise” and other distractions.
Queries and drill-downs
• Standard reports are designed to i t i f ti t j t
Ver
tic communicate information, not just
raw data.• The reporting framework is carefully
structured and rationalized to help ensure that users’ needs are addressed.
Reporting (Quarterly, weekly, daily)
Building out vertical reporting functionalities enables a given audience (e.g., department, division, or business unit) to drill down into the data or roll it up to present a dashboard view. Once an organization has overcome the technical hurdles associated withb ildi h i l f i li i i h h d ff i f h di i k d f i
Horizontal framework perspective
PwC18
A View from the Top:Credit Risk Management Dashboard Reporting for Financial Institutions
building these vertical functionalities, it can enhance the power and effectiveness of the credit risk and performance reportingprocess by extending the functionalities horizontally to business units and subsidiaries across the enterprise.
Section 4 Section 4
How PwC can help

How PwC can helpHow PwC can helpCore competencies—Credit risk management
Credit risk Identify risk areasCredit risk dashboard design
Identify risk areas.Design and help implement a more transparent and actionable dashboard reporting framework, including creating mock-up examples of key performance indicators and report pages. Design considerations include target audiences, information needs, tiered levels of reporting detail, and delivery frequency and medium.Test mock up examples with key stakeholders to validate and refine the conceptual designTest mock-up examples with key stakeholders to validate and refine the conceptual design.Tailor credit risk management dashboard reporting frameworks to address specific business objectives and risk drivers to deliver meaningful content.Construct key performance indicators to provide additional detail on the drivers behind each of the risk areas.
Technology selection and implementation
Assist with assessment and selection of reporting and dashboard vendor solutions, including software, hardware, and networking components, through implementation.
Credit risk Help implement enterprisewide credit and market risk management systems.dashboard implementation
p p p g ySupport the critical aspects of business intelligence, enterprise risk management, and data management that underlie successful management reporting.
Data governance Establish enterprise data standards, definitions, and business rules.Design data governance functional responsibilities and processes.Design data governance functional responsibilities and processes.
Data integrity and cleansing
Identify root causes of data integrity issues.Design enhanced process to improve data quality and integrity at the source.Provide resources and tools to assist with data cleansing.
PwC20
A View from the Top:Credit Risk Management Dashboard Reporting for Financial Institutions

How PwC can helpHow PwC can helpPwC is distinguished by the depth and breadth of its professionals
Experience SpecialistsExperience
Our teams have significant experience in credit risk management dashboard reporting.
We have leveraged our credit risk management experience across financial services to assist clients in designing and
Specialists
The core members of PwC’s credit risk management practice have served in various capacities at leading banks and financial services companies, providing us with unique perspectives and insights into credit risk management practices.
across financial services to assist clients in designing and implementing a more transparent and actionable dashboard reporting framework.
We have established formal networks of technology partners to support the critical aspects of business intelligence, enterprise risk management and data management that underlie
We have advised many of the largest financial services companies in credit risk management issues, including risk management technology, data management, and reporting for banks, investment banks, and hedge funds.
Each of our senior team members has more than 25 years of risk management, and data management that underlie successful management reporting.
We stay on the forefront of industry issues, developing thought leadership on operational implications and solutions, and gathering intelligence on best practices (e.g., addressing
i t d i b SOP 03 3 141R th FASB d IFRS
Each of our senior team members has more than 25 years of experience in consulting and industry risk management. Many have held senior level positions, spanning across traditional financial services organizations, as well as energy/utility companies, credit card companies, commercial leasing companies, commercial factors, and asset-based lenders.
requirements driven by SOP 03-3, 141R, or the FASB and IFRS Financial Instruments impairment and measurement exposure drafts).
PwC has worked with clients to tailor credit risk management dashboard reporting frameworks to address specific business
bj i d i k d i d li i f l
p
Our credit risk practitioners are experienced in all facets of credit risk management, including credit and lending origination and approval process design, portfolio management methodologies and processes, credit risk management metrics and reporting, credit risk identification and measurement tools
objectives and risk drivers to deliver meaningful content.
Our approach to visual reporting is designed to effectively convert significant volumes of complex, raw data into concise, manageable and actionable information and to deliver that information in easily consumable formats.
p g,and methodologies, special assets management, credit review processes, data quality, and Basel II/III.
Many of our team members also have financial technology and operations experience, covering trading systems, investment banking, asset management, mergers, integration, and risk.
PwC21
A View from the Top:Credit Risk Management Dashboard Reporting for Financial Institutions
banking, asset management, mergers, integration, and risk.

How PwC can helpHow PwC can helpOur Financial Services Advisory practice
PwC is an advisor to 44 of the world’s top 50 banks and 46 of the world’s top 50 insurance companies and is the leading servicePwC is an advisor to 44 of the world s top 50 banks and 46 of the world s top 50 insurance companies, and is the leading serviceprovider to investment managers, pension funds, and hedge funds around the world. This diverse client base provides us with unique access to develop peer insights and to understand from experience what works in specific client circumstances. In the United States alone, we are able to call upon our 800-person Financial Services Advisory practice and more than 3,000 financial services professionals.
Accountability and cost
ff i
Our approach to serving our clients provides them with a single point of accountability, which creates an efficient and effective day-to-day working arrangement and, most importantly, best positions our clients for success. We have significant experience in helping to drive complex programs, and believe
effectiveness
We offer a truly independent view, without prejudice or favor regarding specific vendors, solutions, or
that we can work successfully in a cost-effective manner to meet your organization’s needs and objectives.
Trusted brand approaches. We approach each situation and develop the most appropriate solutions depending upon the client’s individual circumstances.
Global footprintPwC’s global footprint benefits clients in terms of consistent service delivery and quality by taking advantage of the best ideas, resources, and solutions from around the world.
PwC22
A View from the Top:Credit Risk Management Dashboard Reporting for Financial Institutions

How PwC can helpClient needs and issuesHow PwC can help
We look across the entire organization—focusing on strategy, structure, people, process, and technology—to help our clients improve business processes, transform organizations, and implement technologies needed to run the business.
Client needs Issues we help clients address
Build effective organizations
Rethinking strategy in terms of markets, geographies, channels, and clientsRestructuring organizational models in terms of structures, policies, and rolesE bli hi ff i i i d Establishing effective strategic sourcing and procurementRealizing competitive advantage through effective sales operations inventory planningTransforming the close and consolidation process to work for rather than against you
Manage risk, regulation, and financial reporting
Building a risk-resilient organizationManaging ERP investment and project execution riskSafeguarding the currency of business; keeping sensitive data out of the wrong hands
Manage risk, regulation, and
financial Build Affirming capital project governance and accountabilityAssessing and mitigating corruption risk in your global business operationsAccounting and financial reportingThird-party assuranceTaxation
Reduce costs Driving efficiency through shared services
financial reporting
dInnovate
effective organizations
Clientneedsg y g
Redesigning finance to realize efficiency and competitive advantage Taking control of cost through effective spend management and cash forecasting practicesDriving sustainable cost reduction
Leverage talent Defining and implementing an effective HR organizationRethinking pivotal talent
Reducecosts
Leverage
Innovate and grow profitably
needs
Rethinking pivotal talent
Innovate and grow profitably
Reshaping the IT function into a source of innovationTransforming business information to drive insight and fact-based decision makingEvaluating acquisition and divestiture strategies to position for the futureRealizing deal synergy and valueDeveloping sustainability programs that add value
Leverage talent
PwC23
A View from the Top:Credit Risk Management Dashboard Reporting for Financial Institutions

How PwC can helpHow PwC can helpFor further information, please contact:
Scott DillmanN Y k
[email protected] +1 646 471 5764
AmericasNew York +1 646 471 5764
Michael ShearerNew York
[email protected] +1 646 471 5035
Jonathan Riva New York
[email protected] +1 646 471 5668New York +1 646 471 5668
Steve JosephthalCharlotte
[email protected]+1 704 344 7864
Kunal MehtaNew York
[email protected]+1 973 236 4362
George Stylianides London
[email protected]+ 44 (0) 20 7804 3364
Symon Dawson London
[email protected]+ 44 (0) 20 7804 1225
EMEA
Denis BavayBrussels
[email protected]+ 32 2 710 7104
James ChangBeijing
[email protected]+ 86 (10) 6533 2755
AsiaPac
Rick HeathcoteHong Kong
[email protected]+ (852) 2289 1155
PwC24
A View from the Top:Credit Risk Management Dashboard Reporting for Financial Institutions

AppendixAppendix
Select qualifications

Select qualificationsSelect qualificationsCredit risk management strategic reporting dashboard framework—Top-10 financial institution
Issues The credit risk and collections reporting packages of a top 10 financial institution were comprehensive and Issues The credit risk and collections reporting packages of a top-10 financial institution were comprehensive and detailed, but key messages were being diluted because there was no visibility into the trends underlying the data. The bank engaged PwC to assist in developing requirements for a credit risk and performance dashboard and reporting framework. A key objective was to provide accurate and timely risk and return information to support decision making by executives in credit risk management, finance, and the lines of business.
Approach The PwC team designed an overall reporting framework and developed mock-up examples of key performance indicators and report pages. Once the straw man was in place, the team interviewed key stakeholders to validate and refine the conceptual design.
As a second phase of the engagement, PwC assisted the client in developing a gap analysis to compare data requirements for the reporting framework to current data availability The client then developed a short-term requirements for the reporting framework to current data availability. The client then developed a short term tactical plan to implement the reporting framework based upon current data availability and launched a longer-term initiative to expand data availability to facilitate the full reporting suite. The final deliverables included:
Complete credit risk and performance dashboard and reporting framework, including target audiences, information needs tiered levels of reporting detail and delivery frequency and mediuminformation needs, tiered levels of reporting detail, and delivery frequency and medium.Mock-up of dashboard templates for the mortgage and consumer portfolio to present information at meaningful levels of aggregation.Detailed outline of business requirements, including report descriptions and purpose, metric calculations, target audience, and data required. PwC also developed an interim solution that allowed for the framework to be immediately operationalizedto be immediately operationalized.
Benefits As a result of the initiative, the bank was able to improve the quality of its credit risk management and collection reporting immediately, facilitating better identification of risks that could impact short- and long-term performance. The framework also allowed the bank to communicate more effectively using a fresh, action-oriented, visual approach to reporting and analysis, with the goal of focusing management’s attention
PwC26
A View from the Top:Credit Risk Management Dashboard Reporting for Financial Institutions
on key business levers for mitigating risk and enhancing revenue.

Select qualificationsSelect qualificationsEnterprise performance and risk reporting enhancement initiative—Global financial institution
Issues A global banking institution was prompted by regulators to enhance its reporting standards The bank had a Issues A global banking institution was prompted by regulators to enhance its reporting standards. The bank had a manually intensive process in place for aggregating, analyzing, and reporting performance and risk information across the enterprise to senior management. The regulators conveyed their expectations for the bank to enhance the timeliness and accuracy of reporting, and to expand its scope to include benchmarking based on industry metrics and more analysis across operating entities. PwC was engaged to advise the bank on how to enhance and align the organization’s risk and performance reporting framework to meet regulatory how to enhance and align the organization s risk and performance reporting framework to meet regulatory expectations and standard industry practices.
Approach PwC assisted with the design, development, and implementation of a risk and performance reporting pilot for the organization. Working alongside the client to identify the pilot population of entities, PwC helped to outline a streamlined approach for establishing an effective and efficient reporting framework across all operating entities. The approach consisted of (1) a current-state assessment of the pilot entities to identify gaps in existing reporting framework based on regulators expectations and (2) leveraging the current-state gap analysis, design of the future-state reporting framework with integrated data housing facility coupled with a controlled framework to assess, evaluate, and make appropriate decisions based on the data. PwC facilitated the development and implementation of the reporting framework. We also assisted the institution with
i h h d d i i d d li i lid d dassessing whether unused reports were decommissioned, duplicative reports were consolidated, and regulatory requirements were met throughout the development and implementation of the reporting framework. PwC provided the institution with a roadmap outlining a timeline tied to key activities for implementing the framework across all reporting entities.
Benefits As a result of this initiative, the client was able to provide more timely and accurate performance and risk data Benefits As a result of this initiative, the client was able to provide more timely and accurate performance and risk data to the board and executive management, enabling more effective oversight and more timely decision making. By distributing aggregated information and analysis, the bank also enhanced and shared its knowledge across all operating entities.
Having a sound performance and risk reporting framework in place improved the client’s strategic decision making as well as planning monitoring and evaluation processes Finally as a result of the initiative the
PwC27
A View from the Top:Credit Risk Management Dashboard Reporting for Financial Institutions
making as well as planning, monitoring, and evaluation processes. Finally, as a result of the initiative, the client developed a strong case to present to regulators that their expectations are being met.
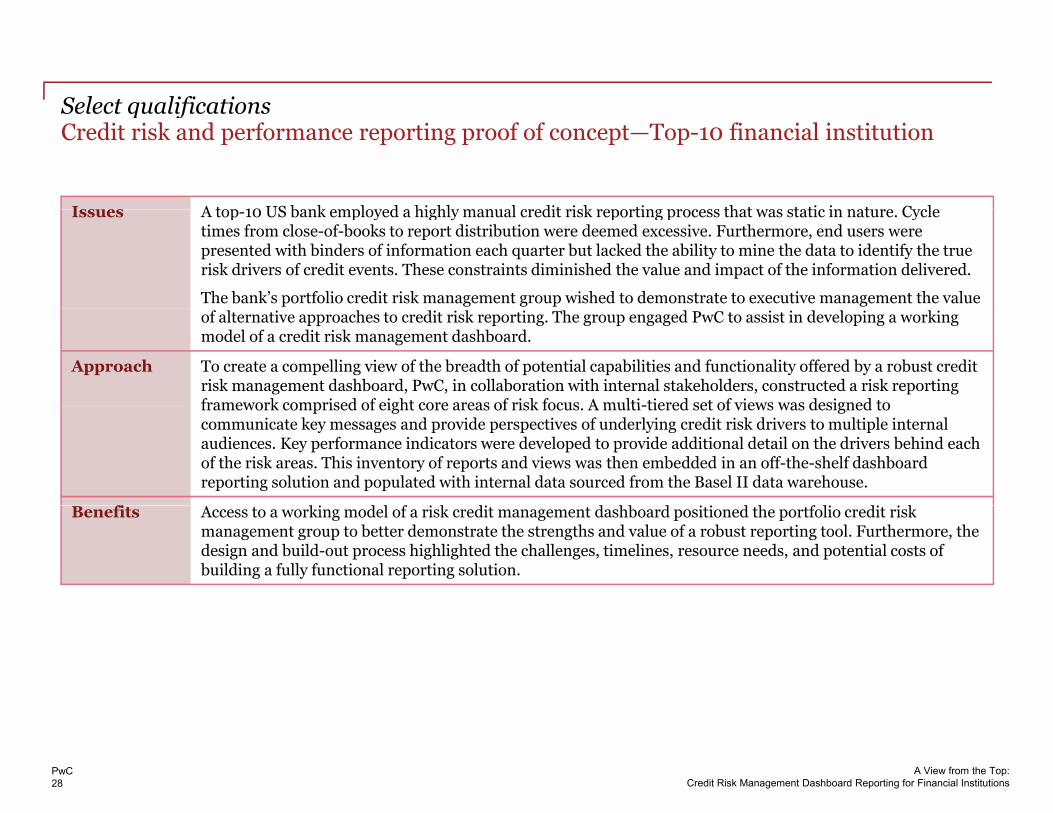
Select qualificationsSelect qualificationsCredit risk and performance reporting proof of concept—Top-10 financial institution
Issues A top 10 US bank employed a highly manual credit risk reporting process that was static in nature Cycle Issues A top-10 US bank employed a highly manual credit risk reporting process that was static in nature. Cycle times from close-of-books to report distribution were deemed excessive. Furthermore, end users were presented with binders of information each quarter but lacked the ability to mine the data to identify the true risk drivers of credit events. These constraints diminished the value and impact of the information delivered.
The bank’s portfolio credit risk management group wished to demonstrate to executive management the value of alternative approaches to credit risk reporting. The group engaged PwC to assist in developing a working model of a credit risk management dashboard.
Approach To create a compelling view of the breadth of potential capabilities and functionality offered by a robust credit risk management dashboard, PwC, in collaboration with internal stakeholders, constructed a risk reporting framework comprised of eight core areas of risk focus A multi-tiered set of views was designed to framework comprised of eight core areas of risk focus. A multi tiered set of views was designed to communicate key messages and provide perspectives of underlying credit risk drivers to multiple internal audiences. Key performance indicators were developed to provide additional detail on the drivers behind each of the risk areas. This inventory of reports and views was then embedded in an off-the-shelf dashboard reporting solution and populated with internal data sourced from the Basel II data warehouse.
fi ki d l f i k di d hb d i i d h f li di i kBenefits Access to a working model of a risk credit management dashboard positioned the portfolio credit risk management group to better demonstrate the strengths and value of a robust reporting tool. Furthermore, the design and build-out process highlighted the challenges, timelines, resource needs, and potential costs of building a fully functional reporting solution.
PwC28
A View from the Top:Credit Risk Management Dashboard Reporting for Financial Institutions
www.pwc.com
“A Vi f th T C dit Ri k M t D hb d R ti f Fi i l
© 2011 PwC. All rights reserved. "PwC" and "PwC US" refer to PricewaterhouseCoopers LLP, a Delaware limited liability partnership, which is a member firm of PricewaterhouseCoopers International Limited each member firm of which is a separate legal entity This document is
“A View from the Top: Credit Risk Management Dashboard Reporting for Financial Institutions,” PwC FS Viewpoint, July 2011. www.pwc.com/fsi
International Limited, each member firm of which is a separate legal entity. This document is for general information purposes only, and should not be used as a substitute for consultation with professional advisors.