Embed Size (px)
Citation preview
AFIT/GOR/ENS/99M-16
A VALUE FOCUSED APPROACH TO DETERMINING THE TOP TEN HAZARDS IN ARMY AVIATION
Brian K. Sperling
AFIT/GOR/ENS/99M-16
Approved for public release; distribution unlimited
AFIT/GOR/ENS/99M-16
A VALUE FOCUSED APPROACH TO DETERMINING
THE TOP TEN HAZARDS IN ARMY AVIATION
THESIS
Presented to the Faculty of the Graduate School of Engineering of the
Air Force Institute of Technology
Air University
In Partial Fulfillment of the
Requirements for the Degree of
Master of Science in Operations Research
Brian K. Sperling
March 1999
Approved for public release; distribution unlimited
THESIS APPROVAL
STUDENT: Brian K. Sperling CLASS: GOR-99M
THESIS TITLE: A Value Focused Approach to Determining the Top Ten Hazards in Army Aviation
DEFENSE DATE: 25 February 1999
THESIS GRADE: _____________
COMMITTEE: NAME/TITLE/DEPARTMENT SIGNATURE
Advisor Jack M. Kloeber Jr., Lieutenant Colonel, USA Assistant Professor of Operations Research Department of Operational Sciences _____________
Reader Richard F. Deckro, DBA Professor of Operations Research Department of Operational Sciences _____________
Acknowledgments
I would like to express my sincere gratitude to my faculty advisor LTC Jack
Kloeber. This effort would not have been possible without his patience and guidance. I
would also like to thank my reader; Dr. Richard Deckro who always tried to keep me
focused on my overall goal. Their insight and enthusiasm for this project was definitely
appreciated.
In addition I would like to thank the entire Chain of Command at the U. S. Army
Safety Center, particularly the Operations Research and Systems Analysis/Statistics
Division. Their support for this undertaking was instrumental throughout the entire
project.
Most importantly I want to thank my wife, JoAnna, and my son, Joshua. Without
the emotional support that they provided at home this would have been a much more
difficult and less enjoyable project. They were always there for me and I thank them
from the bottom of my heart.
ii
Table of Contents
Acknowledgments...............................................................................................................iiList of Figures......................................................................................................................vList of Tables.....................................................................................................................viiAbstract.............................................................................................................................viii1 Introduction ..............................................................................................1-11.1 General Issue ............................................................................................1-11.2 Background ..............................................................................................1-31.3 Problem Statement....................................................................................1-51.4 Research Objectives..................................................................................1-51.5 Research Approach ...................................................................................1-51.6 Scope of Problem......................................................................................1-61.7 Overview ..................................................................................................1-72 Literature Review .....................................................................................2-12.1 Introduction ..............................................................................................2-12.2 Decision Analysis .....................................................................................2-12.3 Value Focused Thinking ...........................................................................2-32.4 Multiattribute Preference Theory ..............................................................2-72.5 Value Focused Thinking Application in Current Literature .......................2-83 Methodology.............................................................................................3-13.1 Introduction ..............................................................................................3-13.2 Accident Model Value Hierarchy ..............................................................3-33.3 Evaluation Measures .................................................................................3-63.3.1 Degree of injury or illness:........................................................................3-73.3.2 Loss of or damage to equipment or property: ..........................................3-103.3.3 Environmental Damage...........................................................................3-113.3.4 Other Mission-Impairing Factors ............................................................3-123.4 Single Dimensional Value Functions.......................................................3-163.4.1 Degree of injury or illness:......................................................................3-163.4.2 Loss of or damage to equipment or property ...........................................3-203.4.3 Environmental Damage...........................................................................3-213.4.4 Other Mission Impairing Factors (Unit Readiness):.................................3-223.5 Assessing Weights ..................................................................................3-263.6 Converting Value (Severity) to Utility (Severity[U])...............................3-313.7 Establishing Accident Risk .....................................................................3-343.8 Hazard to Accident Association ..............................................................3-353.9 Summary ................................................................................................3-364 Results and Analysis .................................................................................4-14.1 Introduction ..............................................................................................4-14.2 Accident Severity......................................................................................4-14.2.1 Degree of Injury/Illness Sensitivity ...........................................................4-84.2.2 Property/Equipment Damage Sensitivity .................................................4-104.2.3 Environmental Weight Sensitivity...........................................................4-114.2.4 Other Mission Factors Sensitivity............................................................4-114.3 Accident Risk Ranking ...........................................................................4-12
iii

4.4 Hazard Severity Ranking ........................................................................4-144.4.1 Sensitivity of Criteria Weights on Hazard Severity..................................4-194.5 Hazard Risk Ranking ..............................................................................4-204.6 Summary ................................................................................................4-235 Conclusions and Recommendations ..........................................................5-15.1 Conclusions ..............................................................................................5-15.2 Recommendations.....................................................................................5-35.2.1 Value Functions ........................................................................................5-35.2.2 Data Collection .........................................................................................5-45.2.3 Environmental Data ..................................................................................5-55.2.4 Hazards and Controls ................................................................................5-65.3 Contributions ............................................................................................5-7
Appendicies:Appendix A: Accident and Hazard Codes......................................................................A-1Appendix B: Glossary of Safety Related Terms.............................................................B-1Appendix C: Accident Classification and Investigations...............................................C-1Appendix D: Initial Data Set..........................................................................................D-1Appendix E: Probabilities and Hazard Severity Calculations.........................................E-1Appendix F: Measure Scores..........................................................................................F-1Appendix G: Criteria Scores...........................................................................................G-1Appendix H: Sensitivity analysis Graphs.......................................................................H-1
Bibliography.................................................................................................................Bib-1
iv

List of Figures
Figure 2-1 A Decision Analysis Process Flowchart (Clemen, 1996: 6)....................2-2Figure 2-2 Value Hierarchy (Kloeber, Parnell: VFT Brief).......................................2-4Figure 3-1 Top Level Criteria of Value Hierarchy ...................................................3-6Figure 3-5-1 Criteria: Degree of Injury or Illness ........................................................3-7Figure 3-3 Criteria: Loss/Damage to Equipment/Property......................................3-10Figure 3-4 Criteria: Environmental Damage............................................................3-11Figure 3-5 Criteria: Other Mission Impairing Factors.............................................3-12Figure 3-6 SDVF: Lives Lost...................................................................................3-17Figure 3-7 SDVF: Partial Disabilities......................................................................3-18Figure 3-8 SDVF: Total Disabilities........................................................................3-18Figure 3-9 SDVF: Days Hospitalized......................................................................3-19Figure 3-10 SDVF: Injury Dollars.............................................................................3-20Figure 3-11 SDVF: Repair/Replace Dollars..............................................................3-21Figure 3-12 SDVF: Fluid Spills.................................................................................3-21Figure 3-13 SDVF: Restricted Duty..........................................................................3-22Figure 3-14 SDVF: Lost Workdays...........................................................................3-23Figure 3-15 SDVF: Man-hours to Repair..................................................................3-24Figure 3-16 SDVF: Total Loss...................................................................................3-24Figure 3-17 Complete Hierarchy...............................................................................3-25Figure 3-18 Relative Weight Assessment..................................................................3-28Figure 3-19 First Tier Weights...................................................................................3-28Figure 3-20 Weights: Degree Injury/Illness...............................................................3-29Figure 3-21 Weights: Damage to Property or Environment......................................3-29Figure 3-22 Weights: Other Mission Impairing Factors...........................................3-29Figure 3-23 Weights: Global......................................................................................3-30Figure 3-24 Utility: Damage Cost..............................................................................3-33Figure 3-25 Utility: Man-hours to Repair..................................................................3-33Figure 3-26 Utility: Injury Cost..................................................................................3-34Figure 3-27 Methodology Framework........................................................................3-37Figure 4-1 Accident Severity Chart............................................................................4-2Figure 4-2 Accident Severity Composition................................................................4-5Figure 4-3 Correlation Regression.............................................................................4-7Figure 4-4 Accident Sensitivity: Injury Weight.........................................................4-9Figure 4-5 Accident Sensitivity: Property Damage Weight.....................................4-10Figure 4-6 Accident Sensitivity: Environmental Weight.........................................4-12Figure 4-7 Accident Sensitivity: Mission Factors Weight.......................................4-14Figure 4-8 Accident Severity versus Probability.....................................................4-16Figure 4-9 Expected Hazard Severity......................................................................4-15Figure 4-10 Hazard Sensitivity: Injury Weight..........................................................4-19Figure 4-11 Hazard Severity versus Probability........................................................4-21Figure 4-12 Hazard Risk Ranking..............................................................................4-22Figure 4-13 Hazard Categories..................................................................................4-22Figure 5-1 Environmental Damage Data...................................................................5-5
v

Figure H-1 Accident Sensitivity: Injury Weight............................................................H-1Figure H-2 Accident Sensitivity: Property Damage Weight..........................................H-1Figure H-3 Accident Sensitivity: Environment Weight.................................................H-2Figure H-4 Accident Sensitivity: Other Mission Factors Weight..................................H-2Figure H-5 Hazard Sensitivity: Injury Weight...............................................................H-3Figure H-6 Hazard Sensitivity: Property Damage Weight.............................................H-3Figure H-7 Hazard Sensitivity: Environment Weight....................................................H-4Figure H-8 Hazard Sensitivity: Other Mission Factors Weight.....................................H-4
vi
List of Tables
Table 2-1 NASA's Objectives...................................................................................2-9Table 3-1 Lottery Questions....................................................................................3-32Table 3-2 Certainty Equivilant ................................................................................3-32Table 4-1 Accident Severity Scores ..........................................................................4-3Table 4-2 Accident Severity (Top 13) .......................................................................4-6Table 4-3 Accident Risk Ranking ...........................................................................4-13Table 4-4 Expected Hazard Scores..........................................................................4-17Table 4-5 Accident/Hazard Relationship.................................................................4-18Table 4-6 Hazard Risk................................................................................................4-20Table 4-7 Hazard Categories...................................................................................4-23Table 5-1 Top Ten Hazards.......................................................................................5-2
vii

Abstract
The United States Army Safety Center is challenged with identifying the top ten
most severe hazards in Army Aviation. This research utilizes value-focused thinking and
multiattribute preference theory concepts to produce a decision analysis model designed
to aid decision-makers in their analysis process. The severity model is based on the
Army's Risk Management doctrinal manual and has been tailored specifically for aviation
related accidents and hazards. The model determines the severity and risk ranking for 65
categories of accidents and 24 existing hazards. A sensitivity analysis is conducted to
examine the effects of variations in the weights of the top-level criteria for accident and
hazard severity. Recommendations are presented for ways to use the information
contained in this report to assist in developing risk reduction controls focused on force
protection. The model provides the decision-makers with a decision analysis
methodology that is consistent with Army doctrine and the values of the current chain of
command at the Army Safety Center. Furthermore the model can be adjusted for
different leadership levels or situations.
viii
A VALUE FOCUSED APPROACH TO DETERMINING
THE TOP TEN HAZARDS IN ARMY AVIATION
1 Introduction
1.1 General Issue
Everyday as we respond to the nation's needs, we expose our soldiers to hazards in uncertain and complex environments. We do this with the full knowledge that there are inherent risks associated with any military operation. The nature of our profession will not allow for either complacency or a cavalier acceptance of risk.
General Dennis J. Reimer Chief of Staff, Army
Over the years Army aviation has evolved tremendously from artillery
observation to an integrated part of nearly every military operation of the combined arms
team. In the last 10 years, largely due to increased capabilities and new technology, the
mission of Army aviation has become more complex. Today's operational demands
require Army aviation to not only perform with their inherent risks, but to do this in a
variety of environments which increases that risk. To maintain their outstanding safety
record, save soldiers lives and protect our force requires constant vigilance and the
application of sound safety management techniques. One of those safety management
techniques used is risk management, a decision-making process designed to minimize the
severity and risks of the hazards associated with current military operations.
The United States Army Safety Center (ASC) is the official repository for Army
accident data. A difficult problem for the ASC is the identification and ranking of
1-1
present and future hazards in Army Aviation. The current analytical methodologies are
limited in scope to basic statistical comparisons to identify major safety related hazards
risks and controls (FY99 HQDA Army Study Program Proposal, 1998). This tends to
lead to analysis and results that are reactive rather than proactive. While it is a
fundamental principal of command that every soldier's life is valued decisions affecting
doctrine implementation, policy changes and training are made based on this type of
analysis. Army leadership needs a proactive process to evaluate hazards, risks and
controls in order to effectively perform risk management at all levels of the Army (FY99
HQDA Army Study Program Proposal, 1998).
Currently, hazards are ranked by one or a few criteria. For instance, the current Army
Aviation database, the Risk Management Information System (RMIS), ranks hazards by
the number of accidents which are caused by that hazard, total cost of the accidents or a
myriad of other categories taken singularly. This is an ineffective and inconsistent
manner for ranking hazards. The current system does not provide decision-makers with
enough information to make key, necessary tradeoffs for certain risk reduction decisions
nor does it provide a baseline to make comparisons between different accidents or
hazards. The current top hazards are based on which criteria are important at a given
period of time. These critical criteria may change from month to month or year to year
based on public opinion, needs of the Army or other operational factors. The unstable
prioritization of the evaluation criteria leads to an inconsistent and possibly
unsupportable decision-making process.
1-2

1.2 Background
While Army Field Manual 100-14, the army's risk management doctrine, outlines
specific guidelines for determining the severity of a hazard, these guidelines are not
consistently followed when analyzing hazards (Moon, 1998). Furthermore, the senior
leadership of the Safety Center and the Army have expressed concerns that the current
methodology does not provide senior decision-makers with an accurate, multi
dimensional representation of the most severe hazards that plague the field of aviation.
This study was conducted in cooperation with the Safety Center in order to provide
commanders, at all levels, with an additional tool to help assess risk with greater
accuracy. Although risk management is a command responsibility, commanders must be
equipped with the proper tools to analyze and evaluate risks in order to make well
informed decisions. The goal is to make risk management a routine part of planning and
executing all missions (Reimer, 1995).
To ensure the Safety Center's efforts to reduce risk remain correctly focused on
aviation's most severe safety issues, the most problematic areas must be identified then
their root causes addressed in order to decrease the associated risk. For the United States
Army Safety Center hazards are the problematic areas. The senior leadership of the ASC
has identified the need to develop a methodology to accurately rank the top hazards in the
Army in order to allocate resources to the appropriate areas. The reduction or elimination
of hazards falls under the umbrella of Risk Management. Army risk management applies
across a wide range of military operations. Field Manual 100-14 explains the "principles,
procedures and responsibilities to successfully apply the risk management process to
conserve combat power and resources" (FM 100-14, 1998, pg. ii). Doctrinally, the risk
1-3
management process is incorporated into the planning of all military operations and
training in order to assist in the identification and the assessment of hazards with greater
precision. Traditionally, this process is implemented down the chain of command; yet,
this process has not been adopted at some of the higher levels of decision-making and
alternative evaluation (Warren, 1998). Specifically, the ASC does not account for the
values discussed in FM 100-14 to incorporate the risk management process in their
resource allocation procedures (Interview, Warren 1998). A result of an evaluation
procedure consistent with the Army’s values should lead to a more acceptable, consistent,
and supportable ranking of hazards. Another application of these results may be a better
methodology for allocating resources.
The process of identifying the objectives and associated measures involved an
appropriate spectrum of people knowledgeable about Aviation hazards and resources
available, including experts both inside and outside of the Army Safety Center. The
output from this model is not limited to merely a list of hazards. The same value
structure will be valuable for developing a portfolio of controls, designed to reduce
hazard severity or risk, while limited by a budget. Several insights for the decision
making process are available from the output of this model. The recommendations from
this model do not take away from any decision-making authority from the Safety Center.
In fact, the ASC's decisions will have a much stronger basis and authority (Keeney, 92)
with the analysis actually being done up front. In addition, with "up front" analysis,
decisions can be more quickly and more consistently with the values of the current chain
of command and Army Doctrine.
1-4

1.3 Problem Statement
In order to integrate the Army's risk management process, as outlined the Army’s
field manual for risk management, and the Director of Army Safety’s (DASAF) values
into the Army Safety Center’s resource allocation procedures, a methodology to more
consistently evaluate Army Aviation hazards has been developed. Upon creating this
rank order of hazards, resources may then be appropriately and optimally allocated.
1.4 Research Objectives
The objective of this research was to incorporate the values of the Army and its
current decision-makers into a systematic, logical decision structure which analyzes
existing hazards and develops a ‘top ten” hazard recommendation list. A value hierarchy,
discussed in Chapter Two, is the basis for developing alternatives and evaluating the
worth of different solutions, such evaluation will facilitate making the tough tradeoffs by
making them more explicit. Some of the associated sub-objectives are:
1) Structure a quantified model that represents Army Doctrine and the ASC's values with respect to aviation safety.
2) Identify the most severe aviation accidents.
3) Identify the highest risk accidents.
4) Prioritize by severity the hazards causing aviation accidents.
1.5 Research Approach
The foundation on which this research rests is the Director of Army Safety’s
FY98 Strategic Plan for the U.S. Army Safety Center. Specifically, objective number
five: Develop a methodology and process for identifying and alerting the Army of the
“top ten” hazards (FY98 Strategic Plan for the U. S. Army Safety Center, 1998).
1-5
Additionally, this analytical model incorporates the first three steps of the risk
management process as outlined in Chapter Two of FM 100-14 (Risk Management).
Step 1. Identify hazards.
Step 2. Assess hazards to determine risks.
Note: The following steps will not be fully developed during this research project but
they deserve to be mentioned here. Steps three and four will be addressed briefly and
have been recommended as subjects for further development to the ASC. The
methodology developed will promote improved controls and the generation of better
controls. Controls are those steps taken or policies implemented to eliminate hazards or
reduce their risk (FM 100-14, 1998).
Step 3. Develop controls and make risk decisions.
Step 4. Implement Controls (FM 100-14, 1998, p. 2-0)
Step 5. Supervise and Evaluate.
1.6 Scope of Problem
To accomplish the near term objectives of this study the scope of the research will
be restricted in the following areas:
1. The study will be limited to analyzing hazards associated with rotary winged aircraft within Army Aviation.
2. Accident categories A, B and C will be the only accident categories used to gather data. Lower classes of accidents do not contain enough information to allow full evaluation.
3. Research will be limited to hazards which have produced mishaps, potential hazards will not be considered at this time.
4. The overall ranking of hazards will use data collected over the last eleven years. This time period best represents the tactics, techniques and aircraft types currently used in Army Aviation.
1-6
5. Currently, data is being transferred from the Aviation Safety Management Information System (ASMIS) older database to a newer, more user-friendly system the Risk Management Information System (RMIS). At this time, the upgrade does not contain the data necessary to complete this research; the research was therefore based on data taken from the ASMIS database.
1.7 Overview
Chapter Two briefly covers some of the fundamentals of decision analysis that
will be applied throughout this research effort and presents some of the current related
literature. Chapter Three describes the methodology used to develop the value hierarchy,
to include its associated measures, functions and weights, in addition to associating
hazards with accidents to determine their severity. Chapter Four discusses the data used
and the results obtained along with presenting a sensitivity analysis of the criteria in the
value hierarchy. Chapter Five discusses overall conclusions and recommendations for
follow-on-work to be conducted at the Army Safety Center. Data used and pertinent
definitions are also provided in the enclosed appendices.
1-7
2 Literature Review
2.1 Introduction
Sizing up opponents to determine victory, assessing dangers and distances is the proper course of action for military leaders.
Sun Tzu, The Art of War
This chapter briefly introduces the reader to the decision analysis concepts used in
this research. This discussion will include, at a minimum, the concepts and basis for
value focused thinking which is used in this research extensively. Furthermore, some
examples of literature that discuss the methods presented in this paper as applied to
decision analysis problems in recent history will be presented.
2.2 Decision Analysis
While each individual decision has its own special set of issues, there are four
basic sources of difficulty in making a decision. Decision analysis can help the decision
maker with all of them. A decision may be considered difficult due to:
1. Complexity.
2. Uncertainty in the situation.
3. The decision-maker may be working toward multiple objectives.
4. A situation where different perspectives may lead to different conclusions
(Clemen, 1996: 3)
By using decision analysis and applying different techniques for different situations
better decisions can be attained. Better decisions do not necessarily mean better
outcomes; a well-structured and well thought out decision may lead to poor outcomes.
Decision analysis provides "structure and guidance for systematic thinking in difficult
2-1
situations" (Clemen 1996: 4). Decision analysis is not designed to do the decision
maker's job for him or her, yet it should provide the necessary structure for a well
informed decision. Derek Bunn, author of Applied Decision Analysis writes:
[t]he basic presumption of decision analysis is not at all to replace the decisionmaker's intuition, to relieve him or her of the obligations in facing the problem, or to be, worst of all a competitor to the decision maker's personal style of analysis, but to complement, augment, and generally work alongside the decision maker in exemplifying the nature of the problem. Ultimately, it is of most value if the decision-maker has actually learned something about the problem and his or her own decision-making attitude through the exercise (Bunn, 1984: 8).
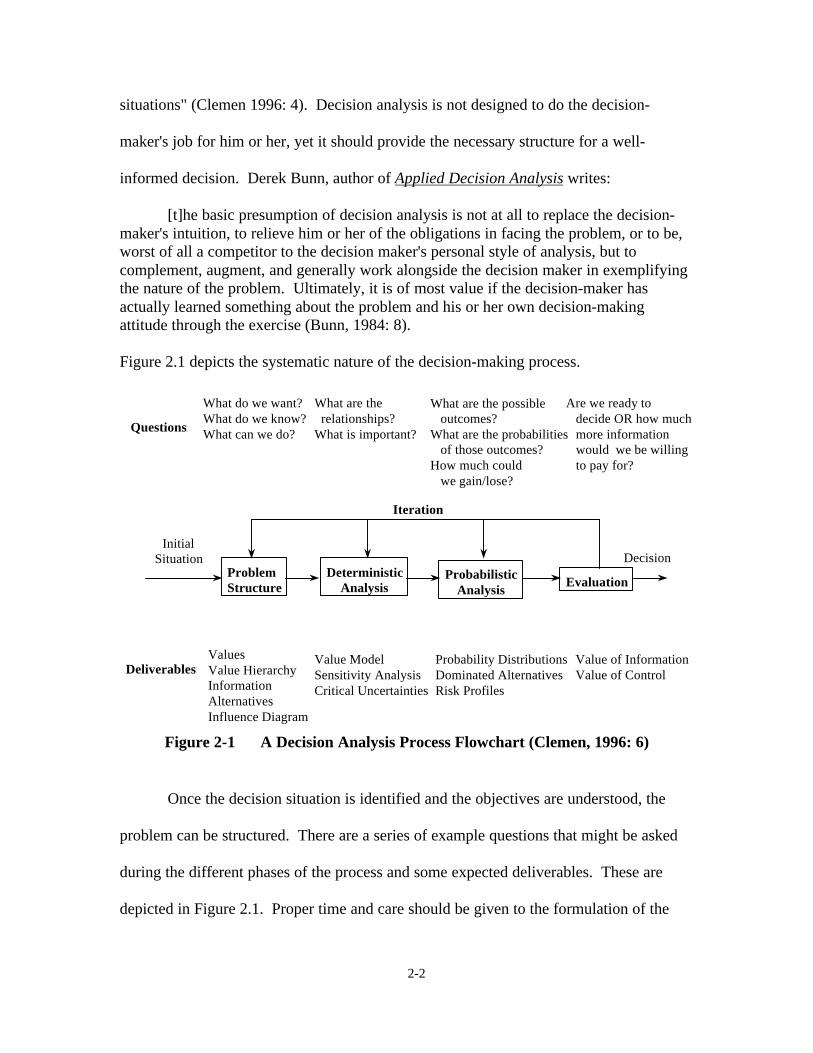
Figure 2.1 depicts the systematic nature of the decision-making process.
Questions:
What do we want? What do we know? What can we do?
What are the relationships?
What is important?
What are the possible outcomes?
What are the probabilities of those outcomes?
How much could we gain/lose?
Are we ready to decide OR how much more information would we be willing to pay for?
Iteration
Problem Structure
Deterministic Analysis
Probabilistic Analysis
Evaluation
Decision Initial
Situation
Values Value Model Probability Distributions Value of Information Deliverables: Value Hierarchy Sensitivity Analysis Dominated Alternatives Value of Control
Information Critical Uncertainties Risk Profiles Alternatives Influence Diagram
Figure 2-1 A Decision Analysis Process Flowchart (Clemen, 1996: 6)
Once the decision situation is identified and the objectives are understood, the
problem can be structured. There are a series of example questions that might be asked
during the different phases of the process and some expected deliverables. These are
depicted in Figure 2.1. Proper time and care should be given to the formulation of the
2-2
problem to ensure the necessary values and alternatives are identified. A deterministic
and probabilistic analysis should be conducted along with a sensitivity analysis to
determine the effect that uncertainty has on final recommendations. At this point, a
solution may be recommended or further analysis may be deemed necessary (Clemen,
1996: 6).
The process of decision-making, when dealing with multi objective problems is
indeed complicated. This is due to the inherent complexity of these problems and
because humans commonly rely on intuition to solve problems and make decisions.
Intuition can fail when the decision-maker must make tradeoffs between conflicting
objectives, account for uncertainties and dependencies between measures and possibly
account for scaling problems within measures used (Kirkwood, 1997: 2). The Army
places a great deal of confidence in the problem solving abilities of its senior decision
makers. These individuals regularly deal with complex multi-objective problems.
Intuition and past experience are used to balance choices, facts, available information and
preferences to arrive at a logical decision for small or straightforward problems. As the
problem and the decision context increase, certain decision-making theories and practices
can assist these decision-makers in making logical and consistent decisions.
2.3 Value Focused Thinking
There are two basic thought processes that deal with the structure of decision
analysis problems, these are alternative focused and value focused thinking. Alternative
focused thinking, throughout the literature, has been deemed the traditional approach and
is characterized as "reactive not proactive" (Keeney, 1992: 33). Alternative focused
thinking develops alternatives to solve the problem by considering alternatives. Focusing
2-3

on the alternatives may sometimes cloud the issues at hand. A decision-maker expends
his or her precious time evaluating alternatives rather than considering what is wanted, or
"valued", from the decision. The focus remains on the choices not what the choices
should be.
The second manner in which problems may be structured is value-focused
thinking (Keeney: 1992). Value focused thinking provides the analyst with a means to
present recommendations to a decision-maker that are logical and consistent with a
certain set of values. That set of values should be based on the organization’s or
individual’s goals and objectives. The set of values obtained is organized into a
hierarchy with the overriding strategic objective, or goal, at the apex and supporting
objectives (criteria), sub-objectives (sub-criteria) and measures of merit as depicted
below.
Objective 1
Measure of Merit A
Sub-objective A
Measure of Merit B
Sub-objective B
Measure of Merit C
Sub-objective C
Objective 2 Objective 3
Strategic Objective
Figure 2-2 Value Hierarchy (Kloeber, Parnell: VFT Brief)
This value hierarchy is usually obtained by one of two methods; the gold standard or the
silver standard (Kloeber, Parnell, 1998: VFT Brief). The method used is not necessarily
2-4
a choice rather the decision context and information available guides you towards your
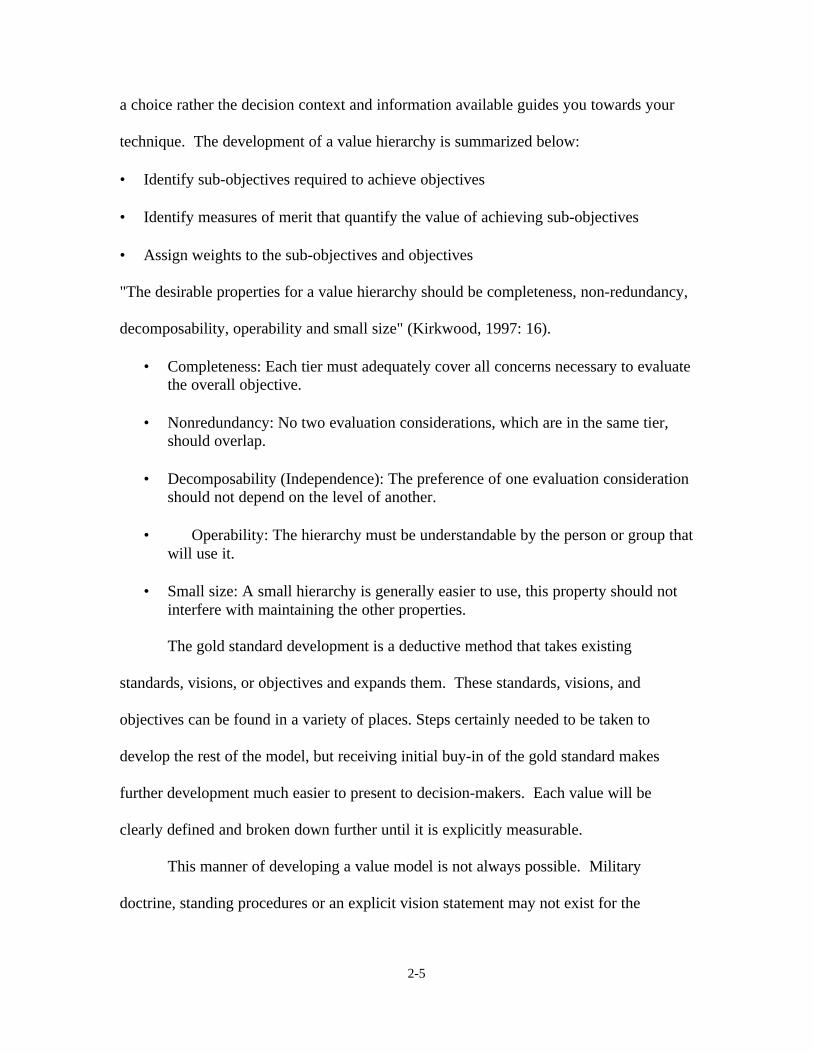
technique. The development of a value hierarchy is summarized below:
• Identify sub-objectives required to achieve objectives
• Identify measures of merit that quantify the value of achieving sub-objectives
• Assign weights to the sub-objectives and objectives
"The desirable properties for a value hierarchy should be completeness, non-redundancy,
decomposability, operability and small size" (Kirkwood, 1997: 16).
• Completeness: Each tier must adequately cover all concerns necessary to evaluate the overall objective.
• Nonredundancy: No two evaluation considerations, which are in the same tier, should overlap.
• Decomposability (Independence): The preference of one evaluation consideration should not depend on the level of another.
• Operability: The hierarchy must be understandable by the person or group that will use it.
• Small size: A small hierarchy is generally easier to use, this property should not interfere with maintaining the other properties.
The gold standard development is a deductive method that takes existing
standards, visions, or objectives and expands them. These standards, visions, and
objectives can be found in a variety of places. Steps certainly needed to be taken to
develop the rest of the model, but receiving initial buy-in of the gold standard makes
further development much easier to present to decision-makers. Each value will be
clearly defined and broken down further until it is explicitly measurable.
This manner of developing a value model is not always possible. Military
doctrine, standing procedures or an explicit vision statement may not exist for the
2-5
decision opportunity at hand. In such a case the silver standard development may be
used. This is an inductive method where experts in the specific field under investigation
develop a new value definition. This starts off with a brain storming session
concentrating on the use verbs. This method provides new insights but requires many
more participants and substantially more time to develop and establish support for. Once
the brainstorming session is complete the experts form groups of like tasks and build their
model from the bottom up instead of the top down (as in the gold standard development).
The Air Force’s 2025-value model was developed in this manner (AF 2020 An
Operational Analysis, 1997)
The decision analysis cycle can be broken down into thee distinct phases:
deterministic, probabilistic, and informational phase as depicted in Figure 2.1. In the first
phase, deterministic, we are primarily concerned with developing our problem and our
model. Here uncertainty is disregarded. By simplifying the form of our input data we
can ensure that the structure of our problem will provide the output we want. That is not
to say that we either agree or disagree with that output, we are more concerned that the
output is of the correct form and provides meaningful information to the decision at hand.
To ensure that an accurate model is developed, the value model must have a solid base
with measures be well defined. Furthermore, although the value hierarchy specifically
represents either the organization's or an individual decision-maker’s internalized values,
the range and utility of each measure must be accounted for. This can be accomplished
through a series of interviews with the decision-maker. Misrepresentation of the value or
utility curves of individual measures will skew the overall results. The model will still be
consistent, yet may not accurately portray the best options. The effect of slight changes
2-6
in measurements may or may not have a prominent effect on the outcome; this can be
examined in detail during the information phase with sensitivity analysis.
The probabilistic phase accounts for the uncertainty in the influential variables of
our problem. The importance of this phase varies from problem to problem. Obviously
the more uncertainty that is actually in the problem the more important the probabilistic
phase. Some decisions can actually be made, with confidence in the recommendations,
without incorporating uncertainty. This phase also allows the analyst to account for the
risk tolerance of the decision-maker. By incorporating the uncertainty a wide range of
analysis is available that is not possible in a purely deterministic model.
The last phase is the informational phase. Once model development is complete
and uncertainty is included, it is time to organize the output to provide meaningful
recommendations to the decision-maker. Sensitivity analysis plays a major role in this
phase. By varying measures, weights, distributions or other variables that might provide
insight, we can determine where a change in the decision policy should occur.
Furthermore we can determine which measures the decision policy is sensitive to and
decide which measures to gather more information on or probabilistically model. This
becomes extremely valuable, especially if there is conflict surrounding the weighting of
different values. In short, if the policy is not sensitive to a certain measure, the weight
does not matter. Each one of these phases is used in this research and will be discussed
in detail in Chapter Three.
2.4 Multiattribute Preference Theory
In order to compare alternatives using a value hierarchy (multiobjective value
analysis) it is necessary to develop a model that combines all of the evaluation
2-7
considerations into on dimensionless score. Determining this model requires that single
dimensional value functions be specified for each evaluation measure (Kirkwood, 1997:
53). These functions are determined through an interview with the decision-maker or his
designated representative. The function should represent the way the decision-maker
and/or the organization feels about different increments in value throughout the range of
the evaluation measure. When incorporating uncertainty the functions are developed
differently and are now referred to as utility functions. The difference in the formulation
of the utility function is that the decision-maker now answers lottery type questions about
each of the evaluation measures that contains uncertainty. The development of each of
the functions for this research effort is discussed in Chapter Three.
The overall value function, which combines the values of all the single
dimensional value functions, may be an additive value function. The additive value (or
utility) function is a weighted average of all the single dimensional value (utility)
functions within the value hierarchy (Kirkwood, 1997: 230,248).
2.5 Value Focused Thinking Application in Current Literature
This section provides some selected applications where value focused thinking
was used to solve large-scale problems. Each problem is completely different in goals,
stakeholders and specific problems. The common thread is that in each situation the
fundamental objectives are identified and the decision analysis is not focused on the
alternatives.
The National Aeronautics Space Administration was concerned with the selection
of future space missions. The choice of space missions to accept is extremely complex.
2-8
There are numerous stakeholders involved with multiple uncertainties, competing
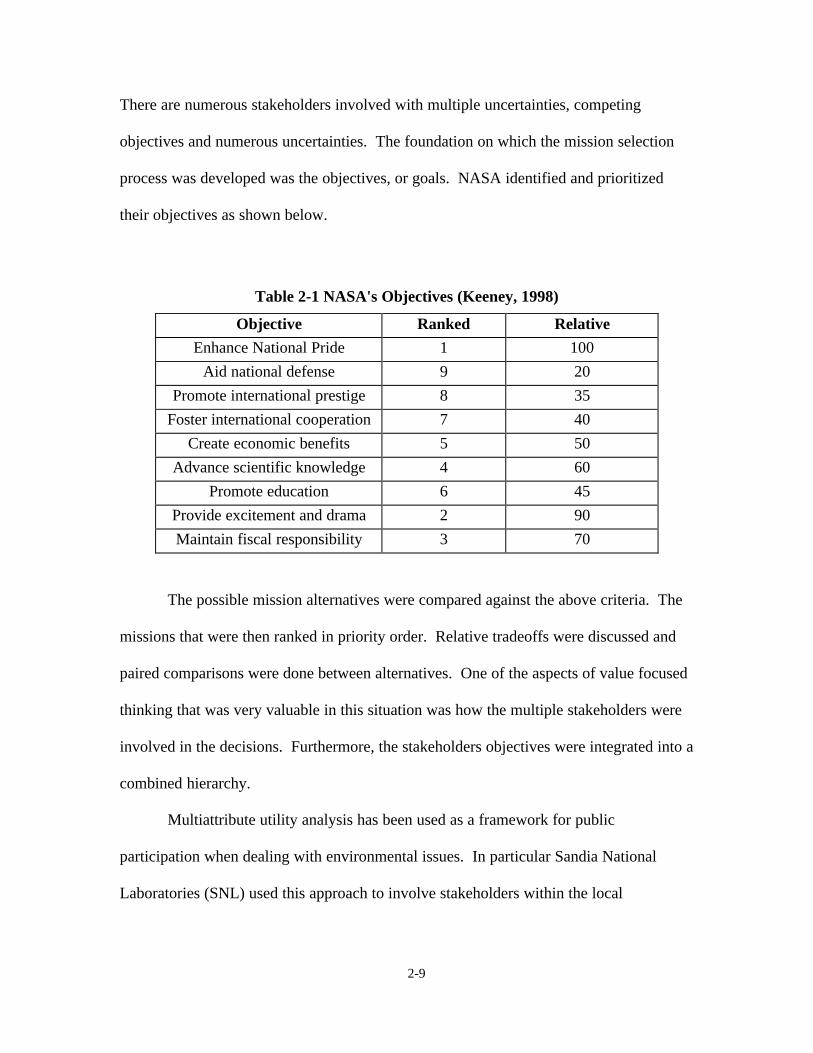
objectives and numerous uncertainties. The foundation on which the mission selection
process was developed was the objectives, or goals. NASA identified and prioritized
their objectives as shown below.
Table 2-1 NASA's Objectives (Keeney, 1998)
Objective Ranked Relative
Enhance National Pride 1 100
Aid national defense 9 20
Promote international prestige 8 35
Foster international cooperation 7 40
Create economic benefits 5 50
Advance scientific knowledge 4 60
Promote education 6 45
Provide excitement and drama 2 90
Maintain fiscal responsibility 3 70
The possible mission alternatives were compared against the above criteria. The
missions that were then ranked in priority order. Relative tradeoffs were discussed and
paired comparisons were done between alternatives. One of the aspects of value focused
thinking that was very valuable in this situation was how the multiple stakeholders were
involved in the decisions. Furthermore, the stakeholders objectives were integrated into a
combined hierarchy.
Multiattribute utility analysis has been used as a framework for public
participation when dealing with environmental issues. In particular Sandia National
Laboratories (SNL) used this approach to involve stakeholders within the local
2-9
community where a corrective action management unit (CAMU) was to be erected. The
approach allowed technical experts to explain the essential technical considerations while
allowing the local stakeholders to take part in establishing the value judgments made for
the decision. This situation utilized a power-sharing concept and allowed free access to
information. Furthermore this method was able to transfer technical competency to the
public. The MUA approach enabled stake holders to participate effectively, even though
they had limited understanding of all the technical details (Merkhofer, 1997: 838).
The Department of Energy has used value focused thinking extensively. Part of
the Department of Energy's (DOE) program to evaluate alternatives for managing spent
fuel was based on VFT (Keeney, 1998). Furthermore, in an AFIT thesis by Brian Grelk,
A CERCLA-Based Decision Support System For Environmental Remediation Strategy
Selection, the author develops a set CERCLA based evaluation measures and their
corresponding single dimensional value functions to recommend spill remediation
strategies. The uses of value focused thinking by the Department of Energy are clearly
focused on public safety and regulations.
Numerous agencies throughout the Department of Defense have done quantitative
and qualitative studies on the severity and probability of hazards and accidents. The
ASMIS database was used by ANACAPA Sciences during a study of aircraft component
failure. Analyses were conducted to determine the feasibility of extracting failure data
from the existing database and calculating failure rates from that data. The analysis
identified parts with relatively high failure rates. This data has been used to identify
problematic components or parts, to monitor trends and to develop countermeasures to
reverse part failure rates (ANACAPA, 1993:6).
2-10
The System Safety Risk Assessment Manual, developed at the Naval Safety
Center, was prepared to assist system safety managers in making informed risk
management decisions. The information was drawn from MIL-STD-882B, Navy Safety
School Course Material and other information sources. It compiled several of the more
common ways of defining safety risk. This report also introduced some new safety
management concepts referred to as relative worth index and a safety performance
baseline. The relative worth index takes five weighted factors to determine the relative
magnitude of risk (or impact on the Navy) from the loss of a certain aircraft. A
performance baseline establishes system and subsystem baselines, based on mishap rates.
The research described in this report seems to touch on some of the concepts of value
focused thinking but does not explain the theory behind its calculations nor does it cover
the development or support of the evaluation criteria. The intended users for this report
are the system safety and program managers (Kinzey, 1989:13, 24).
Based on the wide range of applications found in current literature, although no
specific reference was found that explicitly describes the use of value focused thinking
and multiattribute preference theory applied to aviation safety, the approach is certainly
valid.
2-11

3 Methodology
3.1 Introduction
Risk Management is not an add-on feature to the decision-making process but rather a fully integrated element of planning and executing operations…Risk management helps us preserve combat power and retain the flexibility for bold and decisive action. Proper risk management is a combat multiplier that we can ill afford to squander.
General Dennis J. Reimer Chief of Staff, Army
27 July 1995
A value focused thinking and multi attribute value theory approach to decision
analysis is applicable to a wide range of problems. This is a valuable and structured
manner by which a decision-maker can deal with problems involving various
stakeholders with multiple competing objectives that require tradeoffs. Decision analysis
is commonly used to make better tactical and strategic decisions that are not merely
routine. Examples include business decisions involving long term and short term
financial tradeoffs, balancing the tradeoffs between the efficiency of a manufacturing
process versus the impact on the environment and even personal decisions involving
career opportunities, employment, or purchases. Better analysis can be done and better
decisions can be made using value focused thinking and multi attribute value theory.
Furthermore, the decision-maker can explain the reasons for the decision easier and in a
more structured fashion (Kirkwood, 1997: 1).
After determining the exact nature of the U. S. Army Safety Center's decision context
and problem, and examining the analysis techniques available, a value-focused approach
to the multiattribute preference problem seemed the most logical technique to use. When
3-1

examining the hazards and accidents there was no clear “winner” or “loser”. No one
accident or hazard, nor group of hazards, was easy to label as the most severe. The
tradeoffs involved were numerous. Some of the areas of concern included cost incurred,
soldier and civilian's lives lost, training time lost, and maintenance time allocated. In
addition to these competing objectives there are numerous stakeholders that are affected
by this ranking of hazards; the soldiers flying the aircraft, the unit deploying to war and
the leadership of the Safety Center trying to implement risk management policies
throughout the Army to mention a few. There is currently no structured method in place
used to analyze hazards based the multiple objectives and various stakeholders mentioned
above. Value focused thinking provides a base of evaluation to enable the Safety Center
to make logical and consistent assessments of hazards using the current values of the
Army. Involving the stakeholders at risk, and using the current values and doctrine of the
Army to balance the tradeoffs between the various competing objectives, will make it
easier to succeed at getting every one involved working toward a common goal and
attaining a consensus on the outcome of the research.
The research effort was broken into three distinct phases: the deterministic,
probabilistic and informational. In the deterministic phase, the accident value model is
developed, data is collected and manipulated, and a dry run of the model is performed to
see if the output from the model is the type of output required. During the probabilistic
phase, accidents are associated with hazard occurrences to determine hazard severity and
accident/hazard risk. In the informational phase it is time to organize the output to
provide meaningful recommendations to the decision-maker. Sensitivity analysis plays a
major role in this phase.
3-2
This chapter will cover in depth the development of the accident value hierarchy to
include the evaluation measures and single dimension value functions, the methods of
assessing weights and the application of the additive value function and power additive
utility function. Furthermore, the accident severity scores will be combined together with
their associated probabilities to attain a hazard severity and a hazard risk score
3.2 Accident Model Value Hierarchy
A hazard is “any actual or potential condition that can cause injury, illness, or death
of personnel, damage to or loss of equipment, property or mission degradation" (FM 101
14, 1998: G-1). A hazard may or may not produce an accident (or mishap). Commonly,
if a hazard is present in an operation, goes unchecked, and does not cause an accident,
that hazard will go unnoticed and unrecorded. The information available for this research
purely dealt with hazards that have resulted in accidents, for which the Safety Center
maintains detailed records as well as the frequency of those accidents. The basis for
evaluating a hazard rests in the severity of the accidents it causes. Therefore, the severity
of an accident must be assessed to determine the severity, and risk, of the hazard that
caused that accident.
In order to avoid confusion, the following definitions are provided in this section (as
well as Appendix A).
1) Severity: The expected consequence of an event (hazardous incident) in terms of degree of injury, property damage, or other mission impairing factors that could occur (FM 101-14, 1998: G-3).
2) Risk: Chance of hazard or bad consequences; the probability of exposure to chance of injury or loss from a hazard; risk level is expressed in terms of hazard probability and severity (FM 101-14, 1998: G-2).
3-3

3) Accident: An unplanned event that causes personal injury or illness, or property damage (Army Regulation 385-40).
4) Hazard: Any actual or potential condition that can cause injury, illness, or death of personnel, damage to or loss of equipment, property or mission degradation (FM 101-14, 1998: G-1).
Although the above definitions appear descriptive, during the development of this model
there was much discussion with experts at the Safety Center concerning what constituted
accidents and hazards. For the purpose of this study, “events” (hazardous incidents) that
are contained in the Safety Center’s current database are referred to as accidents and
"system inadequacies" are referred to as hazards. Further research will be done to
develop a better taxonomy to determine hazards.
In order to determine the severity of the accidents currently in the database, the
attributes by which severity is measured needed to be determined. Value focused
thinking is an organized and logical method to accomplish this and is the method used in
this research. The general principle of value focused thinking is to discover all of the
information useful in guiding one's decision" (Keeney, 1992: 23). A value hierarchy,
developed properly, should "indicate everything [you] really care about in a decision
context (Keeney, 1992: 23). The most preferred method of developing a value hierarchy
is by utilizing a gold standard, if one exists. The gold standard utilizes existing values or
standards of an organization and develops measures for those values in a top to bottom
fashion. Army doctrine contains specific criteria by which the severity of a hazard
should be assessed. FM 100-14 is the Army's official risk management manual and this
set of criteria was established by the Safety Center as the standard criteria to be used to
evaluate hazards. To use this set of criteria to determine hazard severity each category
3-4
had to be broken down into more explicit measurable parts. This was done by starting at
the top objective and developing measures down to the lowest level. This method of
moving from the top to the bottom is appropriate when the possible alternatives are
unclear (Kirkwood, 1997: 21). In the case of this research, accidents, not alternatives, are
evaluated. There is a wide range of accidents, the full range of which is unknown. A top
down method is better suited for this type of situation. The Gold Standard method also
makes attaining buy-in from the stakeholders in the organization much easier.
In the case of risk management, Army doctrine provides the gold standard. The U.S.
Army relies on doctrine to set forth the standards and methods by which the officers and
enlisted soldiers conduct their daily operations. The Field Manual 100-14: Risk
Management printed in April of 1998 is the Army’s doctrinal manual concerning Risk
Management. This manual covers a wide range of Army operations and can be applied to
almost all aspects of military life including Army Aviation. It explains the “principles,
procedures, and responsibilities to successfully apply the risk management process to
conserve combat power and resources”(FM 100-14, 1998: ii). This research focuses
specifically on the second step of the risk management process; assess hazards to
determine risks. FM 100-14 specifically outlines the terms in which the severity of an
accident can be expressed:
• Degree of injury or illness
• Loss of or damage to equipment or property
• Environmental damage
• Other mission impairing factors such as loss of combat power
3-5

When assessing the degree of severity of an accident, doctrine confirms that the severity
may be “based on knowledge of the results of similar past events” (FM 100-14, 1998: 2
9). This is the approach taken in this research effort. This set of criteria develops the
first tier of the value hierarchy shown below.
Degree Injury/ Illness
Loss Damage to Equipment/Property
Environmental Damage
Other Mission Impairing Factors
Accident Severity
Figure 3-1 Top Level Criteria of Value Hierarchy
The standards set forth in doctrine, interviews with risk management experts and
accident investigation reports verified that these four criteria were collectively exhaustive
and mutually exclusive. This means that the evaluation considerations in each layer,
taken as a whole, include everything needed to evaluate each accident and nothing
necessary to do the assessment are included in more than one criterion (Kirkwood, 1997:
17). Next, the evaluation criteria for each of the criteria needed to be developed. If there
exists a good measure for the fundamental objective, that measure will be used.
Otherwise, the fundamental objective will need to be broken down into more explicit
measurable parts.
3.3 Evaluation Measures
This section will introduce the reader to the development of the Accident Severity
Sub-Criteria and the metrics used to measure these sub-criteria. Some of the criteria, sub
criteria, and measures are self-explanatory but they are all discussed below. The
evaluation considerations are broken down further into the metrics that will be used to
3-6

measure each of the areas of concern. Measures can be classified as either one of the
scales below:
• Natural: In general use with a common interpretation by everyone.
• Constructed: Developed for a particular decision problem to measure the degree of attainment of an objective.
They are further classified as one of the following:
• Direct: Directly measures the degree of attainment of an objective.
• Proxy: Reflects the degree of attainment of an associated objective(Kirkwood, 1997: 24).
Assessment of the severity of an accident does not account for the probability of
occurrence. This is merely the expected consequence of an accident in terms of degree of
injury, property/environmental damage, or other mission impairing factors that could
occur (FM 101-14, 1998: 2-7). The considerations below have been agreed upon within
the Safety Center, and are supported by doctrine, as proxy measurements for accident
severity. To determine the severity of each accident the evaluation criteria presented in
the following sections was used.
3.3.1 Degree of injury or illness:
Loss of Life
Total Disabilities
Partial Disabilities
Permanant Disabilities
Time Incapacitated
Injury Cost
Degree Injury/ Illness
Figure 3-1 Criteria: Degree of Injury or Illness
3-7
This criterion is designed to measures the severity of the injuries that occur in each type
of accident. The considerations that were taken into account for the severity on an injury
were focused on the impact on the individual, the unit and the Army as a whole.
According to Army Regulation and Department of the Army Pamphlet 385-40, Field
Manual 100-14, and the senior leadership of the USASC the evaluation considerations
below adequately cover all the concerns necessary to evaluate the degree of the injury.
3.3.1.1 Loss of Life
This is a natural-direct measure scale that assesses the number of
lives lost during an accident. All fatalities related to an accident are included, civilian
and military personnel.
3.3.1.2 Permanent Disabilities
There are two categories of permanent disabilities accounted for in the ASMIS database
and this study, they are discussed in the following two sections.
3.3.1.2.1 Total Disability
This is a natural-direct measure scale that assesses any nonfatal injury or
occupational illness that, in the opinion of a competent medical authority, permanently
and totally incapacitates a person to the extent that he or she cannot follow any gainful
employment. (The loss or loss of use of both hands, feet, eyes, or any combination
thereof as a result of a single accident will be considered as a permanent total disability
(DA PAM 385-40, 1994: 143).
3-8
1
2
3
4
5
6
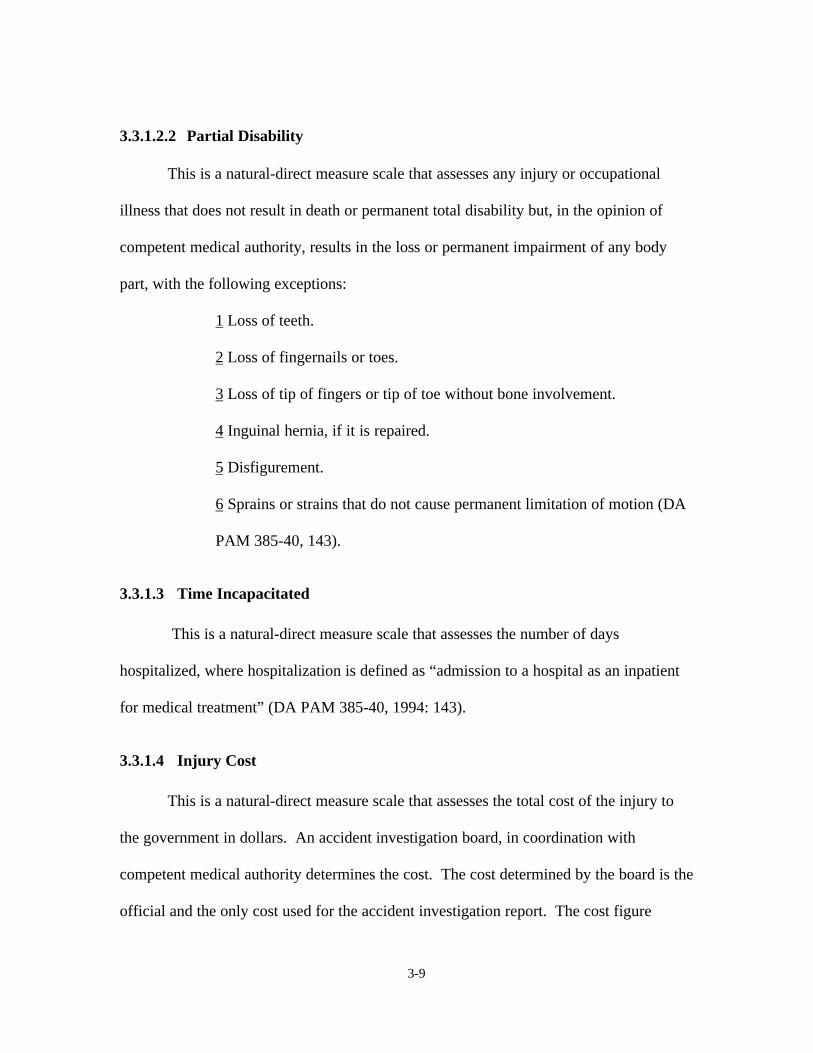
3.3.1.2.2 Partial Disability
This is a natural-direct measure scale that assesses any injury or occupational
illness that does not result in death or permanent total disability but, in the opinion of
competent medical authority, results in the loss or permanent impairment of any body
part, with the following exceptions:
Loss of teeth.
Loss of fingernails or toes.
Loss of tip of fingers or tip of toe without bone involvement.
Inguinal hernia, if it is repaired.
Disfigurement.
Sprains or strains that do not cause permanent limitation of motion (DA
PAM 385-40, 143).
3.3.1.3 Time Incapacitated
This is a natural-direct measure scale that assesses the number of days
hospitalized, where hospitalization is defined as “admission to a hospital as an inpatient
for medical treatment” (DA PAM 385-40, 1994: 143).
3.3.1.4 Injury Cost
This is a natural-direct measure scale that assesses the total cost of the injury to
the government in dollars. An accident investigation board, in coordination with
competent medical authority determines the cost. The cost determined by the board is the
official and the only cost used for the accident investigation report. The cost figure
3-9
includes the cost of pay while away from work, medical treatment, hospitalization,
dependent survival, unused training costs, gratuities, compensation, disability retirement,
and burial (AR 385-40, 1994: 8).
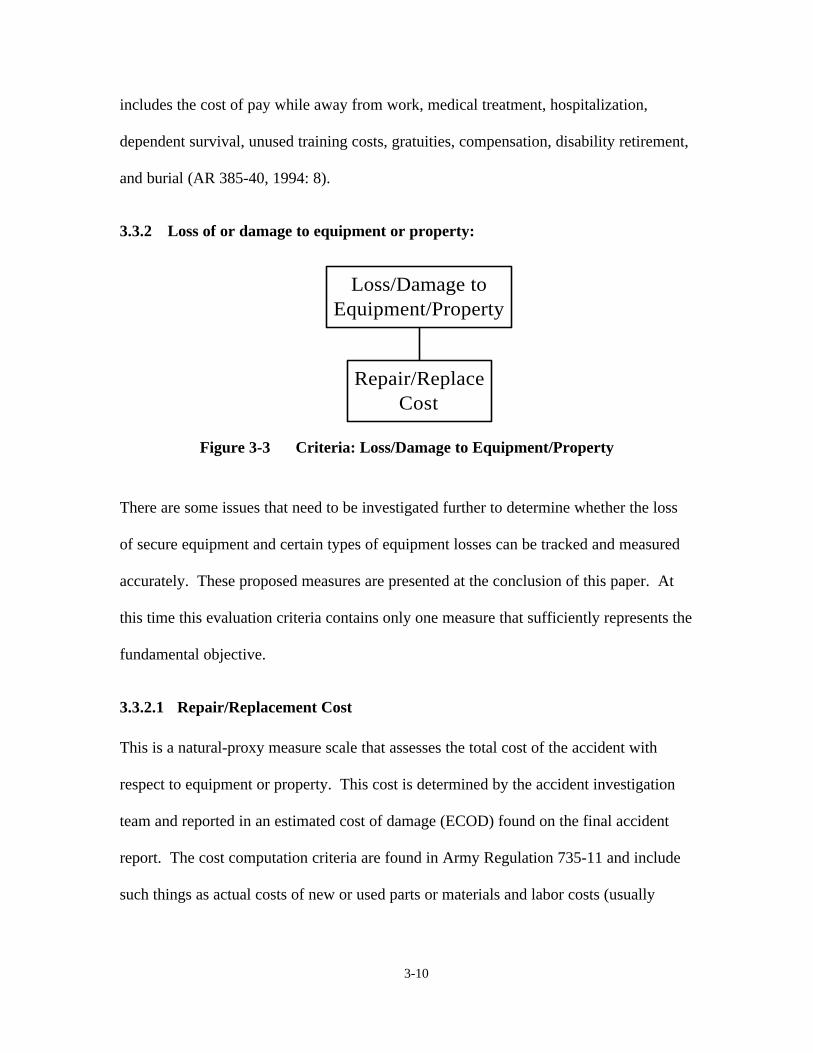
3.3.2 Loss of or damage to equipment or property:
Repair/Replace Cost
Loss/Damage to Equipment/Property
Figure 3-3 Criteria: Loss/Damage to Equipment/Property
There are some issues that need to be investigated further to determine whether the loss
of secure equipment and certain types of equipment losses can be tracked and measured
accurately. These proposed measures are presented at the conclusion of this paper. At
this time this evaluation criteria contains only one measure that sufficiently represents the
fundamental objective.
3.3.2.1 Repair/Replacement Cost
This is a natural-proxy measure scale that assesses the total cost of the accident with
respect to equipment or property. This cost is determined by the accident investigation
team and reported in an estimated cost of damage (ECOD) found on the final accident
report. The cost computation criteria are found in Army Regulation 735-11 and include
such things as actual costs of new or used parts or materials and labor costs (usually
3-10

estimated). When damaged equipment cannot be replaced, the cost reported will be the
acquisition costs (AR 385-40, 8). The cost determined by the accident investigation
board is the official and only cost used to determine the repair or replacement cost for
Army equipment.
3.3.3 Environmental Damage
Oil Spilled Fuel Spilled Hydraulic Fluid Spilled
Severity of Damage
Environmental Damage
Figure 3-4 Criteria: Environmental Damage
This area of concern considers the severity of the damage to the environment. This is the
only evaluation consideration for this criterion. Although the Army’s Risk Management
doctrinal manual includes environmental damage as one of the top four criteria for
determining the severity of an accident, there is little data available to facilitate an
accurate measure of the damage caused by an accident. For this criteria a proxy measure
scale was developed that used available data to determine some type of rating system for
damage to the environment. This criteria contains three measurements: gallons of oil
spilled, gallons of fuel spilled, and gallons of hydraulic fluid spilled. At this time, the
measures for the severity of environmental damage are not collectively exhaustive. This
research has been conducted using data from the past ten years; no additional data
3-11
concerning environmental damage was collected. Different data collection procedures
may be initiated in the future by the Safety Center to collect more detailed information
concerning the environment. While this is an area for future research, it is beyond the
scope of the current study.
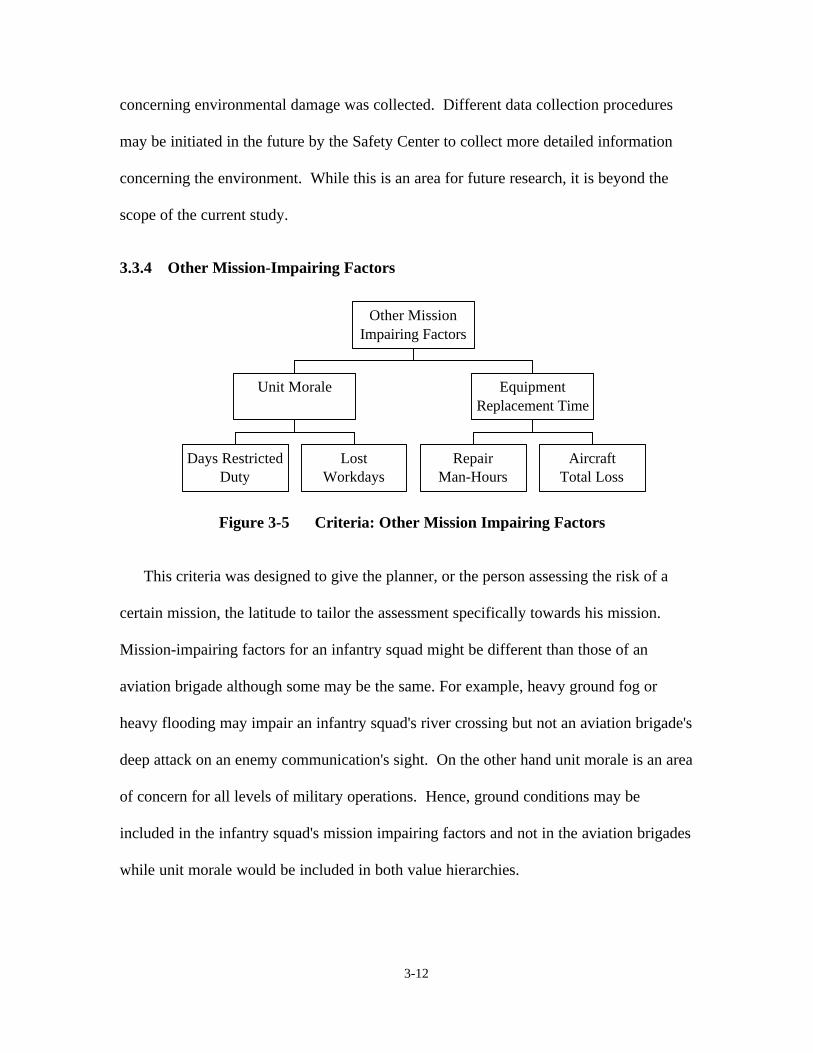
3.3.4 Other Mission-Impairing Factors
Days Restricted Duty
Lost Workdays
Unit Morale
Repair Man-Hours
Aircraft Total Loss
Equipment Replacement Time
Other Mission Impairing Factors
Figure 3-5 Criteria: Other Mission Impairing Factors
This criteria was designed to give the planner, or the person assessing the risk of a
certain mission, the latitude to tailor the assessment specifically towards his mission.
Mission-impairing factors for an infantry squad might be different than those of an
aviation brigade although some may be the same. For example, heavy ground fog or
heavy flooding may impair an infantry squad's river crossing but not an aviation brigade's
deep attack on an enemy communication's sight. On the other hand unit morale is an area
of concern for all levels of military operations. Hence, ground conditions may be
included in the infantry squad's mission impairing factors and not in the aviation brigades
while unit morale would be included in both value hierarchies.
3-12
This research is limited to Army Aviation Rotary Winged accidents. Unit readiness is
the overall criteria. Unit morale and equipment replacement time are the two sub-criteria
that are a proxy for the level of unit readiness. These two criteria combined represent
how well the unit will perform and how well their equipment is prepared. Throughout
this report, when referring to unit readiness, the unit is a company size element. A
Company element ranges from approximately forty soldiers and 8 aircraft in an AH-64
equipped Attack Company to 100 soldiers and 24 aircraft in a UH-60 equipped Assault
Company. For a company size element, with the data available, this evaluation
consideration is collectively exhaustive and mutually exclusive. Recommendations have
been made for further research to further develop this area of concern. Most notably, the
Safety Center is concerned with the loss of Special Mission Aircraft but there is currently
no way to measure the impact on a specific unit that looses one of these aircraft.
3.3.4.1 Unit Morale
The morale of a unit, historically, is correlated to the performance of a unit and
therefore, unit readiness. As a soldier's time on restricted duty and lost workdays
increase, a strain is put on the other members of the unit. For a short period of time the
other members of the company can compensate for the loss of an individual, but as time
goes on and people become tasked with unfamiliar jobs along with their normal duties,
morale will tend to decrease. This measure assumes that all jobs are equal. Obviously,
the loss of a Company Commander or a Senior Instructor Pilot will have a greater affect
on the unit than a newly assigned pilot. Personal experience and interviews with various
commanders and the leadership at the ASC determined that the measures below cover the
3-13
concerns to adequately evaluate unit morale. There are other indicators of unit moral
(i.e. mission rate, commander's performance) but these are not associated with this study.
3.3.4.1.1 Days of Restricted Duty
This is a natural-direct measure scale that assesses the number of days that an
individual (or all individuals involved) are unable to perform their normal duties (i.e.
light duty, profile, grounded from flight) (DA PAM 385-40, 142)
3.3.4.1.2 Lost Workdays
This is a natural-direct measure scale that assesses cases in which an accident
results in Army personnel missing one or more days of work. Days away from work are
those workdays (consecutive or not) on which Army personnel would have worked but
could not because of injury, occupational illness, or job relates physical deficiencies
detected during medical surveillance examinations. Excluded are days that Army
personnel would not have worked even though able to work (i.e. weekends or holidays)
and the day of the injury or onset of the occupational illness (DA PAM 385-40, 141).
3.3.4.2 Equipment Replacement Time
Equipment readiness is a large contributor to unit readiness. The two measures
below represent the time the unit will be without a specific piece of equipment, in this
case an aircraft.
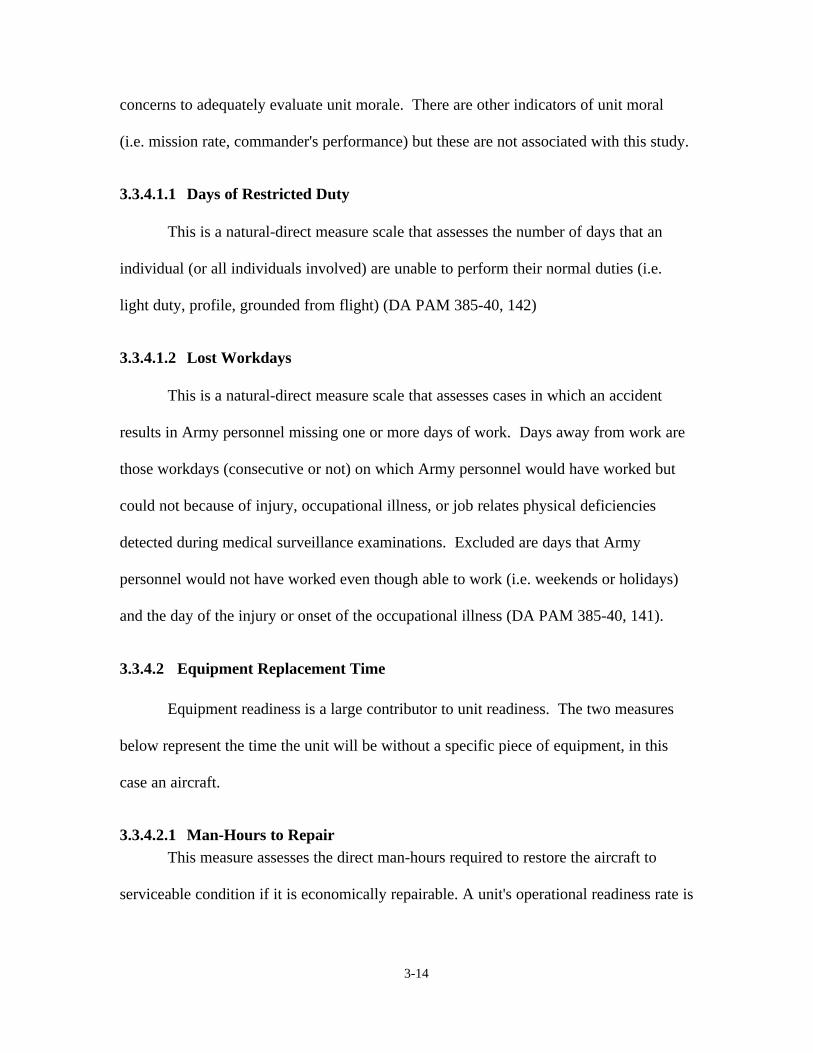
3.3.4.2.1 Man-Hours to Repair This measure assesses the direct man-hours required to restore the aircraft to
serviceable condition if it is economically repairable. A unit's operational readiness rate is
3-14
measured partially by the down time of aircraft within the unit, man-hours to repair the
equipment is a proxy measurement for down time. A proxy measurement is required
because aircraft down time while recorded and maintained at the unit level, was
unavailable for this research. The hours are originally estimated using technical manual
estimates. When work is complete, they are reported back on an Equipment Inspection
and Maintenance Worksheet (DA Form 2404). The direct man-hours are a summation of
the following:
1 The cumulative (estimated) man-hours required to remove, repair, and replace damaged aircraft assemblies, subassemblies, or components.
2 Man-hours expended in removing and replacing undamaged aircraft components in order to remove, repair, or replace damaged components.
3 Man-hours required to remove and replace a part that is not economically repairable.
4 Man-hours expended to determine damage amount (AR 385-40, 8).
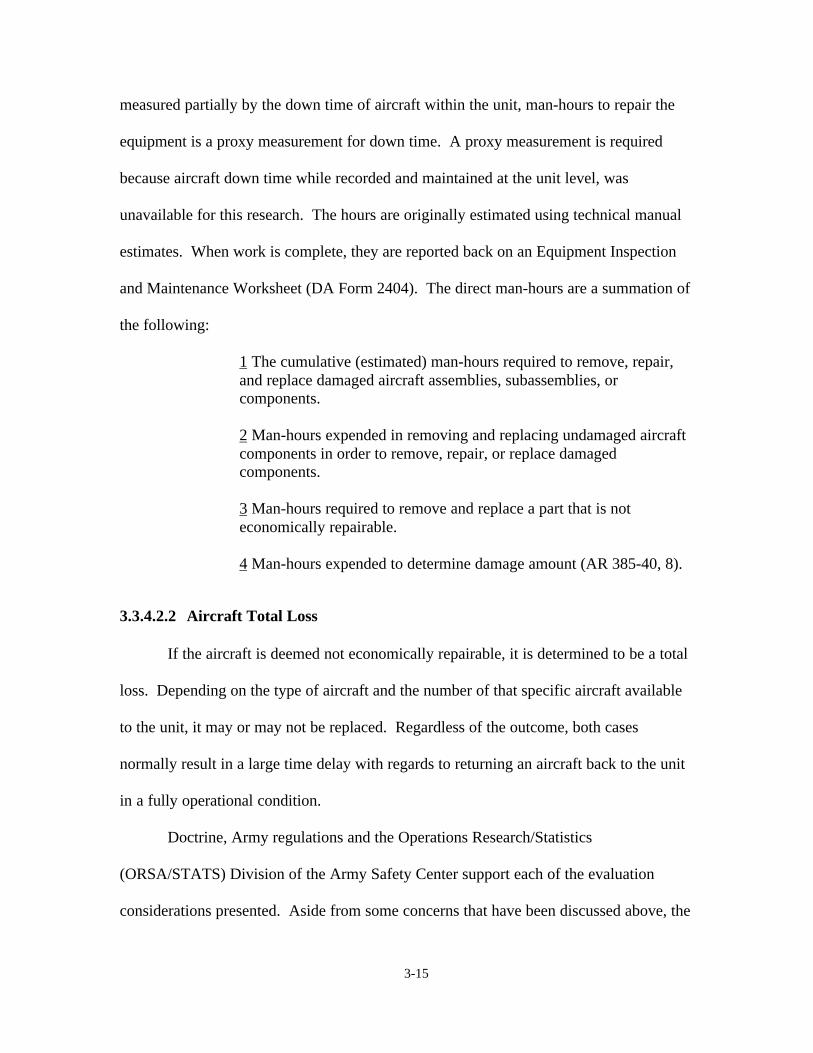
3.3.4.2.2 Aircraft Total Loss
If the aircraft is deemed not economically repairable, it is determined to be a total
loss. Depending on the type of aircraft and the number of that specific aircraft available
to the unit, it may or may not be replaced. Regardless of the outcome, both cases
normally result in a large time delay with regards to returning an aircraft back to the unit
in a fully operational condition.
Doctrine, Army regulations and the Operations Research/Statistics
(ORSA/STATS) Division of the Army Safety Center support each of the evaluation
considerations presented. Aside from some concerns that have been discussed above, the
3-15

evaluation considerations have been developed in sufficient detail, are mutually
exclusive.
3.4 Single Dimensional Value Functions
The previous section presented a summary of each evaluation measure; this section
will cover the procedure for determining the piecewise linear single dimension value
functions developed in this study. The range specified for each measure represents the
range of the expected values of all accidents for that measure. To determine the value
functions, relative value increments needed to be specified between each of the possible
evaluation measure scores (Kirkwood, 62). The severity functions were developed
during an interview with LTC Oren Hunsaker, the Operations Research and Statistics
Division Chief at the U.S. Army Safety Center. LTC Hunsaker is an Army Aviator with
over 18 years experience in the field of Army Aviation.
3.4.1 Degree of injury or illness:
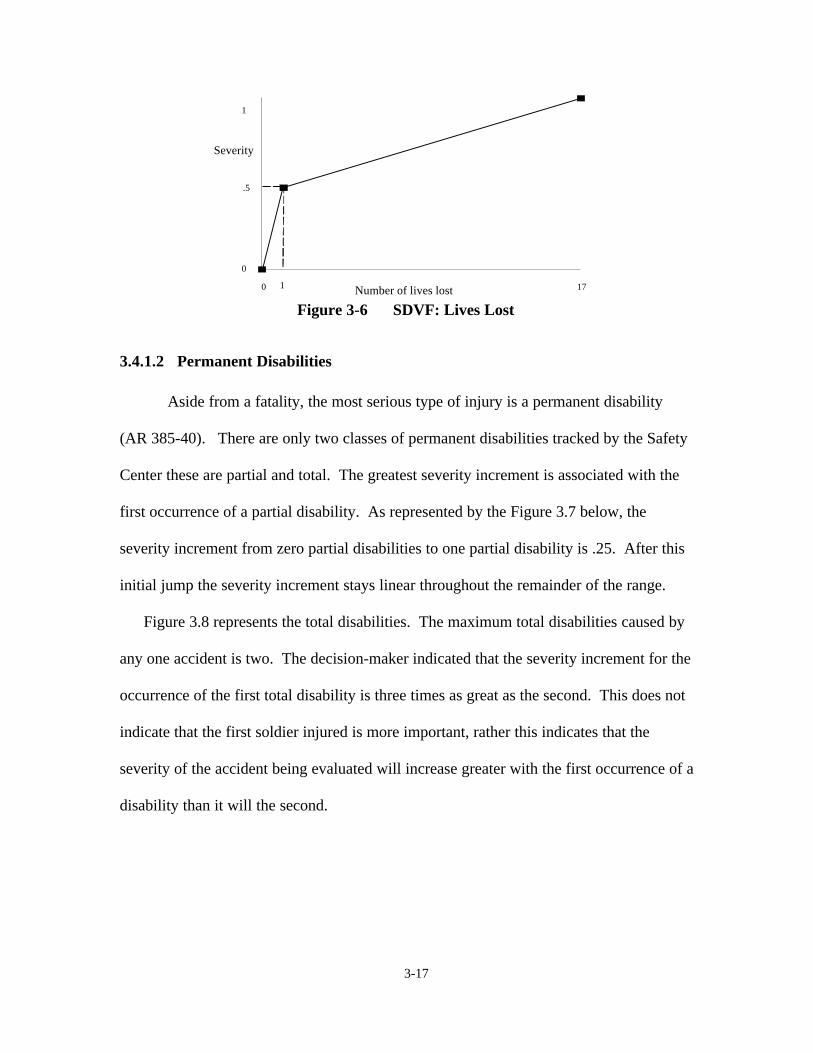
3.4.1.1 Loss of Life
The range of the number of lives lost across all accidents varies from 0 to 17. As
soon as an accident causes 1 fatality the severity function increases to a severity of .5.
After the first fatality the function becomes linear which represents that the severity
increment of each additional life is equal. The decision-maker expressed a zero tolerance
for loss of life. Still, he felt there should be a substantial increase in the degree of injury
when one fatality versus zero fatalities occurs. Therefore the severity increment given to
an accident when one fatality occurs is more drastic than when the number of fatalities
increases from one to two.
3-16
1
Severity
.5
0
0 1 Number of lives lost 17
Figure 3-6 SDVF: Lives Lost
3.4.1.2 Permanent Disabilities
Aside from a fatality, the most serious type of injury is a permanent disability
(AR 385-40). There are only two classes of permanent disabilities tracked by the Safety
Center these are partial and total. The greatest severity increment is associated with the
first occurrence of a partial disability. As represented by the Figure 3.7 below, the
severity increment from zero partial disabilities to one partial disability is .25. After this
initial jump the severity increment stays linear throughout the remainder of the range.
Figure 3.8 represents the total disabilities. The maximum total disabilities caused by
any one accident is two. The decision-maker indicated that the severity increment for the
occurrence of the first total disability is three times as great as the second. This does not
indicate that the first soldier injured is more important, rather this indicates that the
severity of the accident being evaluated will increase greater with the first occurrence of a
disability than it will the second.
3-17

1
Severity
.25
0
1
.75
Severity
0
0 1 5 Partial Disability
Figure 3-7 SDVF: Partial Disabilities
0 1 2 Total Disability
Figure 3-8 SDVF: Total Disabilities
3.4.1.3 Time Incapacitated
Other than cost, days hospitalized is the last measure of the severity of an injury. The
function below represents the number of days an individual involved in the accident was
hospitalized, in accordance with the definition in section 3.3. The range of scores from
the current database is from 0 to 248 days (the maximum amount of days an accident
victim was hospitalized).
3-18

The consideration taken into account during the interview was the impact on both the
individual and the organization. Based on the military experience of the Chief of the
ORSA/STATS Division at the Safety Center, he felt that the first two weeks of
hospitalization causes the greatest relative impact on the victim, the family, and the unit.
After the first two weeks the function represents an equal increase in severity for each
additional day hospitalized.
1
Severity
.25
.0625
0 1 14 248Days Hospitalized
Figure 3-9 SDVF: Days Hospitalized
3.4.1.4 Injury Cost
The last metric used to determine the degree of injury is the cost of the injuries
caused by the accident (AR 385-40, 4). The basis for the severity increments depicted in
the function below are the monetary increases that contribute to the classification of an
Army accident. For a discussion of the Army mishap classification system refer to
Appendix C. The decision-maker felt the severity increment from going from a Class B
accident to a Class A accident was 5 times greater than the value increment moving from
3-19
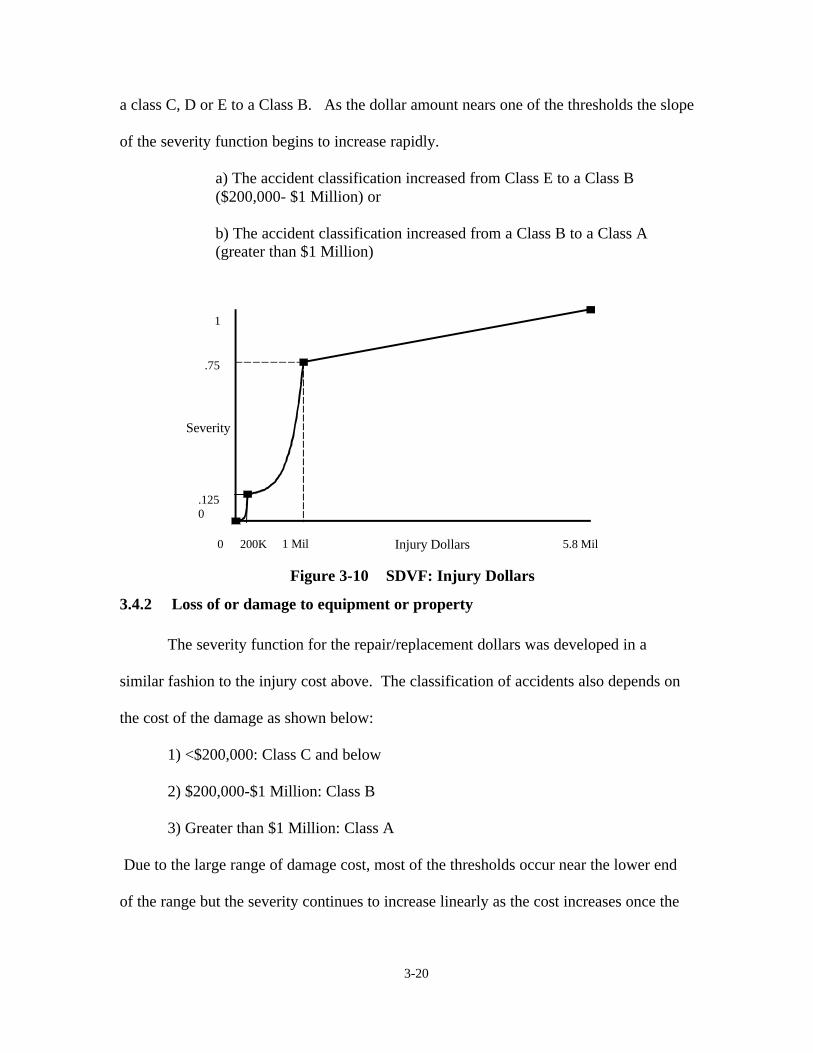
a class C, D or E to a Class B. As the dollar amount nears one of the thresholds the slope
of the severity function begins to increase rapidly.
a) The accident classification increased from Class E to a Class B ($200,000- $1 Million) or
b) The accident classification increased from a Class B to a Class A (greater than $1 Million)
1
.75
Severity
.125 0
0 200K 1 Mil Injury Dollars 5.8 Mil
Figure 3-10 SDVF: Injury Dollars
3.4.2 Loss of or damage to equipment or property
The severity function for the repair/replacement dollars was developed in a
similar fashion to the injury cost above. The classification of accidents also depends on
the cost of the damage as shown below:
1) <$200,000: Class C and below
2) $200,000-$1 Million: Class B
3) Greater than $1 Million: Class A
Due to the large range of damage cost, most of the thresholds occur near the lower end
of the range but the severity continues to increase linearly as the cost increases once the
3-20
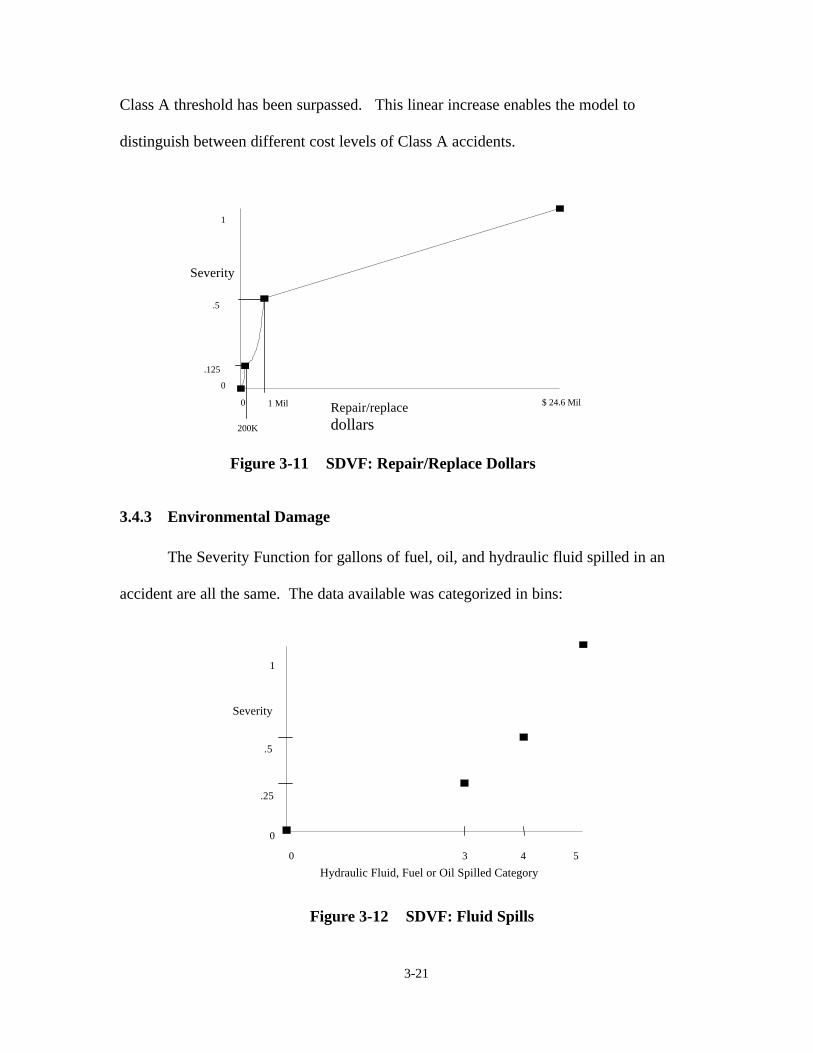
dollars
Class A threshold has been surpassed. This linear increase enables the model to
distinguish between different cost levels of Class A accidents.
1
Severity
.5
.125
0
Repair/replace 0 $ 24.6 Mil 1 Mil
200K
Figure 3-11 SDVF: Repair/Replace Dollars
3.4.3 Environmental Damage
The Severity Function for gallons of fuel, oil, and hydraulic fluid spilled in an
accident are all the same. The data available was categorized in bins:
1
Severity
.5
.25
0
0 3 4 5
Hydraulic Fluid, Fuel or Oil Spilled Category
Figure 3-12 SDVF: Fluid Spills
3-21
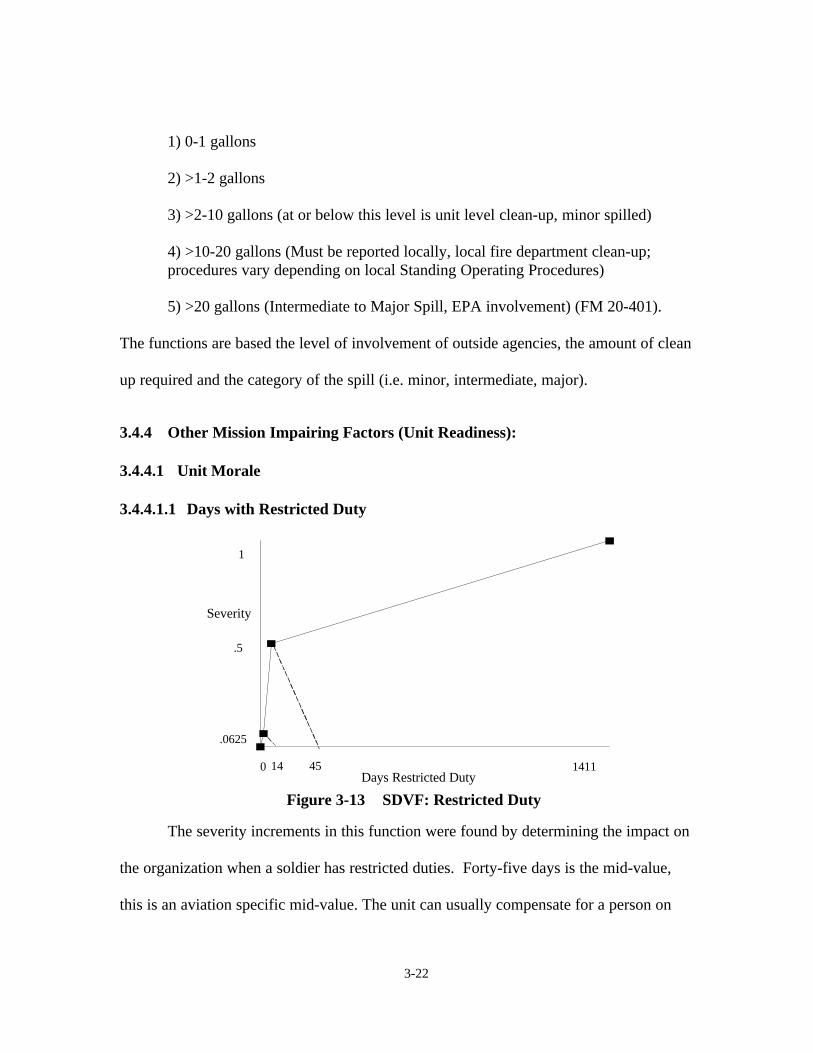
1) 0-1 gallons
2) >1-2 gallons
3) >2-10 gallons (at or below this level is unit level clean-up, minor spilled)
4) >10-20 gallons (Must be reported locally, local fire department clean-up; procedures vary depending on local Standing Operating Procedures)
5) >20 gallons (Intermediate to Major Spill, EPA involvement) (FM 20-401).
The functions are based the level of involvement of outside agencies, the amount of clean
up required and the category of the spill (i.e. minor, intermediate, major).
3.4.4 Other Mission Impairing Factors (Unit Readiness):
3.4.4.1 Unit Morale
3.4.4.1.1 Days with Restricted Duty
1
Severity
.5
.0625
0 14 45 1411 Days Restricted Duty
Figure 3-13 SDVF: Restricted Duty
The severity increments in this function were found by determining the impact on
the organization when a soldier has restricted duties. Forty-five days is the mid-value,
this is an aviation specific mid-value. The unit can usually compensate for a person on
3-22
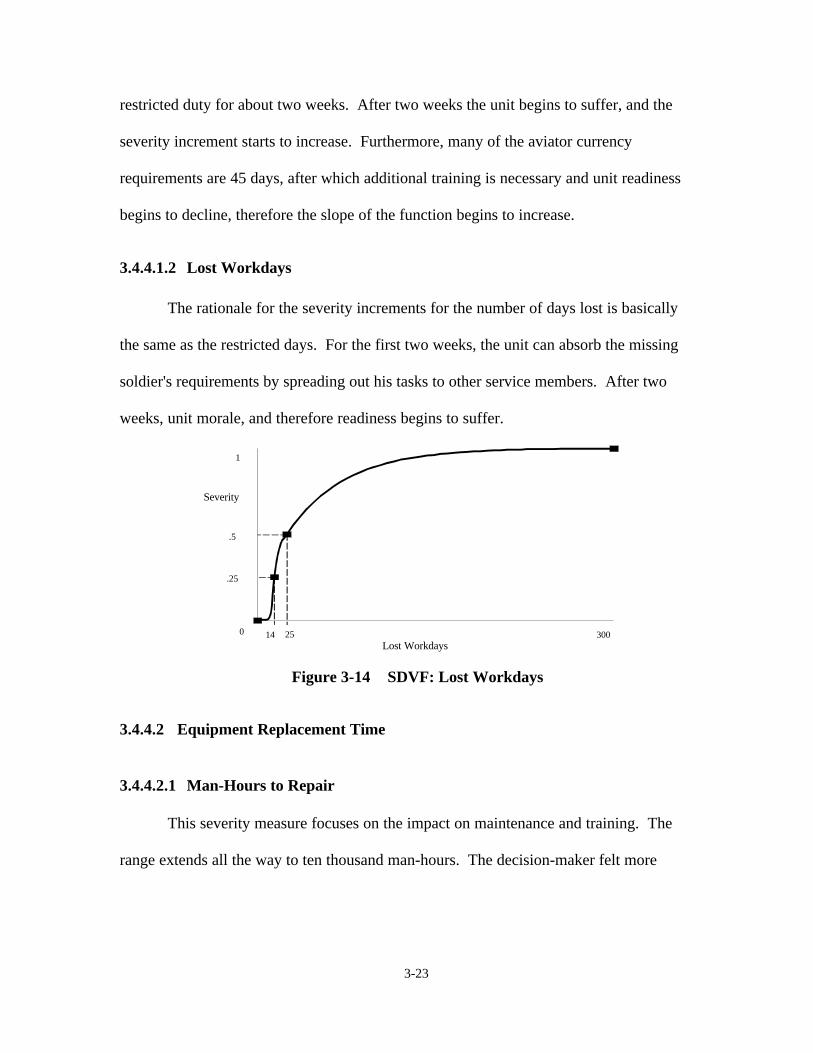
restricted duty for about two weeks. After two weeks the unit begins to suffer, and the
severity increment starts to increase. Furthermore, many of the aviator currency
requirements are 45 days, after which additional training is necessary and unit readiness
begins to decline, therefore the slope of the function begins to increase.
3.4.4.1.2 Lost Workdays
The rationale for the severity increments for the number of days lost is basically
the same as the restricted days. For the first two weeks, the unit can absorb the missing
soldier's requirements by spreading out his tasks to other service members. After two
weeks, unit morale, and therefore readiness begins to suffer.
1
Severity
.5
.25
0 14 25 300 Lost Workdays
Figure 3-14 SDVF: Lost Workdays
3.4.4.2 Equipment Replacement Time
3.4.4.2.1 Man-Hours to Repair
This severity measure focuses on the impact on maintenance and training. The
range extends all the way to ten thousand man-hours. The decision-maker felt more
3-23

comfortable translating this range into a more useful scale. Therefore, to determine the
severity increments, hours were converted to weeks using the following conversion:
100 man-hours = 1 week * 2 Maintenance Personnel * 50 Hours/week
In these terms, the effect on a unit is as follows:
1 from 0-400 hrs (30 days) the unit maintenance status report is affected, the other aircraft available in the unit should be able to absorb the extra hours they will be required to fly.
2 From 400 hrs - 2400 hrs (6 months) the training of the unit starts to suffer in addition to the maintenance therefore, the slope of the function increases slightly.
3 After 6 months the organization's readiness continues to decline but at a slower rate, the unit will probably use outside aircraft support.
1
S e v e r i t y
. 5
. 0 3 1 2 5
0 2 0 0 2 4 0 0 1 0 4 0 0 M a n H o u r s t o R e p a i r
Figure 3-15 SDVF: Man-hours to Repair
3.4.4.2.2 Aircraft Total Loss
1
Severity
0
No Yes Total Loss
Figure 3-16 SDVF: Total Loss
3-24
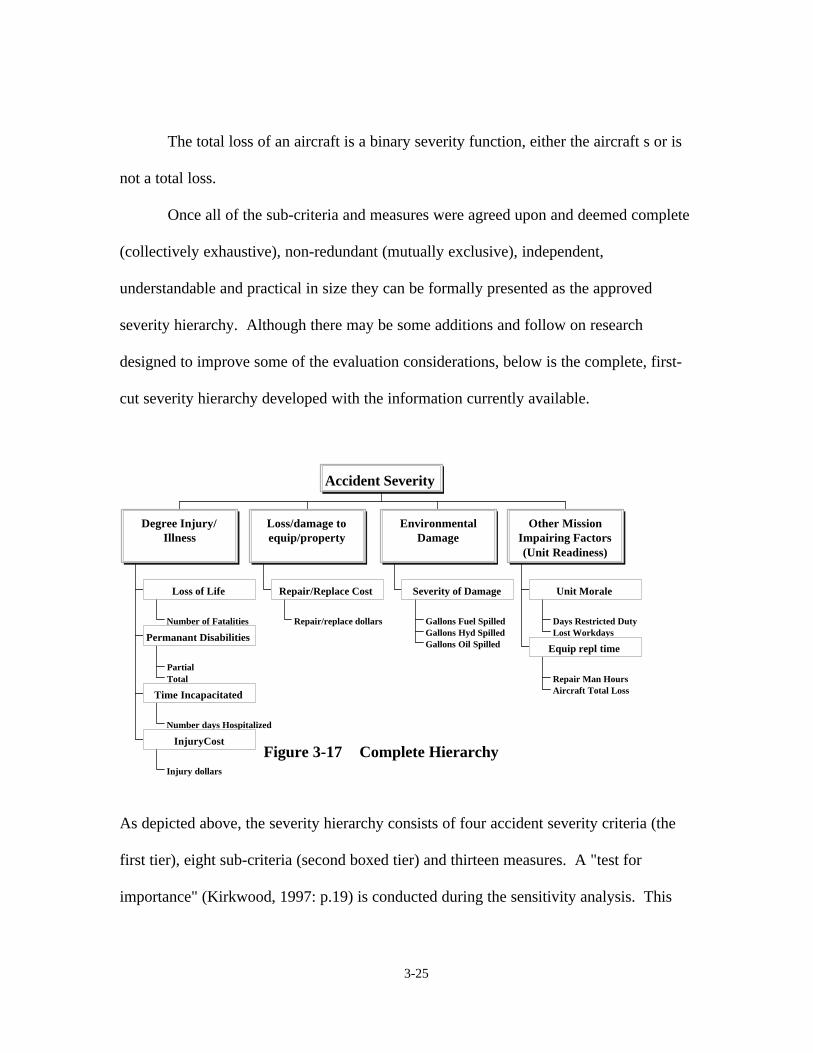
The total loss of an aircraft is a binary severity function, either the aircraft s or is
not a total loss.
Once all of the sub-criteria and measures were agreed upon and deemed complete
(collectively exhaustive), non-redundant (mutually exclusive), independent,
understandable and practical in size they can be formally presented as the approved
severity hierarchy. Although there may be some additions and follow on research
designed to improve some of the evaluation considerations, below is the complete, first
cut severity hierarchy developed with the information currently available.
Number of Fatalities
Loss of Life
Partial Total
Permanant Disabilities
Number days Hospitalized
Time Incapacitated
Injury dollars
InjuryCost
Degree Injury/ Illness
Repair/replace dollars
Repair/Replace Cost
Loss/damage to equip/property
Gallons Fuel Spilled Gallons Hyd Spilled Gallons Oil Spilled
Severity of Damage
Environmental Damage
Days Restricted Duty Lost Workdays
Unit Morale
Repair Man Hours Aircraft Total Loss
Equip repl time
Other Mission Impairing Factors (Unit Readiness)
Accident Severity
Figure 3-17 Complete Hierarchy
As depicted above, the severity hierarchy consists of four accident severity criteria (the
first tier), eight sub-criteria (second boxed tier) and thirteen measures. A "test for
importance" (Kirkwood, 1997: p.19) is conducted during the sensitivity analysis. This
3-25

test indicates whether variations within the measure or evaluation consideration could
change the preferred alternative.
3.5 Assessing Weights
Commonly, the single dimensional severity functions are designed so that each
function equals zero for the least preferred level and one for the most preferred level
(Kirkwood, 1997:68). This is not the case for the value functions described in this paper.
By design, the accident that receives the highest score, when evaluated using this severity
hierarchy, is the most severe. Therefore, the most severe, or the least preferred scores,
will equal one and the most preferred will score zero.
Given these properties of the single dimensional value functions, "it follows that
the weight for an evaluation measure is equal to the increment (or decrement) in value
that is received from moving the score from its (most) preferred level to its (least)
preferred level" (Kirkwood, 1997:68). This is the basis for determining the decision
maker's weights for each criterion using the swing weight method. The assessment of the
weights took place during an interview with COL Warren, Deputy Commander of the
Army Safety Center. The weights were assessed in two ways. The first tier was assessed
using swing weighting and the second tier and measures were assessed directly.
During the swing weighting procedure a base criterion was established, one by
which the other criteria would be compared. This base criterion was the loss or damage
to equipment or property. This was the easiest and most logical because the criterion
contained only one measure. The first step was to determine the weights of the other
three criteria relative to the base criterion. This was done by comparing the value the
decision-maker gained as one criterion increased from the lowest possible scores in each
3-26
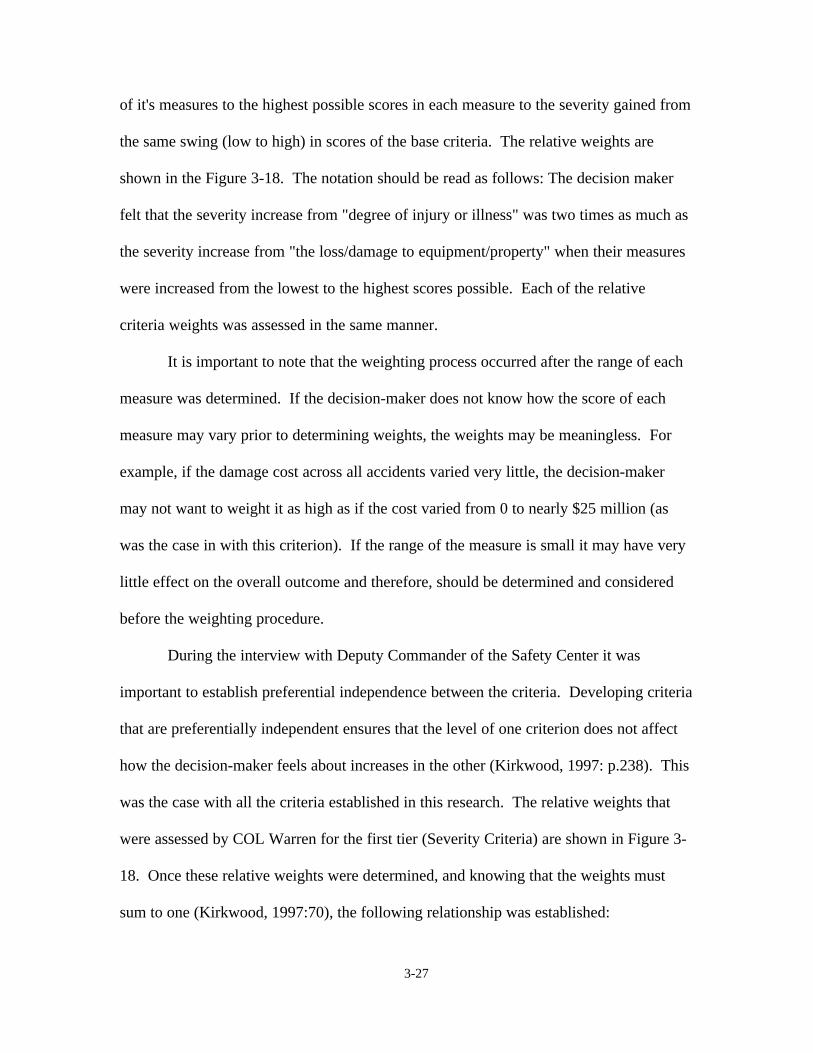
of it's measures to the highest possible scores in each measure to the severity gained from
the same swing (low to high) in scores of the base criteria. The relative weights are
shown in the Figure 3-18. The notation should be read as follows: The decision maker
felt that the severity increase from "degree of injury or illness" was two times as much as
the severity increase from "the loss/damage to equipment/property" when their measures
were increased from the lowest to the highest scores possible. Each of the relative
criteria weights was assessed in the same manner.
It is important to note that the weighting process occurred after the range of each
measure was determined. If the decision-maker does not know how the score of each
measure may vary prior to determining weights, the weights may be meaningless. For
example, if the damage cost across all accidents varied very little, the decision-maker
may not want to weight it as high as if the cost varied from 0 to nearly $25 million (as
was the case in with this criterion). If the range of the measure is small it may have very
little effect on the overall outcome and therefore, should be determined and considered
before the weighting procedure.
During the interview with Deputy Commander of the Safety Center it was
important to establish preferential independence between the criteria. Developing criteria
that are preferentially independent ensures that the level of one criterion does not affect
how the decision-maker feels about increases in the other (Kirkwood, 1997: p.238). This
was the case with all the criteria established in this research. The relative weights that
were assessed by COL Warren for the first tier (Severity Criteria) are shown in Figure 3
18. Once these relative weights were determined, and knowing that the weights must
sum to one (Kirkwood, 1997:70), the following relationship was established:
3-27
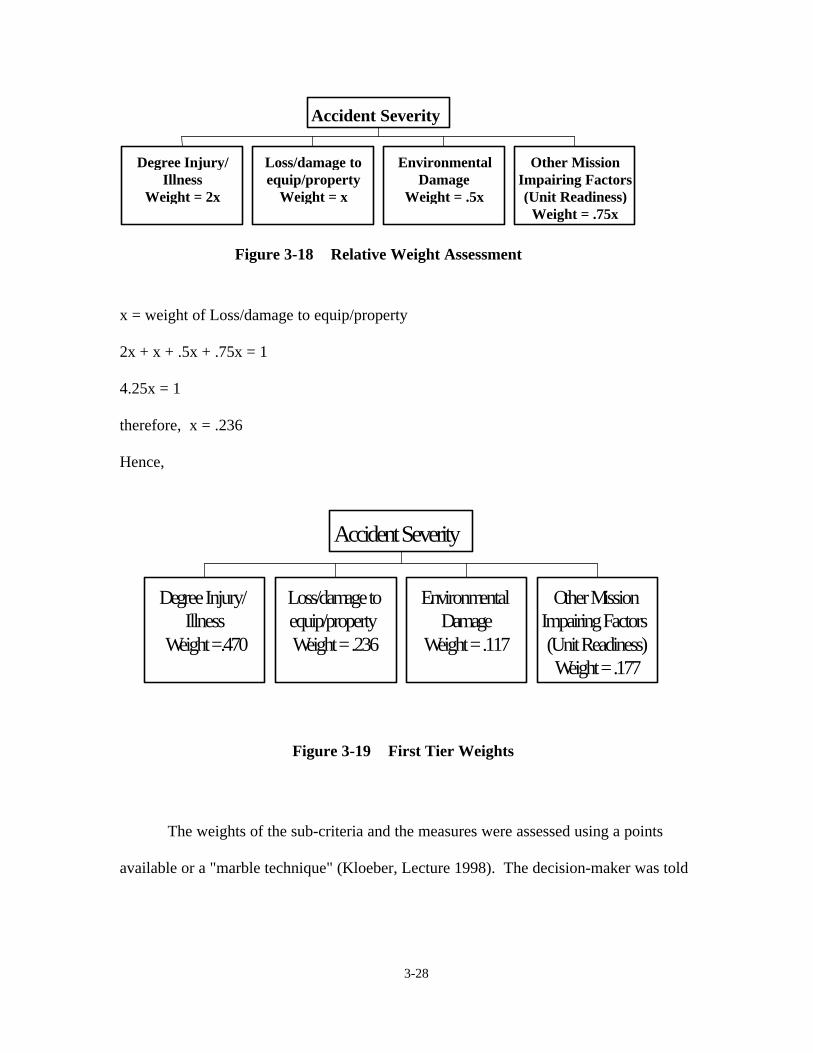
Degree Injury/ Illness
Weight = 2x
Loss/damage to equip/property
Weight = x
Environmental Damage
Weight = .5x
Other Mission Impairing Factors (Unit Readiness)
Weight = .75x
Accident Severity
Figure 3-18 Relative Weight Assessment
x = weight of Loss/damage to equip/property
2x + x + .5x + .75x = 1
4.25x = 1
therefore, x = .236
Hence,
Degree Injury/ Illness
Weight =.470
Loss/damage to equip/property Weight = .236
Environmental Damage
Weight = .117
Other Mission Impairing Factors (Unit Readiness) Weight = .177
Accident Severity
Figure 3-19 First Tier Weights
The weights of the sub-criteria and the measures were assessed using a points
available or a "marble technique" (Kloeber, Lecture 1998). The decision-maker was told
3-28
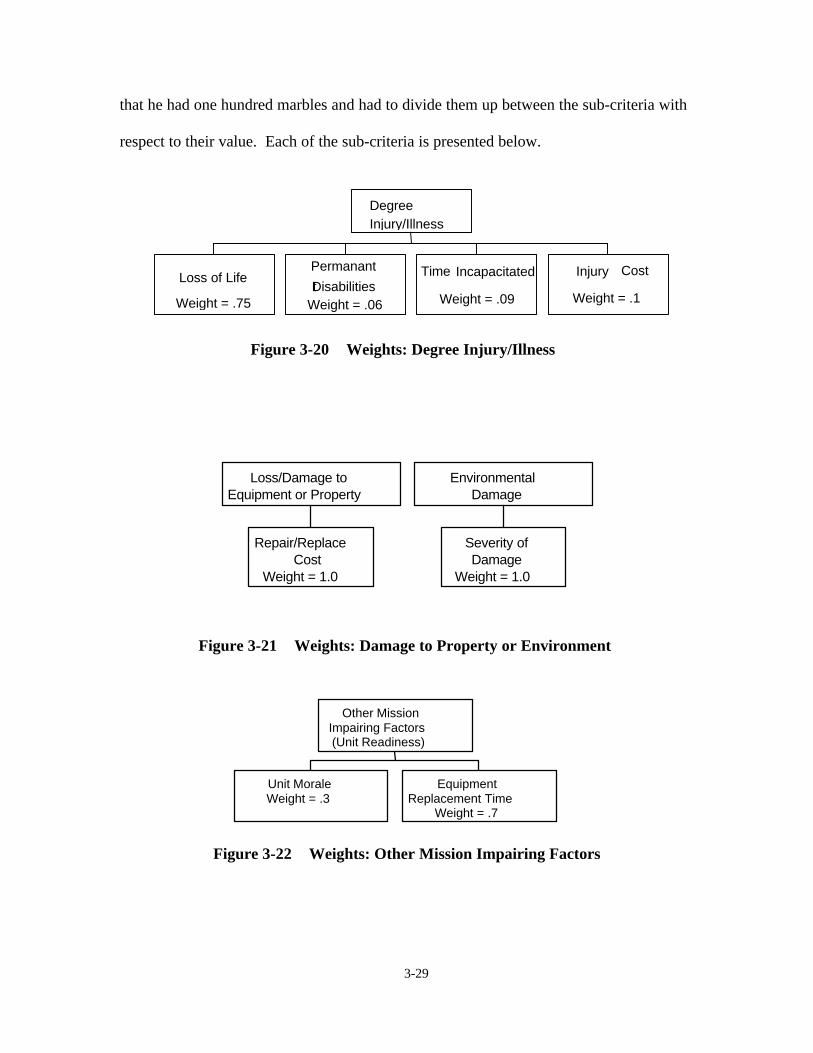
that he had one hundred marbles and had to divide them up between the sub-criteria with
respect to their value. Each of the sub-criteria is presented below.
Loss of Life
Weight = .75
Permanant
tDisabilities Weight = .06
Time Incapacitated
Weight = .09
Injury Cost
Weight = .1
Degree Injury/Illness
Figure 3-20 Weights: Degree Injury/Illness
Repair/Replace Cost
Weight = 1.0
Loss/Damage to Equipment or Property
Severity of Damage
Weight = 1.0
Environmental Damage
Figure 3-21 Weights: Damage to Property or Environment
Unit Morale Weight = .3
Equipment Replacement Time
Weight = .7
Other Mission Impairing Factors (Unit Readiness)
Figure 3-22 Weights: Other Mission Impairing Factors
3-29

This results in the following global weights:
Repair/replace dollars 0.236
Repair/replace cost 0.236
damage to equip/prop 0.236
Injury Dollars 0.047
injury cost 0.047
Number of lives lost 0.352
Loss of Life 0.352
Partial Disability 0.014
Total Disability 0.014
Permanant Disabilities 0.028
Days Hospitalized 0.042
Time Incapacitated 0.042
Degree injury/illness 0.470
Gal Fuel Spilled 0.039
Gal Hyd Spilled 0.039
Gal Oil Spilled 0.039
severity of damage 0.117
Environmental damage 0.117
Man Hours to Repair 0.062
Total Loss 0.062
Equip Repl Time 0.124
Days Restricted Duty 0.035
Lost Workdays 0.018
Unit Morale 0.053
Other MSN Factors 0.177
Accident Severity 1.000
Figure 3-23 Weights: Global
3-30

3.6 Converting Value (Severity) to Utility (Severity[U])
Although all of the measures contain uncertainty, there were three measures that
the decision-maker felt contained a level of uncertainty that he was uncomfortable with
and wished to account for. These measures are: Number of man-hours to repair, damage
cost, cost of injury. To account for the uncertainty in these measures the value functions
are converted to utility functions. Once this conversion is done, all the scores will be
referred to as severity(u) scores. This conversion is accomplished by establishing the
decision-maker's risk aversion for the attributes in question. During the interview with
ORSA/STATS Division Chief it was established that his risk aversion could be assumed
to be constant. Therefore, the severity(u) function can be developed by establishing his
risk aversion constant, ri and applying it to the exponential equation below:
U(x) = ( (1- exp [-v(x)/ ri ])/(1- exp(-1/ri )), for ri „ Infinity (equation 1)
U(x) = V(x), for ri = Otherwise (Kirkwood, 1997: p.164)
The method that was used to establish the ri was the "lottery question". The idea is to
find a specific level that the decision-maker is indifferent about which side of the bet to
take method (Clemen, 1996, p. 269). In order to do this the decision-maker was
presented with a lottery that involved a 50% chance of receiving either the highest or the
lowest score in each measure. The decision-maker then chose a value between those
numbers that, if he was guaranteed to receive that value, he would be indifferent to the
lottery or the guaranteed value. This value is referred to as the certainty equivalent (CE)
or indifference point. The Table 2 represents the lottery questions asked to the decision
maker for each measure and his final certainty equivalent.
3-31
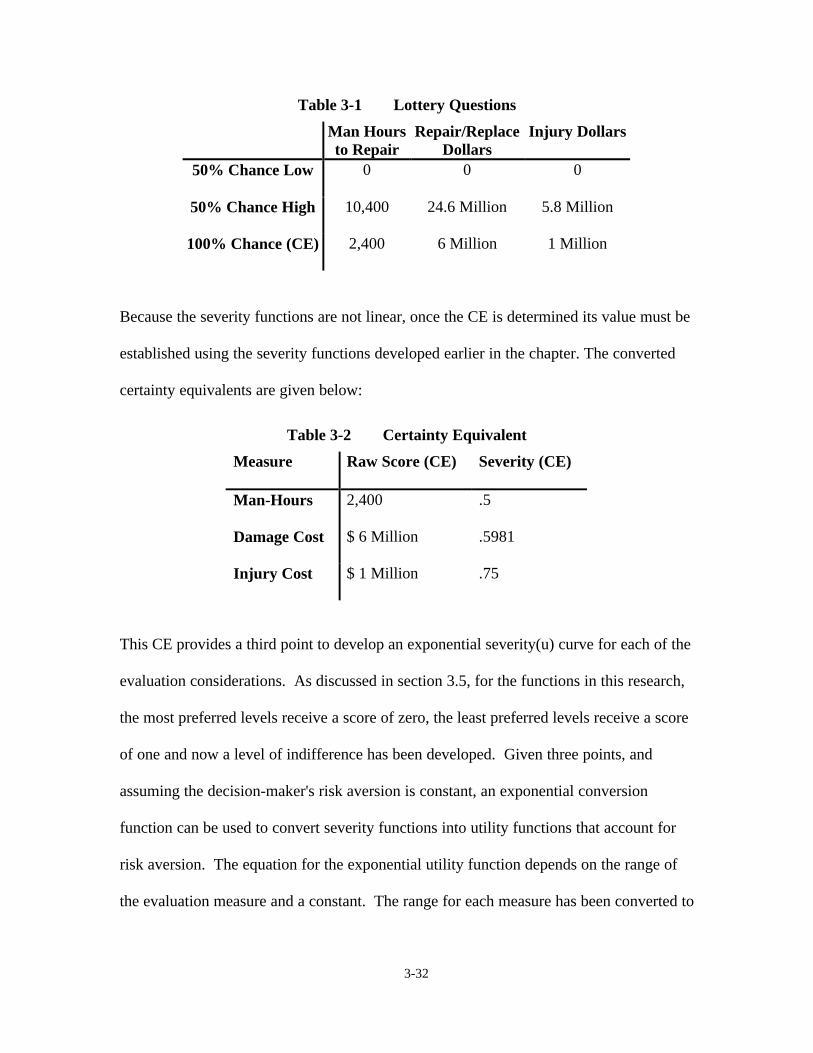
Table 3-1 Lottery Questions
Man Hours to Repair
Repair/Replace Dollars
Injury Dollars
50% Chance Low 0 0 0
50% Chance High 10,400 24.6 Million 5.8 Million
100% Chance (CE) 2,400 6 Million 1 Million
Because the severity functions are not linear, once the CE is determined its value must be
established using the severity functions developed earlier in the chapter. The converted
certainty equivalents are given below:
Table 3-2 Certainty Equivalent
Measure Raw Score (CE) Severity (CE)
Man-Hours 2,400 .5
Damage Cost $ 6 Million .5981
Injury Cost $ 1 Million .75
This CE provides a third point to develop an exponential severity(u) curve for each of the
evaluation considerations. As discussed in section 3.5, for the functions in this research,
the most preferred levels receive a score of zero, the least preferred levels receive a score
of one and now a level of indifference has been developed. Given three points, and
assuming the decision-maker's risk aversion is constant, an exponential conversion
function can be used to convert severity functions into utility functions that account for
risk aversion. The equation for the exponential utility function depends on the range of
the evaluation measure and a constant. The range for each measure has been converted to
3-32
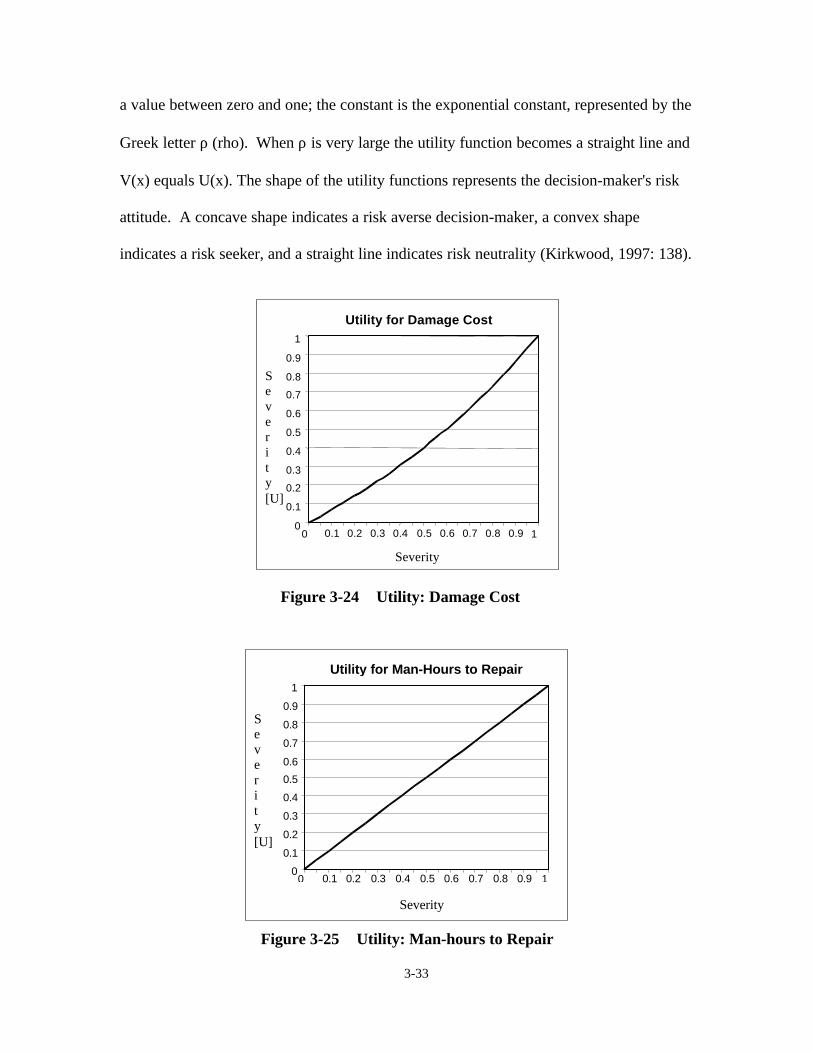
a value between zero and one; the constant is the exponential constant, represented by the
Greek letter r (rho). When r is very large the utility function becomes a straight line and
V(x) equals U(x). The shape of the utility functions represents the decision-maker's risk
attitude. A concave shape indicates a risk averse decision-maker, a convex shape
indicates a risk seeker, and a straight line indicates risk neutrality (Kirkwood, 1997: 138).
Utility for Damage Cost
0
0.1
0.2
0.3
0.4
0.5
0.6
0.7
0.8
0.9
1
0 0.1 0.2 0.3 0.4 0.5 0.6 0.7 0.8 0.9 1
Severity
S e v e r i t y [U]
Figure 3-24 Utility: Damage Cost
Utility for Man-Hours to Repair
0
0.1
0.2
0.3
0.4
0.5
0.6
0.7
0.8
0.9
1
0 0.1 0.2 0.3 0.4 0.5 0.6 0.7 0.8 0.9 1
Severity
S e v e r i t y [U]
Figure 3-25 Utility: Man-hours to Repair
3-33

Utility for Injury Cost
0
0.1
0.2
0.3
0.4
0.5
0.6
0.7
0.8
0.9
1
0 0.1 0.2 0.3 0.4 0.5 0.6 0.7 0.8 0.9 1
Severity
S e v e r i t y [U]
Figure 3-26 Utility: Injury Cost
The severity of each accident can now be established. The rating of the severity of an
accident does not account for the probability of an accident occurring, rather this is a
measure of the expected consequence of an accident should it occur.
3.7 Establishing Accident Risk
To assess the risk of an accident one must account for the severity and the
probability of occurrence (FM 100-14, 1998: p. G-2). The database that was used
contained thirteen hundred and fifty six events, these events were categorized into sixty
five types of accidents. During an accident sequence more than one type of accident may
occur. For example, an aircraft may experience a loss of hydraulic power at a hover
which may lead to a tree strike. In this case, two types of accidents occurred. The
accident investigation team determines the primary, secondary and tertiary events in the
accident sequence. Only the primary event was used for this study. Therefore, the
probability of occurrence of an accident is given by the equation below.
3-34

Total Number of Accidenti P(Accidenti) =
Total Number of Army Rotary Wing Accidents
This research assumes that an accident has occurred, therefore the probabilities that were
used were conditional probabilities. These conditional probabilities are listed in
Appendix E.
3.8 Hazard to Accident Association
Individual hazards can result in various types of accidents. In order to establish
the severity of a hazardi, the severity of all the accidents that were a result of hazardi must
be summed up in the following manner.
94
Severity of Hazardi = � P(Accidentj | Hazardi) *Severity (Accidentj) j -1
To determine the conditional probability that Accidenti occurred given that Hazardj
occurred, P(Accidenti | Hazardj), the database had to be manipulated. A primary hazard
was associated with each accident. Once the hazards and accidents were organized into a
matrix format each conditional probability could be accessed. The law of total
probability was used to confirm that these probabilities were correct. By viewing the
sample space, S (Hazardj), as a union of mutually exclusive subsets the law of total
probability can be used:
3-35
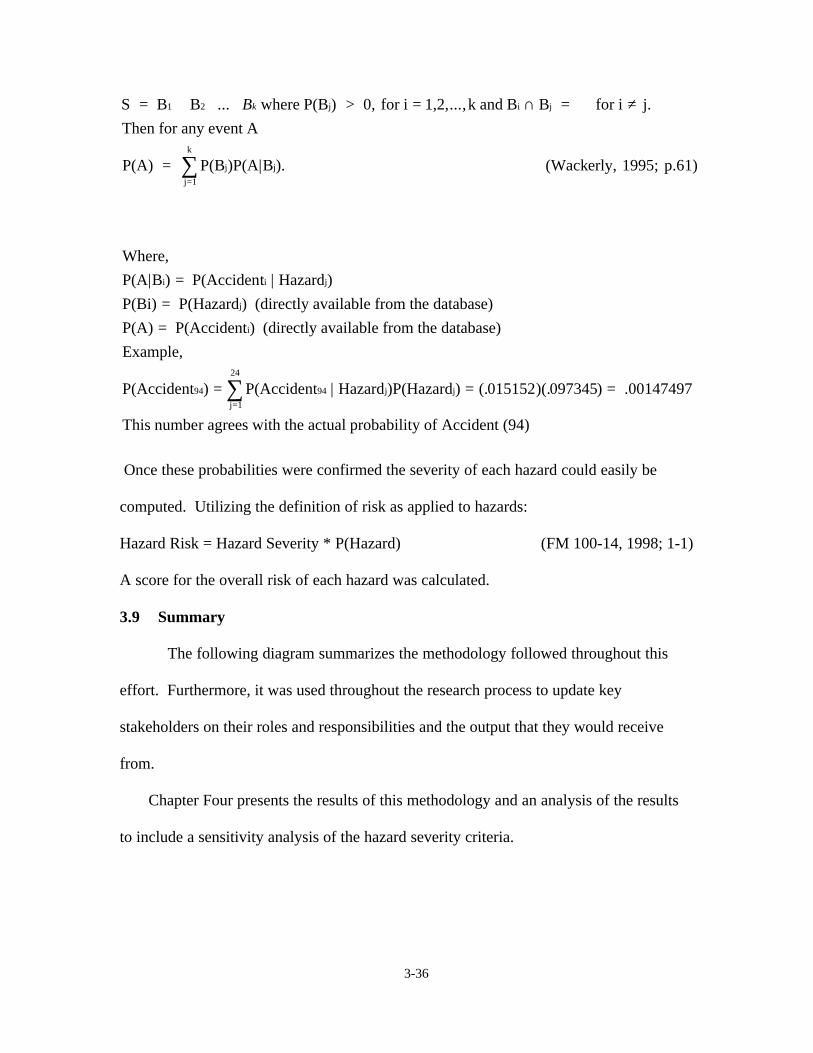
S = B1 ¨ B2¨...̈ Bk where P(Bj) > 0, for i = 1,2,...,k and Bi
Then for any event A k
P(A) = � P(Bj)P(A|Bj). j=1
Where,
P(A|Bi) = P(Accidenti | Hazardj)
P(Bi) = P(Hazardj) (directly available from the database)
P(A) = P(Accidenti) (directly available from the database)
Example,24
˙ Bj = ˘ for i „ j.
(Wackerly, 1995; p.61)
P(Accident94) = � P(Accident94 | Hazardj)P(Hazardj) = (.015152)(.097345) = .00147497 j=1
This number agrees with the actual probability of Accident (94)
Once these probabilities were confirmed the severity of each hazard could easily be
computed. Utilizing the definition of risk as applied to hazards:
Hazard Risk = Hazard Severity * P(Hazard) (FM 100-14, 1998; 1-1)
A score for the overall risk of each hazard was calculated.
3.9 Summary
The following diagram summarizes the methodology followed throughout this
effort. Furthermore, it was used throughout the research process to update key
stakeholders on their roles and responsibilities and the output that they would receive
from.
Chapter Four presents the results of this methodology and an analysis of the results
to include a sensitivity analysis of the hazard severity criteria.
3-36
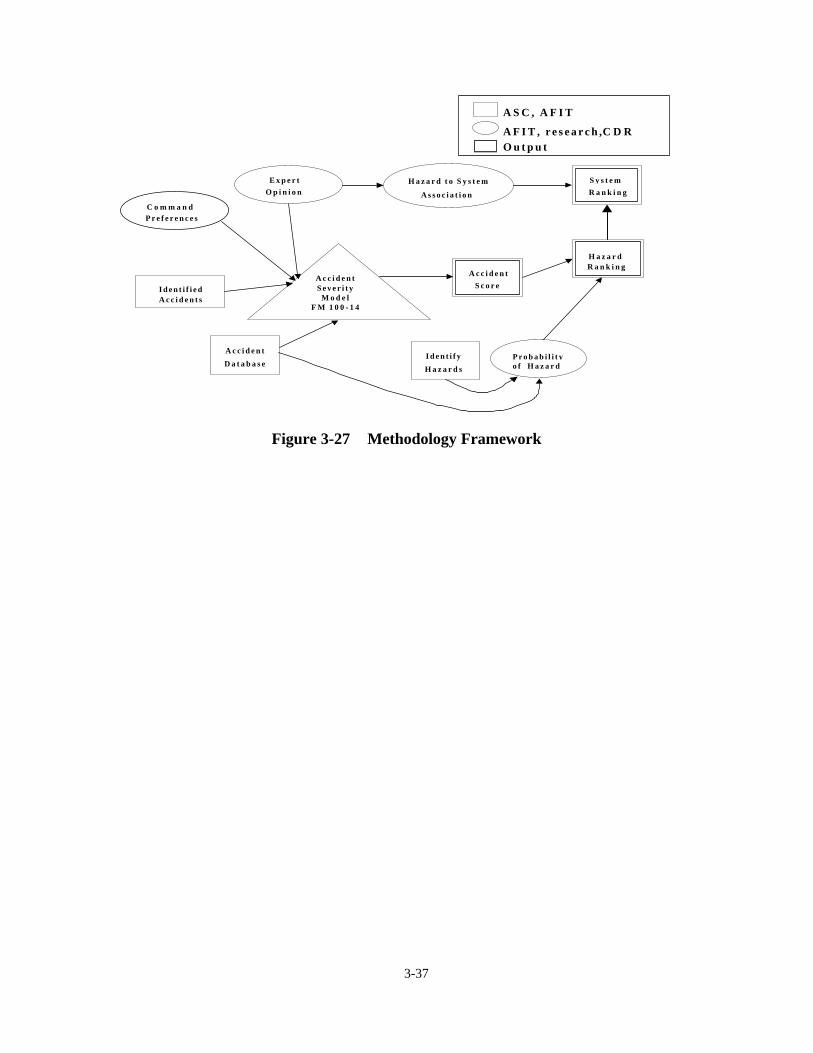
E x p e r t
O p i n i o n
C o m m a n d P r e f e r e n c e s
A c c i d e n t
D a t a b a s e
I d e n t i f i e d A c c i d e n t s
A c c i d e n t S e v e r i t y
M o d e l F M 1 0 0 - 1 4
H a z a r d t o S y s t e m
A s s o c i a t i o n
S y s t e m
R a n k i n g
A S C , A F I T
A F I T , r e s e a r c h ,C D R O u t p u t
P r o b a b i l i t y o f
I d e n t i f y
H a z a r d s
A c c i d e n t
S c o r e
H a z a r d R a n k i n g
H a z a r d
Figure 3-27 Methodology Framework
3-37
4 Results and Analysis
4.1 Introduction
This chapter presents the results from the analysis of the deterministic and
probabilistic model that was developed in Chapter Three. There were sixty-five
categories of accidents analyzed using the value-focused model. The total scores and
scores categorized by criteria are presented. The deterministic view indicated the pure
severity of accidents and hazards. The probabilistic portion focuses on the drastic change
in the ranking of accidents and hazards when the probability of occurrence is accounted
for. Finally, the sensitivity of each of the top-level criteria in the value hierarchy is
analyzed for its effect on both accidents and hazard severity.
4.2 Accident Severity
Each of the thirteen hundred and fifty six accidents was categorized into one of
sixty-five types of accidents. These categories are defined by AR 385-40 and presented in
Appendix A. There are two approaches for determining the severity of each accident. If
all of the severity functions are linear, the severity can be assessed by taking the average
raw scores in each category then determining the value of that score. The severity
functions in this study were not linear. They were a combination of piecewise linear and
exponential functions and therefore, averages could not be used. Each individual
occurrence of an accident had to be scored separately. The expected value for the
severity of each accident was determined by calculating the severity for each single
dimensional severity function then multiplying the expected values by their
corresponding weights and finally summing the results (Kirkwood, 1997: 158). Hence,
4-1
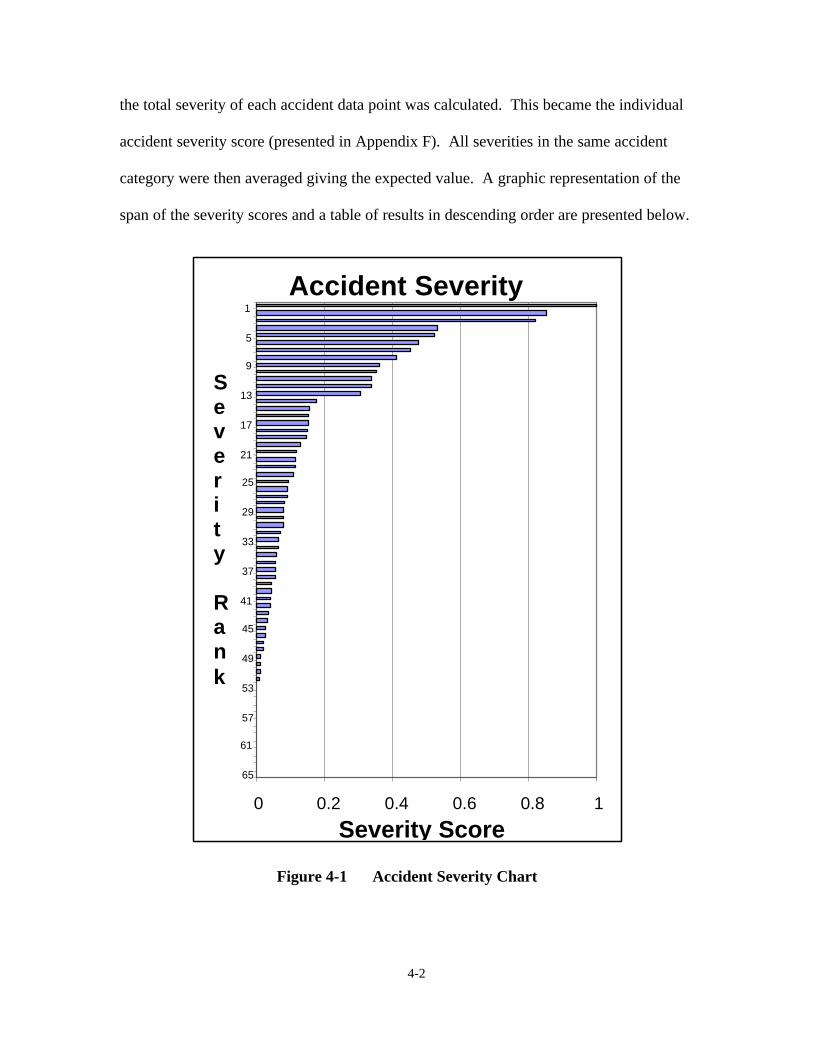
the total severity of each accident data point was calculated. This became the individual
accident severity score (presented in Appendix F). All severities in the same accident
category were then averaged giving the expected value. A graphic representation of the
span of the severity scores and a table of results in descending order are presented below.
Accident Severity
0 0.2 0.4 0.6 0.8 1
65
61
57
53
49
45
41
37
33
29
25
21
17
13
9
5
1
S e v e r i t y
R a n k
Severity Score
Figure 4-1 Accident Severity Chart
4-2

1
2
3
4
5
6
7
8
9
10
11
12
13
14
15
16
17
18
19
20
21
22
23
24
25
26
27
28
29
30
31
32
33
Table 4-1 Accident Severity Scores
Rank Definition Normalized
Score Actual Score
SPIN/STALL 1.0000 0.3835
ELECTRICAL SYSTEM 0.8491 0.3256
INFLIGHT BREAKUP 0.8214 0.3150
INFLIGHT BREAKUP-MAST BUMPING 0.5341 0.2048
COLLISION WITH GROUND/WATER 0.5227 0.2004
ABANDONED AIRCRAFT 0.4752 0.1822
FIRE AND/OR EXPLOSION IN THE AIR 0.4492 0.1723
MULTIPLE AIRCRAFT EVENT 0.4100 0.1572
UNDERSHOOT 0.3601 0.1381
WIRE STRIKE 0.3523 0.1351
EXCESSIVE YAW/SPIN 0.3363 0.1290
BROWNOUT 0.3363 0.1290
FUEL STARVATION 0.3044 0.1167
MOC 0.1777 0.0681
ROTOR/PROP WASH 0.1572 0.0603
ENGINE FAILURE/OVERSPEED/OVERTEMP 0.1522 0.0584
FIRE AND/OR EXPLOSION ON THE GROUND 0.1520 0.0583
DITCHING 0.1491 0.0572
AIR TO GROUND COLLISION 0.1457 0.0559
FUEL EXHAUSTION 0.1276 0.0489
REFUELING OPERATIONS 0.1187 0.0455
POWER TRAIN 0.1129 0.0433
GROUND LOOP/SWERVE 0.1127 0.0432
AIRFRAME 0.1090 0.0418
INSTRUMENTS 0.0946 0.0363
PRECAUTIONARY LANDING 0.0921 0.0353
FORCED LANDING 0.0910 0.0349
WEAPONS RELATED 0.0812 0.0311
TREE STRIKE 0.0804 0.0308
ENGINE OVERTORQUE/OVERLOAD 0.0786 0.0301
OVERSTRESS 0.0769 0.0295
PERSONNEL HANDLING EVENT 0.0710 0.0272
HUMAN FACTOR EVENT 0.0617 0.0237
4-3
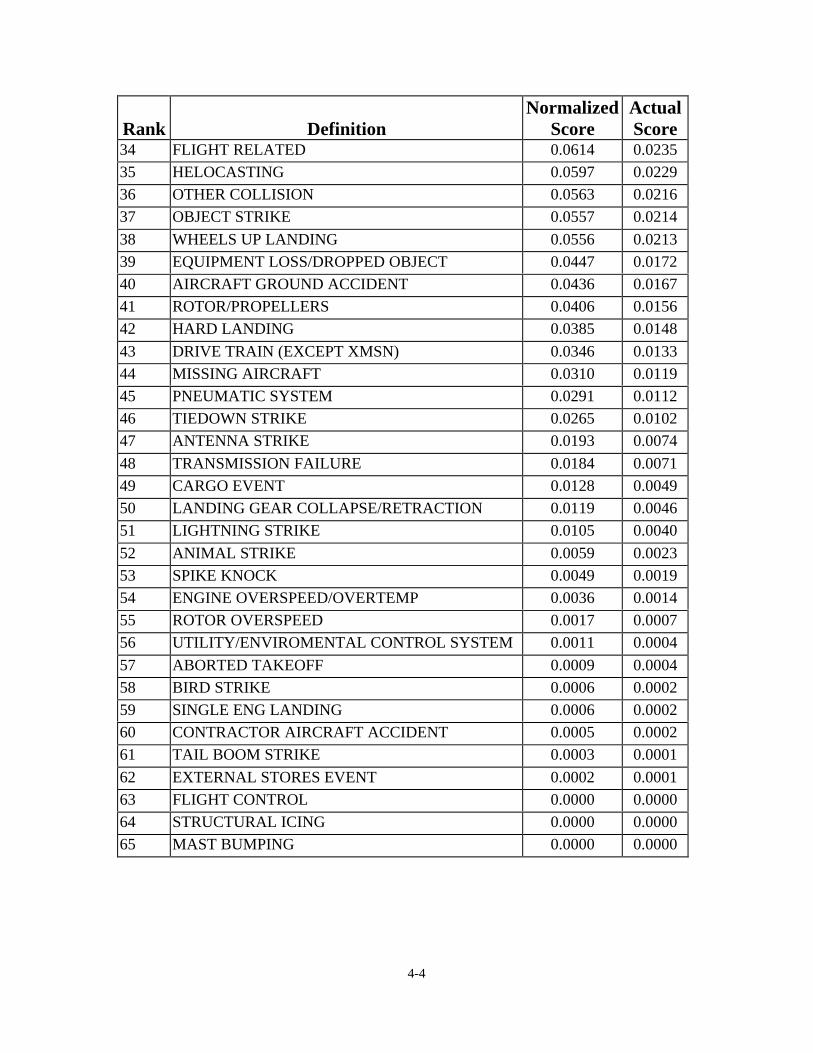
Rank Definition Normalized
Score Actual Score
34 FLIGHT RELATED 0.0614 0.0235
35 HELOCASTING 0.0597 0.0229
36 OTHER COLLISION 0.0563 0.0216
37 OBJECT STRIKE 0.0557 0.0214
38 WHEELS UP LANDING 0.0556 0.0213
39 EQUIPMENT LOSS/DROPPED OBJECT 0.0447 0.0172
40 AIRCRAFT GROUND ACCIDENT 0.0436 0.0167
41 ROTOR/PROPELLERS 0.0406 0.0156
42 HARD LANDING 0.0385 0.0148
43 DRIVE TRAIN (EXCEPT XMSN) 0.0346 0.0133
44 MISSING AIRCRAFT 0.0310 0.0119
45 PNEUMATIC SYSTEM 0.0291 0.0112
46 TIEDOWN STRIKE 0.0265 0.0102
47 ANTENNA STRIKE 0.0193 0.0074
48 TRANSMISSION FAILURE 0.0184 0.0071
49 CARGO EVENT 0.0128 0.0049
50 LANDING GEAR COLLAPSE/RETRACTION 0.0119 0.0046
51 LIGHTNING STRIKE 0.0105 0.0040
52 ANIMAL STRIKE 0.0059 0.0023
53 SPIKE KNOCK 0.0049 0.0019
54 ENGINE OVERSPEED/OVERTEMP 0.0036 0.0014
55 ROTOR OVERSPEED 0.0017 0.0007
56 UTILITY/ENVIROMENTAL CONTROL SYSTEM 0.0011 0.0004
57 ABORTED TAKEOFF 0.0009 0.0004
58 BIRD STRIKE 0.0006 0.0002
59 SINGLE ENG LANDING 0.0006 0.0002
60 CONTRACTOR AIRCRAFT ACCIDENT 0.0005 0.0002
61 TAIL BOOM STRIKE 0.0003 0.0001
62 EXTERNAL STORES EVENT 0.0002 0.0001
63 FLIGHT CONTROL 0.0000 0.0000
64 STRUCTURAL ICING 0.0000 0.0000
65 MAST BUMPING 0.0000 0.0000
4-4

The scores above represent the expected severity of an accident, should that
accident occur. A description of each accident is provided in Appendix A. Note from
Figure 1 and Table 1 that there is a large drop off in the severity score after the thirteenth
ranked accident. The goal of this study is to determine the top ten hazards. Although the
rankings will change when the probabilities of occurrence are applied, we will
concentrate on the top thirteen accidents at this point to identify trends. The figure
below depicts the contribution of each fundamental objective for each of the top thirteen
accidents.
0.4
0.35
0.3
0.25
0.2
0.15
0.1
0.05
0
38 91 37 52 30 39 35 8 26 51 80 48 77
Damage to Equip Prop Degree Injury/Illness Environmental Damage Other MSN Factors
Figure 4-2 Accident Severity Composition
4-5
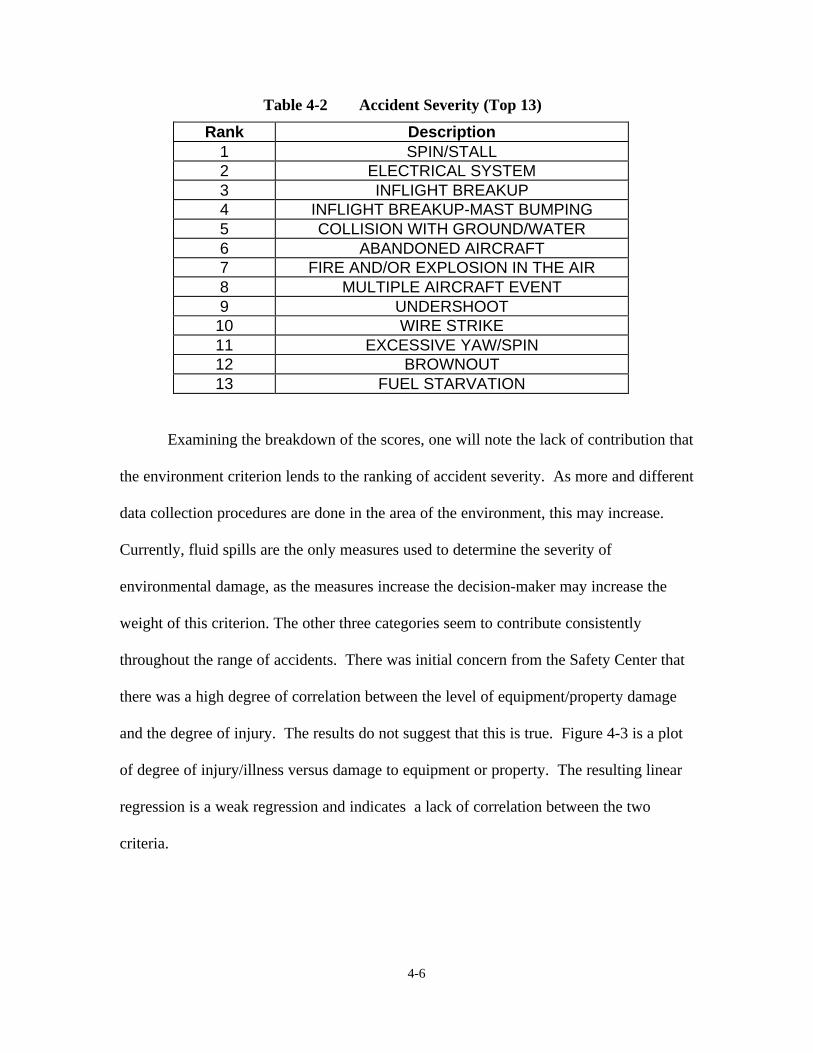
123456789
10111213
Table 4-2 Accident Severity (Top 13)
Rank Description SPIN/STALL
ELECTRICAL SYSTEM INFLIGHT BREAKUP
INFLIGHT BREAKUP-MAST BUMPING COLLISION WITH GROUND/WATER
ABANDONED AIRCRAFT FIRE AND/OR EXPLOSION IN THE AIR
MULTIPLE AIRCRAFT EVENT UNDERSHOOT WIRE STRIKE
EXCESSIVE YAW/SPIN BROWNOUT
FUEL STARVATION
Examining the breakdown of the scores, one will note the lack of contribution that
the environment criterion lends to the ranking of accident severity. As more and different
data collection procedures are done in the area of the environment, this may increase.
Currently, fluid spills are the only measures used to determine the severity of
environmental damage, as the measures increase the decision-maker may increase the
weight of this criterion. The other three categories seem to contribute consistently
throughout the range of accidents. There was initial concern from the Safety Center that
there was a high degree of correlation between the level of equipment/property damage
and the degree of injury. The results do not suggest that this is true. Figure 4-3 is a plot
of degree of injury/illness versus damage to equipment or property. The resulting linear
regression is a weak regression and indicates a lack of correlation between the two
criteria.
4-6
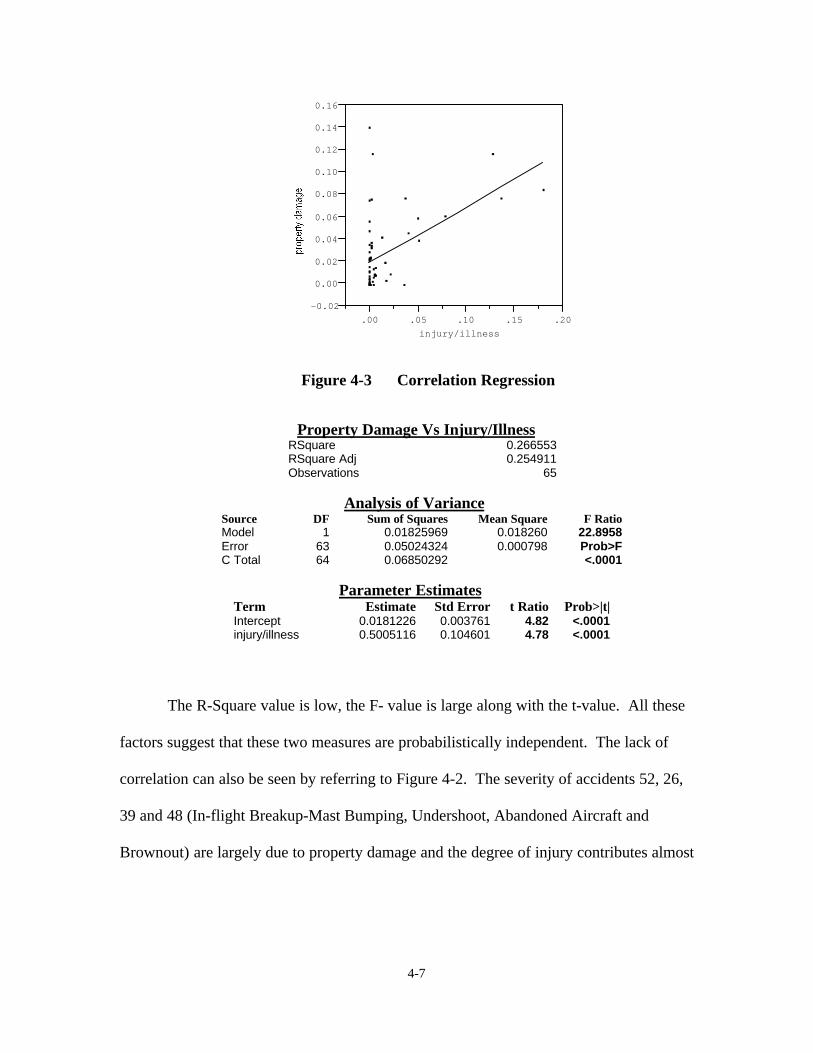
0.16
0.14
0.12
0.10
0.08
0.06
0.04
0.02
0.00
-0.02
.00 .05 .10 .15 .20
injury/illness
Figure 4-3 Correlation Regression
Property Damage Vs Injury/Illness RSquare 0.266553 RSquare Adj 0.254911 Observations 65
Analysis of Variance Source DF Sum of Squares Mean Square F Ratio Model 1 0.01825969 0.018260 22.8958 Error 63 0.05024324 0.000798 Prob>F C Total 64 0.06850292 <.0001
Parameter Estimates Term Estimate Std Error t Ratio Prob>|t| Intercept 0.0181226 0.003761 4.82 <.0001 injury/illness 0.5005116 0.104601 4.78 <.0001
The R-Square value is low, the F- value is large along with the t-value. All these
factors suggest that these two measures are probabilistically independent. The lack of
correlation can also be seen by referring to Figure 4-2. The severity of accidents 52, 26,
39 and 48 (In-flight Breakup-Mast Bumping, Undershoot, Abandoned Aircraft and
Brownout) are largely due to property damage and the degree of injury contributes almost
4-7

nothing while the severity of accidents 38 and 37 (Spin/Stall and In-flight Breakup) are
the exact opposite.
4.2.1 Degree of Injury/Illness Sensitivity
Hazard severity is a linear combination of accident severities. Therefore, to
conduct a quality sensitivity analysis for overall hazard severity it is necessary to conduct
a sensitivity analysis on accident severity. This analysis will focus on fluctuations in the
first tier criteria weights that were assigned by the decision-maker. The variation in
accident severity was examined over the full range of possible weights (0-1) for each of
the criteria; these results can be seen in Appendix H. The more important results are
shown below. The weights for each criterion were varied throughout the feasible range.
These feasible ranges of weights are the absolute minimum and maximum weights that
the decision-maker would assign to each of the criteria. For example, although the
degree of injury/illness was given a weight of .47 the decision-maker stated that he would
never assign that criterion a weight of below .30 but he would also never go above .60.
Therefore the feasible range for the degree of injury/illness is .30 to .60. As the weight of
one measure decreases the others must increase to keep the same relative ratio between
the other weights. As shown in the graph below, the overall severity score is relatively
insensitive to fluctuations, within the feasible range, of the weight of degree of injury or
illness.
4-8
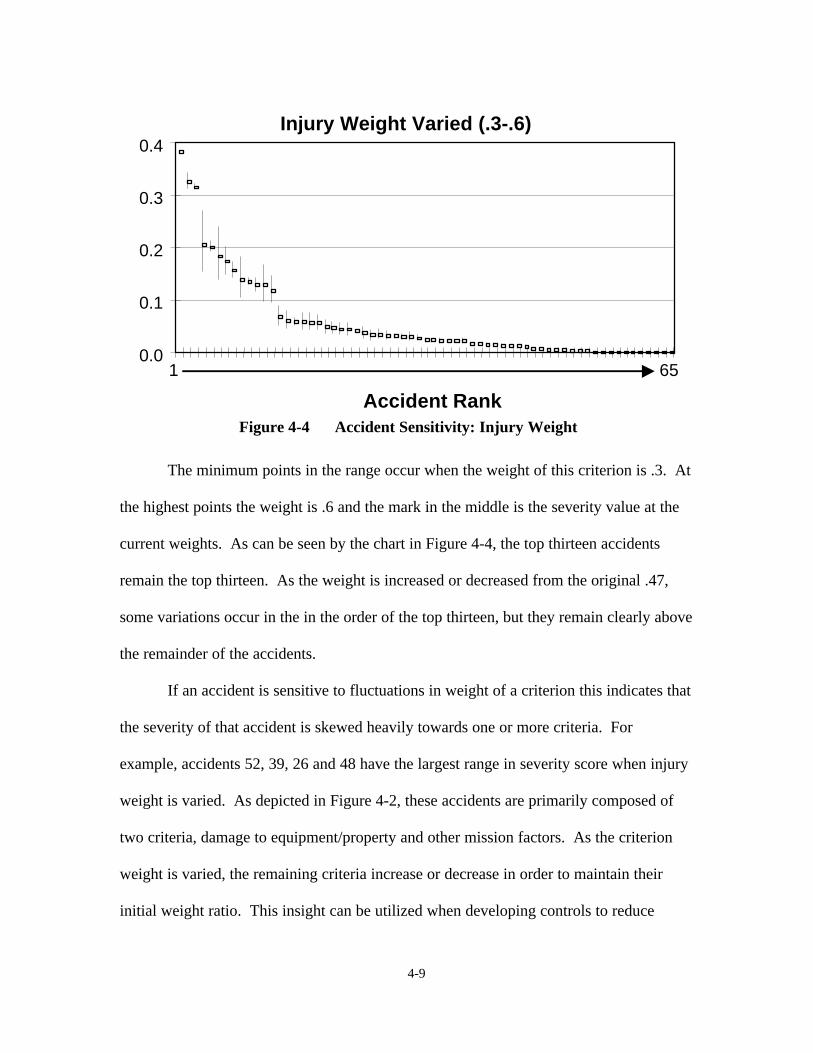
Injury Weight Varied (.3-.6)0.4
0.3
0.2
0.1
0.0 1 65
Accident Rank Figure 4-4 Accident Sensitivity: Injury Weight
The minimum points in the range occur when the weight of this criterion is .3. At
the highest points the weight is .6 and the mark in the middle is the severity value at the
current weights. As can be seen by the chart in Figure 4-4, the top thirteen accidents
remain the top thirteen. As the weight is increased or decreased from the original .47,
some variations occur in the in the order of the top thirteen, but they remain clearly above
the remainder of the accidents.
If an accident is sensitive to fluctuations in weight of a criterion this indicates that
the severity of that accident is skewed heavily towards one or more criteria. For
example, accidents 52, 39, 26 and 48 have the largest range in severity score when injury
weight is varied. As depicted in Figure 4-2, these accidents are primarily composed of
two criteria, damage to equipment/property and other mission factors. As the criterion
weight is varied, the remaining criteria increase or decrease in order to maintain their
initial weight ratio. This insight can be utilized when developing controls to reduce
4-9
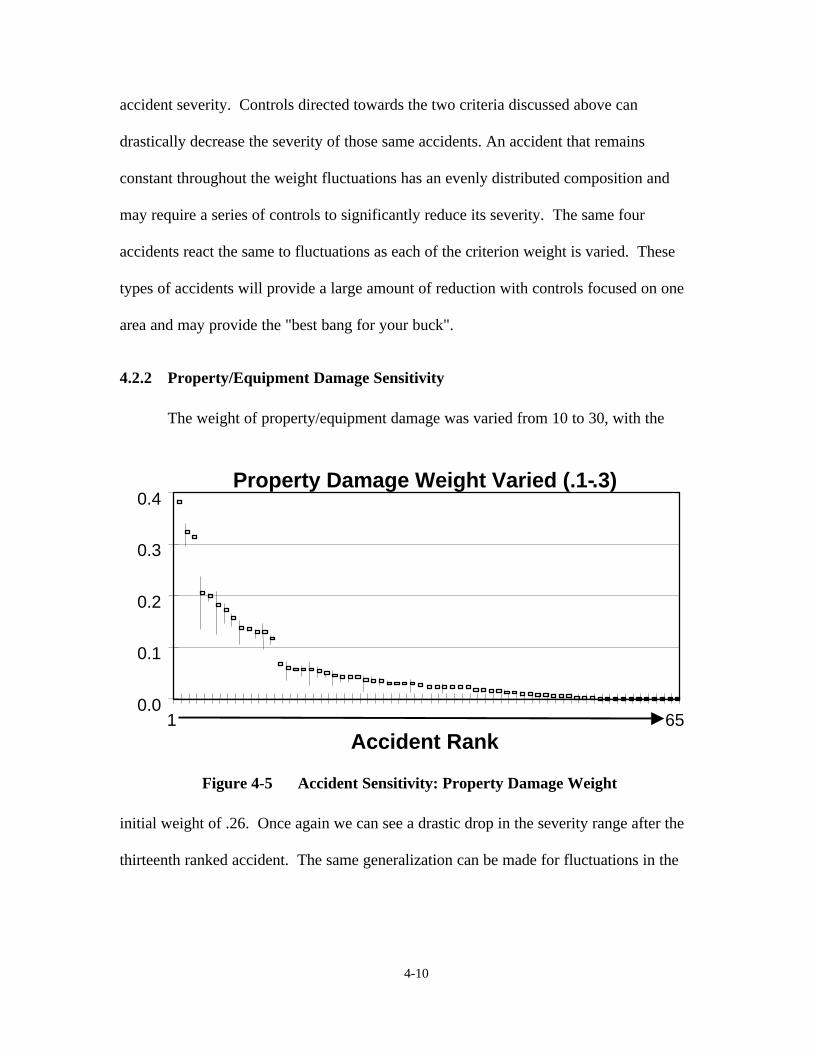
accident severity. Controls directed towards the two criteria discussed above can
drastically decrease the severity of those same accidents. An accident that remains
constant throughout the weight fluctuations has an evenly distributed composition and
may require a series of controls to significantly reduce its severity. The same four
accidents react the same to fluctuations as each of the criterion weight is varied. These
types of accidents will provide a large amount of reduction with controls focused on one
area and may provide the "best bang for your buck".
4.2.2 Property/Equipment Damage Sensitivity
The weight of property/equipment damage was varied from 10 to 30, with the
Property Damage Weight Varied (.1-.3) 0.4
0.3
0.2
0.1
0.0 1
Accident Rank
Figure 4-5 Accident Sensitivity: Property Damage Weight
initial weight of .26. Once again we can see a drastic drop in the severity range after the
thirteenth ranked accident. The same generalization can be made for fluctuations in the
4-10
65
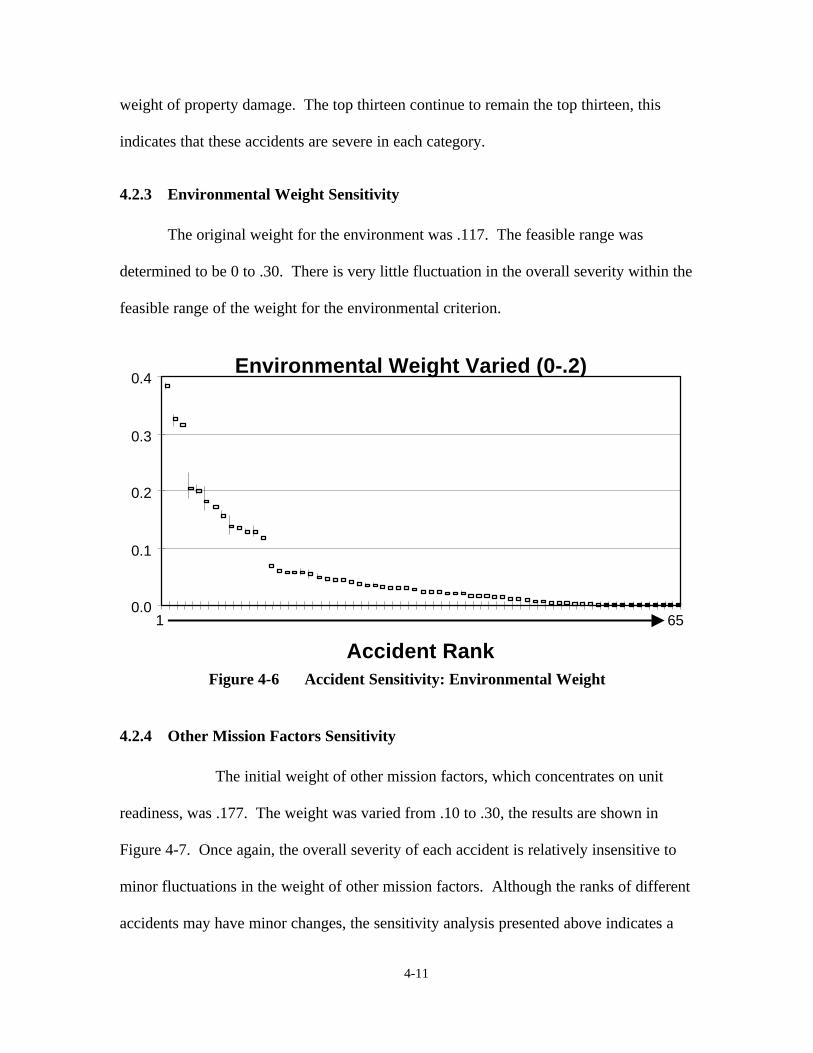
weight of property damage. The top thirteen continue to remain the top thirteen, this
indicates that these accidents are severe in each category.
4.2.3 Environmental Weight Sensitivity
The original weight for the environment was .117. The feasible range was
determined to be 0 to .30. There is very little fluctuation in the overall severity within the
feasible range of the weight for the environmental criterion.
0.4
0.3
0.2
0.1
0.0 1 65
Environmental Weight Varied (0-.2)
Accident Rank Figure 4-6 Accident Sensitivity: Environmental Weight
4.2.4 Other Mission Factors Sensitivity
The initial weight of other mission factors, which concentrates on unit
readiness, was .177. The weight was varied from .10 to .30, the results are shown in
Figure 4-7. Once again, the overall severity of each accident is relatively insensitive to
minor fluctuations in the weight of other mission factors. Although the ranks of different
accidents may have minor changes, the sensitivity analysis presented above indicates a
4-11
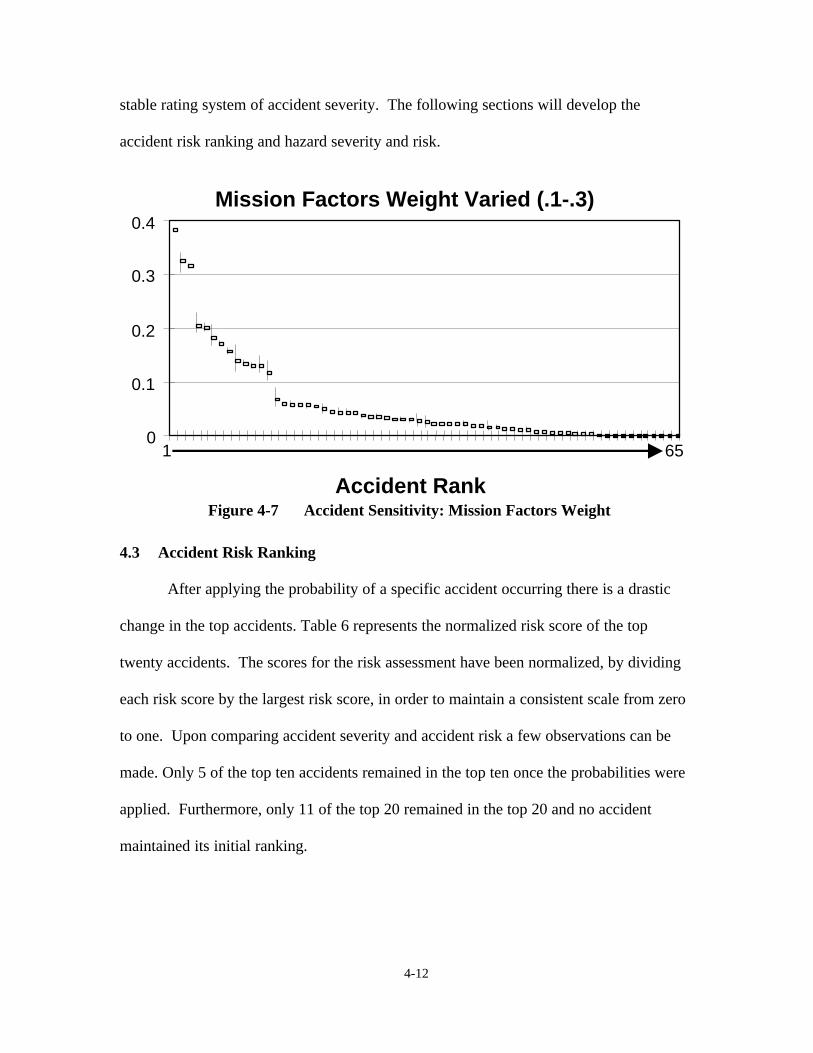
stable rating system of accident severity. The following sections will develop the
accident risk ranking and hazard severity and risk.
Mission Factors Weight Varied (.1-.3) 0.4
0.3
0.2
0.1
0 1 65
Accident Rank Figure 4-7 Accident Sensitivity: Mission Factors Weight
4.3 Accident Risk Ranking
After applying the probability of a specific accident occurring there is a drastic
change in the top accidents. Table 6 represents the normalized risk score of the top
twenty accidents. The scores for the risk assessment have been normalized, by dividing
each risk score by the largest risk score, in order to maintain a consistent scale from zero
to one. Upon comparing accident severity and accident risk a few observations can be
made. Only 5 of the top ten accidents remained in the top ten once the probabilities were
applied. Furthermore, only 11 of the top 20 remained in the top 20 and no accident
maintained its initial ranking.
4-12

123456789
1011121314151617181920
Table 4-3 Accident Risk Ranking
Event Risk Risk Rank
Severity Rank
COLLISION WITH GROUND/WATER 1.0000 5 ENGINE FAILURE/OVERSPEED/OTEMP 0.3286 16
WIRE STRIKE 0.2968 10 TREE STRIKE 0.2567 29
MULTIPLE AIRCRAFT EVENT 0.2519 8 EXCESSIVE YAW/SPIN 0.1712 11
FUEL STARVATION 0.1175 13 SPIN/STALL 0.0878 1
ENGINE OVERTORQUE/OVERLOAD 0.0869 30 INFLIGHT BREAKUP 0.0865 3
FLIGHT RELATED 0.0851 34 OTHER COLLISION 0.0702 36
AIRCRAFT GROUND ACCIDENT 0.0681 40 FIRE AND/OR EXPLOSION IN THE AIR 0.0552 7
HARD LANDING 0.0507 42 EQUIPMENT LOSS/DROPPED OBJECT 0.0471 39
OBJECT STRIKE 0.0420 37 MOC 0.0405 14
ELECTRICAL SYSTEM 0.0298 2 BROWNOUT 0.0295 12
This indicates that although an accident may be severe, it may not be considered as great
a risk to our soldiers if it occurs with a low probability. For example, an electrical system
malfunction was clearly a severe accident (ranked number two in severity) yet over the
last 11 years, given that an accident occurred, this type of malfunction occurred with a
low probability of .001475. The ranking of this accident dropped drastically when
probability was applied to determine the risk. Whereas the severity of a tree strike was
ranked 29th out of 65 types of accidents yet, because tree strikes occurred with a
probability of .134, it moved up to number four in the risk ranking. While all threats to
our troops are important, a combination of severity and probability can help guide the
4-13
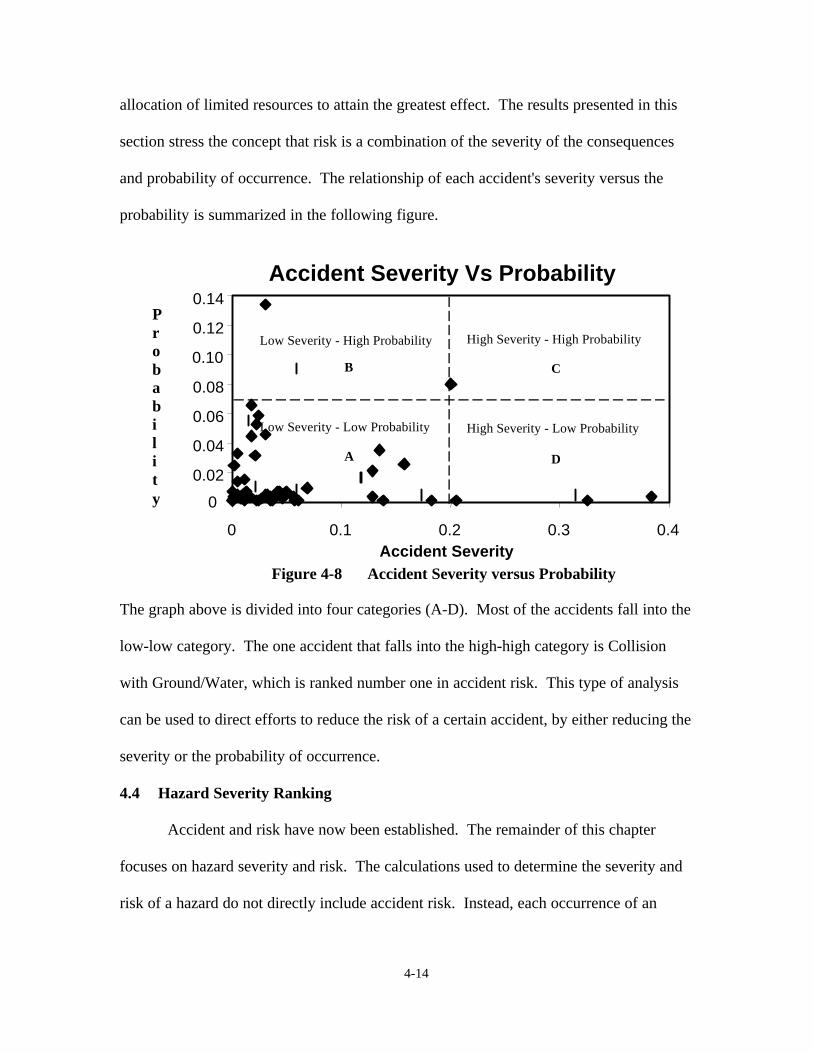
allocation of limited resources to attain the greatest effect. The results presented in this
section stress the concept that risk is a combination of the severity of the consequences
and probability of occurrence. The relationship of each accident's severity versus the
probability is summarized in the following figure.
Accident Severity Vs Probability 0.14
P r 0.12 o 0.10b a 0.08 b i 0.06
l 0.04 i t 0.02
y 0
High Severity - High Probability Low Severity - High Probability
High Severity - Low Probability Low Severity - Low Probability
B
A
C
D
0 0.1 0.2 0.3 0.4 Accident Severity
Figure 4-8 Accident Severity versus Probability
The graph above is divided into four categories (A-D). Most of the accidents fall into the
low-low category. The one accident that falls into the high-high category is Collision
with Ground/Water, which is ranked number one in accident risk. This type of analysis
can be used to direct efforts to reduce the risk of a certain accident, by either reducing the
severity or the probability of occurrence.
4.4 Hazard Severity Ranking
Accident and risk have now been established. The remainder of this chapter
focuses on hazard severity and risk. The calculations used to determine the severity and
risk of a hazard do not directly include accident risk. Instead, each occurrence of an
4-14
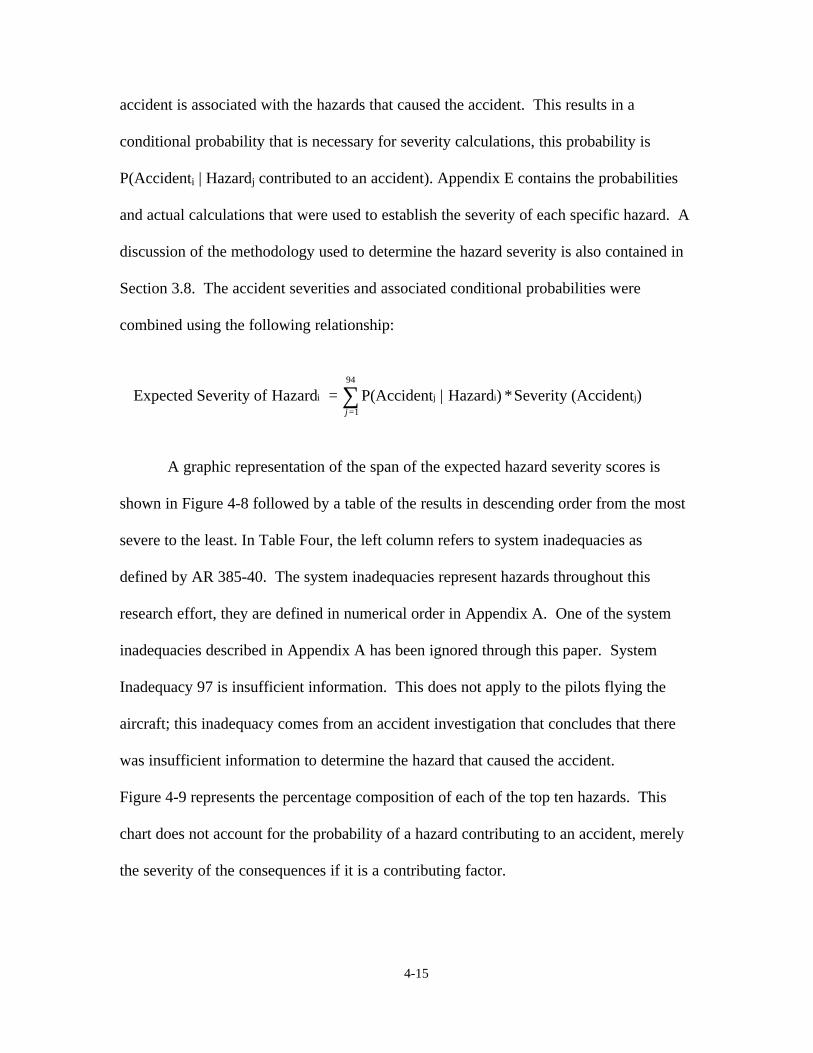
accident is associated with the hazards that caused the accident. This results in a
conditional probability that is necessary for severity calculations, this probability is
P(Accidenti | Hazardj contributed to an accident). Appendix E contains the probabilities
and actual calculations that were used to establish the severity of each specific hazard. A
discussion of the methodology used to determine the hazard severity is also contained in
Section 3.8. The accident severities and associated conditional probabilities were
combined using the following relationship:
94
Expected Severity of Hazardi = � P(Accidentj | Hazardi) *Severity (Accidentj) j =1
A graphic representation of the span of the expected hazard severity scores is
shown in Figure 4-8 followed by a table of the results in descending order from the most
severe to the least. In Table Four, the left column refers to system inadequacies as
defined by AR 385-40. The system inadequacies represent hazards throughout this
research effort, they are defined in numerical order in Appendix A. One of the system
inadequacies described in Appendix A has been ignored through this paper. System
Inadequacy 97 is insufficient information. This does not apply to the pilots flying the
aircraft; this inadequacy comes from an accident investigation that concludes that there
was insufficient information to determine the hazard that caused the accident.
Figure 4-9 represents the percentage composition of each of the top ten hazards. This
chart does not account for the probability of a hazard contributing to an accident, merely
the severity of the consequences if it is a contributing factor.
4-15
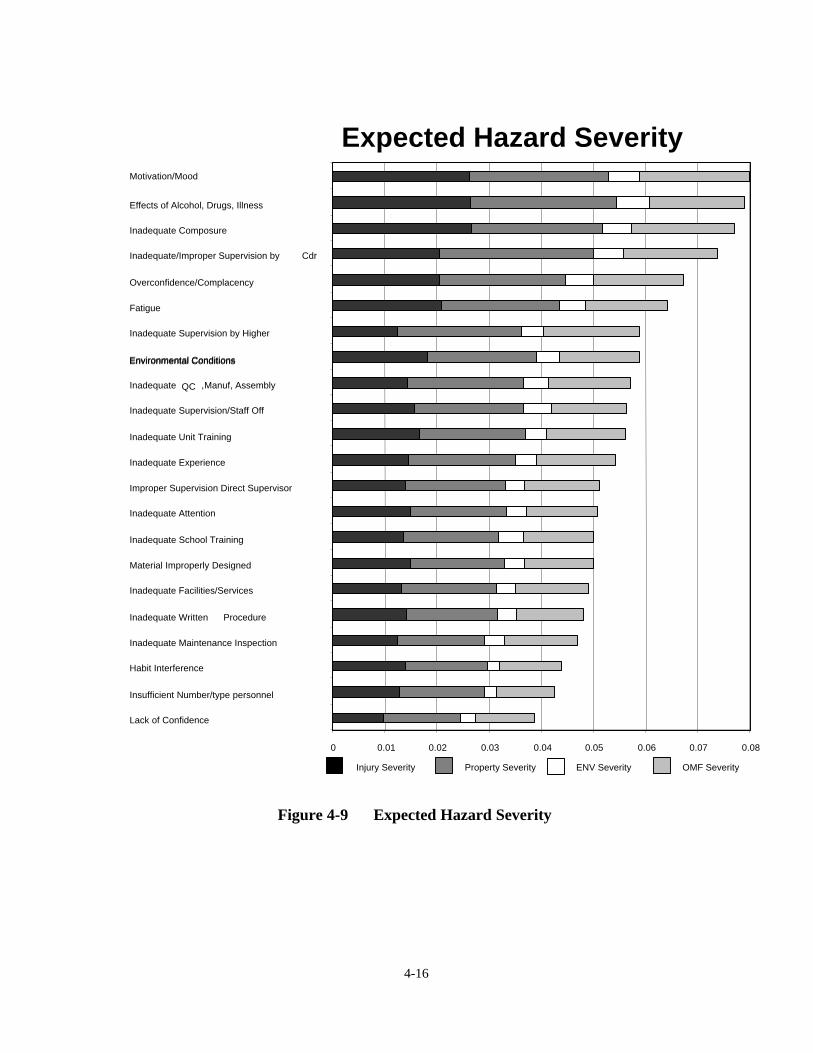
Environmental Conditions
Expected Hazard SeverityMotivation/Mood
Effects of Alcohol, Drugs, Illness
Inadequate Composure
Inadequate/Improper Supervision by Cdr
Overconfidence/Complacency
Fatigue
Inadequate Supervision by Higher
Environmental Conditions
Inadequate QC ,Manuf, Assembly
Inadequate Supervision/Staff Off
Inadequate Unit Training
Inadequate Experience
Improper Supervision Direct Supervisor
Inadequate Attention
Inadequate School Training
Material Improperly Designed
Inadequate Facilities/Services
Inadequate Written Procedure
Inadequate Maintenance Inspection
Habit Interference
Insufficient Number/type personnel
Lack of Confidence
0 0.01 0.02 0.03 0.04 0.05 0.06 0.07 0.08
Injury Severity Property Severity ENV Severity OMF Severity
Figure 4-9 Expected Hazard Severity
4-16
Table 4-4 Expected Hazard Scores
Hazard Definition Severity SI18 Inadequate Motivation/Mood 0.079702329 SI20 Effects of Alcohol, Drugs, Illness 0.078789787 SI15 Inadequate Composure 0.077007882 SI03 Inadequate/Improper Supervision by Unit Com 0.073625832 SI16 Overconfidence/Complacency 0.067180833 SI19 Fatigue 0.063986499 SI01 Inadequate/Improper Supervision by Higher 0.058769655 SI21 Environmental Conditions 0.058752913 SI13 Inadequate QC,Manuf, Assembly 0.056988794 SI02 Inadequate/Improper Supervision by Staff Off 0.056283277 SI06 Inadequate Unit Training 0.056052383 SI07 Inadequate Experience 0.054184297 SI04 Inadequate/Improper Supervision by Dir Supervisor 0.05118832 SI99 Inadequate Attention 0.050760243 SI05 Inadequate School Training 0.050032107 SI11 Material Improperly Designed 0.049974531 SI10 Inadequate Facilities/Services 0.049040987 SI09 Inadequate Written Procedure 0.047979915 SI14 Inadequate Maintenance Inspection 0.046927051 SI08 Habit Interference 0.043605339 SI12 Insufficient Number/type personnel 0.042368548 SI17 Lack of Confidence 0.038541656
Although when dealing with accidents, severity may be reduced significantly by
focusing on one criterion, any control designed to significantly reduce the severity of a
hazard may need to address all of the criteria. Because the severity of each hazard is a
linear combination of all accident severities, the severity of individual accidents becomes
convoluted in the overall hazard severity. The following table indicates the number of
accidents that were involved in each of the ten most severe hazards.
4-17

Table 4-5 Accident/Hazard Relationship
Hazard Definition # Accidents SI18 Inadequate Motivation/Mood 28 SI20 Effects of Alcohol, Drugs, Illness 7 SI15 Inadequate Composure 17 SI03 Inadequate/Improper Supervision by Unit Com 20 SI16 Overconfidence/Complacency 38 SI19 Fatigue 21 SI01 Inadequate/Improper Supervision by Higher 11 SI21 Environmental Conditions 34 SI13 Inadequate QC,Manuf, Assembly 22 SI02 Inadequate/Improper Supervision by Staff Off 10
Due to the wide range of accidents involved in each hazard, controls designed to
reduce the severity of specific accidents may have little effect on a specific hazard's
severity. No single accident occurred in all ten of the most severe hazards and only three
accidents were involved in nine of the ten. These accidents are:
1) Collision with Ground/Water
2) Other Collision
3) Tree Strike
If a commonality could be identified between these types of accidents or other groups
that occur often throughout the most severe hazards controls could be developed that
might reduce severity in groups of hazards, not just one. Section 4.5 applies the
probability of occurrence to the severities listed above. A different set of controls may be
developed to reduce the probability of occurrence of hazard instead of the severity. The
effectiveness of this type of control is discussed in Section 4.5.
4-18
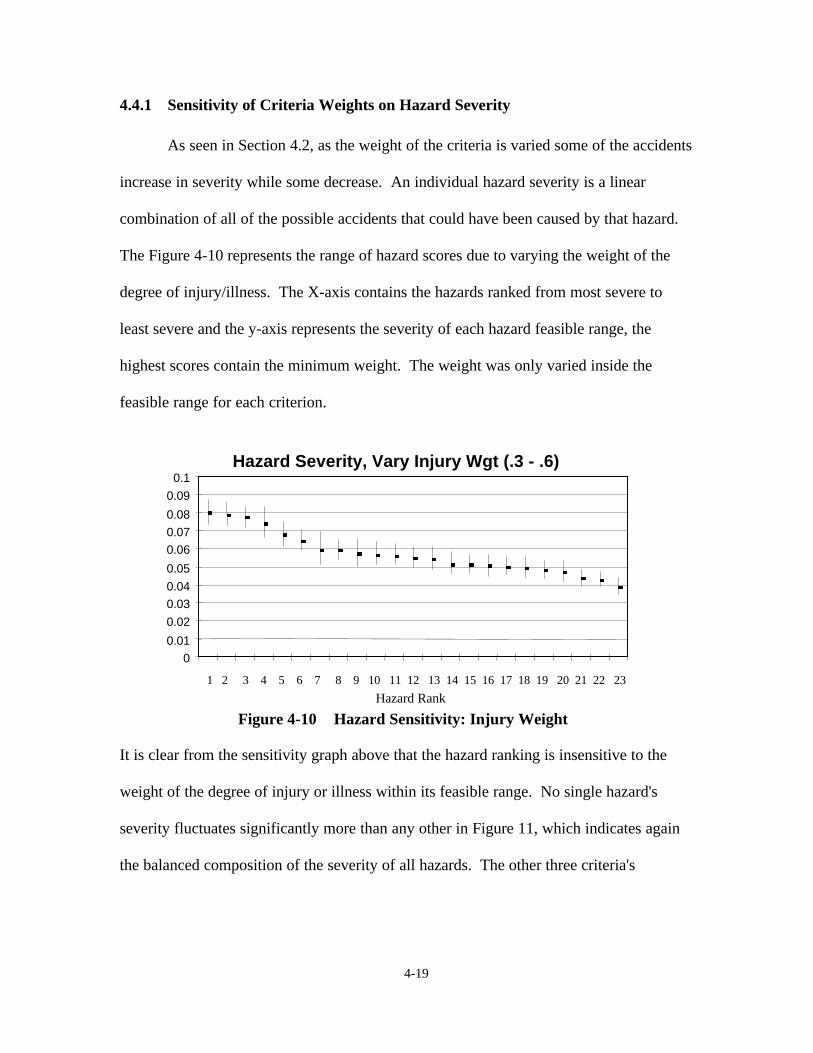
4.4.1 Sensitivity of Criteria Weights on Hazard Severity
As seen in Section 4.2, as the weight of the criteria is varied some of the accidents
increase in severity while some decrease. An individual hazard severity is a linear
combination of all of the possible accidents that could have been caused by that hazard.
The Figure 4-10 represents the range of hazard scores due to varying the weight of the
degree of injury/illness. The X-axis contains the hazards ranked from most severe to
least severe and the y-axis represents the severity of each hazard feasible range, the
highest scores contain the minimum weight. The weight was only varied inside the
feasible range for each criterion.
0.1
0.09
0.08
0.07
0.06
0.05
0.04
0.03
0.02
0.01
0
Hazard Severity, Vary Injury Wgt (.3 - .6)
1 2 3 4 5 6 7 8 9 10 11 12 13 14 15 16 17 18 19 20 21 22 23
Hazard Rank
Figure 4-10 Hazard Sensitivity: Injury Weight
It is clear from the sensitivity graph above that the hazard ranking is insensitive to the
weight of the degree of injury or illness within its feasible range. No single hazard's
severity fluctuates significantly more than any other in Figure 11, which indicates again
the balanced composition of the severity of all hazards. The other three criteria's
4-19
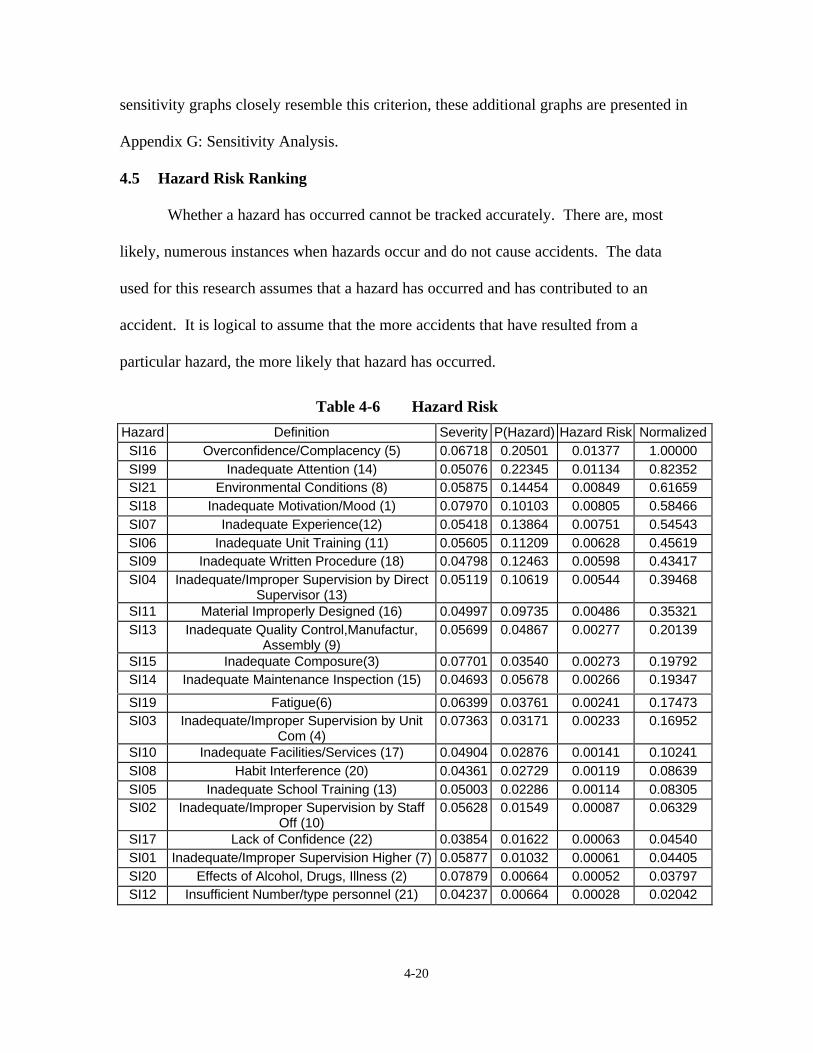
sensitivity graphs closely resemble this criterion, these additional graphs are presented in
Appendix G: Sensitivity Analysis.
4.5 Hazard Risk Ranking
Whether a hazard has occurred cannot be tracked accurately. There are, most
likely, numerous instances when hazards occur and do not cause accidents. The data
used for this research assumes that a hazard has occurred and has contributed to an
accident. It is logical to assume that the more accidents that have resulted from a
particular hazard, the more likely that hazard has occurred.
Table 4-6 Hazard Risk
Hazard Definition Severity P(Hazard) Hazard Risk Normalized SI16 Overconfidence/Complacency (5) 0.06718 0.20501 0.01377 1.00000 SI99 Inadequate Attention (14) 0.05076 0.22345 0.01134 0.82352 SI21 Environmental Conditions (8) 0.05875 0.14454 0.00849 0.61659 SI18 Inadequate Motivation/Mood (1) 0.07970 0.10103 0.00805 0.58466 SI07 Inadequate Experience(12) 0.05418 0.13864 0.00751 0.54543 SI06 Inadequate Unit Training (11) 0.05605 0.11209 0.00628 0.45619 SI09 Inadequate Written Procedure (18) 0.04798 0.12463 0.00598 0.43417 SI04 Inadequate/Improper Supervision by Direct
Supervisor (13) 0.05119 0.10619 0.00544 0.39468
SI11 Material Improperly Designed (16) 0.04997 0.09735 0.00486 0.35321 SI13 Inadequate Quality Control,Manufactur,
Assembly (9) 0.05699 0.04867 0.00277 0.20139
SI15 Inadequate Composure(3) 0.07701 0.03540 0.00273 0.19792 SI14 Inadequate Maintenance Inspection (15) 0.04693 0.05678 0.00266 0.19347
SI19 Fatigue(6) 0.06399 0.03761 0.00241 0.17473 SI03 Inadequate/Improper Supervision by Unit
Com (4) 0.07363 0.03171 0.00233 0.16952
SI10 Inadequate Facilities/Services (17) 0.04904 0.02876 0.00141 0.10241 SI08 Habit Interference (20) 0.04361 0.02729 0.00119 0.08639 SI05 Inadequate School Training (13) 0.05003 0.02286 0.00114 0.08305 SI02 Inadequate/Improper Supervision by Staff
Off (10) 0.05628 0.01549 0.00087 0.06329
SI17 Lack of Confidence (22) 0.03854 0.01622 0.00063 0.04540 SI01 Inadequate/Improper Supervision Higher (7) 0.05877 0.01032 0.00061 0.04405 SI20 Effects of Alcohol, Drugs, Illness (2) 0.07879 0.00664 0.00052 0.03797 SI12 Insufficient Number/type personnel (21) 0.04237 0.00664 0.00028 0.02042
4-20

The probabilities used to compute the hazard risk scores Table 4 are the
probabilities, in the last eleven years, that hazardi was a contributing factor to an accident.
Note that the sum of all P(hazardi) does not equal one. More than one hazard can be
determined to be a contributing factor to an accident. For this specific set of data there
are 2,398 hazard occurrences with only 1,356 accidents, this is an average of 1.8 hazards
contributing to each accident. In Table Four the previous ranking of the hazard's severity
is shown in parenthesis in the Hazard description column. Only four of the top ten severe
accidents stayed in the top ten when the probabilities were considered. Figure 4-11
depicts hazard severity versus the probability of occurrence.
Hazard Severity Vs. Probability 0.25P
r 0.2 o b 0.15 a b 0.1 i l 0.05 i t 0
Low Severity-High Probability B
High Severity-High Probability C
Low Severity-Low Probability A
High Severity-Low Probability D
1
3
4
2
y 0.03 0.04 0.05 0.06 0.07 0.08 0.09 Severity
Figure 4-11 Hazard Severity versus Probability
This chart is divided into four regions. These regions are a quick reference to the
distribution of risk when broken down into components of severity and probability.
Hazards with the greatest risk are found around the outskirts of the chart. This is where
the hazard is composed of a high severity, a high probability, or both. The data points of
4-21

the four most severe hazards are labeled. The distribution of the scores of the top ten
hazards is depicted below in the Figure 4-12.
Hazard Risk
Overconfidence
Attention
Environmental
Experience
Dir Supervisor
Material Design
QC,Manuf, Assy
0.0000 0.0020 0.0040 0.0060 0.0080 0.0100 0.0120 0.0140 0.0160
Written Procedure
Unit Training
Motivation/Mood
Figure 4-12 Hazard Risk Ranking
The categories of hazards (system inadequacies) are shown in Appendix A. The
ten most sever hazards are categorized below.
In d i v i d u a l
T r a i n i n g
S u p p o r t
L e a d e r
S t a n d a rd s
Figure 4-13 Hazard Categories
4-22

Table 4-7 Hazard Categories
Category Percentage Hazard Individual Failure 40 Overconfidence/Complacency
Poor Motivation/Mood Inadequate Attention
Environmental Conditions Training Failure 20 Unit Training
Inadequate Experience Support Failure 20 Material Design
Inadequate Quality Control Leader Failure 10 Direct Supervisor
Standards Failure 10 Inadequate Written Procedures
4.6 Summary
This chapter has presented the results of this research effort and a one-way
sensitivity analysis of the weights of the major criteria. The goal of this project was to
determine the top ten hazards, while accomplishing this goal other additional information
was obtained. Accident and hazard severity and risk have been presented and the
relationship between severity and risk has been discussed. The development of risk from
severity is the first step in reducing the risk of accidents and hazards.
If the information presented here is used to allocate resources, a portfolio analysis
is recommended to determine which of the hazards can be reduced or managed with the
resources available. The model developed is not restricted to the hazards in this paper yet
it is susceptible to the accuracy of the data and assumptions. These assumptions are not
limited to the research in this paper the accuracy of the data is also dependent on the
quality of the investigation done by the accident investigation team.
4-23

5 Conclusions and Recommendations
5.1 Conclusions
Determining the severity and risk of hazards in Army Aviation is a complicated
process. Although there are army regulations, doctrine and technical experts energized
towards a common goal of reducing severity and risk of such hazards there is currently
no consistent methodology for accomplishing this. Investigation into the relevant
doctrine, careful delineation of the terms involved, and value focused thinking provide
the basis for developing and consistently using a structured methodology to assist
decision-makers in making logical decisions concerning the allocation of resources for
risk management. Identifying the underlying values of the Army Safety Center and
Army doctrine will also assist the risk management experts in developing alternatives in
order to reduce that risk.
The methodology presented in this paper is theoretically sound and a method of
modeling supported by multi-attribute preference theory. The model developed through
this research is however, heavily dependent upon data collection procedures and safety
investigation results. The hazards (System Inadequacies) and accidents (events) used in
this research were agreed upon as data that would be useful to (1) validate the concept of
using value focused thinking to rank accidents and hazards and (2) develop the
cornerstone for a research effort to be continued at the Army Safety Center for a
proposed five year plan. The continuation of the research will continue to improve the
model by developing a better taxonomy to identify the existing hazards in Army Aviation
and furthermore to incorporate ground-related accidents and hazards.
5-1
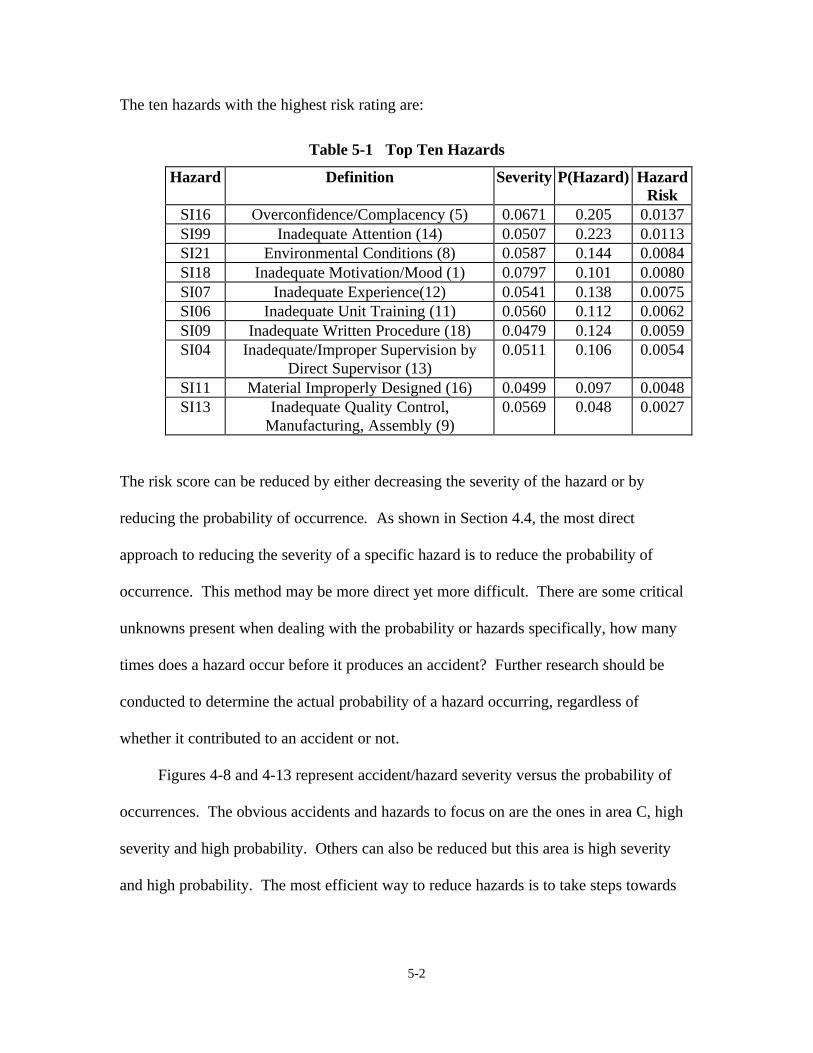
The ten hazards with the highest risk rating are:
Table 5-1 Top Ten Hazards
Hazard Definition Severity P(Hazard) Hazard Risk
SI16 Overconfidence/Complacency (5) 0.0671 0.205 0.0137 SI99 Inadequate Attention (14) 0.0507 0.223 0.0113 SI21 Environmental Conditions (8) 0.0587 0.144 0.0084 SI18 Inadequate Motivation/Mood (1) 0.0797 0.101 0.0080 SI07 Inadequate Experience(12) 0.0541 0.138 0.0075 SI06 Inadequate Unit Training (11) 0.0560 0.112 0.0062 SI09 Inadequate Written Procedure (18) 0.0479 0.124 0.0059 SI04 Inadequate/Improper Supervision by
Direct Supervisor (13) 0.0511 0.106 0.0054
SI11 Material Improperly Designed (16) 0.0499 0.097 0.0048 SI13 Inadequate Quality Control,
Manufacturing, Assembly (9) 0.0569 0.048 0.0027
The risk score can be reduced by either decreasing the severity of the hazard or by
reducing the probability of occurrence. As shown in Section 4.4, the most direct
approach to reducing the severity of a specific hazard is to reduce the probability of
occurrence. This method may be more direct yet more difficult. There are some critical
unknowns present when dealing with the probability or hazards specifically, how many
times does a hazard occur before it produces an accident? Further research should be
conducted to determine the actual probability of a hazard occurring, regardless of
whether it contributed to an accident or not.
Figures 4-8 and 4-13 represent accident/hazard severity versus the probability of
occurrences. The obvious accidents and hazards to focus on are the ones in area C, high
severity and high probability. Others can also be reduced but this area is high severity
and high probability. The most efficient way to reduce hazards is to take steps towards
5-2

reducing their probability. This will consequently reduce the probability of individual
accidents occurring. When attempting to reduce accident risk controls should be
developed to reduce their severity. These may be two drastically different approaches.
To reduce the severity of an accident the senior leadership might look at more protection
in the cockpit of the aircraft while to reduce the probability of occurrence of a hazard
they would turn towards the pilot training program. For instance, the to hazard risk is
overconfidence/complacency of the pilot. A chief contribution is the hazard's correlation
with the severity of tree strikes. The probability that a tree strike occurred, given that the
accident was caused partially by overconfidence or complacency, is slightly over 19%.
Therefore, we can reduce the risk of this hazard by additional training in an attempt to
reduce the probability of the occurrence of the hazard or possibly install a proximity
warning device to reduce the number of tree strikes. Both of these methods would reduce
the overall risk of this hazard.
5.2 Recommendations
5.2.1 Value Functions
The severity functions developed in this research were developed over an eight
month period in conjunction with the Army Safety Center and other safety experts. To
expand this model for Army use, the single dimensional value functions may need to be
adjusted in order to represent decision- maker's views at different command levels. For
this research, experts in the field of aviation, maintenance, personnel and safety were
used to develop the value functions. For future use this list of experts may have to be
expanded down to the field units. Some of the concerns involve the preferences of senior
5-3
leadership of the Army on dollars expended and lives. Furthermore, the Safety Center is
trying to initiate a program, based on value focused thinking to change the way the Army
manages risk. This model is based on a gold standard taken from Army doctrine and
developed with the Safety Center. In order to change the way risk management is
performed; doctrine may have to be rewritten necessitating a change in the value
hierarchy. At that time, a gold standard may not be the best method. A silver standard,
bottom up approach, may be the appropriate methodology by establishing a new standard
by involving experts from different facets of military life and developing a new hierarchy
for the severity of accidents. Such a visionary style of leadership usually requires other
methods of building value models, a silver standard is one and an (Platinum) interview
method is another (Parnell, 1997).
5.2.2 Data Collection
The span of years over which data was collected for this project (11 years) was
chosen in order to gather as much data as possible without incorporating data that may be
outdated due to changes in tactics, techniques and procedures in Army Aviation. This
represents a period of time when the Army introduced three relatively new aircraft into
various units in the Army: the AH-64, the UH-60, and the OH-58 D. This was a time
period where trends were set and tactics and techniques were being developed. The
problem with this time period is that there were a number of accident types that had only
one occurrence while other accidents occurred over 150 times. Using older data may
lead to erroneous results. If the data collection period is too small the amount of data
may not be sufficient and also lead to ill-conceived conclusions.
5-4
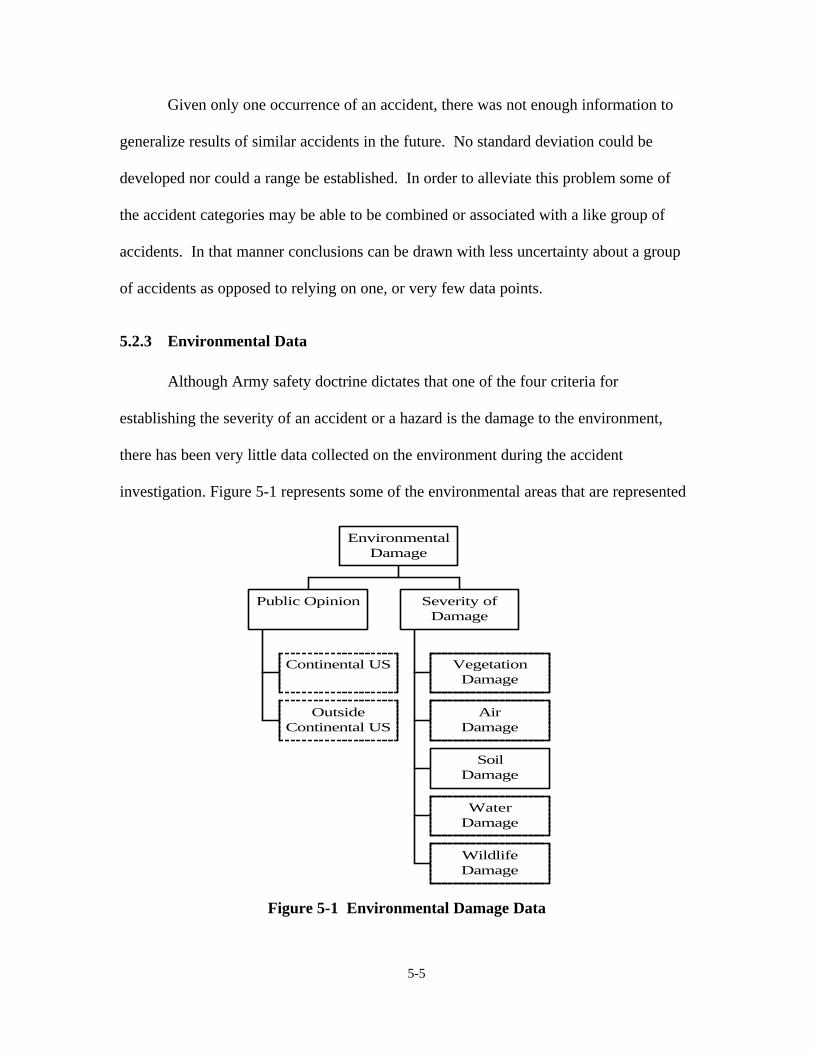
Given only one occurrence of an accident, there was not enough information to
generalize results of similar accidents in the future. No standard deviation could be
developed nor could a range be established. In order to alleviate this problem some of
the accident categories may be able to be combined or associated with a like group of
accidents. In that manner conclusions can be drawn with less uncertainty about a group
of accidents as opposed to relying on one, or very few data points.
5.2.3 Environmental Data
Although Army safety doctrine dictates that one of the four criteria for
establishing the severity of an accident or a hazard is the damage to the environment,
there has been very little data collected on the environment during the accident
investigation. Figure 5-1 represents some of the environmental areas that are represented
Continental US
Outside Continental US
Public Opinion
Vegetation Damage
Air Damage
Soil Damage
Water Damage
Wildlife
Severity of Damage
Environmental Damage
Damage
Figure 5-1 Environmental Damage Data
5-5

in the environmental protection matrix outlined in FM 20-400 / MCRP 4-11B, the
Military Environmental Protection Manual. Further investigation could be conducted to
establish measures that could adequately describe each of the evaluation considerations
depicted in the dashed boxes below.
Currently the only information that accurately records damage to the environment
in the database at the Safety Center is gallons of oil, fuel and hydraulic fluid spilled at the
sight. Other factors such as fire and chemicals present are tracked but their effect on the
environment cannot be derived. The database is built from the accident investigation
forms that are filled out by a board assigned to the accident. More extensive guidelines
could be established for the collection of data concerning the environment. Although it
would take years to establish a meaningful database, adequate measures for the areas of
concern mentioned above could be attained by the investigation board at the accident
sight. Some example questions that could be asked at the sight are given below.
1) If a fire was present what was the extent of damage to the surrounding area?
2) If the accident occurred overseas was there damage to civilian property, what type and how much?
3) What clean up was required by the local unit or civilian agency?
4) Was the accident near a water source?
5.2.4 Hazards and Controls
One of the problems encountered during this research was establishing what
constituted a hazard. The Army Safety Center has taken the steps necessary to continue
the work in the area of hazard severity, one of the major goals of their efforts is to
develop a better hazard classification system and controls classification system. The
5-6

areas of concern and the measures used in this research should assist in that effort. The
value hierarchy established here should be particularly helpful in developing controls to
reduce the severity of accidents and hazards.
By Identifying the accident severity criteria that contributed the greatest to the
severity of an accident or hazard, risk managers can focus their efforts to reduce those
specific effects. Furthermore, if experts deem that the efforts required to reduce the
severity are not feasible they can chose to focus on reducing the probability of the event
occurring and therefore reducing the risk. In this manner, resources expended towards
the reduction of risk can be directed more efficiently and effectively.
In addition to establishing controls, the approach used in this research to determine
hazard severity can be used to identify those combinations of hazards that drastically
increase risk. The following equation can be used to determine those combinations of
hazards with the largest severities:
65
Severity of HazardCombinationjk = �P(Accidenti | Hazardjk) *Severity (Accidenti) i =1
5.3 Contributions
The consequences of an accurate hazard severity ranking and appropriate
allocation of resources include effects on soldier’s lives, unit morale, scientific
advancement, and technological progress, as well economic costs and benefits. A careful
analysis of each hazard has high potential payoff for the Army safety Center, Aviation,
and the Department of the Army as a whole. The benefits that will be derived are; lives
saved due to the identification and remediation of the correct hazards and the possibility
5-7
of optimal resource allocation within a given budget. In addition, the methodology can
be applied to other safety settings and issues.
Aside from identifying hazard severity and risk, the same measures were
established for specific accidents. This type of information is valuable at the tactical
level. Certain hazards are unavoidable do to mission requirements. If tactical
commanders know the correlation of certain accidents to existing hazards they can take
steps to reduce the chance or severity of those specific accidents.
The proposal, projected benefits and a summarized methodology for this research
was submitted to the Department of the Army Studies Program. The research effort was
selected and awarded $98,000 for continued research in coordination with the Safety
Center. A statement of work has since been developed to expand the scope of the project.
The overriding goal is to revamp the manner in which hazards are identified and ranked
and how controls are developed and implemented to reduce the severity and risk of
hazards and accidents. The study will initially be centered on the Army Safety Center but
will be developed for field unit implementation over a five-year period. A description of
the continuation of work will be resubmitted each year to the studies program for
additional funding.
5-8

Appendix A: Accident/Incident Event and System Inadequacies Codes Associated with Aircraft Accidents
A.1 Accident/Event Codes.
The following codes and explanations below are provided to categorize aviation
accidents by the type of event(s) involved.
Code: 01 Title: Precautionary landing (PL).
Explanation: A landing resulting from unplanned events, occurring while the
aircraft is in flight that makes further flight inadvisable. This event is to be used
for PLs where no other event applies or in conjunction with other materiel failure
events.
Code: 02 Title: Forced landing (FL).
Explanation: A landing caused by failure or malfunction of engines, systems, or
components that makes continued flight impossible. This event is to be used in
conjunction with other materiel failure/malfunction events.
Code: 03 Title: Aborted takeoff.
Explanation: An unplanned event that occurs before liftoff that interrupts a
planned flight. This event is to be used for aborted takeoffs where no other event
applies or in conjunction with other materiel failure events.
Code: 04 Title: Human factor event.
Explanation: A psychological, physiological, or pathological condition that
occurs to personnel when intent for flight exists and results in interference with a
crewmember's duties during aircraft operations or mission being delayed,
diverted, or aborted.
A-1
Code: 05 Title: Cargo event.
Explanation: Injury or property damage resulting from cargo- related
accident/incident; intentional or unintentional jettisoning of cargo hook load.
Code: 06 Title: Personnel handling event.
Explanation: Injury or property damage involving personnel handling errors or
personnel handling.
Code: 07 Title: External stores event.
Explanation: Injury or property damage resulting from external stores handling
errors or equipment failures.
Code: 08 Title: Multiple aircraft event.
Explanation: Injury or property damage resulting from the interactions of two or
more aircraft. To qualify as a multiple aircraft event, two or more aircraft, with
engines running, must be involved.
Code: 09 Title: Misappropriated aircraft.
Explanation: An aircraft accident that occurs during the operation of an Army
aircraft that has been misappropriated, regardless of aircrew designation. Intent
for flight must exist.
Code: 10 Title: Drone aircraft.
Explanation: Drone aircraft are identified by "Q" designator, and may be flown
or operated by rated or nonrated personnel, or by remote control. When manned,
A-2
they will be regarded as aircraft and reported accordingly. When unmanned, and
operated by remote control, the accident will be reported using DA Form 285.
Code: 11 Title: Contractor aircraft accident.
Explanation: An aircraft accident that occurs as a result of a government
contractor's operation in which there is damage to Army property or injury to
Army personnel. Included is non-delivered equipment for which the Army has
assumed responsibility.
Code: 12 Title: Aircraft ground accident.
Explanation: Injury or property damage involving an Army aircraft in which no
intent for flight exists and the engines are in operation.
Code: 13 Title: Laser-induced/related.
Explanation: Property damage or personnel injury resulting from laser operations
created. May be used in conjunction with other events.
Code: 14 Title: Fratricide.
Explanation: Persons killed or wounded, or equipment damaged, in military
action, mistakenly or accidentally, by friendly forces actively engaged with the
enemy, who are directing fire at hostile force or what is thought to be a hostile
force.
Code: 15-19 (Reserved for future additions.)
Code: 20 Title: Refueling Accident.
Explanation: Damage incurred during refueling operations on the ground or in
flight.
A-3

Code: 21 Title: Midair Collision.
Explanation: Those accidents in which more than one aircraft collide in flight.
Hover is considered in flight. Damage does not have to be done to both aircraft
(will be used in addition to "08 multiple aircraft event").
Code: 22 Title: Helo-casting.
Explanation: Property damage or personnel injury occurring during helo-casting
operations.
Code: 23 Title: Hard Landing.
Explanation: Damage incurred due to excessive sink rate on landing touchdown.
Includes auto-rotation landings when skids are damaged; main rotor blade flexing
into tail boom; tire blowing on touchdown; landing gear driven into fuselage;
fuselage, wing, etc., buckling. Note: The landing area must be suitable for a
probable successful landing.
Code: 24 Title: Wheels-Up Landing.
Explanation: Aircraft equipped with retractable landing gear in the wells.
Includes intentional gear-up landings; crew forgetting to lower gear; gear does not
extend when gear handle placed down.
Code: 25 Title: Landing Gear Collapse/Retraction.
Explanation: During takeoff, landing, or taxi, the gear collapses for any reason or
the crew inadvertently retracts or retracts too soon on takeoff (does not include
gear shearing due too hard landing).
A-4
Code: 26 Title: Undershoot.
Explanation: When an approach is being made to a prepared area of field and the
aircraft touches down short of the suitable landing surface. (Does not include
striking wires, trees, etc., on approach except an aircraft striking an airport
boundary fence.)
Code: 27 Title: Overshoot or Overrun.
Explanation: Landing in which the aircraft runs off the end of the runway
because of touchdown speed, too-short runway, touching down too long, or
failure of brakes.
Code: 28 Title: Ditching.
Explanation: Landing in a controlled attitude in water. (Does not include creeks,
streams, etc., or those landings to ships or barges in which the aircraft crashes in
the water.)
Code: 29 Title: Ground Loop/Swerve.
Explanation: When aircraft damage is incurred because absolute directional
control is not maintained (intentional or unintentional). Includes F/W ground
loops; R/W autorotational landings; R/W running landings due to antitorque
failures; aircraft running off side of runway.
Code: 30 Title: Collision with Ground/Water.
Explanation: Those accidents in which the aircraft strikes the ground or water
unintentionally. Includes crashing into a mountain under IFR, IMC, or night;
inadvertent flying into the ground or water, such as making a gun run and failing
to pull up; low-level flight resulting in striking ground or water.
A-5
Code: 31 Title: Aircraft Collisions on the Ground.
Explanation: Accidents in which two or more aircraft collide on the ground.
None of the aircraft can be in flight. (used in addition to '08' multiple aircraft
event).
Code: 32 Title: Other Collisions.
Explanation: Accidents when an aircraft collides with something not accounted
for by other type events listed.
Code: 33 Title: Rotor overspeed.
Explanation: Main rotor RPM exceeding the allowable limits for continued
flight.
Code: 34 Title: Fire and/or Explosion on the Ground.
Explanation: Accidents that are initiated by a fire or explosion. The damage
incurred must be prior to lift-off and/or after touchdown.
Code: 35 Title: Fire and/or Explosion in the Air.
Explanation: Same as on the ground except damage must be after lift-off and
before touchdown.
Code: 36 Title: Equipment Loss or Dropped Object.
Explanation: Accidents in which some part of the aircraft or attached equipment
is lost in flight, other than cargo and external stores.
Code: 37 Title: In-flight Breakup.
A-6
Explanation: Accidents in which aircraft begins to break up in flight. In these
accidents, any type of landing is not expected. Includes loss of main rotor blades;
loss of wing.
Code: 38 Title: Spin or Stall.
Explanation: Fixed wing aircraft type accidents resulting in stalling and/or
spinning due of loss of airspeed or excessive angle of attack.
Code: 39 Title: Abandoned Aircraft.
Explanation: Accidents in which all flight crew eject or parachute.
Code: 40 Title: Flight-Related Accident.
Explanation: Damage to property or injury to personnel without damage to
aircraft.
Code: 41 Title: Instrument Meteorological Condition (IMC).
Explanation: Aircraft must be in IMC conditions when the accident/ emergency
occurs. This is a condition event and should not be used in the first position.
Code: 42 Title: Rappelling.
Explanation: Property damage or personnel injury occurring during rappelling
operations.
Code: 43 Title: STABO.
Explanation: Property damage or personnel injury occurring during STABO
operations.
Code: 44 Title: Overstress.
A-7
Explanation: Stress damage to aircraft as a result of operating aircraft outside the
design limitations.
Code: 45 Title: Foreign Object Damage (FOD) Incident.
Explanation: Internal or external FOD damage confined to aircraft turbine
engines only.
Code: 46 Title: Rotor/Prop Wash.
Explanation: Property damage or personnel injury resulting from rotor/prop
wash (does not include damage incurred by event 75).
Code: 47 Title: Engine Overspeed/Overtemp.
Explanation: Engine RPM or temperature exceeding the allowable limits for
continued operations.
Code: 48 Title: Brownout.
Explanation: Loss of visual reference to the ground or horizon caused by rotor
wash swirling dust around the aircraft. This is a condition event and should not
be
used in the first position.
Code: 49 Title: Bird Strike.
Explanation: Accidents in which any part of the aircraft collides with a bird
while in flight.
Code: 50 Title: Tree Strike.
Explanation: Accidents as a result of aircraft striking vegetation during any
phase of flight.
Code: 51 Title: Wire Strike.
A-8
Explanation: Accidents as a result of the aircraft striking any kind of wires
during any phase of flight.
Code: 52 Title: In-flight Breakup due to mast bumping.
Explanation: Accidents in which the main rotor separates as result of mast
bumping.
Code: 53 Title: Missing Aircraft.
Explanation: Used when an aircraft does not return from a flight and is presumed
to have crashed.
Code: 54 Title: FOD.
Explanation: Accident in which foreign object damage is the only damage
incurred.
Code: 55 Title: Dynamic Rollover.
Explanation: Accident in which the main rotor blades strike the terrain as a result
of exceeding the lateral CG limits, while the aircraft structure is still intact.
Code: 56 Title: Maintenance Operational Check (MOC).
Explanation: Accidents that occur during an MOC while the engine(s) is (are) in
operation and/or rotors turning.
Code: 57 Title: Weapons Related.
Explanation: Accidents that result in property damage or injury to personnel.
Code: 58 Title: Lightning Strike.
Explanation: Damage to aircraft/injury to occupant because of lightning strike(s).
Code: 59 Title: Rescue operations.
A-9
Explanation: Property damage or personnel injury occurring during rescue
operations.
Code: 60 Title: Object Strike.
Explanation: Aircraft/aircraft component struck objects other than ground, trees,
or objects included in other events.
Code: 61 Title: Air to Ground Collision.
Explanation: Aircraft in the air collides with or strikes aircraft on the ground.
Code: 62 Title: Stump Strike.
Explanation: Aircraft contacts stump during routine landing.
Code: 63 Title: Antenna Strike.
Explanation: Aircraft damage caused by contact with an antenna.
Code: 64 Title: Engine Overtorque/Overload.
Explanation: Engines that have been subjected to torque loads beyond power
limits specified, or engine loses rpm because of overload of aircraft for density
altitude.
Code: 65 Title: Whiteout.
Explanation: Loss of visual reference to the ground or horizon caused by rotor
wash swirling snow around the aircraft. This is a condition event and should not
be used in the first position.
Code: 66 Title: Tiedown Strike.
Explanation: Damage to the aircraft caused by main rotor tiedown device
attached to M/R rotor during engine start.
A-10
Code: 67 Title: Parachute.
Explanation: Accidents involving paradrop operations inside or still attached to
the aircraft.
Code: 68 Title: Mast Bumping.
Explanation: Damage resulting from contact between the main rotor and mast
but not resulting in rotor separation.
Code: 69 Title: Structural Icing.
Explanation: The formation of ice on aircraft structures to include the rotor
systems. Does not include carburetor, induction, or pitot static system icing.
Code: 70 Title: Engine Failure.
Explanation: Engine fails to develop sufficient power to maintain flight or
internal failure of power plant. Excludes fuel starvation or fuel exhaustion and
FOD.
Code: 71 Title: Transmission Failure.
Explanation: Internal failure of a main transmission.
Code: 72 Title: Vertical Fin Strike.
Explanation: Damage caused by the tail rotor blades coming in contract with the
vertical fin on single rotor helicopters.
Code: 73 Title: Spike Knock.
Explanation: Damage occurred when the transmission spike contacts the striker
plate with sufficient force to cause damage.
Code: 74 Title: Seatbelt/Restraint Harness Strike.
A-11
Explanation: Damage caused by unsecured seatbelts/restraint harnesses.
Code: 75 Title: Blade Flapping.
Explanation: Damage resulting from wind or rotor wash from other aircraft that
causes the M/R blades to flap to the extent that damage occurs.
Code: 76 Title: Fuel Exhaustion.
Explanation: Power loss resulting from using all usable fuel aboard an aircraft.
Code: 77 Title: Fuel Starvation.
Explanation: The result of fuel ceasing to flow to the power plant while fuel is
still on board the aircraft. Example: The pilot fails to switch tanks when one runs
dry or blockage of fuel lines occurs because of contamination.
Code: 78 Title: Animal Strike.
Explanation: During takeoff, landing, etc., an animal is struck by any part of the
aircraft.
Code: 79 Title: Battery Fire/Overheat.
Explanation: A fire in the battery compartment or overheated battery, usually
resulting in electrical failure.
Code: 80 Title: Excessive Yaw/Spin.
Explanation: May occur on the ground or in the air (helicopter only). A
maneuver where the aircraft yaws excessively or spins when power is added
without adequate antitorque input or a loss of antitorque control occurs.
Code: 81 Title: Tail Boom Strike.
A-12
Explanation: Main rotor contacts tail boom on the ground due to wind
conditions. Excludes hard landings and damage caused by rotor wash.
In addition to events 70 and 71 listed above the following events are used to categorize
materiel factor related mishap events. The event applies regardless of the cause of the
failure/malfunction (FWT, maintenance, design or manufacture).
Code: 82 Title: Airframe.
Explanation: Failure/malfunction of any airframe structure to include doors
windows, fairings, canopies, etc to include hardware.
Code: 83 Title: Landing Gear.
Explanation: Failure/malfunction of any landing gear part exclusive of the
hydraulics.
Code: 84 Title: Power train.
Explanation: Failure/malfunction of any part/component of the power train
except when events 47 or 70 applies.
Code: 85 Title: Drive Train.
Explanation: Failure/malfunction of any part/component of the drive train except
when events 86 and 71 applies.
Code: 86 Title: Rotor/Propellers.
Explanation: Failure/malfunction of rotor/prop assemblies, hubs, blades, etc.
Excludes other drive train part failures; e.g. gearboxes, mast etc.
Code: 87 Title: Hydraulics System.
Explanation: Failure/malfunction of any hydraulic part. The failure of other
systems resulting from hydraulic initiated failures will be coded as hydraulic.
A-13

Code: 88 Title: Pneumatic System.
Explanation: Failure/malfunction of any pneumatic part. The failure of any other
system resulting from pneumatic initiated failures will be coded as pneumatic.
Code: 89 Title: Instruments.
Explanation: Failure/malfunction of any part of the instrument system that
results in a faulty instrument indication.
Code: 90 Title: Warning System.
Explanation: Failure/malfunction of any part of the warning system that results
in an false indication of a failure/malfunction. Includes electrical components of
the warning system.
Code: 91 Title: Electrical System.
Explanation: Failure/Malfunction of any part of the AC or DC electrical systems.
Includes current producing, transforming, converting and amplifying parts e.g.
battery, generator, alternator, relay etc.
Code: 92 Title: Fuel System.
Explanation: Failure of any part of the fuel system. Does not include the fuel
metering/fuel control unit that will be reported as part of the engine.
Code: 93 Title: Flight Control.
Explanation: Failure/malfunction of any part of the system. Excludes hydraulic
part failures.
Code: 94 Title: Utility/Environmental Control System.
Explanation: Failure/malfunction of any part of the system.
Code: 95 Title: Avionics.
A-14
Explanation: Failure of any part of the radio navigation/communication
equipment.
Code: 96 Title: Cargo Handling Equipment.
Explanation: Failure of the cargo handling equipment attached to the aircraft
only.
Code: 97 Title: Armament.
Explanation: Failure of any part to include the aiming/firing system.
A.2 System Inadequacies/Hazards.
A. LEADER FAILURE
Code: 01 Title: Inadequate/improper supervision by higher command.
Code: 02 Title: Inadequate/improper supervision by staff officer.
Code: 03 Title: Inadequate/improper supervision by unit command.
Code: 04 Title: Inadequate/improper supervision by direct supervisor/noncommissioned
officer in charge/platoon leader/instructor.
Explanation: NOTE: Inadequate supervision becomes a root cause when it leads
to accident-causing personnel mistakes or materiel failure/malfunctions.
Inadequate supervision is more clearly identifiable at the immediate-supervisor
level.
B. TRAINING FAILURE
Code: 05 Title: Inadequate school training.
Explanation: School training becomes a root cause when people make accident
causing mistakes because the school training was inadequate in content or
amount.
A-15
Code: 06 Title: Inadequate unit/on-the-job training.
Explanation: Unit/on-the-job training becomes a root cause when people make
accident-causing mistakes because the training provided was inadequate in
content or amount.
Code: 07 Title: Inadequate experience.
Explanation: Supervised on-the-job experience is the follow-up to school and
unit training programs. Experience becomes a root cause when people make
accident-causing mistakes because the experience provided was inadequate in
content or amount.
Code: 08 Title: Habit interference.
Explanation: Habit interference becomes a root cause when a person makes an
accident-causing error because task performance was interfered with either the
way he usually performs similar tasks, or the way he usually performs the same
task under different conditions or with different equipment.
C. STANDARDS FAILURE
Code: 09 Title: Inadequate written procedures for operation under normal or
abnormal/emergency conditions.
Explanation: Inadequate written procedures (AR, TM, FM, SOP, written
directives) become the root causes when they lead to accident-causing mistakes or
materiel failures/malfunctions.
D. SUPPORT FAILURE
Code: 10 Title: Inadequate facilities/services.
A-16
Explanation: Inadequate facilities or services become root causes when the
maintenance, space and/or support provided for personnel and materiel to
accomplish their functions cause mistakes or failures/malfunctions that lead to
accidents. (Examples of facilities or services are recreation areas, POL services,
housing, medical clinics/hospitals, weather services, storage areas, maintenance
facilities, and property disposal.)
Code: 11 Title: Inadequate/improper equipment design or equipment not provided.
Explanation: Improperly designed equipment and materiel or lack of
equipment/materiel become root causes when the design or lack of equipment
leads to accident-causing personnel errors or materiel failures/malfunctions.
Code: 12 Title: Insufficient number or type of personnel.
Explanation: Insufficient number or type of personnel becomes a root cause
when people make accident-causing mistakes or materiel fails/malfunctions
because the number or type of personnel provided was insufficient.
Code: 13 Title: Inadequate quality control, manufacture, packaging, or assembly.
Explanation: The inadequate manufacture, assembly, packaging, or quality
control of materiel becomes a root cause when it leads to accident-causing
personnel errors or materiel failures/malfunctions. (Note: Includes original
manufacture and rebuild.)
Code: 14 Title: Inadequate maintenance.
A-17
Explanation: Inadequate maintenance (inspection, installation, troubleshooting,
recordkeeping, etc.) becomes a root cause when it leads to accident-causing
personnel errors or materiel failures/malfunctions.
E. INDIVIDUAL FAILURE
Code: 15 Title: Fear/Excitement/Anger (inadequate composure).
Explanation: Each person is a part of the system. Therefore, his state of mind is a
system element. Inadequate composure is a temporary state of mind that becomes
a root cause when a person makes an accident-causing error because of fear,
excitement, or some related emotional factor made clear, rational thought
impossible.
Code: 16 Title: Overconfidence/complacency in abilities.
Explanation: Overconfidence is a temporary state of mind that becomes a root
cause when an accident is caused by a person's unwarranted reliance on: his own
ability to perform a task, the ability of someone else to perform a task, the
performance capabilities of equipment or other materiel.
Code: 17 Title: Lack of confidence.
Explanation: Lack of confidence is a temporary state of mind that becomes a
root cause when an accident is caused by a person's unwarranted lack of reliance
on; his own ability to perform the task, the ability of someone else to perform the
task, the performance capabilities of equipment or other materiel.
Code: 18 Title: Haste/Attitude (poor motivation).
A-18
Explanation: Haste/attitude (poor motivation) is a temporary state of mind that
becomes a root cause when a person makes an accident-causing mistake because
he/she is in a hurry (haste), or has a poor/bad attitude.
Code: 19 Title: Fatigue (self-induced).
Explanation: Fatigue is a temporary physical and/or mental state that becomes a
root cause when a person makes an accident-causing error because of reduced
physical or mental capabilities resulting from previous activity and/or lack or rest.
Code: 20 Title: Effects of alcohol, drugs, illness.
Explanation: The temporary effects of alcohol, drugs, or illness become a root
causes when a person makes an accident-causing error because of reduced
physical or mental capabilities resulting from one or more of these effects.
Code: 21 Title: Environment conditions.
Explanation: Unknown or unavoidable conditions, which result in materiel
failure or induce human error.
Code: 97 Title: Insufficient information to determine system inadequacy/cause.
A-19
Appendix B: Glossary of Safety Related Terms
Aborted takeoff
An unplanned event that occurs before intent for flight exists, with engine(s) running, that
interrupts a planned flight (except for maintenance test flights and factory acceptance
flights).
Accident
An unplanned event that causes personal injury or illness, or property damage.
Active Army personnel
Members of the Army on full-time duty in active military service, including cadets at the
U.S. Military Academy.
Aircraft
A manned weight carrying structure for navigation of the air that is supported by its own
buoyancy or the dynamic action of the air against its surfaces.
Aircraft ground accident
Injury or property damage accidents involving Army aircraft in which no intent for flight
exists, and the engine(s) is/are in operation.
Army accident
An accident that results in injury/illness to either Army or non-Army personnel, and/or
damage to Army or non-Army property as a result of Army operations (caused by the
Army).
Army civilian personnel
B-1

a. Senior Executive Service, General Management, General Schedule, and Federal Wage
System employees.
b. Corps of Engineer Civil Works employees.
c. Army National Guard and Army Reserve technicians.
d. Nonappropriated fund employees (excluding part-time military).
e. Youth/Student Assistance and Temporary Program employees; Peace Corps and
Volunteers in Service to America (VISTA) volunteers; Job Corps, Neighborhood Youth
Corps, and Youth Conservation Corps Volunteers; Family Support Program volunteers.
Commander
An individual that exercises authority and responsibility over subordinates by virtue of
rank or position. The purpose of that authority and responsibility is to effectively use
available resources and plan the employment of, organize, direct, coordinate and control
the actions of an Army organization for the purpose of successful mission
accomplishment. Examples of commanders are as follows:
a. Commander of a major Army command, CONUS and OCONUS.
b. The Chief of Engineers (civil and military works).
c. Commander, U.S. Army Space and Strategic Defense Command.
d. The Chief, Army National Guard Bureau.
e. Commander, U.S. Army Medical Research and Development Command.
f. Commanders of Army installations with a full-time safety professional. This includes
posts, camps, stations, and military communities.
g. State adjutants general (ARNG).
h. Commanders of Army Reserve organizations with a full-time safety professional.
B-2
i. Commanders of medical treatment facilities.
j. Commanders in direct support of general support maintenance units.
k. Director of Facilities Engineering.
l. Provost Marshal/Law Enforcement Commander.
m. Director of Industrial Operations.
n. U.S. Army Plant Representative Office.
o. Commander of TOE, MTOE, or TDA organization.
Competent medical authority
Any duly qualified physician (Government or private), who is approved by the Office of
Workman's Compensation to render treatment. "Competent medical authority" includes
surgeons, podiatrists, dentists, clinical psychologists, optometrists, chiropractors, and
osteopathic practitioners.
Contractor accident
An accident that occurs as a result of a Government contractor's operations in which there
is damage to U.S. Government or Army property or equipment, injury or occupational
illness to Army personnel, or other reportable event.
Destroyed aircraft
An aircraft is considered destroyed/total loss when the estimated cost to repair exceeds
the current full-up replacement cost.
Drone aircraft
Those serial vehicles having a "Q" designator and which can be flown or operated by
rated or non-rated personnel, or which can be flown or operated in the remote control
configuration.
B-3

Emergency
An event for which an individual perceives that a response is essential to prevent or
reduce injury or property damage.
Environmental factors
Environmental conditions that had, or could have had an adverse effect on the
individual's actions or the performance of equipment.
Fair wear and tear
Damage to time-between-overhaul (TBO) items such as gearboxes, tires, and other items
that deteriorate with use. (Hot starts, overspeeds, and overtorques are not considered fair
wear and tear.)
Flight crew
Personnel on flight pay who are involved in operation of the aircraft.
Forced landing
A landing caused by failure or malfunction of engines, systems, or components that
makes continued flight impossible.
Foreign object damage (FOD)
Damage to Army vehicle/equipment/property as a result of objects alien to the
vehicle/equipment damaged. Excludes aircraft turbine engine(s) defined as a FOD
incident.
Fratricide/Friendly Fire (FF)
B-4
A circumstance applicable to persons killed or wounded, or equipment damaged, in
military action, mistakenly or accidentally, by friendly forces actively engaged with the
enemy, who are directing fire at a hostile force or what is thought to be a hostile force.
Fratricide/FF incidents will be primarily investigated and reported under DODI 6055.7.
Ground accident
Any accident exclusive of aviation (flight/flight related) (for example, AMV, ACV, POV,
marine.)
Hospitalization
Admission to a hospital as an inpatient for medical treatment.
Human error
Human performance that deviated from that required by the operational standards or
situation. Human error in accidents can be attributed to a system inadequacy/root cause in
training, standard, leader, individual, or support failure indicated below:
Human factors
Human interactions (man, machine, and/or environment) in a sequence of events that
were influenced by, or the lack of human activity, which resulted or could result in an
Army accident.
Individual failure
Soldier knows and is trained to standard but elects not to follow standard (self-discipline
-mistake due to own personal factors).
Initial Denial Authority
The official at HQDA-level with the authority to deny release of a document, in whole or
in part, under the Freedom of Information Act.
B-5
Injury
A traumatic wound or other condition of the body caused by external force, including
stress or strain. The injury is identifiable as to time and place of occurrence and member
or function of the body affected, and is caused by a specific event or incident or series of
events or incidents within a single day or work shift.
Installation-level safety manager
a. The senior full-time safety professional responsible for providing safety support to
Army installations, including camps, stations, military communities, and USAR
organizations.
b. State Safety Manager or Specialist (ARNG).
Intent for flight
Intent for flight begins when aircraft power is applied, or brakes released, to move the
aircraft under its own power with an authorized crew. Intent for flight ends when the
aircraft is at a full stop and power is completely reduced.
Investigation
A systematic study of an accident, incident, injury, or occupational illness circumstances.
Lost-time case
A nonfatal traumatic injury that causes any loss of time from work beyond the day or
shift in which it occurred or a nonfatal non-traumatic illness/disease that causes disability
at any time. This definition will be used when computing civilian lost-time frequencies
for DOL reporting.
B-6
Lost-workday case involving days away from work
Cases in which an accident results in Army personnel missing one or more days of work.
Days away from work are those workdays (consecutive or not) on which Army personnel
would have worked but could not because of injury, occupational illness, or job-related
physical deficiencies detected during medical surveillance examinations. Excluded are
days that Army personnel would not have worked even though able to work (for
example, weekends or holidays) and the day of the injury or onset of occupational illness.
Materiel factors
When materiel elements become inadequate or counter-productive to the operation of the
vehicle/equipment/system.
Medical treatment
Any treatment (other than first aid) administered by a physician or by registered
professional medical personnel under the orders of a physician.
Nonappropriated fund (NAF) employees
Employees paid from nonappropriated funds, including summer and winter hires and
special NAF program employees. Military personnel working part-time in NAF
employment are excluded.
Nonfatal case without lost workdays
Cases other than lost-workday cases where Army military or civilian personnel, because
of an injury or occupational illness, experienced one or more of the following:
a. Permanent transfer to another job or termination.
B-7
b. Medical treatment greater than first aid.
c. Loss of consciousness.
d. Restricted work activity or profile.
e. Diagnosis as having an occupational illness that did not result in a fatality or lost
workday case. This includes newly diagnosed occupational illnesses detected on routine
physical examinations.
Occupational illness
Non-traumatic physiological harm or loss of capacity produced by systemic infection;
continued or repeated stress or strain; for example, exposure to toxins, poisons, fumes; or
other continued and repeated exposures to conditions of the work environment over a
long period of time. Includes any abnormal physical or psychological condition or
disorder resulting from an injury, caused by long- or short-term exposure to chemical,
biological, or physical agents associated with the occupational environment. For practical
purposes, an occupational illness is any reported condition that does not meet the
definition of an injury.
Occupational injury
A wound or other condition of the body caused by external force, including stress or
strain. The injury is identifiable as to time and place of the occurrence and a member or
function of the body affected, and is caused by a specific event or incident or series of
events or incidents within a single day or work shift.
Off-duty
Army personnel are off-duty when they:
a. Are not in an on-duty status, whether on or off Army installations.
B-8
b. Have departed official duty station, temporary duty station, or ship at termination of
normal work schedule.
c. Are on leave and/or liberty.
d. Are traveling before and after official duties, such as driving to and from work.
e. Are participating in voluntary and/or installation team sports.
f. Are on permissive (no cost to Government other than pay) temporary duty.
g. Are on lunch or other rest break engaged in activities unrelated to eating or resting.
On-duty
Army personnel are on-duty when they are:
a. Physically present at any location where they are to perform their officially assigned
work. (This includes those activities incident to normal work activities that occur on
Army installations, such as lunch, coffee, or rest breaks, and all activities aboard vessels.
b. Being transported by DOD or commercial conveyance for the purpose of performing
officially assigned work. (This includes reimbursable travel in POVs for performing
TDY, but not routine travel to and from work.)
c. Participants in compulsory physical training activities (including compulsory sports).
Permanent total disability
Any nonfatal injury or occupational illness that, in the opinion of competent medical
authority, permanently and totally incapacitates a person to the extent that he or she
cannot follow any gainful employment. (The loss or loss of use of both hands, feet, eyes,
or any combination thereof as a result of a single accident will be considered as
permanent total disability.)
Permanent partial disability
B-9

Any injury or occupational illness that does not result in death or permanent total
disability but, in the opinion of competent medical authority, results in the loss or
permanent impairment of any part of the body, with the following exceptions:
a. Loss of teeth.
b. Loss of fingernails or toenails.
c. Loss of tip of fingers or tip of toe without bone involvement.
d. Inguinal hernia, if it is repaired.
e. Disfigurement.
f. Sprains or strains that do not cause permanent limitation of motion.
Precautionary landing
A landing resulting from unplanned events that makes continued flight inadvisable.
Preexisting physical condition
A medical condition that existed prior to the occurrence of the accident.
Recommendations
Those actions recommended to the command to correct system inadequacies that caused,
contributed, or could cause or contribute to an Army accident. Also referred to in this
pamphlet as corrective action, remedial measures and/or countermeasures.
Recordable
Reportable accident that meets the minimum criteria stated in the regulation for Class A-
D accidents and Class E and FOD incidents.
Reportable
All occurrences that cause injury, illness, or property damage of any kind must be
reported to the soldier's/employee's/unit's servicing/ supporting safety office.
B-10

Restricted work activity
Individual's injury is such that they are unable to perform their normal duties (for
example, light-duty, profile).
ROTC personnel
a. Members of the ROTC during periods of basic or advanced training at premises owned
or under the control of the Army whether on or off duty.
b. Cadets performing professional enrichment training while under Army supervision and
directed by competent orders, regardless of the location of the training site. Regular
training on
campus is excluded; that is, weekly drill and classroom instruction.
c. Cadets involved in rifle and pistol marksmanship training under Army supervision on
any firing range.
d. Cadets undergoing ROTC flight instruction.
Standards failure
Standards/procedures not clear or practical, or do not exist)
Support Failure
Inadequate equipment/facilities/services in type, design, availability, or condition, or
insufficient number/type of personnel, which influenced human error, resulting in an
army accident.
System inadequacy
B-11

A tangible or intangible element that did not operate to standards, resulting in human
error or materiel failure. Also referred to in this pamphlet as causes, readiness
shortcomings and/or root causes.
Training failure
Soldier/individual not trained to known standard (insufficient, incorrect or no training on
task--insufficient in content or amount)
B-12

Appendix C: Army Accident Classification and Investigation
A.1 General
Army accident classes are used to determine the appropriate investigative and reporting
procedures. The same classification system is used for accidents that occur in the air or
on the ground. The classification definitions below are from Army Regulation 385-40
Accident Reporting and Records, which prescribes policy on accident reporting and
recordkeeping procedures for the Army. This updated publication was extensively
revised in early 1994 and released in November of 1994. Due to the extensive revisions,
the changed portions of the regulation were not highlighted. This is the most current
regulation update and is currently used in the U.S. Army Safety Center. AR 385-40
applies to the Active Army, the Army National Guard, the U.S. Army Reserve, and Army
appropriated fund employees. This regulation is also applicable during full mobilization.
This covers the spectrum of personnel involved in the accidents in this research and
anything reported during the conflict in the Middle East.
A.2 Accident Classifications
Accident classes are as follows:
(1) Class A accident: An Army accident in which the resulting total cost of property
damage is $1,000,000 or more; an Army aircraft or missile is destroyed, missing, or
abandoned; or an injury and/or occupational illness results in a fatality or permanent total
disability.
(2) Class B accident: An Army accident in which the resulting total cost of property
damage is $200,000 or more, but less than $1,000,000; an injury and/or occupational
C-1
illness results in permanent partial disability, or when five or more personnel are
hospitalized as inpatients as the result of a single occurrence.
(3) Class C accident: An Army accident in which the resulting total cost of property
damage is $10,000 or more, but less than $200,000; a nonfatal injury that causes any loss
of time from work beyond the day or shift on which it occurred; or a nonfatal
occupational illness that causes loss of time from work (for example, 1 work day) or
disability at any time (lost time case).
(4) Class D accident: An Army accident in which the resulting total cost of property
damage is $2,000 or more but less than $10,000.
Note. Nonfatal injuries/illnesses (restricted work activity, light duty, or profile) will only
be recorded in ASMIS in conjunction with recordable property damage accidents.
(5) Class E aviation incident: An Army incident in which the resulting damage cost and
injury severity do not meet the criteria for a Class A-D accident ($2,000 or more damage;
lost time/restricted activity case). A Class E aviation incident is recordable when the
mission (either operational or maintenance) is interrupted or not completed. Intent for
flight may or may not exist. An example of a recordable Class E incident is: during
maintenance operational check (MOC) the engine quits. Examples of nonrecordable
Class E incidents are: chip detector light illumination and the component is not replaced;
mission interrupted/aborted because of weather, unless mission is canceled; failure of
Fair Wear and Tear (FWT) items found on pre- or post-flight inspection; radio failure
where radio is replaced; closing a door found open in flight.
C-2
(6) Foreign Object Damage (FOD) aviation incident (Also known as Class F
incident): Recordable incidents confined to aircraft turbine engine damage (does not
include installed aircraft Auxiliary Power Units (APU)) as a result of internal or external
FOD, where that is the only damage.
A.3 Accident Investigation Boards
There are different investigation procedures for different classes of accidents, these are
described below.
(1) The following accidents will be investigated by a board consisting of a minimum of
three members. The members should be officers, warrant officers, or DA safety and
occupational health specialists/managers/engineers, GS-018/803-11/12/13/14.
(a) All Class A and B accidents, except those involving off-duty military
fatalities/injuries not involving military operations.
(b) Any accident, regardless of class, that an appointing authority believes may
involve a potential hazard serious enough to warrant investigation by a
multimember board.
(2) Class C aircraft accidents (flight, flight related, or aircraft ground) will be investigated
by a board of at least one officer, warrant officer, or DA safety and occupational health
specialists/ managers/engineers, GS-018/803-9/11/12/13/14 (DA safety professional must
directly manage an aviation safety program).
(3) When an accident involves Army property and another U.S. Military Service's
property, a single joint board may be convened. Board members may be from the two
C-3
Services involved. Appointment of the members and identification of a senior member as
president will be made by mutual agreement between the commanders of the two Safety
Centers. For uniform reporting within each service, the board's proceedings will be
recorded in the format required by each service.
(4) The following accidents will be investigated by one or more officers, warrant officers,
safety officers/NCOs, supervisors, or DA safety and occupational health
specialist/manager/engineer, GS-018/ 803-9/11/12/13/14:
(a) Class C accidents.
(b) Class D accidents, Class E, and FOD incidents.
C-4
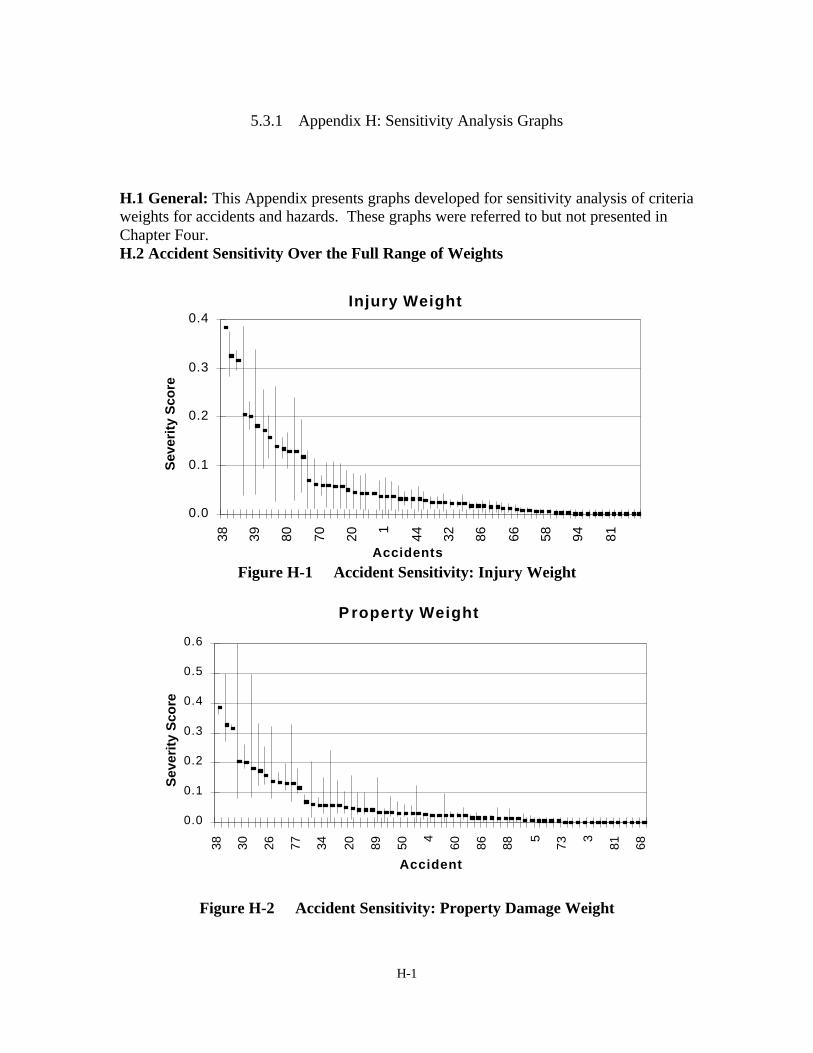
5.3.1 Appendix H: Sensitivity Analysis Graphs
H.1 General: This Appendix presents graphs developed for sensitivity analysis of criteria weights for accidents and hazards. These graphs were referred to but not presented in
38
38
Chapter Four.30
H.2 Accident Sensitivity Over the Full Range of Weights
39
26
8077
Injury Weight
0.434
70
20
20
0.389
1
50
0.2 44
4
60
32
0.1 86
86
0.088
66
5 58
Accidents73
Figure H-1 Accident Sensitivity: Injury Weight
94
3
81
81P roperty Weight
680.6
0.5
0.4
0.3
0.2
0.1
0.0
Accident
Sev
erit
y S
core
S
ever
ity
Sco
re
Figure H-2 Accident Sensitivity: Property Damage Weight
H-1

Environment Weight
0.4
0.3
0.2
0.1
0.0
Accident
Figure H-3 Accident Sensitivity: Environment Weight
OMF Weight 0.4
0.3
0.2
0.1
0.0
Accidents
Figure H-4 Accident Sensitivity: Other Mission Factors Weight
Sev
erit
y S
core
S
ever
ity
Sco
re
1
38
39
80
70
20
44
32
86
66
58
94
81
4 5 3
38
30
26
77
34
20
89
50
60
86
88
73
81
68
H-2

H.3 Hazard Sensitivity Over the Full Range of Weights
Degree of InjuryS
I18
SI1
80.12
SI1
5 S
I15
0.1
0.08S
I16
SI1
6
0.06 S
I01
SI0
1
0.04
SI1
3 S
I13
0.02
SI0
60
SI0
6
SI0
7 S
I07
Hazar d S
I99
SI9
9 Figure H-5 Hazard Sensitivity: Injury Weight
SI1
1
SI1
1 S
I09
SI0
9 S
I08
SI0
8 P roperty
0.14
0.12
0.1
0.08
0.06
0.04
0.02
0
Hazard
Sev
erit
y S
core
S
ever
ity
SI1
7
SI1
7
Figure H-6 Hazard Sensitivity: Property Damage Weight
H-3
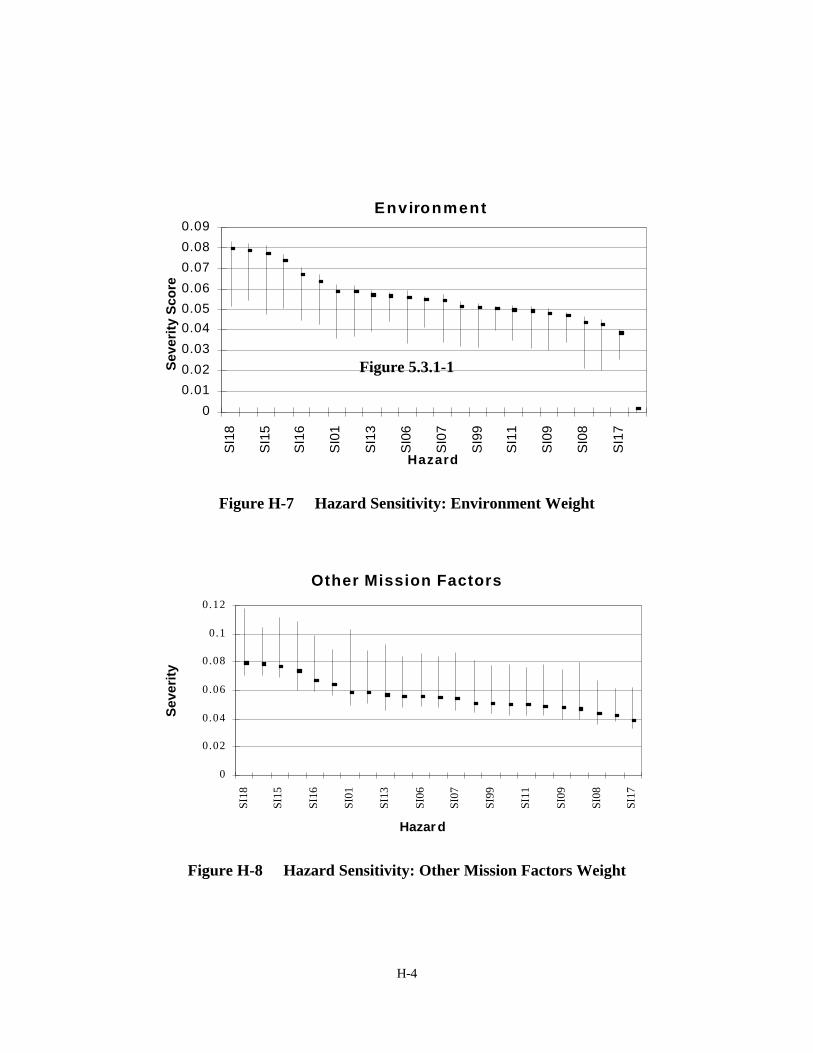
0.09
0.08
0.07
0.06
0.05
0.04
0.03
0.02
0.01
0
Environment
Figure 5.3.1-1
Hazard
Figure H-7 Hazard Sensitivity: Environment Weight
Other Mission Factors
Sev
erit
y S
ever
ity
Sco
re
SI1
8 SI
18
SI1
5
SI1
6
SI0
1
SI1
3
SI0
6
SI0
7
SI9
9
SI1
1
SI0
9
SI0
8
SI1
70.12
0.1
0.08
0.06
0.04
0.02
0
Hazar d
Figure H-8 Hazard Sensitivity: Other Mission Factors Weight
SI15
SI16
SI01
SI13
SI06
SI07
SI99
SI11
SI09
SI08
SI17
H-4

BIBLIOGRAPHY
ANACAPA Sciences Inc. Aviation System Safety Risk Management Tool Analysis. Volume 1. Contract MDA 903-92-D-0025 (ADA273503), Fort Rucker, AL, October 1993.
Army Safety Center Web Site, safety.army.mil/stats/index.html
Bunn, Derek. Applied Decision Analysis. New York: McGraw-Hill, 1984.
Chief of Staff of the Army Statement on Risk Management. 27 July 1995.
Clemen, Robert T. Making Hard Decisions: An Introduction to Decision Analysis, 2nd
Edition. Duxbury Press
Department of the Army. Accident Reporting and Records. Army Regulation 385-40. Washington DC: HQDA, 1 November 1994
Department of the Army. Army Accident Investigating and Reporting. Department of the Army Pamphlet 385-40. Washington DC: HQDA, 1 November 1994
Department of the Army. Military Environmental Protection. FM 20-400, September 1997 (draft)
Department of the Army. Risk Management. FM 100-14, April 1998.
Department of the Army. System Safety Engineering and Management. Army Regulation 385-16. Washington DC: HQDA, 3 May 1990
DPL for Windows 95. Versions 3.2, 1.44 MB, disk. Computer Software. ADA Decision Systems Advanced Version (Student Edition), 1995
Federal Aviation Administration. The FAA Plan for Research, Engineering and Development. Volume 1. Washington DC, Jan 1989 (AD-A221263)
Grelk, Brian, J. A CERCLA-Based Decision Support System for Environmental Remediation Strategy Selection. Thesis, Masters of Science, Air Force Institute of Technology, AFIT/GOR/ENS/97M-10. 1997.
Hunsaker, Oren. Personal Interview, 1998.
Jackson, Jack A. Jr., Jones, Brian, L., Lehnkuhl, Lee, J., An Operational Analysis for 2025, Maxwell AFB, AL: Air University, 1996.
BIB-1
Keeney, Ralph L. Value Focused Thinking: A Path to Creative Decision Making. Cambridge Mass; Harvard University Press, 1992.
Kerschus, Christine, E. A CERCLA-Based Decision Model to Support Remedy Selection for an Uncertain Volume of Contaminants at a DOE Facility, Thesis,
Masters of Science, Air Force Institute of Technology, AFIT/GEE/GOR/97D-01. 1997.
Kinzey, R.P. System Safety Risk Assessment Manual. Naval Safety Center, Norfolk, VA, Jan 1989 (AD-A205904)
Kirkwood, C. W. Strategic Decision Making: Multiobjective Decision Analysis With Spreadsheets. California: Wadsworth Publishing Co, 1997.
Kloeber, Jack, M. Personal Interview.
Logical Decisions for Windows 95, Version 5.0, 1.44 MB, disk. Computer Software. Logical Decisions, April 1998
Merkhofer, Miley W., Rarilee Conway, and Robert G. Anderson. "Multiattribute Utility Analysis as a Framework for Public Participation in Siting a Hazardous Waste Management Facility," Environmental Management, 21: 831-839 (1997).
Moon, Tony. Personal Interview. 1998.
Risk Management Information Database, http://www.rmis.army.mil
U.S. Army Safety Center. Director of Army Safety’s FY98 Strategic Plan for the U.S. Army Safety Center. Fort Rucker, AL, April 1998.
Warren, Colonel. Personal Interview. 1998.
Wilson, Helene, A. A Risk Analysis of Remediation Technologies for a DOE Facility, Thesis, Masters of Science, Air Force Institute of Technology, AFIT/GOR/ENS/98M-28. 1997.
BIB-2


![Solution Focused Approach Dd Site[1]](https://img.dokumen.tips/doc/110x75/55d73809bb61ebc1578b46b7/solution-focused-approach-dd-site1.jpg)