Embed Size (px)
Citation preview

System Theoretic Approach for Determining Causal
Factors of Quality Loss in Complex System Design
By
Stephanie L. Goerges
B.S. Aeronautical and Astronautical Engineering (1993)
Purdue University
M.S. Engineering (1995)
Purdue University
Submitted to the System Design and Management Program
In Partial Fulfillment of the Requirements for the Degree of
Master of Science in Engineering and Management
at the
Massachusetts Institute of Technology
February 2013
2013 Stephanie L. Goerges
All rights reserved
The author hereby grants to MIT permission to reproduce and to distribute publicly paper and
electronic copies of this thesis document in whole or in part in any medium now known or
hereafter created.
Signature of Author___________________________________________________________
Stephanie L. Goerges
System Design and Management Program
February 2013
Certified by_________________________________________________________________
Qi Van Eikema Hommes
Thesis Supervisor
Engineering Systems Division
Accepted by________________________________________________________________
Patrick Hale
Director
System Design and Management Program

Page 2
THIS PAGE INTENTIONALLY LEFT BLANK
Page 3
System Theoretic Approach for Determining Causal
Factors of Quality Loss in Complex System Design
By
Stephanie L. Goerges
Submitted to the System Design and Management Program
on January 18, 2013 in Partial Fulfillment of the
Requirements for the Degree of Master of Science in
Engineering and Management
ABSTRACT
Identifying the factors that could lead to the loss of quality is difficult for large, complex
systems. Traditional design methods such as Failure Modes and Effects Analysis (FMEA),
Fault Tree Analysis (FTA), and Robust Design have been proven effective at the component
level but are less effective for factors that involve interactions between components, software
flaws and external noises.
This thesis applies System Theoretic Process Analysis (STPA) to two case studies at
Cummins, Inc. The first case study was a technology change to a subsystem in a new product
development project. The intent of this case was to determine if STPA, applied broadly to
safety and hazard analysis, would be effective in identifying causes of quality losses. The
second case was a historical quality improvement project. The intent of this case was to
determine if STPA would be effective for developing solutions to causes of quality losses.
The results of the case studies were compared to the traditional design methods.
Use of STPA allowed the design teams to identify more causal factors for quality losses than
FMEA or FTA, including component interactions, software flaws, and omissions and
external noises. STPA was also found to be complementary to Robust Design Methods.
Finally, use of STPA was effective for analyzing the complete hierarchical structure of the
system for solutions to potential causes of quality losses.
Thesis Supervisor: Qi van Eikema Hommes
Title: Research Associate

Page 4
ACKNOWLEDGEMENTS
Throughout this journey in System Design and Management I have had the privilege to work
with four remarkable women. This thesis is dedicated to each of you:
Elizabeth Carey, for your mentorship and motivation, and for giving me the luxury to fail
while ensuring I ultimately succeed
Karen DeSanto, for sharing my vision of what is possible and giving me the opportunity to
make it real
Nancy Leveson, for inspiring me to think about failure in a new way by bringing me back to
my control theory roots
And
Qi van Eikema Hommes, for sharing your wisdom and experiences and for patiently guiding
me through this process, it has been my honor
I offer my sincerest thanks to Cummins, Inc. for sponsoring my research, indulging in my
interest in Systems Engineering and providing the opportunity to practice my craft every day.
I also thank the many leaders and employees who made it possible to conduct my research
and enabled me to balance work and school and life; particularly Maninder Singh, Josh
Harris, Dave Dixon, Jeff O’Neill, Jim Fier and Dane Whitley. I couldn’t have done this
without you!
And finally I offer tremendous gratitude to my family and friends who have supported me in
all things and kept me sane; namely, my parents, Peter and Judy Goerges, my sisters Thalia
King and Adrienne Wildt, and Hugh Bauer. Thank you for encouraging me to reach for the
stars while keeping me grounded. I promise to answer the phone from now on!

Page 5
TABLE OF CONTENTS
1 INTRODUCTION 7
1.1 MOTIVATION 7 1.2 THESIS OBJECTIVES 15 1.3 APPROACH 17
2 LITERATURE SEARCH 19
2.1 NEW PRODUCT DESIGN AND DEVELOPMENT 19 2.2 RELIABILITY THEORY AND AVAILABLE QUALITY METHODS 23 2.2.1 FAILURE MODES AND EFFECTS ANALYSIS 23 2.2.2 FAULT TREE ANALYSIS 25 2.2.3 ROBUST DESIGN 26 2.3 SYSTEMS THEORY 29 2.3.1 SOCIO-TECHNICAL SYSTEMS 29 2.3.2 COMPLEXITY 30 2.3.3 SYSTEMS ENGINEERING METHODS 31 2.4 SYSTEM THEORETIC PROCESS ANALYSIS 35
3 RESEARCH METHODS 39
3.1 ADAPTATION OF STPA FOR QUALITY LOSSES 39 3.2 CASE STUDY EXECUTION 41
4 CASE STUDY 1: TECHNOLOGY CHANGE IN NEW PRODUCT DEVELOPMENT 43
4.1 SYSTEM OVERVIEW AND PREPARATORY STEPS 43 4.1.1 SYSTEM DESCRIPTION AND BOUNDARY 43 4.1.2 PREPARATORY STEP 1: IDENTIFY SYSTEM LOSS AND UNDESIRED SYSTEM STATES 47 4.1.3 PREPARATORY STEP 2: HIERARCHICAL CONTROL STRUCTURE 49 4.2 ANALYSIS STEPS 59 4.2.1 ANALYSIS STEP 1: IDENTIFY INADEQUATE CONTROL ACTIONS 59 4.2.2 ANALYSIS STEP 2: IDENTIFY CAUSES OF INADEQUATE CONTROL ACTIONS 61
5 CASE STUDY 2: HISTORICAL WARRANTY DESIGN ISSUE 77
5.1 SYSTEM DESCRIPTION AND PREPARATORY STEPS 77 5.1.1 SYSTEM DESCRIPTION AND BOUNDARY 77 5.1.2 PREPARATORY STEP 1: IDENTIFY SYSTEM LOSS AND UNDESIRED SYSTEM STATES 78 5.1.3 PREPARATORY STEP 2: HIERARCHICAL CONTROL STRUCTURE 78 5.2 ANALYSIS STEPS 83 5.2.1 ANALYSIS STEP 1: IDENTIFY INADEQUATE CONTROL ACTIONS 83 5.2.2 ANALYSIS STEP 2: IDENTIFY CAUSES OF INADEQUATE CONTROL ACTIONS 83
6 RESULTS 89
6.1 RECOMMENDATIONS 89 6.1.1 SPONSORING COMPANY IMPROVEMENT RECOMMENDATIONS 89 6.1.2 STPA IMPROVEMENT RECOMMENDATIONS 91

Page 6
6.2 COMPARISONS WITH TRADITIONAL METHODS 95 6.2.1 FMEA 95 6.2.2 FTA 95 6.2.3 ROBUST DESIGN 99
7 CONCLUSIONS 103
7.1 RECOMMENDATION SUMMARY 103 7.2 FUTURE RESEARCH 103
8 REFERENCES 105

Page 7
1 Introduction
1.1 Motivation
As the automotive products are becoming more complex, predicting the capability of the
system to meet key performance objectives also becomes more difficult. Two measures that
reflect a product’s complexity are the number of controls devices, sensors and actuators, and
the number of calibratible software variables used to achieve product performance objectives.
This complexity is illustrated by four recent product generations developed by Cummins, Inc,
a global leader in power systems (Cummins). Within this twelve-year period, the number of
sensors increased 280% and the number of actuators increased 214%, see Figure 1. Over the
same time period the number of calibratible software variables increased 202%. See Figure 2.
To manage this complexity growth, more staff resources are needed to design the increased
number of system components as well as interactions among these components. Quality
methods such as Failure Modes and Effects Analysis (FMEA), Fault Tree Analysis (FTA)
and Robust Design are typically used by the product design organization throughout the
development process to determine the design weaknesses that could lead to quality losses.
Following a product launch, customer complaints and warranty claims are tracked.
Improvement projects are initiated to correct the causes of these quality losses. Many of
these projects involve the failure of a single component. As product complexity increases,
there is an increase in the number of systems-related incidents. These incidents differ from
component failures. In systems-related incidents, the system fails to achieve the desired
performance due to component interactions, software design flaws, or the presence of
unanticipated noise factors.
Failures due to subsystem interactions occur when all components in the system perform as
designed but normal operation of one or more components presents a noise factor to a second
component or group of components, that when combined with the normal operation of the
second component leads to a loss of overall system functionality (Leveson 2012). An
example of a subsystem interaction failure is a loss of cruise control functionality. In this

Page 8
case the cruise control algorithm uses the transmission output shaft speed and engine speed
as inputs to control the vehicle speed. A change was made to the transmission that altered
the system’s gear ratio. As a result the algorithm disabled the cruise control function as it
determined the gear ratio was infeasible. The algorithm operated as intended by disabling the
cruise control if the estimated gear ratio is out of range and the transmission was correctly
translating engine speed to the desired vehicle speed. However, these two sub-systems no
longer worked together.
Failures due to software design flaws occur when correctly or incorrectly implemented
software leads to loss of or unintended system functionality. This can be due to incorrect
execution of compete and correct software requirements or due to insufficient requirements
for the software and system performance (Leveson 2012). An example of a software design
flaw involves engine startability. For the engine to start correctly, one subroutine measures
the engine speed using a speed sensor. A second subroutine controls the amount of fuel
injection using the engine speed measurement as an indication to begin injecting fuel. The
timing between these two subroutines is critical for combustion to begin. The subroutine
measuring the engine speed will set a no-start error if fuel is not injected within a window of
time after the minimum engine speed is achieved. In this case, the execution rate of the two
algorithms was such that the engine speed subroutine measured the minimum engine speed,
flagged the beginning of fuel injection event and set the no-start error before the fuel
injection subroutine was scheduled to run. The missing requirement in this case was that the
no-start error calculation shall begin after the beginning of fuel injection event routine.

Page 9
Figure 1: Growth in Number of Calibratible Parameters over Product Generations
Figure 2: Growth in the Number of Calibratible Parameters over Product Generations
1
1.5
2
2.5
3
0 4 8 12
No
rma
lize
d N
um
be
r o
f
Se
nso
rs/A
ctu
ato
rs
Year
Growth in Sensors and Actuators over
Product Generations
Sensors Actuators
1.0
1.5
2.0
0 4 8 12
No
rma
lize
d N
um
be
r
of
Ca
lib
rati
ble
Pa
ram
ete
rs
Year
Growth in Number of Calibratible
Parameters over Product Generations

Page 10
THIS PAGE INTENTIONALLY LEFT BLANK
Page 11
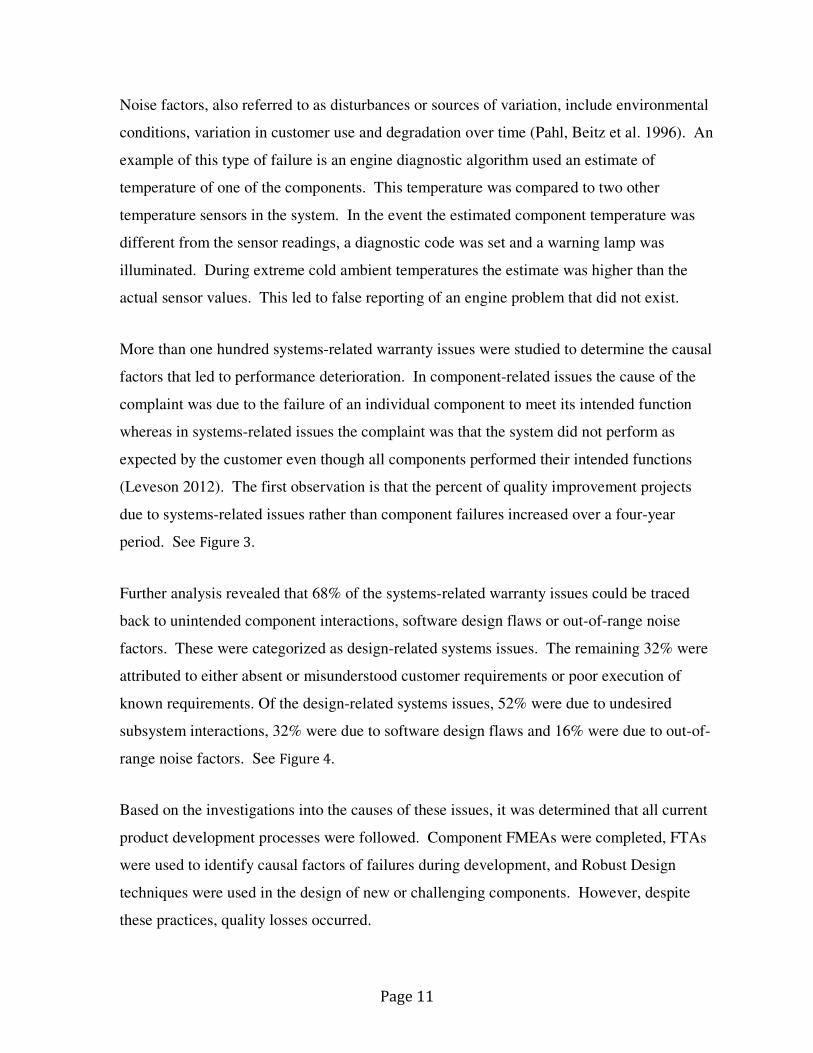
Noise factors, also referred to as disturbances or sources of variation, include environmental
conditions, variation in customer use and degradation over time (Pahl, Beitz et al. 1996). An
example of this type of failure is an engine diagnostic algorithm used an estimate of
temperature of one of the components. This temperature was compared to two other
temperature sensors in the system. In the event the estimated component temperature was
different from the sensor readings, a diagnostic code was set and a warning lamp was
illuminated. During extreme cold ambient temperatures the estimate was higher than the
actual sensor values. This led to false reporting of an engine problem that did not exist.
More than one hundred systems-related warranty issues were studied to determine the causal
factors that led to performance deterioration. In component-related issues the cause of the
complaint was due to the failure of an individual component to meet its intended function
whereas in systems-related issues the complaint was that the system did not perform as
expected by the customer even though all components performed their intended functions
(Leveson 2012). The first observation is that the percent of quality improvement projects
due to systems-related issues rather than component failures increased over a four-year
period. See Figure 3.
Further analysis revealed that 68% of the systems-related warranty issues could be traced
back to unintended component interactions, software design flaws or out-of-range noise
factors. These were categorized as design-related systems issues. The remaining 32% were
attributed to either absent or misunderstood customer requirements or poor execution of
known requirements. Of the design-related systems issues, 52% were due to undesired
subsystem interactions, 32% were due to software design flaws and 16% were due to out-of-
range noise factors. See Figure 4.
Based on the investigations into the causes of these issues, it was determined that all current
product development processes were followed. Component FMEAs were completed, FTAs
were used to identify causal factors of failures during development, and Robust Design
techniques were used in the design of new or challenging components. However, despite
these practices, quality losses occurred.

Page 12
THIS PAGE INTENTIONALLY LEFT BLANK

Page 13
Figure 3: Growth in Systems-Related Warranty Reduction Projects by Year
Figure 4: Causes of Systems-Related Warranty Issues
5
10
15
20
25
0 1 2 3Pe
rce
nt
of
Tota
l Pro
ject
s
Time (Years)
Growth in Systems-Related Warranty
Reduction Projects by Year
Requirements and
Execution
32%
Component
interactions
35%
Software
design flaws
22%
External
noises
11%
Causes of Systems-Related Warranty Issues

Page 14
THIS PAGE INTENTIONALLY LEFT BLANK

Page 15
1.2 Thesis Objectives
The product development process has historically relied on approaches such as FMEA, FTA
and Robust Design to predict undesirable system behavior. However, these approaches had
limited or inconsistent ability to detect system level performance issues, such as low power,
particularly in the presence of an out-of-range noise factor, unintended component
interactions or design flaws, as illustrated by the examples in Section 1.1.
In the search for a more suitable method for analyzing complex systems, hazard analysis
methods were reviewed. Safety, like quality, is an emergent property of the system. Where
emergent property is defined as “properties or behaviors of a system that are discovered (i.e.
properties that were there but latent), those that emerge spontaneously over time or space,
and those that arise in response to behavior of other systems and environments; in a
hierarchical view of systems, emergent properties show up at one level of the hierarchy, but
not at lower levels” (De Weck, Roos et al. 2011). Current hazard analyses methods include
the use of FMEAs and FTAs (Leveson 2012). Therefore, this was an appropriate area to
explore for improved quality methods.
System Theoretic Process Analysis (STPA) provides a method to determine the causal
factors that lead to an accident or loss by considering accidents as a control problem. Causes
for inadequate control are expanded to include not only component failures but also
interactions between system elements and the system with the environment in which it
operates. Furthermore the STPA process does not carry the assumptions that all elements of
the system, including software, have been designed or implemented correctly. The STPA
process also allows the product development team to identify weaknesses in the hierarchical
control structure at all levels: the operating process, manufacturing process and
organization’s design process (Leveson 2012).
However, STPA is currently applied to safety analysis. Given the problem of increasing
system quality losses facing the automotive industry, the emergent property of interest in this
study is not safety but product quality. This thesis will test the ability of the STPA process to

Page 16
identify causal factors of loss and areas for design improvement with respect to product
quality attributes rather than safety requirements by exploring the following questions:
Research Question 1: How can design organizations predict the emergent property of
system quality early in the design process using STPA?
Research Question 2: How can STPA be used to identify solutions for quality
problems in a complex system?
Page 17
1.3 Approach
STPA was applied to two industry case studies. The case studies were selected and
objectives for each case determined to specifically test the research questions of this thesis.
See Table 1.
Table 1: Summary of Research Objectives and Case Studies
RESEARCH QUESTION CASE STUDY
1. How can design organizations predict the
emergent property of system quality early in the
design process using STPA?
Technology Change in New Product
Development
2. How can STPA be used to identify solutions
for quality problems in a complex system?
Historical Quality Improvement Project
The first case study was a technology change to an on-going new product development
project. The purposes of this case study were to test the first research question as well as
compare the output of the STPA process to traditional quality methods with regard to the lists
of causal factors identified and level of effort needed to execute the processes.
The second case study was an historical design problem for which the causal factors had
been determined previously. The purpose of this case study was to test the second research
question. While the causal factors of this case were known, the solution to the problem
identified by the quality improvement project was unsatisfactory. The previously identified
solution addressed the product change but not the process failure that allowed the loss to
occur.

Page 18
THIS PAGE INTENTIONALLY LEFT BLANK

Page 19
2 Literature Search
“Quality cannot be achieved simply through testing and developing a product – it has to be
built-in from the beginning of the design process and maintained throughout the production
process” Pahl, Beitz & Wallace 1996
This chapter begins by discussing both the state of the art and the shortcomings of current
methods for improving quality in new product development. Systems theoretical methods
are then introduced with an emphasis on how these methods address some of the deficiencies
of traditional quality methods. Finally System Theoretic Process Analysis is discussed with
respect to safety and hazard analysis.
2.1 New Product Design and Development
According to Ulrich and Eppinger 2007, product quality is one of the five dimensions
indicating successful product development. Product quality is defined by the following
questions: “How good is the product resulting from the development effort? Does it satisfy
customer needs? Is it robust and reliable? Product quality is ultimately reflected in market
share and the price that customers are willing to pay” (Ulrich and Eppinger 2007).
The need for new products arises from customer demands for new functions and features,
improved quality and lower cost (Clark and Fujimoto 1989; Cusumano and Nobeoka 1992;
Wheelwright and Clark 1994; Brown and Eisenhardt 1995; Moorman and Miner 1998;
Ulrich and Eppinger 2007). The ability to meet these needs requires the use of innovation by
the producers of novel goods and services (Utterback and Abernathy 1975; Ettlie, Bridges et
al. 1984; Henderson and Clark 1990; Pahl, Beitz et al. 1996; Krishnan and Ulrich 2001; Sood
and Tellis 2005; Ulrich and Eppinger 2007; Baregheh, Rowley et al. 2009). Utterback and
Abernathy, 1975 define product innovation as follows: “A product innovation is a new
technology or combination of technologies introduced commercially to meet a user or a
market need” (Utterback and Abernathy 1975).
Product innovation, or change, can occur at multiple levels and in multiple dimensions. The
change can be incremental, such as the change to a single component of the system, this is

Page 20
sometimes referred to an evolutionary product innovation (Ettlie, Bridges et al. 1984;
Tushman and Anderson 1986).
The change may be more profound in nature, referred to as radical innovation (Ettlie, Bridges
et al. 1984; Tushman and Anderson 1986; Sood and Tellis 2005). Henderson and Clark, 1990
describe the difference between evolutionary and more radical product innovation as: “the
distinction between refining and improving an existing design and introducing a new concept
that departs in a significant way from past practice” (Henderson and Clark 1990). While
incremental innovation adds to a firm’s existing competencies, radical innovation drives the
needs for new skills and processes (Ettlie, Bridges et al. 1984; Tushman and Anderson 1986).
Henderson and Clark, 1990 also describe a third category of innovation, architectural
innovation, which distinguishes changes to individual components, as in evolutionary
innovation, from changes to the way components are integrated together. “We show that
architectural innovations destroy the usefulness of the architectural knowledge of established
firms, and that since architectural knowledge tends to become embedded in the structure and
information-processing procedures of established organizations, this destruction is difficult
for firms to recognize and hard to correct” (Henderson and Clark 1990). It is this third
category that most closely matches the types of change that occurred that motivated the need
for this research.
Uncertainty in System Design
Uncertainty: “not all requirements are known; not all criteria are established; the effect of a
partial solution on the overall solution or on other partial solutions is not fully understood or
only emerges slowly” (Pahl, Beitz et al. 1996)
Quality, like safety and reliability, is an emergent property of the system (De Weck, Roos et
al. 2011). Many researchers agree that emergent properties cannot be predicted a priori
(Pepper 1926; Crawley, de Weck et al. 2004; De Weck, Roos et al. 2011). According to
Baldwin and Clark, 2005, “Ex ante, the outcomes of design processes are uncertain…
Designs have structures made up of decisions and their dependencies… Because design

Page 21
processes are uncertain, the behavior of a newly designed artifact is not perfectly predictable,
and the ways users will react to it are not predictable either” (Baldwin and Clark 2005).
To ensure the new product is successful, it is of interest to understand the degree of quality as
early in the product development cycle as possible. Designs are “the instructions based on
knowledge that turn resources into things that people use and value. All goods and services
have designs, and a new design lies behind every innovation” (Baldwin and Clark 2005).
There are methods to improve learning about new technologies and identify the underlying
design structure at the various hierarchical levels that can be used to reduce uncertainty and
manage complexity (Henderson and Clark 1990; Eppinger and Browning 2012). These
methods, such as FMEA and Design Structure Matrix (DSM), will be discussed in more
detail in this chapter.

Page 22
THIS PAGE INTENTIONALLY LEFT BLANK

Page 23
2.2 Reliability Theory and Available Quality Methods
“Important prerequisites to prevent faults and disturbing factors, or at least limit their
effects, are the identification and estimation of possible faults an disturbing factors as early
as possible in the product development process.” Pahl, Beitz, Wallace, 1996
“Reliability is defined as “the probability that a system or component will satisfy its
requirements over a given period of time and under given conditions” (De Weck, Roos et al.
2011) Reliability can also be thought of as the risk of not satisfying the requirements. Where
“risk is described by frequency (probability) and the expected extent of the damage (scope)”
(Pahl, Beitz et al. 1996).
Quality is defined as the “ability to deliver requirements at a “high” level, as perceived by
people relative to other alternatives that deliver the same requirements” (De Weck, Roos et al.
2011). Genichi Taguchi defines two types of quality: “Product quality: what consumers
desire (e.g. functions or appearance); and Engineering quality: what consumers do not want
(e.g. functional variability, running cost, pollution)” (Taguchi, Chowdhury et al. 2005).
Current commonly used quality and reliability methods in product development are FMEA,
FTA and Robust Design. These techniques are described with a discussion of the benefits
and weaknesses of each method.
2.2.1 Failure Modes and Effects Analysis
FMEAs are conducted at any point in the lifecycle of a product or process to determine the
failure modes that may impact the customer or end user. Also identified are the effects of the
failure modes and the corrective actions to reduce the overall risk. The Risk Priority Number
(RPN), which is the product of the severity of the failure, the probability of occurrence and
the likelihood of detection, prioritizes failure modes and corrective actions. All three factors
of the RPN are scored on a 1-10 scale with a 10 being the highest severity, the highest
probability and the lowest likelihood of detection (Pahl, Beitz et al. 1996; Tague 2005).

Page 24
The specific process for conducting an FMEA varies from industry to industry and enterprise
to enterprise. In the automotive industry the guidelines are provided in a manual jointly
developed by Chrysler LLC, Ford Motor Company and General Motors Corporation. It is
recommended that a cross-functional team be brought together to conduct the analysis.
Typically functions as diverse as engineering and design, marketing, manufacturing and
service are represented (Chrysler Corporation 2008).
The first step in performing an FMEA is to determine the scope of the analysis and the
outputs of the system that are of highest importance to the customer or end user. Once the list
of functions is created, all of the ways the function could fail are listed. Each failure mode is
then scored for severity, occurrence and detection. Corrective actions are identified for the
highest risks. These may include design changes to either reduce the severity or the
probability of occurrence of a failure mode. They may also include changing the controls to
improve detection or gather more information (Chrysler Corporation 2008).
Once the list of functions is created, all of the ways the function could fail are listed. Each
failure mode is then scored for severity, occurrence and detection. Corrective actions are
identified for the highest risks. These may include design changes to either reduce the
severity or the probability of occurrence of a failure mode. They may also include changing
the controls to improve detection or gather more information (Chrysler Corporation 2008).
While an FMEA has the advantage of identifying component failures within a system that
can lead to a quality loss, it has a number of limitations. An FMEA does not adequately
address some of the systems-related quality issues described in Chapter 1:
� It is a static analysis that does not capture the dynamics of the system
� Interactions with systems outside the scope of the FMEA are not captured
� External disturbances are not easily identifiable
� Signal processing errors are not typically identified as failure modes
� Software is typically assumed to be designed and implemented correctly

Page 25
For large, complex systems an FMEA is unlikely to determine all weaknesses in the design
that can lead to quality losses (Duane 1964; Pahl, Beitz et al. 1996; Kang and Golay 2000;
Tague 2005).
Furthermore, due to the fact that the system structure is not explicitly defined as part of the
FMEA, the analysis relies on the experience level of the team performing the FMEA.
“Reliability of complex systems can be predicted directly from the design through prior
knowledge of the components, circuits, and configurations used…. But in electromechanical
systems unexpected component interactions often introduce unpredictable failure modes. In
this later case it is important that predictions be formulated from actual test or operating
experience as soon as possible” (Duane 1964). It may not be possible to obtain test or
operating experience at the early System Level Design phase, depending on the level of
change and availability of prototype parts.
2.2.2 Fault Tree Analysis
A fault tree analysis begins by identifying the loss or failure the designer wishes to avoid.
The tree is constructed by determining the logical relationships between functions of the
system. Failure modes and disturbances that lead to the undesired system effect can then be
identified. This method assumes the underlying functional structure of the system design is
known. However, once the relationships are established, the designer can use this structured
approach to determine the impact of both failures and external disturbances on the system
(Fussell, Powers et al. 1974; Lee, Grosh et al. 1985; Pahl, Beitz et al. 1996).
The process as described in Pahl, Beitz and Wallace, 1996:
� “Identify and negate functions
� Search for possible causes of possible malfunctions
� Determine the prerequisites for malfunctions to occur
� Introduce suitable design measures“

Page 26
One of the advantages of an FTA over an FMEA is that it is a structured approach that uses
the underlying logical and physical structure to isolate factors that contribute to losses (Lee,
Grosh et al. 1985).
However, there are several disadvantages to FTA. For large, complex systems scope can be
difficult to manage. “It has to be noted that because of the effort required to complete a full
fault-tree analysis, this method is usually limited to important areas and critical processes”
(Pahl, Beitz et al. 1996). While critical functions can be identified early in the FTA process,
determining the criticality of causal factors cannot. It is possible to overlook causal factors
that contribute to quality losses (Fussell, Powers et al. 1974).
Due to the tree structure of an FTA, individual causal factors may be identified, but it is
difficult to identify undesired interactions (Fussell, Powers et al. 1974). And like an FMEA,
an FTA is a static representation of the system. Dynamic causes and effects are difficult to
identify using this method.
2.2.3 Robust Design
“We define a robust product (or process) as one that performs as intended even under
nonideal conditions such as manufacturing process variations or a range of operating
situations. We use the term noise to describe uncontrolled variations that may affect
performance, and we say that a quality product should be robust to noise factors” (Ulrich and
Eppinger 2007). Types of uncontrolled variations include: part-to-part variation from
inconsistencies in the manufacturing processes, drift or deterioration over time, and
environmental differences (Phadke 1995; Taguchi, Chowdhury et al. 2005).
In Robust Design the aim is to create a design where the signal output of the primary
functions is large with respect to noise introduced by these external disturbances. To
determine the ratio of signals to noise, design of experiments can be created by identifying
the sources of variation, intentional or unintentional, and measuring the signals from the
primary functions for different settings of the variables. Statistical methods, such as Analysis
of Variation or regression, are then used to determine the “robustness” of the design at
Page 27
different design variable settings. Designs can be optimized by defining a quality loss
function relating the signals from the primary functions to the key design variables and
minimizing the loss function with respect to the design variables (Taguchi and Clausing
1990; Phadke 1995; Spiring and Yeung 1998; Rai and Allada 2003; Taguchi, Chowdhury et
al. 2005; Phadke and Dehnad 2007).
One of the techniques in Robust Design to identify the key variables for a design is the
Parameter Diagram or P-Diagram. See Figure 5. For the primary function the responses or
outputs are listed. Inputs are put into three categories: control factors, signal factors and
noise factors. Control factors are under the control of the designer. Signals are inputs to the
process and are generally considered bounded. Noises are uncontrolled inputs or
disturbances on the process (Phadke 1995; Taguchi, Chowdhury et al. 2005; Chrysler
Corporation 2008).
Robust Design is effective in determining external disturbances and design flaws of a single
component that contribute to quality losses. Robust Design further provides guidance for
design changes to resolve weaknesses and improve robustness. However, the method is not
necessarily suitable for solving problems involving system interactions. It can also be time
consuming and expensive. To determine statistically valid relationships between the
response variables and the key variables, a large number of experiments must be run. Early
in System Level Design, prototype parts need for experiments might be expensive and
difficult to obtain.

Page 28
Figure 5: Generic Parameter Diagram
A common shortfall of all reliability and quality methods is the inability to analyze the
dynamic aspects of a complex system. Researchers have noted the static nature of reliability
and quality methods. However, the same researchers proposed solution to this problem is to
analyze the system for reliability and quality throughout the development lifecycle. “Many
popular techniques for the analysis of reliability consider the problem only at a single point
in time. Such techniques certainly yield valuable information. However, a complete
treatment of system reliability requires careful consideration of the time variations introduced
by design changes or modifications in maintenance practices. The time varying nature of
reliability is particularly important in complex electromechanical system where wear-out
effects and interactions often invalidate conventional techniques for reliability prediction”
(Duane 1964).
However, on-going reliability analysis throughout the development lifecycle does not address
changes that occur in the system as it operates. These changes may be the result of wear,
aftermarket changes and additions or changes in customer use.
FunctionInputs Responses
Error States
Control
Factors
Noise
Factors

Page 29
2.3 Systems Theory
“In modern science, dynamic interaction appears to be the central problem in all fields of
reality. Its general principles are to be defined by System Theory.” Ludwig Von Bertalanffy,
1950
In 1950 Ludwig Von Bertalanffy proposed a general system theory. Explain the whole of a
system rather than attempt to reduce a system into its components. “As long as a system is a
unitary whole, a disturbance will be followed by the attainment of a new stationary state, due
to the interactions within the system. The system will ‘regulate’ itself. If, however, the
system is split up into independent causal chains, regulability disappears. The partial
processes will go on irrespective of each other“ (Von Bertalanffy 1950).
In his theory Von Bertalanffy described some of the attributes of complex systems: the
importance of the relationships between components, the concept of degradation of
interactions over time and the dynamic nature of interactions, interactions between a system
and its environment and the idea that changes to one element propagate through a system.
2.3.1 Socio-Technical Systems
Another concept that emerged at this time and built on the general system theory was the
interaction between humans and technological artifacts. “…organizations exist to do work –
which involves people using technological artifacts (whether hard or soft) to carry out a set
of tasks related to specified overall purposes” (Trist 1981). Some of the approaches that
emerged with the concept of socio-technical systems is considering the work organization as
a whole as opposed to studying the individual workers, treating workers as separate from but
complementary to the machines they operate and the study of macrosocial systems, otherwise
known as industrial sectors or domains (Trist 1981). Engineers in particular are central to
socio-technical systems. “The main task of engineers is to apply their scientific and
engineering knowledge to the solution of technical problems, and then to optimize those
solutions within the requirements and constraints set by material, technological, economic,
legal, environmental and human-related considerations” (Pahl, Beitz et al. 1996).

Page 30
2.3.2 Complexity
According to de Weck, et al., 2011, “A system is behaviorally complex if its behavior is
difficult to predict, analyze, describe or manage” (De Weck, Roos et al. 2011). In George
Miller’s 1956 paper “The Magical Number Seven, Plus or Minus Two: Some Limits on Our
Capacity for Processing Information” he concludes the reason for this difficulty “the span of
absolute judgment and the span of immediate memory impose severe limitations on the
amount of information that we are able to receive, process, and remember. By organizing the
stimulus input simultaneously into several dimensions and successively into a sequence of
chunks, we manage to break (or at least stretch) this informational bottleneck” (Miller 1956).
Jens Rasmussen, et. al., 1987 described the specific causes of mistakes people commonly
make when attempting to solve complex problems:
� The insufficient consideration of processes in time – focusing on a current snapshot
of system state
� Difficulties in dealing with exponential developments – “People have absolutely no
intuitive feeling for processes which develop exponentially, although they are
surrounded by such.”
� Thinking in causal series instead of causal nets – focusing on main effects and not
side effects.
The authors further noted two outcomes of failure to successfully solve complex problems: 1.
as a person struggles to solve complex problems, the number of decisions the person is
willing to make decreases, 2. solving the problem becomes more important that following
established or required processes, rules and regulations (Rasmussen, Duncan et al. 1987).
One method employed to manage complexity is reductionism or the use of information filters.
Information filters allow engineers to manage complexity (Henderson and Clark 1990).
However, as systems grow in complexity and the need to consider the whole increases, the
need for techniques to manage the complexity, not simplify it, has also grown.

Page 31
2.3.3 Systems Engineering Methods
“In socio-economic-technical processes, procedures and methods of systems theory are
increasingly important. Systems theory as an inter-disciplinary science uses special methods,
procedures and aids for the analysis, planning, selection and optimum design of complex
systems” (Pahl, Beitz et al. 1996).
One such method is the Design Structure Matrix (DSM). First introduced for analysis of
complex systems by Don Steward in 1981, the DSM has been used to describe physical and
logical systems, processes and organizations.
The DSM is a square matrix representing the elements of a system as well as the interactions
or dependencies between them. A DSM is also a matrix representation of a network diagram.
See Figure 6.
Figure 6: Generic Product Design Structure Matrix
1 2 3 4 5 6 7 8 9 10
Component 1 X X
Component 2 X
Component 3 X X
Component 4 X X X
Component 5
Component 6 X X X X X
Component 7 X
Component 8 X X X
Component 9 X X X
Component 10 X X
INTERACTIONS

Page 32
THIS PAGE INTENTIONALLY LEFT BLANK

Page 33
The DSM is a flexible tool that can be used to describe physical systems, organizational
systems, static systems or time-based systems, such as processes and schedules. The
representation of the interactions between components can be described very simply (it exists
or does not exist) or with more detail, such as the strength or type of interaction (Eppinger,
Whitney et al. 1994; Browning 2001; Sosa, Eppinger et al. 2004; Eppinger and Browning
2012).
The process for constructing a product system DSM is (Eppinger and Browning 2012):
� Subdivide the system into its elements at some level of abstraction, e.g. sub-systems
or components
� Populate the rows and columns, with the columns in the same order as the rows, with
elements of the system
� Determine the interactions between elements and fill out the intersecting cells in the
matrix with an indication of the interaction, such as an ‘X’ or color
DSM analysis has been used to identify the degree to which a product development
organization mirrors the technical design and predict technical communication that occurs
during the product development process (Morelli, Eppinger et al. 1995; Sosa, Eppinger et al.
2004; Eppinger and Browning 2012). A DSM can also be used to predict how changes can
propagate through the system by tracing the change through the underlying structure of the
system (Eckert, Keller et al. 2006).
However, even with time-based DSMs, the changes to the structure of the system are not
captured. Noted by general systems theory is that interactions between elements of the
system do degrade over time (Von Bertalanffy 1950). Therefore a method is needed to
capture such changes.

Page 34
THIS PAGE INTENTIONALLY LEFT BLANK

Page 35
2.4 System Theoretic Process Analysis
Systems Theoretic Process Analysis (STPA), a new method for performing a hazard analysis,
and System Theoretic Accident Model and Processes (STAMP), a new method for Accident
modeling and investigation, were developed by Dr. Nancy Leveson to address significant
deficiencies with traditional methods. According to Dr. Leveson “The primary reason for
developing STPA was to include new causal factors identified in STAMP that are not
handled by the older techniques. More specifically, the hazard analysis technique should
include design errors, including software flaws; component interaction accidents; cognitively
complex human decision-making errors; and social, organizational, and management factors
contributing to accidents” (Leveson 2012).
STPA can be applied to analyzing existing systems or used proactively for new systems in a
“safety-guided design process”. For this reason, STPA is suitable for all levels of product
innovation: radical, evolutionary or architectural. For a new design, STPA should be applied
after the initial system level requirements and architecture have been determined but before
the detailed design phase.
STPA is a four-step process (Leveson 2012):
Preparatory Step 1: Identify the hazards
Preparatory Step 2: Construct the hierarchical control structure
Analysis Step 1: Identify the unsafe control actions
a. A safe control action is not provided
b. Unsafe control action is provided
c. A safe control action is provided too early, too late or in the wrong order
d. A safe control action is stopped too soon or applied too long
Analysis Step 2: Identify causes of unsafe control actions
Guidewords are provided to identify the causal factors. See Figure 7 for detailed guidewords.

Page 36
Figure 7: From Engineering a Safe World, "Figure 4.8: A Classification of Control Flaws
Leading to Hazards" (Leveson, 2012)
Automated or human controllers may execute control actions. STPA was specifically
developed to include the role of humans in complex systems. The guidewords used in the
causal factor analysis have been adapted for use with human controllers (Stringfellow 2011):
� History
� Resources
� Tools and interface
� Training
� Human cognition characteristics
� Pressures
� Safety culture
� Communication
� Human physiology
Page 37
STAMP and STPA have been explored for accident and hazard analysis in multiple
industries and domains: aerospace, automotive, financial, food and drug, and health care
(Leveson 2002; Atherton 2005; Ota 2008; Couturier 2010; Helferich 2011; Spencer 2012).
However, all analyses to date have been related to safety, as opposed to other emergent
properties of the system.
Safety is the most extreme form of a quality loss. For this reason STPA may be an
appropriate method to identify causal factors for quality losses not directly related to
accidents and hazards.
In addition to providing a more holistic, systems-based approach to accident and hazard
analysis, STPA addresses some of the specific shortcomings of traditional reliability methods
that would fail to prevent the type of system failure exemplified by the quality loss examples
described in Chapter 1. The new accident model was “driven by the following goals:
� Expand accident analysis by forcing consideration of factors other than component
failures and human errors
� Provide a more scientific way to model accidents that produces a better and less
subjective understanding of why the accident occurred and how to prevent future ones
� Include system design errors and dysfunctional system interactions
� Allow for and encourage new types of hazard analyses and risk assessments that go
beyond component failures and can deal with the complex role software and humans
are assuming in high-tech systems
� Shift the emphasis in the role of humans in accidents from errors (deviations from
normative behavior) to focus on the mechanisms and factors that shape human
behavior (i.e. the performance-shaping mechanisms and context in which human
actions take place and decisions are made)” (Leveson 2012)
In addition to these things, STPA considers the dynamics of a system, an element specifically
missing from all other current reliability and quality assessment methods.

Page 38
Figure 8: From Engineering a Safer World, "Figure 4.4: General Form of a Model of Socio-
Technical Control" (Leveson, 2012)
STPA also considers the entire hierarchy of the system. See Figure 8. The hierarchical
controller for the manufacture of the components of the operating process is the design
process. This meta-structure also includes internal as well as external controls.

Page 39
3 Research Methods
3.1 Adaptation of STPA for Quality Losses
The case studies in this thesis are not being analyzed for safety but rather for quality. The
language of safety appropriately conveys the severity: “safety”, “accident”, “hazard”. In
many industries failure modes identified as contributing to a hazard or accident are treated
with increased attention and level of analysis. To distinguish less severe forms of quality
losses from those that contribute to accidents, it was useful to develop a set of terminology
that conveys a more appropriate level of severity. See Table 2. Any emergent property of
interest, e.g. Durability, Manufacturability, Flexibility, could be substituted for Quality in
this case.
As a result the four-step process was updated with quality-related terminology for use in the
case studies contained in this thesis (Leveson 2012):
Preparatory Step 1: Identify the losses and undesired system states
Preparatory Step 2: Construct the hierarchical control structure
Analysis Step 1: Identify the inadequate control actions
a. An adequate control action is not provided
b. An inadequate control action is provided
c. An adequate control action is provided too early, too late or in the wrong
order
d. An adequate control action is stopped too soon or applied too long
Analysis Step 2: Identify causes of inadequate control actions

Table 2: Adaptation of STPA Safety Terms for use in Quality Analysis
STPA
SAFETY
TERM
DEFINITION PROPOSED QUALITY
LOSS TERM
DEFINITION
Accident “An undesired and unplanned (but not necessarily
unexpected) event that results in (at least) a
specified level of loss (called a loss event)” (De
Weck, Roos et al. 2011)
Loss or Loss Event “Losses can be economic losses,
losses of human lives, losses of
function, losses of time, etc.” (De
Weck, Roos et al. 2011)
Hazard “A state or set of conditions that, together with
worst-case external conditions can lead to an
accident.” (De Weck, Roos et al. 2011)
Undesired system state A state that can lead to a loss of the
system’s ability to deliver
requirements
Safety “The property of being free from accidents or
unacceptable losses.” (De Weck, Roos et al. 2011)
Quality (Any emergent
property of interest, e.g.
Manufacturability, could be
substituted for Quality in this
case.)
“Ability to deliver requirements at
a “high” level, as perceived by
people relative to other alternatives
that deliver the same
requirements.” (De Weck, Roos et
al. 2011)
Unsafe Lacking the property of safety Inadequate Lacking the property of quality
The proposed STPA terms for general quality loss will be used throughout these case studies.
For the more general case of loss of delivery of a “high” level for a given requirement,
instead of “accident” the more general term of “loss” will be used. Instead of “hazard” the
term “undesired system state” will be used for. And instead of “unsafe control actions” the
term “inadequate control actions” will be used. This allowed the case studies to be
conducted without generating undue concern about the safety of the products. However,
these terms are the inventions of the author and have not been approved or accepted by the
community of STAMP and STPA experts.
3.2 Case Study Execution
To execute the STPA analysis for Case 1, a cross-functional team responsible for designing
the system and managing the component suppliers was identified. The team met on a weekly
basis for 1-2 hours at a time. The team performed the preparatory and analysis steps.
Case 2 was a quality improvement project that had previously been closed. The preparatory
and analysis steps of STPA were executed by using information provided in the quality
improvement project documentation and interviews with the improvement team members.

Page 42
THIS PAGE INTENTIONALLY LEFT BLANK

Page 43
4 Case Study 1: Technology Change in New Product Development
This chapter describes the system under consideration for the first case study as well as the
results of the STPA analysis.
4.1 System Overview and Preparatory Steps
Due to the proprietary nature of on-going product development, the details of the system for
the second case study cannot be disclosed. The system involves a technology change to an
existing component. Though the functions of the system are unchanged as a result of this
technology migration, the manufacturing processes and detailed component design, e.g. part
dimensions or material selection, are impacted. In addition to the functions, the number and
type of components in the product system also did not change. Therefore, the impact on the
emergent system property of quality is unknown.
Because the functions and types of components did not change, a functional FMEA or FTA
would not identify any new or different failure modes of the system.
STPA was identified as a method for identifying causal factors leading to quality losses due
to the fact that it considers factors other than component failures and includes design flaws
and undesirable component interactions (Leveson 2012).
4.1.1 System Description and Boundary
The product system is a large, complex, electro-mechanical system. It has been divided into
seven sub-systems to manage the development work and organize the development team.
A DSM was constructed for the product system to identify the interactions between
components, to define sub-systems for the purpose of organizing embedded software
algorithms and the development team, and for use as a tool to assess the level of effort and
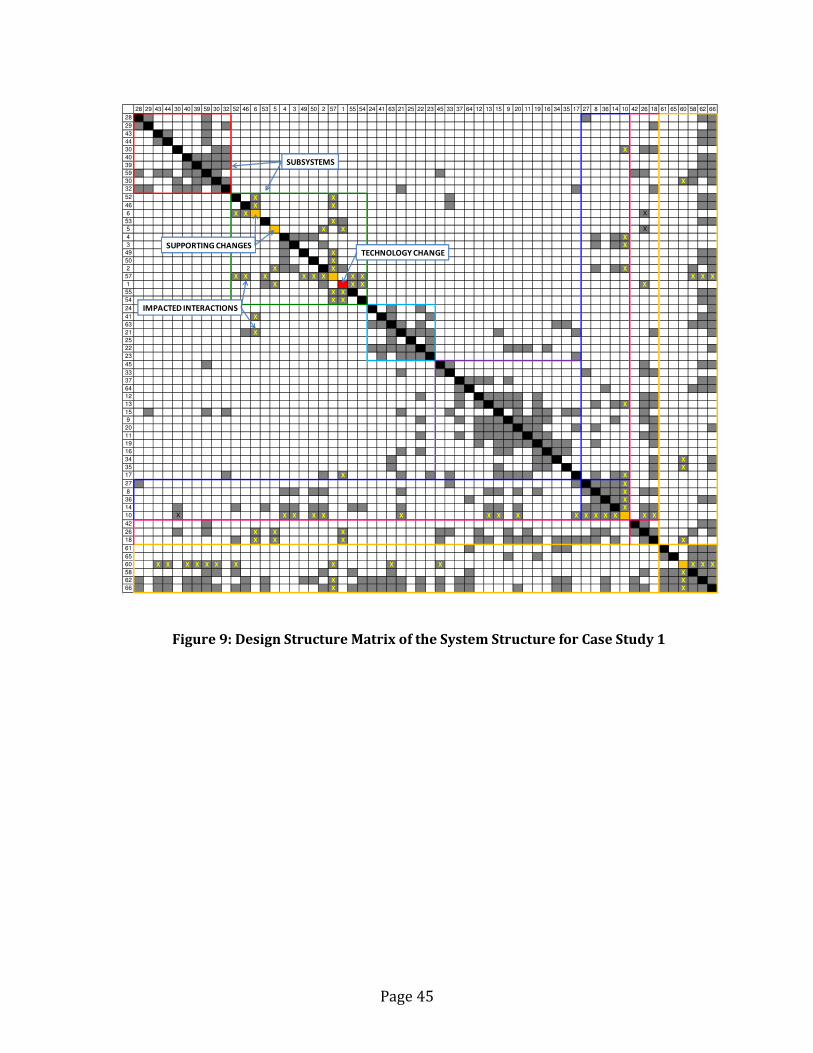
risk associated with proposed design changes. See Figure 9.

Page 44
The DSM includes sixty components, both hardware and software. The component
containing the technology change is indicated in the Design Structure Matrix (DSM) of the
system along the diagonal in red. Changes to other components to support the technology
change are indicated along the diagonal in yellow.
Changing the detailed design of a single component led to design changes in five other
components, including two in different sub-systems. As a result a number of component
interactions were potentially impacted. The potentially impacted interactions are indicated by
‘x’ in the matrix in Figure 9.
The behavior of these interactions is known for the current product system. However, the
concern is that an undesirable interaction may occur as the result of these changes.
Page 45
Figure 9: Design Structure Matrix of the System Structure for Case Study 1
28 29 43 44 30 40 39 59 30 32 52 46 6 53 5 4 3 49 50 2 57 1 55 54 24 41 63 21 25 22 23 45 33 37 64 12 13 15 9 20 11 19 16 34 35 17 27 8 36 14 10 42 26 18 61 65 60 58 62 66
28
29
43
44
30 X
40
39
59
30 X
32
52 X X
46 X X
6 X X X
53 X
5 X X X
4 X
3 X
49 X
50 X
2 X X X
57 X X X X X X X X X X X
1 X X X X
55 X X
54 X X
24
41 X
63
21 X
25
22
23
45
33
37
64
12
13 X
15
9
20
11
19
16
34 X
35 X
17 X X
27 X
8 X
36 X
14 X
10 X X X X X X X X X X X X X X X X
42
26 X X X
18 X X X X
61
65
60 X X X X X X X X X X X X X
58 X
62 X X
66 X X
SUBSYSTEMS
TECHNOLOGY CHANGESUPPORTING CHANGES
IMPACTED INTERACTIONS

Page 46
THIS PAGE INTENTIONALLY LEFT BLANK

Page 47
4.1.2 Preparatory Step 1: Identify System Loss and Undesired System States
The quality losses for this system include (1) the inability to meet tailpipe emissions, (2)
increased warranty claims due to decreased component reliability, and (3) increased system
cost due to overdesign.
Eleven undesirable system states were identified that could lead to the quality losses for the
system. Analysis of the system’s functions identified the USSs.
Due to limited time and resources during product development, the undesired system states
needed to be prioritized to make best use of both. Undesired system states that lead to a loss
of emission control were prioritized above financial losses such as increased warranty
payments due to under design or increased material cost due to overdesign. As a result
undesired system states 2-7 were studied initially. See Table 3 for prioritization results.
Table 3: Undesired System States and Losses for Case Study 1
UNDESIRED
SYSTEM
STATE
LOSS
PROCESS
PRIORITY1
USS1 Cost – System over-designed Design & Manufacturing 3
USS2 Failure to meet emissions Design & Operating 1
USS3 Failure to meet emissions Design & Manufacturing 1
USS4 Failure to meet emissions Design & Operating 1
USS5 Failure to meet emissions Design & Operating 1
USS6 Failure to meet emissions Operating 1
USS7 Failure to meet emissions Operating 1
USS8 Cost – System under-designed Design 2
USS9 Cost – System under-designed Design 2
USS10 Cost – System over-designed Design 3
USS11 Cost – System under-designed Design 2 1 Legend: 1-highest priority, 3-lowest priority

Page 48
THIS PAGE INTENTIONALLY LEFT BLANK

Page 49
4.1.3 Preparatory Step 2: Hierarchical Control Structure
The hierarchical control structure has been divided into 3 distinct sections: the operating
process (outlined in green), the manufacturing process (outlined in blue) and the design
process (outlined in red). See Figure 10 for the system overview. The three sections are
described in detail.
Figure 10: Hierarchical Control Structure and Boundary Diagram for Case Study 1

Page 50
THIS PAGE INTENTIONALLY LEFT BLANK
Page 51
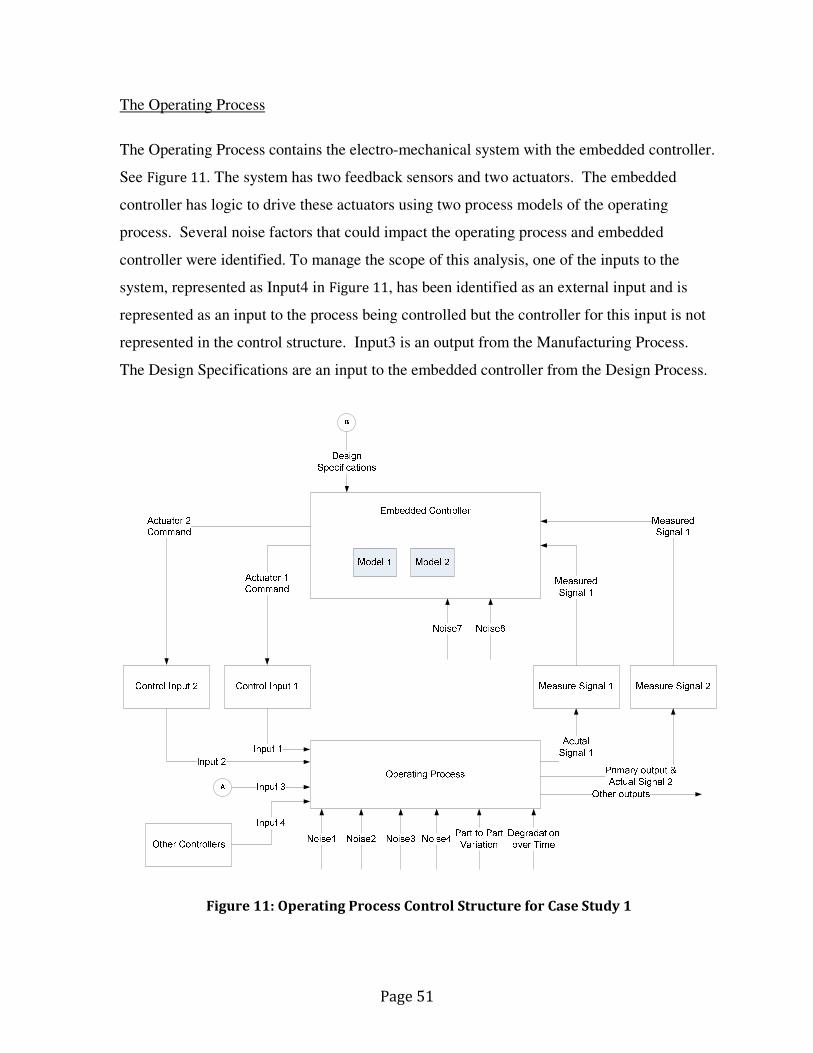
The Operating Process
The Operating Process contains the electro-mechanical system with the embedded controller.
See Figure 11. The system has two feedback sensors and two actuators. The embedded
controller has logic to drive these actuators using two process models of the operating
process. Several noise factors that could impact the operating process and embedded
controller were identified. To manage the scope of this analysis, one of the inputs to the
system, represented as Input4 in Figure 11, has been identified as an external input and is
represented as an input to the process being controlled but the controller for this input is not
represented in the control structure. Input3 is an output from the Manufacturing Process.
The Design Specifications are an input to the embedded controller from the Design Process.
Figure 11: Operating Process Control Structure for Case Study 1

Page 52
THIS PAGE INTENTIONALLY LEFT BLANK

Page 53
The Manufacturing Process
The Manufacturing Process consists of raw materials going into the process and finished
goods and scrap coming out of the process. There are two End-of-Line tests conducted. In
the first test each part is visually inspected for defects and out of spec variation in part
dimension. In the second test, parts are selected at random from a lot of parts and tested for
performance compliance. The outputs of these tests are used to determine whether the parts
are acceptable to be shipped to the customer and if the tooling equipment is out of spec and
should be recalibrated. The Manufacturing Specifications and Drawings are an input from
the Design Process. See Figure 12.
Figure 12: Manufacturing Process Control Structure for Case Study 1
Manufacturing Process
Manufacturing
Specification and
Drawings
EOL Inspection
and Test
Lot Sample
Performance Data
Operator (Ship or
No Ship Decision)
Actual
Performance
Measured
Performance
Manufacturing
Part to Part
Variation
Manufacturing
Drift over TimeContamination
Performance
limits
Parts inspection
data
Measured dimensions
Operator
(Calibrate
Manufacturing
Equipment)
Tolerance
limits
Actual dimensions
Raw Materials Finished Goods
Calibration
Procedures
Measured dimensions
Manufacturing
Standards
Machine
Specifications
Scrap

Page 54
The Design Process
The hierarchical control for the manufacturing and operating process specifications is the
design process. There is a hierarchical control structure for each design decision in the
system. A Design Engineer, using Engineering Standard Work and Design Review
Checklists as process models for guiding design change control actions, controls each design.
Test data and analysis results are the feedbacks from the Design Process to the Design
Engineer. Noise factors affecting the process are changes in configuration management and
design software versions and network speed. Noise factors affecting the Design Engineer
include experience and training, competing priorities, clarity of requirements as well as level
of health, fatigue and motivation.
Each Design Engineer reports to a Design Team Leader who approves or denies change
requests in addition to providing direction regarding requirements, schedule, budget and
work priorities. See Figure 13.

Page 55
Figure 13: Design Process Control Structure for Case Study 1
There are eight control actions to maintain the functionality of the system. The designs of
the eight control actions are linked to one another. See Figure 14. The Design for Control
Action 2 is dependent on the designs for Control Action 1, 3 and 4.

Page 56
Figure 14: Design Structure Matrix of Control Action Interactions
for Case Study 1
The technology change to the system is delivered through a coordinated effort between the
members of 2 business units of the enterprise. The Design Engineers from the organization
represented in yellow are responsible for delivering the primary technology change. The
Design Engineers from the organization represented in blue are responsible for delivering
many of the supporting changes. Each organization is responsible for delivering half of the
control action designs. See Figure 15 for the interactions between the control action designs.

Page 57
Figure 15: Control Action Design Interaction Diagram for Case Study 1
CA1 Design
Process
CA1 Design
Engineer
CA2 Design
Process
CA2 Design
Engineer
CA3 Design
Process
CA3 Design
Engineer
CA4 Design
Process
CA4 Design
Engineer
CA5 Design
Process
CA5 Design
Engineer
CA6 Design
Process
CA6 Design
Engineer
CA7 Design
Process
CA7 Design
Engineer
CA8 Design
Process
CA8 Design
Engineer
CA1 Design
CA5 Design
CA5 Design
CA1 Design
CA4 Design
CA1 Design
CA1 Design
CA3 Design
CA3 Design
CA3 Design

Page 58
THIS PAGE INTENTIONALLY LEFT BLANK

Page 59
4.2 Analysis Steps
The purpose of Case 1 is to answer research question 1: How do design organizations predict
the emergent property of system quality early in the design process using STPA? The
analysis steps of STPA were conducted to identify causal factors for the system described in
section 4.1.
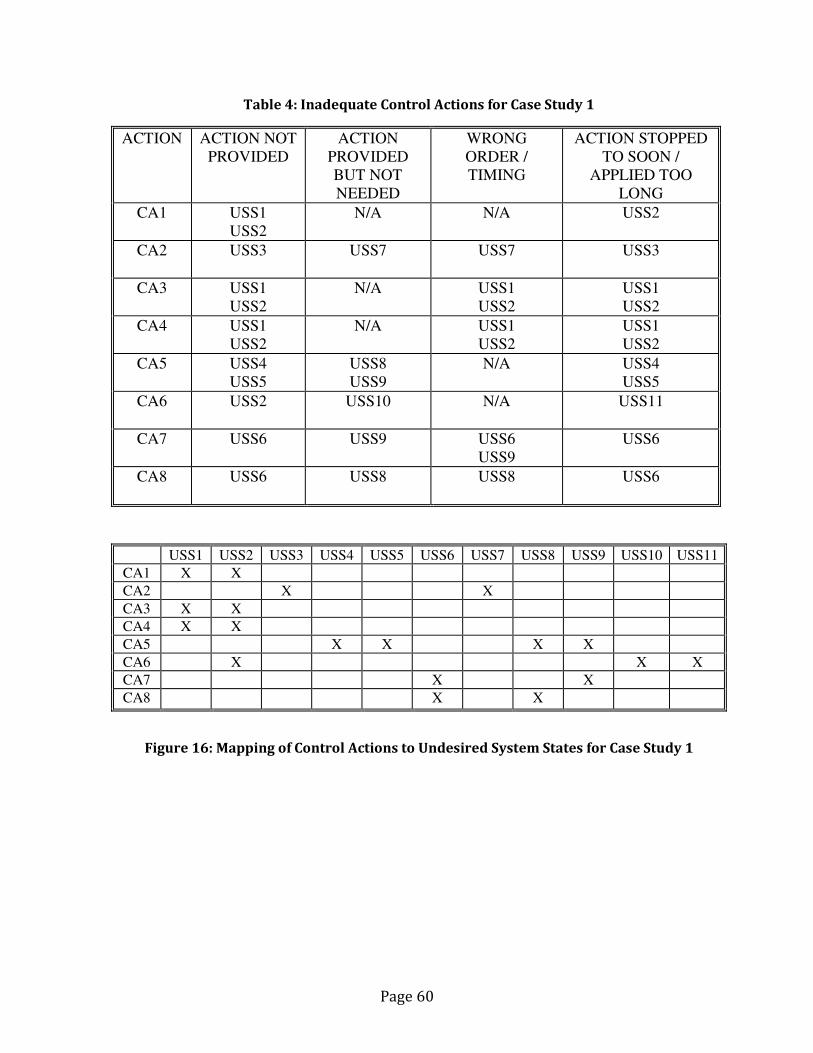
4.2.1 Analysis Step 1: Identify Inadequate Control Actions
The eight control actions were analyzed to determine which inadequate control actions could
lead to the undesired system states. Those are indicated in Table 4. A cross-functional team
analyzed each of the three areas independently. It was useful to understand the mapping
between the undesired system states and the control actions so that step 3 could be prioritized.
See Figure 16. Each of the ‘x’s in the figure represent one or more of the inadequate control
actions identified in Table 4.
Due to limited time and resources during product development, the undesired system states
needed to be prioritized to make best use of both. Undesired system states that lead to a loss
of emission control were prioritized above financial losses such as increased warranty
payments due to under design or increased material cost due to overdesign. As a result
undesired system states 2-7 were studied initially.
Page 60
Table 4: Inadequate Control Actions for Case Study 1
ACTION ACTION NOT
PROVIDED
ACTION
PROVIDED
BUT NOT
NEEDED
WRONG
ORDER /
TIMING
ACTION STOPPED
TO SOON /
APPLIED TOO
LONG
CA1 USS1
USS2
N/A N/A USS2
CA2 USS3
USS7 USS7 USS3
CA3 USS1
USS2
N/A
USS1
USS2
USS1
USS2
CA4 USS1
USS2
N/A USS1
USS2
USS1
USS2
CA5 USS4
USS5
USS8
USS9
N/A USS4
USS5
CA6 USS2
USS10 N/A USS11
CA7 USS6 USS9 USS6
USS9
USS6
CA8 USS6
USS8 USS8 USS6
USS1 USS2 USS3 USS4 USS5 USS6 USS7 USS8 USS9 USS10 USS11
CA1 X X
CA2 X X
CA3 X X
CA4 X X
CA5 X X X X
CA6 X X X
CA7 X X
CA8 X X
Figure 16: Mapping of Control Actions to Undesired System States for Case Study 1

Page 61
4.2.2 Analysis Step 2: Identify Causes of Inadequate Control Actions
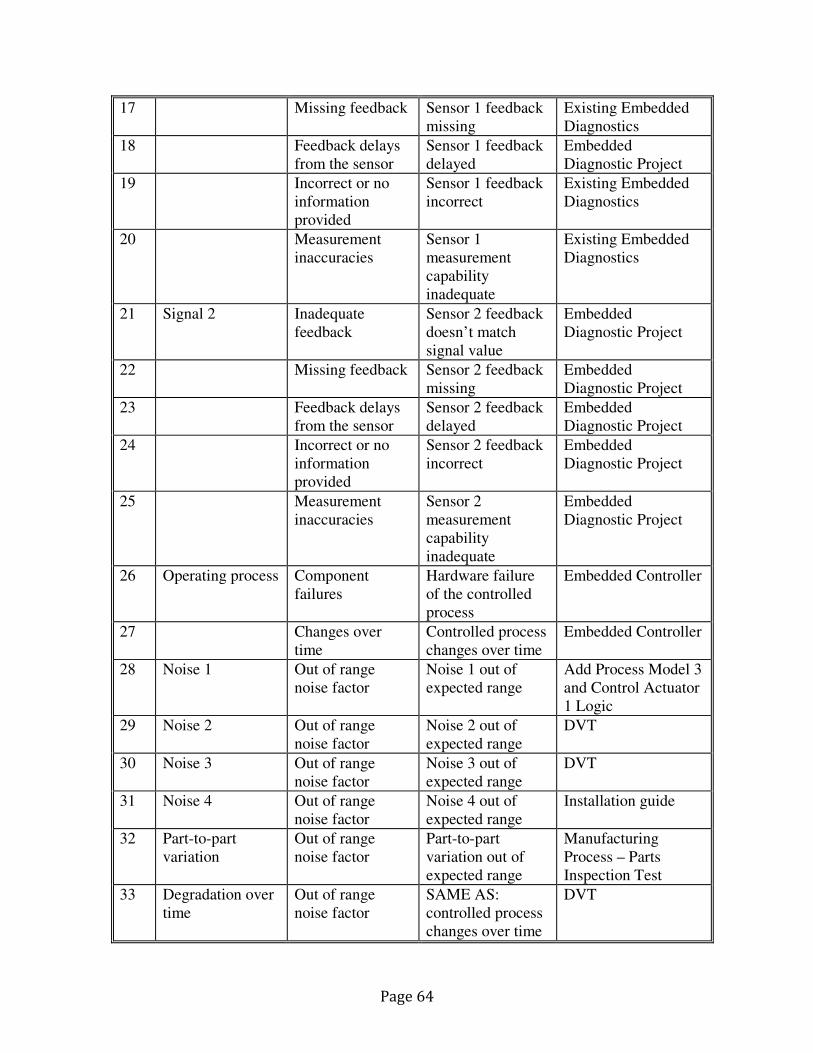
4.2.2.1 Operating Process Causal Factors
For the operating process, Figure 11, the undesired system states of interest are: 2,4,5,6,7. As
a result of the STPA analysis, forty-six causal factors were identified that could lead to the
undesired system states of interest. The details of the causal analysis can be found in Table 5.
Lessons Learned and Recommended Actions
During the execution of the STPA analysis for this process, it was noted that some
guidewords were missing. In addition to those recommended by Dr. Leveson, hardware
failures of the controller, noise factors on the controller and process inputs delayed were
included.
Add Process Model 3: It was determined that the existing control algorithm for actuator 1
was incomplete (causal factor 28). As a result a third process model was identified as well as
changes to the control logic that would prevent the undesired system state 2 from occurring
as a result of inadequate control logic.
Design Process: For some of the causal factors, such as “Requirements Input Wrong” (causal
factor 14), the hierarchical control structure should provide adequate control to ensure the
operating process is correct. In these cases, no changes were recommended to the operating
process but the lessons learned were carried into the analysis of the design process.
DVT: For some of the causal factors, such as “Embedded Controller Algorithm Incorrect”
(causal factor 5), the existing design verification test (DVT) run as part of new product
development would identify design flaws that could lead to causal factors. The
recommendation out of the STPA analysis is to include the list of such causal factors in the
cross-functional review of the DVT.
Embedded Controller: For some of the causal factors, such as “Component Failures of the
Operating Process” (causal factor 26), the embedded controller will prevent the system from

Page 62
entering the undesired system state. The recommendation out of the STPA analysis is to
include the list of such causal factors in the requirements for the embedded control
algorithms.
Embedded Diagnostic Project: For some causal factors, such as “Control Actuator 2 Delayed”
(causal factor 3), it was determined the existing control logic and embedded diagnostics were
inadequate. The recommendation out of the STPA analysis is to include these causal factors
as requirements for new embedded diagnostic algorithms.
Existing Embedded Diagnostics: For some causal factors, such as “Control Actuator 1
Delayed” (causal factor 1), it was determined the existing embedded diagnostics were
sufficient to prevent the system from entering the undesired system state. The
recommendation out of the STPA analysis is to include theses causal factors in the cross-
functional design review of the embedded diagnostic algorithms.
Installation guide: The system of in this case study is installed in another machine or super-
system and performs the functions as one of the super-system’s subsystems. For some of the
causal factors, such as “Noise 4 Out of Expected Range” (causal factor 31), it was
determined that by controlling the installation process the undesired system state could be
avoided. The recommendation of the STPA process is to include this causal factor in the
development of the installation guides.
Manufacturing Process: For some of the causal factors, such as “Part-to-Part Variation Out of
Expected Range” (causal factor 32), he hierarchical control structure should provide adequate
control to ensure the operating process is correct. In these cases, no changes were
recommended to the operating process but the lessons learned were carried into the analysis
of the manufacturing process.
Table 5: Operating Process Causal Factors for Case Study 1
NO CONTROL
ELEMENT
TRADITIONAL
GUIDEWORDS
CAUSAL
FACTORS
RECOMMENDED
ACTION
1 Control actuator 1 Delayed Control action 1 Existing Embedded

Page 63
operation delayed Diagnostics
2 Inadequate
operation
Hardware failure
of control actuator
1
Existing Embedded
Diagnostics
3 Control actuator 2 Delayed
operation
Control action 2
delayed
Embedded
Diagnostic Project
4 Inadequate
actuator operation
Hardware failure
of control actuator
2
Embedded
Diagnostic Project
5 Embedded
controller
Inadequate
control algorithm
– Flaws in
creation, process
changes, incorrect
modification
Control algorithm
incorrect
DVT
6 No guideword Hardware failure
of embedded
controller
Existing Embedded
Diagnostics
7 Process model 1 Inconsistent Process model 1
doesn’t match
controlled process
DVT
8 Incomplete Process model 1
missing
DVT
9 Incorrect Process model 1
calibrated
incorrectly
DVT
10 Process model 2 Inconsistent Process model 2
doesn’t match
controlled process
Embedded
Diagnostic Project
11 Incomplete Process model 2
missing
DVT
12 Incorrect Process model 2
calibrated
incorrectly
DVT
13 Noise factors on
embedded
controller
No guideword Noise factors on
embedded
controller out of
expected range
DVT
14 Requirements Input wrong Requirements
wrong
Design Process
15 Input missing Requirements
missing
Design Process
16 Signal 1 Inadequate
feedback
Sensor 1 feedback
doesn’t match
signal value
Existing Embedded
Diagnostics
Page 64
17 Missing feedback Sensor 1 feedback
missing
Existing Embedded
Diagnostics
18 Feedback delays
from the sensor
Sensor 1 feedback
delayed
Embedded
Diagnostic Project
19 Incorrect or no
information
provided
Sensor 1 feedback
incorrect
Existing Embedded
Diagnostics
20 Measurement
inaccuracies
Sensor 1
measurement
capability
inadequate
Existing Embedded
Diagnostics
21 Signal 2 Inadequate
feedback
Sensor 2 feedback
doesn’t match
signal value
Embedded
Diagnostic Project
22 Missing feedback Sensor 2 feedback
missing
Embedded
Diagnostic Project
23 Feedback delays
from the sensor
Sensor 2 feedback
delayed
Embedded
Diagnostic Project
24 Incorrect or no
information
provided
Sensor 2 feedback
incorrect
Embedded
Diagnostic Project
25 Measurement
inaccuracies
Sensor 2
measurement
capability
inadequate
Embedded
Diagnostic Project
26 Operating process Component
failures
Hardware failure
of the controlled
process
Embedded Controller
27 Changes over
time
Controlled process
changes over time
Embedded Controller
28 Noise 1 Out of range
noise factor
Noise 1 out of
expected range
Add Process Model 3
and Control Actuator
1 Logic
29 Noise 2 Out of range
noise factor
Noise 2 out of
expected range
DVT
30 Noise 3 Out of range
noise factor
Noise 3 out of
expected range
DVT
31 Noise 4 Out of range
noise factor
Noise 4 out of
expected range
Installation guide
32 Part-to-part
variation
Out of range
noise factor
Part-to-part
variation out of
expected range
Manufacturing
Process – Parts
Inspection Test
33 Degradation over
time
Out of range
noise factor
SAME AS:
controlled process
changes over time
DVT

Page 65
34 Input 1 Process input
wrong
Process input 1
wrong
Existing Embedded
Diagnostics
35 Process input
missing
Process input 1
missing
Existing Embedded
Diagnostics
36 No guideword Process input 1
delayed
Existing Embedded
Diagnostics
37 Input 2 Process input
wrong
Process input 2
wrong
Embedded
Diagnostic Project
38 Process input
missing
Process input 2
missing
Embedded
Diagnostic Project
39 No guideword Process input 2
delayed
Embedded
Diagnostic Project
40 Input 3 Process input
wrong
Process input 3
wrong
Manufacturing
Process –
Performance Test and
Parts Inspection
41 Process input
missing
Process input 3
missing
Manufacturing
Process –
Performance Test and
Parts Inspection
42 No guideword Process input 3
delayed
Manufacturing
Process –
Performance Test and
Parts Inspection
43 Input 4 Process input
wrong
Process input 4
wrong
Existing Embedded
Diagnostics
44 Process input
missing
Process input 4
missing
Existing Embedded
Diagnostics
45 No guideword Process input 4
delayed
Embedded
Diagnostic Project
46 Other controllers Conflicting
control action
Conflicting control
action
Embedded
Diagnostic Project

Page 66
4.2.2.2 Manufacturing Process Causal Factors
For the manufacturing process, Figure 12, the undesired system states of interest are: 1,3. As
a result of the STPA analysis, forty-five causal factors were identified that could lead to the
undesired system states of interest. Unlike the operating process, the manufacturing process
also makes use of human controllers. The results of Dr. Stringfellow’s research were used in
addition to the guidewords proposed by Dr. Leveson. The details of the causal analysis can
be found in Table 6.
Lessons Learned and Recommended Actions
During the execution of the STPA analysis for this process, it was noted that some
guidewords were missing. In addition to those recommended by Dr. Leveson, process model
is applied outside of it validated use region was included.
Calibration Process: For some of the causal factors, such as “Component Failures of the
Manufacturing Process” (causal factor 37), the hierarchical control structure should provide
adequate control to ensure the manufacturing process is correct. In these cases, no changes
were recommended to the manufacturing process but the lessons learned were carried into
the cross-functional review of the calibration process controller.
Design Process: For some of the causal factors, such as “Machine Specifications Input
Wrong” (causal factor 17), the hierarchical control structure should provide adequate control
to ensure the operating process is correct. In these cases, no changes were recommended to
the operating process but the lessons learned were carried into the analysis of the design
process.
MSA: The undesired system states for this process involve shipping bad or out of
specification parts to the customer. Some of the causal factors in this analysis were the result
of the supplier’s measurement system analysis (MSA) indicating one state, e.g. the part is
“good”, and the customer’s MSA indicating a different state, e.g. the part is “bad”. See “Lot
Sample Performance Data Inadequate” (causal factor 33) for example. The recommendation

Page 67
of the STPA analysis is to launch a project to determine the degree of correlation between the
customer and supplier’s measurement systems.
Quality Project: For some causal factors, such as “Control Action- Ship or No Ship Decision
Delayed” (causal factor 3), it was determined the existing controls and embedded diagnostics
were inadequate. The recommendation out of the STPA analysis is to include these causal
factors as requirements for a quality improvement project.
Ship / No Ship: For some of the causal factors, such as “Control Action Calibrate
Manufacturing Equipment Delayed” (causal factor 1), the hierarchical control structure
should provide adequate control to ensure the manufacturing process is correct. In these
cases, no changes were recommended to the manufacturing process but the lessons learned
were carried into the cross-functional review of the ship / no ship process controller.
Table 6: Manufacturing Process Causal Factors for Case Study 1
NO CONTROL
ELEMENT
TRADITIONAL
GUIDEWORDS
CAUSAL
FACTORS
RECOMMENDED
ACTION
1 Control action –
calibrate
manufacturing
equipment
Delayed operation Calibration
delayed
Ship/No Ship
2 Inadequate
operation
Calibration
procedure executed
incorrectly –
Resources
inadequate or
pressures too high,
Person-Task
Compatibility
Ship/No Ship
3 Control action –
ship or no ship
decision
Delayed operation Decision delayed Quality Project
4 Inadequate
operation
Decision executed
incorrectly –
Resources
inadequate or
pressures too high,
Person-Task
Quality Project

Page 68
Compatibility
5 Operator –
calibration
procedures
Inadequate
control algorithm
– Flaws in
creation, process
changes, incorrect
modification
Education or
experience
inadequate
Ship/No Ship
6 No guideword Fatigue, illness,
sleep deprivation,
low motivation
Ship/No Ship
7 Operator – end of
line inspection
and test
Inadequate
control algorithm
– Flaws in
creation, process
changes, incorrect
modification
Education or
experience
inadequate
Quality Project
8 No guideword Fatigue, illness,
sleep deprivation,
low motivation
Quality Project
9 Process model –
manufacturing
standards
Inconsistent Procedures not
communicated
effectively
Quality Project
10 Incomplete Procedures not
communicated
effectively
Quality Project
11 Incorrect Education or
experience
inadequate
Quality Project
12 No guideword Process model is
applied outside of
its validated use
region
Quality Project
13 Process model –
machine
specifications and
behavior
Inconsistent Procedures not
communicated
effectively
Quality Project
14 Incomplete Procedures not
communicated
effectively
Quality Project
15 Incorrect Education or
experience
inadequate
Quality Project
16 No guideword Process model is
applied outside of
its validated use
Quality Project

Page 69
region
17 Machine
specifications
Input wrong Machine
specifications
wrong
Design Process
18 Input missing Machine
specifications
missing
Design Process
19 Tolerance limits Input wrong Tolerance limits
wrong
Design Process
20 Input missing Tolerance limits
missing
Design Process
21 Performance
limits
Input wrong Performance limits
wrong
Design Process
22 Input missing Performance limits
missing
Design Process
23 Parts inspection
data
Inadequate
feedback
Parts inspected
incorrectly –
Resources
inadequate or
pressures too high,
Person-Task
Compatibility
Ship/No Ship
24 Missing feedback Parts inspection
not completed or
data missing
Ship/No Ship
25 Feedback delays
from sensor
Parts inspection
delayed –
Resources
inadequate or
pressures too high,
Person-Task
Compatibility
Ship/No Ship
26 Inadequate sensor
operation
Parts inspected
incorrectly –
Resources
inadequate or
pressures too high,
Person-Task
Compatibility
Ship/No Ship
27 Incorrect or no
information
provided
Parts inspection
not completed or
data missing
Ship/No Ship
28 Measurement
inaccuracies
Parts inspected
incorrectly –
Resources
Ship/No Ship

Page 70
inadequate or
pressures too high,
Person-Task
Compatibility
29 Feedback delays
from process
Feedback delays
from process
Ship/No Ship
30 Lot sample
performance data
Inadequate
feedback
Performance
testing performed
incorrectly –
Resources
inadequate or
pressures too high,
Person-Task
Compatibility
Ship/No Ship
31 Missing feedback Performance
testing not
completed or data
missing
Ship/No Ship
32 Feedback delays
from sensor
Performance
testing delayed –
Resources
inadequate or
pressures too high,
Person-Task
Compatibility
Ship/No Ship
33 Inadequate sensor
operation
Performance
testing performed
incorrectly –
Resources
inadequate or
pressures too high,
Person-Task
Compatibility
MSA
34 Incorrect or no
information
provided
Performance
testing not
completed or data
missing
MSA
35 Measurement
inaccuracies
Performance
testing performed
incorrectly –
Resources
inadequate or
pressures too high,
Person-Task
Compatibility
MSA
36 Feedback delays Feedback delays Ship/No Ship

Page 71
from process from process
37 Manufacturing
process
Component
failures
Manufacturing
component failures
Calibration Process
38 Changes over
time
Manufacturing
process changes
over time
Calibration Process
39 Part-to-part
variation
Out of range noise
factor
Part-to-part
variation higher
than expected
range
Calibration Process
40 Drift over time Out of range noise
factor
Drift over time
higher than
expected range
Calibration Process
41 Contamination Out of range noise
factor
Contamination
higher than
expected range
Calibration Process
42 - Unidentified noise
factor
Unidentified noise
factor
Unknown
43 Raw materials Process input
wrong
Raw materials
wrong
Quality Project
44 Process input
missing
Raw materials
missing
Quality Project
45 Process input
delayed
Raw materials
delayed
Quality Project

Page 72
4.2.2.3 Design Process Causal Factors
For the design process, Figure 13, the undesired system states of interest are: 1-5, 8-11. As a
result of the STPA analysis, thirty-four causal factors were identified that could lead to the
undesired system states of interest. The details of the causal analysis can be found in Table 7.
Lessons Learned and Recommended Actions
Change Control Project: For some of the causal factors, such as “Change Actions Delayed”
(causal factor 1), it was determined that the existing change control process within new
product development was inadequate to prevent the undesired system states. The
recommendation of the STPA analysis is to initiate an improvement project for the new
product change control process.
Design Engineer: For some of the causal factors, such as “Component Failures of the Part
Design Process” (causal factor 30), the design engineer will prevent the system from entering
the undesired system state. The recommendation out of the STPA analysis is to include the
list of such causal factors in the requirements for design engineering training.
Existing ESW Assessment Process: For some causal factors, such as “Process Model –
Engineering Standard Work Inconsistent” (causal factor 8), it was determined the existing
ESW assessment process is sufficient to prevent the system from entering the undesired
system state. The recommendation out of the STPA analysis is to include theses causal
factors in the cross-functional design review of the assessment process.
OBT Project: For some of the causal factors, such as “Process Model – Engineering Standard
Work Incomplete” (causal factor 9), it was determined that the existing design engineer
training was inadequate to prevent the undesired system states. The recommendation of the
STPA analysis is to include theses causal factors as requirements for an improvement project
for the new design engineer training process.
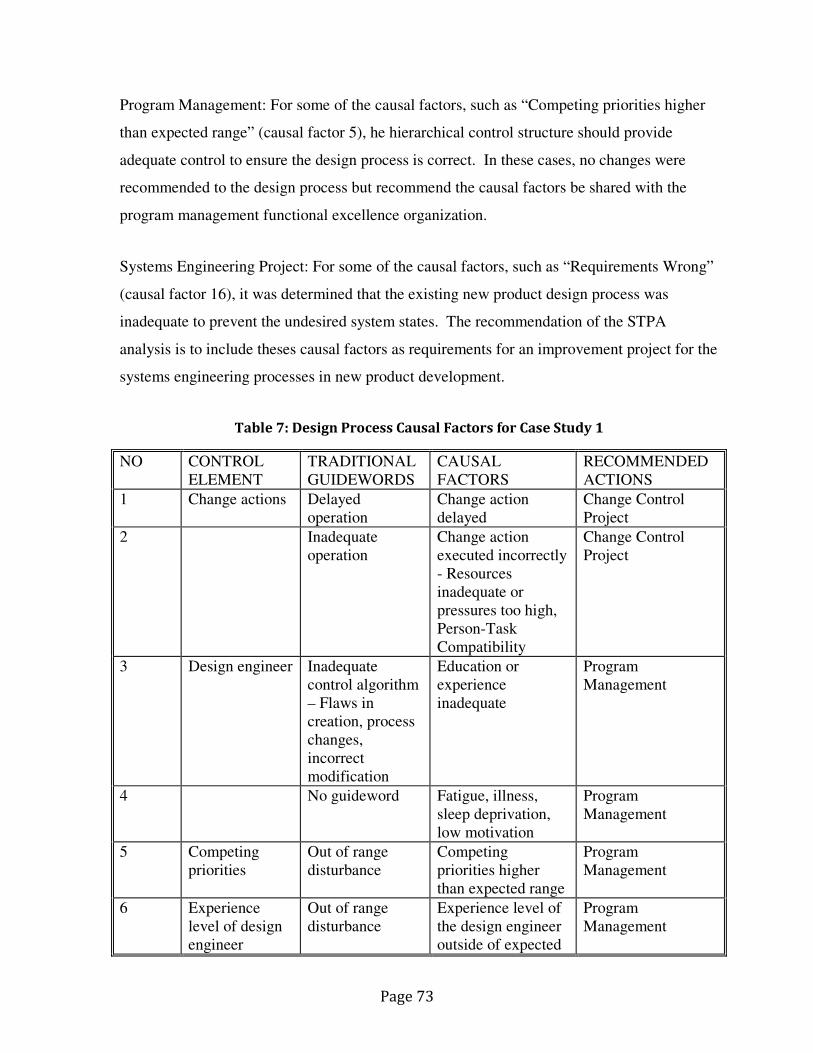
Page 73
Program Management: For some of the causal factors, such as “Competing priorities higher
than expected range” (causal factor 5), he hierarchical control structure should provide
adequate control to ensure the design process is correct. In these cases, no changes were
recommended to the design process but recommend the causal factors be shared with the
program management functional excellence organization.
Systems Engineering Project: For some of the causal factors, such as “Requirements Wrong”
(causal factor 16), it was determined that the existing new product design process was
inadequate to prevent the undesired system states. The recommendation of the STPA
analysis is to include theses causal factors as requirements for an improvement project for the
systems engineering processes in new product development.
Table 7: Design Process Causal Factors for Case Study 1
NO CONTROL
ELEMENT
TRADITIONAL
GUIDEWORDS
CAUSAL
FACTORS
RECOMMENDED
ACTIONS
1 Change actions Delayed
operation
Change action
delayed
Change Control
Project
2 Inadequate
operation
Change action
executed incorrectly
- Resources
inadequate or
pressures too high,
Person-Task
Compatibility
Change Control
Project
3 Design engineer Inadequate
control algorithm
– Flaws in
creation, process
changes,
incorrect
modification
Education or
experience
inadequate
Program
Management
4 No guideword Fatigue, illness,
sleep deprivation,
low motivation
Program
Management
5 Competing
priorities
Out of range
disturbance
Competing
priorities higher
than expected range
Program
Management
6 Experience
level of design
engineer
Out of range
disturbance
Experience level of
the design engineer
outside of expected
Program
Management

Page 74
range
7 Clarity and
completeness of
system
requirements
Out of range
disturbance
Clarity and
completeness of
requirements
outside of expected
range
Program
Management
8 Process model –
Engineering
Standard Work
Inconsistent Engineering
Standard Work not
communicated
effectively
Existing ESW
Assessment Process
9 Incomplete Engineering
Standard Work not
communicated
effectively
OBT Project
10 Incorrect Education or
experience
inadequate
OBT Project
11 No guideword Engineering
Standard Work
Process model is
applied outside of
its validated use
region
Existing ESW
Assessment Process
12 Process model –
Design Review
Checklist
Inconsistent Design Review
Checklist not
communicated
effectively
13 Incomplete Design Review
Checklist not
communicated
effectively
14 Incorrect Education or
experience
inadequate
15 No guideword Design Review
Checklist Process
model is applied
outside of its
validated use region
16 Requirements Input wrong Requirements
wrong
Systems
Engineering Project
17 Input missing Requirements
missing
Systems
Engineering Project
18 Other system
design
Input wrong Other system design
parameters and
Systems
Engineering Project

Page 75
parameters &
constraints
constraints wrong
19 Input missing Other system design
parameters and
constraints missing
Systems
Engineering Project
20 Change request Input wrong Change request
wrong
Change Control
Project
21 Input missing Change request
missing
Change Control
Project
22 Other design
engineers
Conflicting
control actions
Conflicting control
actions
Program
Management
23 Test and
analysis
Inadequate
feedback
Test and analysis
performed
incorrectly –
Resources
inadequate or
pressures too high,
Person-Task
Compatibility
OBT Project
24 Missing feedback Test and analysis
not completed or
data missing
Program
Management
25 Feedback delays
from sensor
Test and analysis
delayed – Resources
inadequate or
pressures too high,
Person-Task
Compatibility
Program
Management
26 Inadequate sensor
operation
Test and analysis
inadequate
Systems
Engineering Project
27 Incorrect or no
information
provided
Test and analysis
not completed or
data missing
OBT Project
28 Measurement
inaccuracies
Test and analysis
inaccurate
Systems
Engineering Project
29 Feedback delays
from process
Feedback delays
from process
Design Engineer
30 Part design
process
Component
failures
Design Engineer
31 Changes over
time
Design Engineer
32 Configuration
Management
(CM) System
Process input
wrong
- N/A
33 Process input CM system Design Engineer

Page 76
missing unavailable
34 Process input
delayed
CM system delayed
performance
Design Engineer

Page 77
5 Case Study 2: Historical Warranty Design Issue
This chapter describes the system under consideration for the second case study as well as
the results of the STPA analysis.
5.1 System Description and Preparatory Steps
The quality loss for Case 2 was structural failure of Diesel Particulate Filter (DPF) due to
excessive particulate loading. The failure of the filter was not the result of a component
failure or manufacturing defect, but rather an inconsistency between a part dimension and the
embedded software process model variable setting.
The root cause of the operating process failure was initially identified using FTA. The
solution to the technical system was created and implemented by a cross-functional design
team. However, improvements to the design process were not considered as part of the
improvement project.
STPA was identified as a method for identifying solutions to causal factors in the design
process leading to quality losses due to the fact that it considers multiple levels of the
hierarchical control system (Leveson 2012) See Figure 8.
5.1.1 System Description and Boundary
A DPF, a device with a core consisting of metallic or ceramic porous material, is installed in
the exhaust stream of a diesel engine to collect particulate matter generated by the
combustion process. The soot filter is periodically regenerated; soot is removed from the
catalyst, via oxidation. Oxidation occurs at high exhaust temperatures in the presence of a
catalyst material. There are many methods for increasing exhaust temperature and initiating
regeneration. Incomplete regeneration can lead to reduced DPF effectiveness and premature
component aging.(Clerc 1996; Konstandopoulos, Kostoglou et al. 2000; Van Setten, Makkee
et al. 2001)

Page 78
5.1.2 Preparatory Step 1: Identify System Loss and Undesired System States
The quality losses for this system include (1) the inability to meet tailpipe emissions, (2)
increased warranty claims due to decreased component reliability, and (3) increased system
cost due to overdesign.
To determine the undesired system states, the functional requirements of the system were
gathered. Functional requirements for the system:
Decrease the soot content of the DPF when either soot load estimate exceeds threshold by:
•Determining length and timing of regeneration event
•Increasing exhaust temperature
•Dosing reactant
•Monitoring for faults
The undesired system states that could lead to loss of ability to meet the system requirements
are (USS1) insufficient soot capacity and (USS2) insufficient exhaust flow rate.
5.1.3 Preparatory Step 2: Hierarchical Control Structure
The hierarchical control structure includes an operating process and a design process. The
design process yields the specifications for the embedded controller and operating process.
See Figure 17 for the overall control structure.
An embedded controller that monitors the pressure drop across the filter and increases both
exhaust temperature and flow of a reactant into the engine exhaust to clean the filter when the
particulate load exceeds a threshold controls the system. See Figure 18.
The design process for this case includes two design teams, one responsible for developing
the physical catalyst and the other responsible for developing the embedded controls. There
is information passed from the catalyst team to the controls team. See Figure 19.
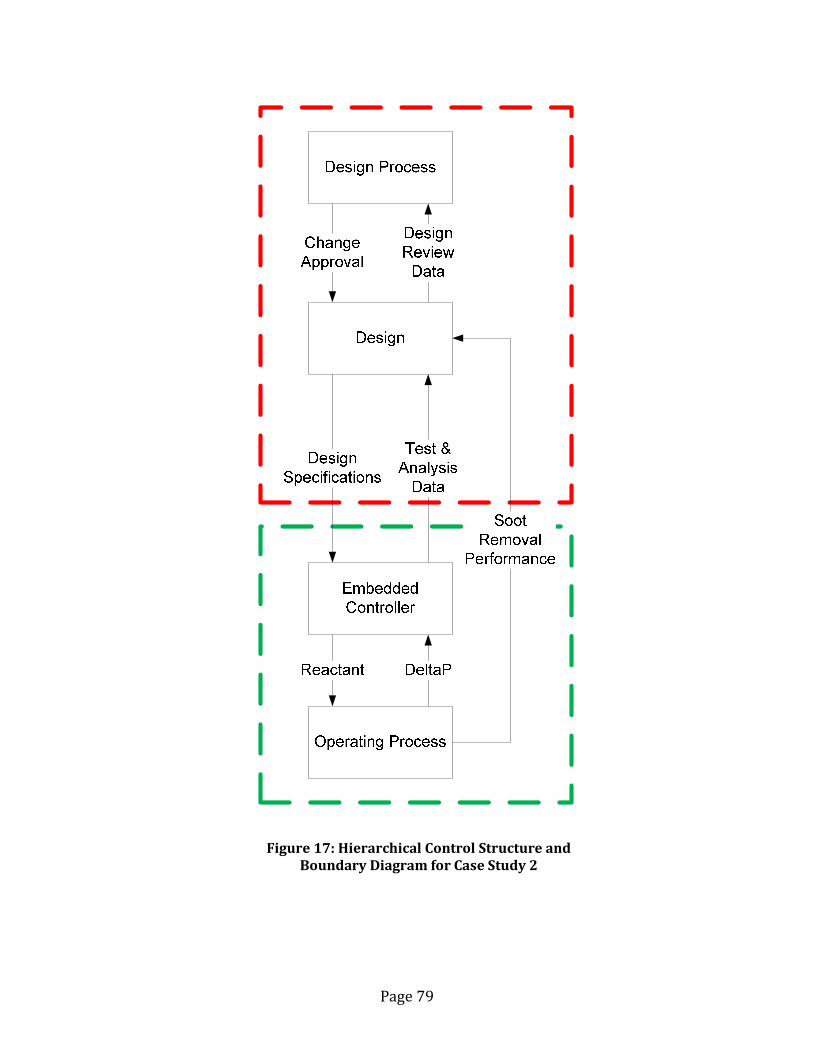
Page 79
Figure 17: Hierarchical Control Structure and
Boundary Diagram for Case Study 2

Page 80
THIS PAGE INTENTIONALLY LEFT BLANK

Page 81
Figure 18: Operating Process Control Structure for Case Study 2
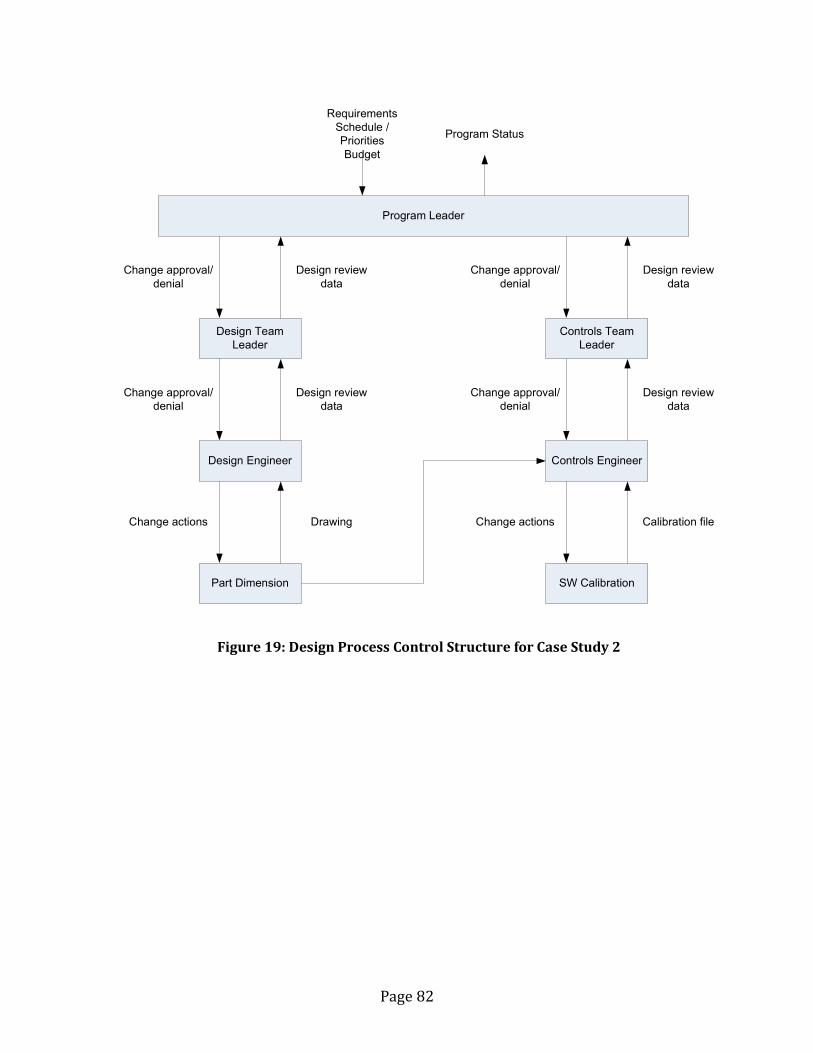
Page 82
Figure 19: Design Process Control Structure for Case Study 2
Part Dimension
Design Engineer
Design Team
Leader
SW Calibration
Controls Engineer
Controls Team
Leader
Program Leader
Requirements
Schedule /
Priorities
Budget
Change actions
Program Status
Change actions Calibration fileDrawing
Change approval/
denial
Design review
data
Change approval/
denial
Design review
data
Change approval/
denial
Change approval/
denial
Design review
data
Design review
data

Page 83
5.2 Analysis Steps
The purpose of Case 2 is to answer research question: how can STPA be used to identify
solutions for quality problems in a complex system? A solution for the operating process had
been previously determined and implemented. The analysis steps of STPA were executed to
determine if the process could identify the same causal factor and solution to the operating
process and if the process could also identify causal factors and solutions to the design
process as well.
5.2.1 Analysis Step 1: Identify Inadequate Control Actions
Focusing on the control action to dose reactant, both undesired system states may occur as a
result of an improperly controlled dosing rate, see Table 8.
Table 8: Inadequate Control Actions for Case Study 2
From the quality improvement project investigation, the undesired system state of interest in
this case is USS1: insufficient soot capacity.
5.2.2 Analysis Step 2: Identify Causes of Inadequate Control Actions
5.2.2.1 Operating Process Causal Factors
For the operating process, Figure 18, sixteen possible causal factors for the undesired system
state of insufficient soot capacity were identified. See Table 9 for details.

Page 84
Lessons Learned and Recommended Actions
For the operating process, a mismatch between the process model 1 and the controlled
process physical dimensions will lead to dosing occurring too infrequently. This failure
actually occurred during the design process, and led to increased warranty coverage for the
product due to higher than expected failure rate. See causal factor 4 in Table 9.
Table 9: Operating Process Causal Factors for Case Study 2
NO CONTROL
ELEMENT
TRADITIONAL
GUIDEWORDS
CAUSAL
FACTORS
RECOMMENDED
ACTIONS
1 Control Input Input wrong Requirements wrong Design process
2 Input missing Regeneration switch
not activated
Operating process
3 Embedded
Controller
No guideword Hardware failure of
controller
Operating process
4 Process Model 1 Inconsistent Process model 1
doesn’t match
controlled process
specifications
Design process
5 Incorrect Process model 1
calibrated
incorrectly
Design process
6 Incomplete Process model 1
missing
Design process
7 Process Model 2 Inconsistent Process model 2
doesn’t match
controlled process
specifications
Design process
8 Incorrect Process model 2
calibrated
incorrectly
Design process
9 Incomplete Process model 2
missing
Design process
10 DeltaP Sensor Incorrect or no
information
provided
Hardware failure of
the sensor
Operating process
11 Measurement
inaccuracies
Measured sensor
value doesn’t match
actual feedback
signal
Operating process
or design process
12 Reactant Doser Inadequate
operation
Hardware failure of
the actuator
Operating process

Page 85
13 Delayed operation Actuation delayed
due to contamination
Operating process
14 Delayed operation Actuation delayed
due to blockage
Operating process
15 Noise Factor Out of range
disturbance
Duty cycle of the
controlled process
outside of expected
limits
Operating process
16 Input to
Controlled
Process
Process input
wrong
Input to controlled
process outside of
design range
Operating process
The recommended actions for the causal factors fell into two areas of the hierarchical control
structure, the Operating System and the Design System. Causal factor 4 was responsible for
the failures observed in the field. A change was made to the embedded controls to prevent
further field failures. However, the recommended improvement from the analysis of the
hierarchical control structure was to improve the design process. The following section
discusses the results of the STPA analysis of the design process.
5.2.2.2 Design Process Causal Factors
For the design process, Figure 19, thirteen possible causal factors were identified. Several of
these were common with the causal factors identified in Case Study 1.
Developing the hierarchical control structure for the part dimension and process model
parameter design processes identified an inadequate control action: change actions are made
as a result of a change request that has been submitted to and approved by the team
management. Change requests would be modeled in the hierarchical control structure as
inputs to the process. However, change requests enter the design process at multiple levels.
The current hierarchical structure is inadequate to control all forms of change requests due to
the limitations of the project management structure to communicate the implications of
proposed changes and results of the change request assessment to all affected members of the
development organization.

Page 86
As a result of the STPA analysis, thirteen causal factors were identified that could lead to the
undesired system states of interest. The details of the causal analysis can be found in Table
10.
Lessons Learned and Recommended Actions
Change Control Project: In addition to the recommendations from Case Study 1, it is the
recommendation from the STPA analysis is to provide a requirement to the improvement
project for the new product change control process that change requests enter the new
product development process through one channel.
Design Engineer: See Section 5.1.2.3
OBT Project: See Section 5.1.2.3
Program Management: See Section 5.1.2.3
Systems Engineering Project: In addition to the recommendation from Case Study 1, it is the
recommendation from the STPA analysis is to include theses causal factors as requirements
for an improvement project for the systems engineering processes in new product
development.
Table 10: Design Process Causal Factors for Case Study 2
NO CONTROL
ELEMENT
TRADITIONAL
GUIDEWORDS
CAUSAL
FACTORS
RECOMMENDED
ACTIONS
1 Change actions Delayed
operation
Change action
delayed
Change Control
Project
2 Inadequate
operation
Change action
executed incorrectly
- Resources
inadequate or
pressures too high,
Person-Task
Compatibility
Change Control
Project
3 Controls
engineer
Inadequate
control algorithm
Education or
experience
Program
Management

Page 87
– Flaws in
creation, process
changes,
incorrect
modification
inadequate
4 Fatigue, illness,
sleep deprivation,
low motivation
Program
Management
5 Other system
design
parameters &
constraints
Input wrong Other system design
parameters and
constraints wrong
Systems
Engineering Project
6 Input missing Other system design
parameters and
constraints missing
Systems
Engineering Project
7 Change request Input wrong Change request
wrong
Change Control
Project
8 Input missing Change request
missing
Change Control
Project
9 Other design
engineers
Conflicting
control actions
Conflicting control
actions
Program
Management
10 Calibration File Inadequate
feedback
Test and analysis
performed
incorrectly –
Resources
inadequate or
pressures too high,
Person-Task
Compatibility
OBT Project
11 Measurement
inaccuracies
Test and analysis
inaccurate
Systems
Engineering Project
12 SW Calibration
process
Component
failures
Design Engineer
13 Changes over
time
Design Engineer

Page 88
THIS PAGE INTENTIONALLY LEFT BLANK

Page 89
6 Results
6.1 Recommendations
6.1.1 Sponsoring Company Improvement Recommendations
The STPA analysis of the two case studies yielded a number of recommendations for the
sponsoring company. Some of these recommendations were to include specific factors in the
STPA analysis of the hierarchical controller. The findings are summarized as follows:
Case Study 1:
� Eight recommendations from the operating process STPA analysis
� Five recommendations from the manufacturing process STPA analysis
� Six recommendations from the design process STPA analysis
Case Study 2:
� Two recommendations from the design process STPA analysis
See Table 11 for a summary of recommended changes and improvement projects.
Table 11: Summary of Recommendations from STPA Analysis
CASE
STUDY
RECOMMENDATION
1O Add Process Model 3 Add third process model to prevent USS due to
noise factor 1
1O DVT Include the list of identified causal factors in the
cross-functional review of the DVT
1O Embedded Controller Include the list of identified causal factors in the
requirements for the embedded controller
1O Embedded Diagnostic
Project
Include identified causal factors as requirements for
new embedded diagnostic algorithms
1O Existing Embedded
Diagnostics
Include identified causal factors in the cross-
functional design review of the embedded
diagnostics

Page 90
1O Installation guide Include identified causal factor in the development
of the installation guides
1M MSA Launch a project to determine the degree of
correlation between the customer and supplier’s
measurement systems
1M Quality Project Include identified causal factors as requirements for
a quality improvement project
1D Change Control Project Initiate an improvement project for the new product
change control process
1D Design Engineer Include the list of such causal factors in the
requirements for design engineering training
1D OBT Project Include theses causal factors as requirements for an
improvement project for the new design engineer
training process
1D Systems Engineering
Project
Include theses causal factors as requirements for an
improvement project for the systems engineering
processes in new product development
2D Change Control Project Provide a requirement to the improvement project
for the new product change control process that
change requests enter the new product development
process through one channel
2D Systems Engineering
Project
Include theses causal factors as requirements for an
improvement project for the systems engineering
processes in new product development

Page 91
6.1.2 STPA Improvement Recommendations
During the course of executing these case studies adaptations to the STPA process were
made.
6.1.2.1 Guidewords
Causal factors identified in this case study not included in the existing literature:
• Process input delayed – identified in the analysis of the design and
manufacturing hierarchical control structures
• Component failures and changes over time of the controller
• Unidentified or out-of-range disturbance to the controller (but not the
controlled process)
• Process model applied outside of its validated use range – design heuristics,
Engineering Standard Work or requirements and specifications from a
previous generation of products is applied to the current generation.
See Figure 20 for inclusion of these guidewords in the control loop.
6.1.2.2 Human Controllers
In Stringfellow’s work guidewords were developed for humans and organizations in the
system (Stringfellow 2011). However, these guidewords were presented generally. Applying
the guidewords to the manufacturing and design processes, it was evident that some
guidewords were more appropriate given the more specific role of the human. Humans can
be controllers, as in the example of the design team leader controlling the design engineer.
But humans can also take on roles of actuator, sensor, and controlled process. Table 12 shows
an attempt to map the human specific guidewords to the various elements of the control
system.

Page 92
THIS PAGE INTENTIONALLY LEFT BLANK

Figure 20: Additional Guidewords used in the Case Studies

Page 94
Table 12: Human-Centered Guidewords Mapped to Control Structure Elements
94
Centered Guidewords Mapped to Control Structure ElementsCentered Guidewords Mapped to Control Structure Elements

6.2 Comparisons with Traditional Methods
During the course of the first case study, an independent FMEA was conducted for the
second control loop as part of the normal development process. During early development
testing there was a prototype failure that involved reduced performance of the primary
function. As a result a fault tree was constructed to determine the cause of the failure. The
scopes of these analyses were remarkably similar to that of the second STPA case study. The
comparison of the results of these methods is discussed in this section.
6.2.1 FMEA
A Functional FMEA was performed for Control Action 2, the outer loop of the Operating
Process. The STPA identified 36 potential causal factors that could contribute to inadequate
control actions of Control Action 2. The functional FMEA identified 16 potential causal
factors. There were no factors identified by the functional FMEA that were not identified by
STPA.
The factors identified by the functional FMEA are primarily inputs to the controlled process
and failures of the controlled process itself. Very few causal factors related to the
measurement components, feedbacks and controller were identified. See Figure 21 for details.
Causal factors identified by both the STPA and FMEA are marked on the control loop
diagram by a yellow hexagon.
6.2.2 FTA
During the development of this product a failure was observed during test. To determine the
root cause of the failure a Fault Tree Analysis was constructed. The scope of the FTA was to
determine why the system performance was lower than expected. The boundary and scope
were equivalent to that of the STPA for Case 2.
The STPA identified 51 potential causal factors. The FTA identified 13 potential root causes.
There were no causal factors identified by the FTA that were not identified by STPA.

Page 96
Relating the causal factors between the STPA and the FTA analyses shows that the FTA
results were less focused than the FMEA results. The factors related to the feedbacks and
process models were not identified in the FTA. However, the possibility that the design
specifications were incorrect was identified. See Figure 21. Causal factors identified by both
the STPA and FTA are marked on the control loop diagram by a blue triangle.

Figure 21: Comparison of Failure Modes and Effects Analysis and Fault Tree Analysis Causal
Factor Results to STPA Causal Factor Results

THIS PAGE INTENTIONALLY LEFT BLANK

6.2.3 Robust Design
STPA can be complementary to the Robust Design process. One of the first steps in Robust
Design is to determine the factors that are significant to the response variable. All
parameters are initially identified using a P-diagram. Traditionally methods like FMEA and
FTA are used to identify significance of parameters. STPA can be used instead of an FMEA
or FTA to identify factors that might contribute to quality loss. One drawback of the P-
diagram is the lack of information regarding the relationships between the parameters and
lack of structure in identifying the various control elements. Constructing the control loop
diagram provided additional insight into the structure and behavior of the system.
The P-diagram can be a useful tool in creating the control loop diagram for the causal factor
analysis. This is particularly useful for teams with weak controls expertise where developing
the hierarchical control structures and control loops is difficult.
The control factors section of the P-diagram can be sub-divided into five components of the
control loop:
• Actuators and control commands
• Controller and control algorithm or logic
• Process models
• Controller inputs
• Sensors and feedbacks
This allows the teams performing the STPA analysis to list the elements of the control loop
prior to establishing the relationships between the elements. See Figure 22 for Case Study 1
example of the transformation of the P-diagram to the STPA control structure.

Page 100
THIS PAGE INTENTIONALLY LEFT BLANK

Page 101
Figure 22: Comparison Between a Parameter Diagram and a Control Structure Diagram

Page 102
THIS PAGE INTENTIONALLY LEFT BLANK

7 Conclusions
The level of effort required to conduct STPA was equivalent to that for an FMEA. In both
cases a team of 4-7 individuals was assembled based on the degree of knowledge about the
new system. One hour weekly meetings were held over a period of approximately two
months.
However, the STPA identified 225% more causal factors than the FMEA. The FMEA did
have a finer level of detail regarding the specific failure modes. STPA identified causal
factors related to interactions between elements of the system, incorrect feedbacks into the
controller, incorrect timing and external disturbances. The FMEA was effective in finding
causal factors related to external disturbances. But it did not take into account design flaws
of the software or missing inputs to the controller, as STPA did.
STPA correctly discovered a missing process model of the embedded controller and
measurement system misalignment between hierarchical levels of the system.
For these reasons the value of STPA has been successfully demonstrated.
7.1 Recommendation Summary
In addition to the specific recommendations summarized in section 6.1 for both the
sponsoring company and the STPA practicing community, it is recommended that the
sponsoring company adopt STPA as part of Engineering Standard Work for New Product
Development.
7.2 Future Research
It is recommended that more case studies be conducted to test the ability of the STPA method
to detect and correct quality losses in new product development. More case studies should
also be conducted, for safety or quality analysis, to test the recommended changes to the
STPA method.

Page 104
There is still a need for methods for identifying unidentified noise factors. While STPA did
encourage the design team to consider external noise factors but did not provide sufficient
guidance to enumerate them.
One of the causal factors identified in all processes of the two cases is the use of process
models outside of the validated use range. Guidelines for when to re-use process models and
design heuristics would greatly improve the design team’s ability to prevent quality losses.

Page 105
8 References (Pepper 1926; Ackoff 1971; Allen 1984; Griffin and Hauser 1992; Bhattacharya, Krishnan et al. 1998; Bashir and Thomson 1999; Albee,
Battel et al. 2000; Sterman 2000; Summers and Shah 2003; Crawley, de Weck et al. 2004; de Neufville, de Weck et al. 2004; Johnson 2006;
Lindemann, Maurer et al. 2008)
Ackoff, R. L. (1971). "Towards a system of systems concepts." Management Science:
661-671.
Albee, A., S. Battel, et al. (2000). "Report on the loss of the Mars Polar Lander and Deep
Space 2 missions." NASA STI/Recon Technical Report N: 61967.
Allen, T. J. (1984). "Managing the Flow of Technology: Technology Transfer and the
Dissemination of Technological Information Within the R&D Organization ".
Atherton, M. J. (2005). System theoretic framework for assuring safety and
dependability of highly integrated aero engine control systems System Design
and Management. Cambridge, Massachusetts Institute of Technology. S.M.
Baldwin, C. Y. and K. B. Clark (2005). "Between" Knowledge" and" the Economy": Notes
on the Scientific Study of Designs." Cambridge, MA: Harvard Business School.
Baregheh, A., J. Rowley, et al. (2009). "Towards a multidisciplinary definition of
innovation." Management decision 47(8): 1323-1339.
Bashir, H. A. and V. Thomson (1999). "Estimating design complexity." Journal of
Engineering Design 10(3): 247-257.
Bhattacharya, S., V. Krishnan, et al. (1998). "Managing new product definition in highly
dynamic environments." Management Science 44(11-Part-2): S50-S64.
Brown, S. L. and K. M. Eisenhardt (1995). "Product development: Past research, present
findings, and future directions." Academy of Management Review: 343-378.
Browning, T. R. (2001). "Applying the design structure matrix to system decomposition
and integration problems: a review and new directions." Engineering
Management, IEEE Transactions on 48(3): 292-306.
Chrysler Corporation, F. M. C., General Motors Corporation (2008). Reference Manual,
4th ed. . Potential Failure Modes and Effects Analysis (FMEA). .
Clark, K. B. and T. Fujimoto (1989). "Lead time in automobile product development
explaining the Japanese advantage." Journal of Engineering and Technology
Management 6(1): 25-58.
Clerc, J. C. (1996). "Catalytic diesel exhaust aftertreatment." Applied Catalysis B:
Environmental 10(1): 99-115.

Page 106
Couturier, M. J. (2010). A case study of Vioxx using STAMP Engineering Systems
Division. Cambridge, Massachusetts Institute of Technology. S.M. in Technology
and Policy.
Crawley, E., O. de Weck, et al. (2004). "The influence of architecture in engineering
systems." Engineering Systems Monograph.
Cummins, I. "Cummins, Inc. Website." 2012, from www.cummins.com.
Cusumano, M. A. and K. Nobeoka (1992). "Strategy, structure and performance in
product development: Observations from the auto industry." Research Policy
21(3): 265-293.
de Neufville, R., O. de Weck, et al. (2004). Engineering systems monograph, Citeseer.
De Weck, O. L., D. Roos, et al. (2011). Engineering Systems: Meeting Human Needs in a
Complex Technological World Mit Press.
Duane, J. T. (1964). "Learning Curve Approach to Reliability Monitoring." Aerospace,
IEEE Transactions on 2(2): 563-566.
Eckert, C. M., R. Keller, et al. (2006). "Supporting change processes in design: complexity,
prediction and reliability." Reliability Engineering & System Safety 91(12):
1521-1534.
Eppinger, S. D. and T. R. Browning (2012). "Design Structure Matrix Methods and
Applications."
Eppinger, S. D., D. E. Whitney, et al. (1994). "A model-based method for organizing tasks
in product development." Research in Engineering Design 6(1): 1-13.
Ettlie, J. E., W. P. Bridges, et al. (1984). "Organization strategy and structural differences
for radical versus incremental innovation." Management Science 30(6): 682-695.
Fussell, J. B., G. J. Powers, et al. (1974). "Fault Trees A State of the Art Discussion."
Reliability, IEEE Transactions on 23(1): 51-55.
Griffin, A. and J. R. Hauser (1992). "Patterns of communication among marketing,
engineering and manufacturing—A comparison between two new product
teams." Management Science 38(3): 360-373.
Helferich, J. D. (2011). A systems approach to food accident analysis Engineering
Systems Division. Cambridge, Massachusetts Institute of Technology. S.M. in
Engineering and Management.

Page 107
Henderson, R. M. and K. B. Clark (1990). "Architectural innovation: The reconfiguration
of existing product technologies and the failure of established firms."
Administrative Science Quarterly: 9-30.
Johnson, C. W. (2006). "What are emergent properties and how do they affect the
engineering of complex systems?" Reliability Engineering and System Safety
91(12): 1475-1481.
Kang, C. and M. Golay (2000). "An integrated method for comprehensive sensor
network development in complex power plant systems." Reliability Engineering
& System Safety 67(1): 17-27.
Konstandopoulos, A. G., M. Kostoglou, et al. (2000). "Fundamental studies of diesel
particulate filters: transient loading, regeneration and aging." SAE paper(2000-
01): 1016.
Krishnan, V. and K. T. Ulrich (2001). "Product development decisions: A review of the
literature." Management Science: 1-21.
Lee, W. S., D. Grosh, et al. (1985). "Fault Tree Analysis, Methods, and Applications A
Review." Reliability, IEEE Transactions on 34(3): 194-203.
Leveson, N. G. (2002). "A new approach to system safety engineering." Manuscript in
preparation, draft can be viewed at http://sunnyday. mit. edu/book2. pdf.
Leveson, N. G. (2012). Engineering a Safer World: Systems Thinking Applied to Safety
Mit Press.
Lindemann, U., M. Maurer, et al. (2008). "Structural Complexity Management: An
Approach for the Field of Product Design."
Miller, G. A. (1956). "The magical number seven, plus or minus two: some limits on our
capacity for processing information." Psychological review 63(2): 81.
Moorman, C. and A. S. Miner (1998). "The convergence of planning and execution:
improvisation in new product development." The Journal of Marketing: 1-20.
Morelli, M. D., S. D. Eppinger, et al. (1995). "Predicting technical communication in
product development organizations." Engineering Management, IEEE
Transactions on 42(3): 215-222.

Page 108
Ota, S. D. (2008). Assuring safety in high-speed magnetically levitated (maglev)
systems: the need for a system safety approach Dept. of Aeronautics and
Astronautics. Cambridge, Massachusetts Institute of Technology. S.M.
Pahl, G., W. Beitz, et al. (1996). Engineering Design: A Systematic Approach Springer.
Pepper, S. C. (1926). "Emergence." The Journal of Philosophy 23(9): 241-245.
Phadke, M. and K. Dehnad (2007). "Optimization of product and process design for
quality and cost." Quality and Reliability Engineering International 4(2): 105-
112.
Phadke, M. S. (1995). Quality engineering using robust design Prentice Hall PTR.
Rai, R. and V. Allada (2003). "Modular product family design: agent-based Pareto-
optimization and quality loss function-based post-optimal analysis."
International Journal of Production Research 41(17): 4075-4098.
Rasmussen, J., K. Duncan, et al. (1987). New technology and human error J. Wiley.
Sood, A. and G. J. Tellis (2005). "Technological evolution and radical innovation." Journal
of Marketing: 152-168.
Sosa, M. E., S. D. Eppinger, et al. (2004). "The Misalignment of Product Architecture and
Organizational Structure in Complex Product Development." Management
Science 50(12): 1674-1689.
Spencer, M. B. (2012). Engineering financial safety: a system-theoretic case study from
the financial crisis Engineering Systems Division. Cambridge, Massachusetts
Institute of Technology. S.M. in Technology and Policy.
Spiring, F. A. and A. S. Yeung (1998). "A general class of loss functions with industrial
applications." Journal of Quality Technology 30(2): 152-162.
Sterman, J. D. (2000). Business dynamics: systems thinking and modeling for a complex
world, Irwin/McGraw-Hill New York.
Stringfellow, M. V. (2011). Accident analysis and hazard analysis for human and
organizational factors Massachusetts Institute of Technology, Dept. of
Aeronautics and Astronautics. Cambridge, MA, Massachusetts Institute of
Technology. Ph.D.
Summers, J. D. and J. J. Shah (2003). Developing measures of complexity for engineering
design, ASME.
Page 109
Taguchi, G., S. Chowdhury, et al. (2005). Taguchi's quality engineering handbook
Taguchi, G. and D. Clausing (1990). "Robust quality." Harvard Business Review 68(1):
65-75.
Tague, N. R. (2005). The Quality Toolbox Asq Press.
Trist, E. (1981). "The evolution of socio-technical systems." Occasional paper 2.
Tushman, M. L. and P. Anderson (1986). "Technological discontinuities and
organizational environments." Administrative Science Quarterly: 439-465.
Ulrich, K. T. and S. D. Eppinger (2007). Product Design and Development McGraw-Hill
Higher Education.
Utterback, J. M. and W. J. Abernathy (1975). "A dynamic model of process and product
innovation." Omega 3(6): 639-656.
Van Setten, B. A. A. L., M. Makkee, et al. (2001). "Science and technology of catalytic
diesel particulate filters." Catalysis reviews 43(4): 489-564.
Von Bertalanffy, L. (1950). "An outline of general system theory." British Journal for the
Philosophy of Science.
Wheelwright, S. C. and K. B. Clark (1994). "Accelerating the design-build-test cycle for
effective product development." International Marketing Review 11(1): 32-46.