Embed Size (px)
Citation preview

333
A Trophic Model of the Coastal Fisheries Ecosystem off the West Coast of Sabah and Sarawak, Malaysia*
Len R. Garces1, Alias Man2, Abu Talib Ahmad2, Meii Mohamad-Norizam1 and Geronimo T. Silvestre1
1 WorldFish CenterP.O. Box 500 GPO, 10670 Penang, Malaysia
2 Fisheries Research Institute11960 Batu Maung, Penang, Malaysia
Garces, L.R., M. Alias, A. Abu Talib, M. Mohamad-Norizam and G.T. Silvestre. 2003. A trophic model of the coastal fisheries ecosystem off the West Coast of Sabah and Sarawak, Malaysia, p. 333 - 352. In G. Silvestre, L. Garces, I. Stobutzki, M. Ahmed, R.A. Valmonte- Santos, C. Luna, L. Lachica-Aliño, P. Munro, V. Christensen and D. Pauly (eds.) Assessment, Management and Future Directions for Coastal Fisheries in Asian Countries. WorldFish Center Conference Proceedings 67, 1 120 p.
Abstract
A mass-balance steady-state trophic model of the coastal fisheries ecosystem off the West Coasts of Sabah and Sarawak, Malaysia (10 - 60 m depth) was constructed using the Ecopath software. The ecosystem models were partitioned into 29 ecolo-gical/trophic groups. The input values (e.g. biomasses) for selected groups were obtained from the research (trawl) surveys conducted in the area in 1972. The estimated mean trophic level of the fisheries catch for both models is about 3.3. The biomass values obtained from Ecopath when compared with the estimates of the fishery catch indicate a low level of exploitation of coastal fisheries resources in 1972.
Introduction
Fisheries catches from marine waters off Sabah and Sarawak contributed about 18% (200 933 t) and 9% (101 130 t) of the total marine fish landing of Malaysia in 1999, respectively (Department of Fisheries (DOF) 1999). About 59% of the catch is contributed by small scale (traditional) fisheries, and demersal fish constitute 39% of the catch in Sarawak (Talib et al., this vol.) On the other hand, both commercial and small scale fisheries play an equal role in Sabah and demersal fish constitute about 47% of the total landings.
A total of 13 research (trawl) surveys have been conducted off the coast of Sarawak and the West Coast of Sabah since 1972. The surveys were prin-cipally conducted to locate suitable grounds for
trawling operations and subsequently to determine the abundance of demersal resources for the devel-opment of the trawl fishery (Talib et al. paper no 6).
The results of the trawl surveys in 1972 showed catch rates ranging from 149 to 261 kg·hr-1 from Sarawak coastal waters while relatively higher catch rates were obtained from the West Coast of Sabah, ranging from 476 to 576 kg·hr-1 (Latiff et al. 1976). The estimated demersal stock density ranged from 2.39 to 7.49 t·km-2 in Sarawak waters and 10.49 to 13.56 t·km-2 in Sabah. Based on the catch rates obtained in 1998, the trawl surveys in the Sarawak waters recorded a reduction of the average catch rate between 26% to 60%, while in Sabah reductions of between 82% to 88% were seen (Talib et al. paper no 6).
* WorldFish Center Contribution No. 1712
334 WorldFish Center 335
The Ecopath with Ecosim (EwE) software (Chris-tensen et al. 2000), developed by the WorldFish Centre and the University of British Columbia, was used to construct a trophic model of the coastal fisheries resources off Sabah and Sarawak. Biomass estimates from trawl surveys in 1972, particularly the demersal species/groups, were utilized in the construction of the ecosystem models (Pauly 1996, noted that demersal trawl surveys represent the most straightforward way of finding how many and what kind of fish appears in a given area).
The Ecopath models when used with time series information (e.g. catch data or CPUE) in the Ecosim routine of the EwE software permit evaluation of the effects of changes in the ecosystem (such as a change in the fishery, artificial enhancement of recruitment and any other measurable change such as nutrient loading or pollution) to be accurately simulated and the outcome predicted (Christensen 1998; Supongpan et al. this vol.). Hence, the tro-phic models constructed can be used for future temporal and/or spatial analysis. The models can also be utilized to understand the ecosystem effects on the decline in biomass of most demersal re-sources in the area.
Materials and MethodsStudy Area
The continental shelf off Sarawak has an area of about 125 000 km2, of which 97 000 km2 is traw-lablea (see Fig. 1). The continental shelf (located between latitude 1º 30’ N to 7º 07’ N and longitude 109º 38’ E to 114º 05’ E) extends up to 220 m at its furthest point north of Tanjong Po in the south and its narrowest point at 30 nautical miles north of Tanjong Baram in the north. Beyond the 200 m isobath in this area, the depths drop to 1 000 m over a mean distance of 2.5 nautical miles. The fisheries resources of Sarawak are such that major fishing effort is on muddy areas, mostly in the nearshore waters. In 1998, coastal demersal fish was reported as being overfished, while off-shore demersal was being lightly exploited. Land-ing of marine fish by gear in 2000 was dominated by trawl nets, i.e. 70% of total gears.
a www.tracc.00server.com/Fisheries/desstructive_fishing/sarawak_trawl_fisheries.htmlb www.tracc.00server.com/Fisheries/desstructive_fishing/fisheries_sabah.htmlc www.iczm.sabah.gov.my/Reports/Coastal%20Profile%20Sabah/ch11/11-FISHERIES.html
The coastline of Sabah is about 1 600 km (from the boundary of Brunei Darusalam waters to Kudat on the northern tip of Sabah), and surrounded by the South China Sea and the Palawan Thrust on the northwest, the Celebes Sea on the southeast and the Sulu Sea on the east. The west coast is gen-erally rocky and sandy, while mangrove swamps dominate the east coast. The continental shelf area (located between latitude 4º 50’ N to 8º 24’ N and longitude 112º 30’ E to 117º 00’ E) for the west coast of Sabah is roughly 28 000 km2, with approximately 14 000 km2 is trawlableb.
The marine capture fisheries can be categorized into two sub-sectors, i.e. deep-sea fisheries and coastal fisheries. Deep-sea fishing contributes to roughly 30% of the total marine landings in Sabah, mostly pelagic fishes. Deep-sea resources are esti-mated to be about 140 000 t, of which roughly 11 000 t are demersal fishc. Most of the fishing activities however are concentrated within 30 nm from shore (categorized as coastal fisheries), with trawling being the main activity (mostly for prawns and finfishes).
The marine waters in the study area are influenced by monsoon patterns. Based on a recent study, the primary production during the southwest mon-soon period varied between 0.13 to 0.88 gC·m-2
·day-1 particularly in the coastal areas, and produc-tion rates were observed to be highest in waters off Brunei Darussalam and Sabah (SEAFDEC, 2000). Moreover, the total calculated biomass for chloro-phyll a from a survey area of 243 000 km2 was in the order of 1 870 and 2 070 t.
Trawl Survey
A total of 13 surveys have been conducted off the coast of Sarawak and the West Coast of Sabah since 1972 employing research vessels (Talib et al. paper no 6). In 1972, the trawl survey in the coastal waters off Sabah and Sarawak was conducted from 29 March to 1 May 1972. The survey area off the West Coast of Sabah covered about 20 209 km2 while about 76 668 km2 was surveyed off the coast of Sawarak waters (see Fig. 1). A total of 268 trawl stations/hauls were conducted between 10 - 60 m depth (see Fig. 2). Of this, 92 hauls were conducted off the West Coast of Sabah and 176 in Sarawak

334 WorldFish Center 335
Fig. 1. Map of Sarawak and Sabah states showing the six sub-areas: Sub-areas I, II and III off the coast of Sarawak and Sub-areas IV, V and VI off the coast of Sabah.
waters. Detailed descriptions of the survey and fishing operations are presented in (Latiff et al., 1976). The trawl surveys were carried out using two research stern trawlers, namely, KK Jehanak (Penyelidik I) and KK Merah (Penyelidik II). The research vessels have an overall length (LOA) of 23 m and a displacement of 85 GT. The vessels
were powered by 325 hp and 365 hp diesel engines, respectively. The trawl gear used was a standard German type otter trawl with cod-end mesh size of 40 mm. At each fishing station, trawl-ing was conducted for about 1 hour with a towing speed of 2.8 knots. Fishing was conducted only during day-time hours (between 6 am to 6 pm).
LONGITUDE ºE
LATI
TUD
E ºN
98 99 100 101 102 103 104 105 106 107
1
2
3
4
5
6
7
8
9
EEZ Boundary of Malaysia
International Boundaries
AREA NOT SURVEYED
BORNEOSARAWAK
SABAH
BRUNEIDARUSSALAM
SOUTH CHINA SEA
SUB-AREA I
SUB-AREA II
SUB-AREA III
SUB-AREA IV
SUB-AREA V
SUB-AREAVI

336 WorldFish Center 337
Fig. 2. Distributions of sampling stations during the 1972 surveys off the coast of Sabah (a) and Sarawak (b) using K.K. JENAHAK/K.K. MERAH.
113 114 115 116 117 118
4
5
6
7
8
LONGITUDE ºE
LATI
TUD
E ºN
SUB-AREA V
SUB-AREA VI
SABAH
109 110 111 112 113 114
1
2
3
4
5
LONGITUDE ºE
LATI
TUD
E ºN
SUB-AREA I
SUB-AREA II
SUB-AREA III
SARAWAK
(a)
(b)
336 WorldFish Center 337
Modeling Approach
The trophic model for Sabah and Sarawak was constructed using the Ecopath with Ecosim (EwE) software following the approach described in Chris-tensen et al. (2000). Ecopath has been used to model a wide variety of aquatic ecosystems (Chris-tensen and Pauly 1993). It is also used to analyze trophic interactions and state variables (biomasses) derived from quantitative steady state models of aquatic systems (Christensen and Pauly 1992a; Christensen and Pauly 1992b).
Ecopath combines the method described by (Po-lovina 1984) for estimation of biomass and food consumption of the various elements (species or groups of species) of an aquatic ecosystem with an approach by (Ulanowicz 1986) for analysis of flows between the elements of ecosystems.
The basic assumption of Ecopath is that the ecosys-tem being analyzed is in steady-state, which means that the flows in and out of each component (box) must be balanced over the time period studied. This assumption results in a system of biomass budget using a set of simultaneous linear equations (one for each group i) expressed as:
Production by (i) - all predation on (i) - non predation losses of (i) - export of (i) = 0
Another way of expressing the basic equation is:
Pi - B
i · M2
i - P
i (1-EE
i) - EX
i = 0 (1)
where Pi = the production of i; B
i = the biomass
of i; M2i = the predation mortality of i; EE
i = the
ecotrophic efficiency of i, that is part of the production that is either passed up the trophic level or exported; 1- EE
i = ‘other mortality’; and EX
i
= the export of i.
A predator group is connected to its prey groups by its consumption (QBi). Thus equation (1) can be re-expressed as:
Bi · PB
i · EE
i - ∑B
j · QB
j · DC
ji - EX
i = 0 (2)
where PBi is the production/biomass ratio, QB
j is
the consumption/biomass ratio of the predator (j), and Diet Composition (DCji) is the fraction of prey (i) in the diet of predator (j).
Parameterization of the model calls for input of three of the following four parameters: B, P/B, Q/B and other mortality, for all groups of living organ-isms discerned in the model (Christensen and Pauly 1992a; Christensen et al. 2000). The fourth param-eter is then calculated using a set of linear equa-tions so as to ensure mass balance. For example, for any group (i), Ecotrophic Efficiency (EE) can be estimated if biomass (B) and production/biomass (PB) are known along with consumption/biomass (QB) and diet composition (DC) of all its predators. Input of fishery catches is also required. By using Ecopath with Ecosim software, all parameters are normalized to unit surface area using wet weights and expressing rates on an annual basis (Chris-tensen et al. 2000).
Defining the Model Components
The model consisted of 29 ecological groups, i.e. 26 consumer groups, 2 producer (phytoplankton/algae) groups and a detritus group. The taxonomic composition of the groups is listed in Table 1 (see also Appendix A). The species composition and biomass data from the trawl surveys in 1972 and catch/landing data were used to assign the species/groups to the ecological groups. The aggregation process for this model was performed based on similarities in habitat, body size, growth and mortality rates and diet composition (Bundy and Pauly 2001). Such information (notably for fish) was mainly obtained from the FishBase database (Froese and Pauly 2000). Taxonomic groups with notable changes in abundance e.g. Lutjanidae, Balistidae (Silvestre 1990) were hence assigned to separate ecological groups for more detailed analysis using time series data. For some fish species (e.g. Leiognathidae, Nemipteridae), they were assigned to a separate ecological group because of their significant contribution to the fish catch as well as their relative abundance during the trawl survey.

338 WorldFish Center 339
Table 1. Taxonomic composition of the 29 ecological groups of the Sabah and Sarawak model.
Ecological Group Representative Taxa
Large Predators Carcharhinidae, Istiophoridae
Tuna Scombridae (Tuna)
Large zoobenthos feeders Dasyatidae, Rachycentridae
Intermediate predators Ariidae, Centropomidae, Chirocentridae, Muraenesocidae, Plectorhynchidae, Plotosidae, Polynemidae, Pomadasyidae, Sphyraenidae, Trichiuridae
Lutjanids Lutjanidae,
Serranids Serranidae
Carangids Carangidae (excluding trevally and scads)
Flatfishes/Soles Psettodidae
Sciaenids Sciaenidae
Small pelagics Caesionidae, Carangidae (trevally), Carangidae (Scads), Hemiramphidae, Scombridae (mackerel)
Engraulids/Clupeids Clupeidae, Engraulidae
Squids Squids, Cephalopods
Demersal zoobenthos feeders Bothidae, Centriscidae, Drepanidae, Formionidae, Gerridae, Lethtrinidae, Mugilidae, Scatophagidae, Siganidae, Sillaginidae, Stromatidae , Synodontidae, Theraponidae, Trash fish
Leiognathids Leiognathidae
Mullids Mullidae
Nemipterids Nemipteridae
Balistids Balistidae
Lactarids Lactariidae
Reef Associated Fish Scaridae, Labridae
Octopus/Sepia Squids, Octopus
Crabs/Lobsters Crabs, Lobsters
Shrimps Penaeus spp.
Ecological group Representative taxa
Small crustaceans Sergestid shrimps, juvenile Penaeidae
Macrobenthos Clams, Mollusc
Meiobenthos –
Zooplankton –
Macrobenthic algae –
Phytoplankton –
Detritus –

338 WorldFish Center 339
Model ParameterizationBiomass
The biomass of the demersal fish groups was obtained from the trawl surveys conducted in the coastal waters off Sabah and Sarawak in 1972 (Latiff et al. 1976). Biomass (B) was estimated using the “swept-area” method (Pauly 1984) with the following formula:
C/f · A B =
a · x1
where B = biomass, C/f = mean cpue, A = total survey area, a = swept area, and x
1 = proportion of
fish in path of gear retained in net (0.5 in Southeast Asian waters).
The swept area is defined by:
a = t · v · h · x2
where t = time spent in trawling, v = trawling veloc-ity, h = length of trawl’s headrope, and x
2 = fraction
of area swept over length of headrope (0.5 in Southeast Asian waters).
The biomass values from the trawl surveys (particularly for the demersal species/taxa) were used as input data and also as the basis for aggregation of the species according to ecological groups (see Table 1).
Other Parameters
Values for most of the other input parameters were taken from the existing Ecopath models e.g. Brunei Darussalam coastal waters (Silvestre et al. 1993) and East Coast Malaysia (Liew and Chan 1987).
Various published models on marine systems in (Christensen and Pauly 1993) were also used as reference. Estimates of total mortality (Z) (Silvestre et al. 1993) for representative species of the various fish groups were used as first approximations of the P/B ratios. P/B ratios for the invertebrate and consumer groups were based on turnover rates reported in the literature Christensen and Pauly (1993). Input parameters for phytoplankton and detritus were derived from Silvestre et al. (1993). The basic input parameters are summarized in Table 2.
Fishery Catch
Catch data for the various species/groups were taken from (Ministry of Agriculture and Fisheries (MAF) 1972). In 1972, the total fish catch was estimated at 1.328 t·km-2·yr-1 and 0.211 t·km-2·yr-1 for Sabah and Sarawak, respectively. It is interesting to note that demersal zoobenthos feeders, interme-diate predators and shrimps are the main groups that provide substantial contribution to fish catch in the study areas (see Table 2 a and b). To arrive at these values, the total landings reported in the annual statistics in 1972 were divided by the total area of the coastal waters covered by the model.
Diet Composition
Data for diet compositions were taken from gut content studies in FishBase (http://www.fishbase. org) and from published Ecopath models (Liew and Chan 1987; Silvestre et al. 1993). Other references used include: (Abitia-Cardenas et al. 1999; Blaber et al. 1990; de Lestang et al. 2000; Platell and Potter 2001; Salini et al. 1994; Velasco et al. 2001). The diet composition data used for model construction is given in Table 3.
340 WorldFish Center 341
Table 2a. Basic input parameters used in constructing the Ecopath model for Sarawak.
Ecological GroupBiomass
(t·km-2·year-1) P/B (year-1) Q/B (year-1) EECatch
(t·km-2·year-1)
Large predators 0.11 – 9.50 0.50 0.010
Tuna – 2.00 11.64 0.50 0.011
Large zoobenthos feeders 0.16 0.40 6.50 – 0.006
Intermediate predators – 1.74 8.70 0.95 0.027
Lutjanids 0.19 – 8.70 0.95 0.002
Serranids – 1.74 8.70 0.95 0.002
Carangids – 2.07 8.70 0.95 0.004
Flatfishes/Soles – 0.85 8.70 0.95 0.001
Sciaenids 0.08 – 8.70 0.95 0.009
Small pelagics – 2.37 7.90 0.95 0.004
Engraulids/Clupeids – 2.70 7.90 0.95 0.015
Squids – 2.05 7.90 0.95 0.004
Demersal zoobenthos feeders – 2.15 10.75 0.95 0.061
Leiognathids 0.85 – 10.75 0.95 0.006
Mullids 0.44 – 10.75 0.95 0.003
Nemipterids 0.16 – 10.75 0.95 0.001
Balistids – 2.15 10.75 0.95 0.000
Lactarids – 2.15 10.75 0.95 0.000
Reef associated fish – 1.50 7.55 0.95 0.000
Octopus/Sepia – 3.00 12.50 0.95 0.004
Crabs/Lobsters – 4.00 21.90 0.95 0.002
Shrimps – 4.00 21.90 0.95 0.034
Small Crustaceans – 62.00 310.00 0.95 0.001
Macrobenthos – 6.80 27.40 0.95 0.000
Meiobenthos – 10.00 50.00 0.95 0.000
Zooplankton – 67.00 280.00 0.95 0.000
Macrobenthic flora – 15.35 – 0.03 0.000
Phytoplankton – 71.20 – .0500 0.000
Detritus 120.00 – – – 0.000
Note: P/B = Production/Biomass ratio, Q/B = Consumption/Biomass ratio, EE = ecotrophic efficiency.

340 WorldFish Center 341
Table 2b. Basic input parameters used in constructing the Ecopath model for Sabah.
Ecological GroupBiomass
(t·km-2·year-1) P/B (year-1) Q/B (year-1) EECatch
(t·km-2·year-1)
Large predators 0.23 – 9.50 0.50 0.06
Tuna – 2.00 11.64 0.50 0.03
Large zoobenthos feeders 0.15 0.40 6.50 – 0.03
Intermediate predators – 1.74 8.70 0.95 0.17
Lutjanids 0.05 – 8.70 0.95 0.01
Serranids – 1.74 8.70 0.95 0.01
Carangids – 2.07 8.70 0.95 0.02
Flatfishes/Soles – 0.85 8.70 0.95 0.05
Sciaenids 0.31 – 8.70 0.95 0.06
Small pelagics – 2.37 7.90 0.95 0.02
Engraulids/Clupeids – 2.70 7.90 0.95 0.09
Squids – 2.05 7.90 0.95 0.02
Demersal zoobenthos feeders – 2.15 10.75 0.95 0.38
Leiognathids 1.99 – 10.75 0.95 0.08
Mullids 1.26 – 10.75 0.95 0.02
Nemipterids 0.57 – 10.75 0.95 < 0.01
Balistids – 2.15 10.75 0.95 < 0.01
Lactarids – 2.15 10.75 0.95 < 0.01
Reef associated fish – 1.50 7.55 0.95 < 0.01
Octopus/Sepia – 3.00 12.50 0.95 0.02
Crabs/Lobsters – 4.00 21.90 0.95 0.01
Shrimps – 4.00 21.90 0.95 0.22
Small Crustaceans – 62.00 310.00 0.95 < 0.01
Macrobenthos – 6.80 27.40 0.95 < 0.01
Meiobenthos – 10.00 50.00 0.95 0.00
Zooplankton – 67.00 280.00 0.95 0.00
Macrobenthos flora – 15.35 – 0.03 0.00
Phytoplankton – 71.20 – 0.50 0.00
Detritus 120.00 – – – 0.00
Note: P/B = Production/Biomass ratio, Q/B = Consumption/Biomass ratio, EE = ecotrophic efficiency.

342 WorldFish Center 343
Tabl
e 3.
The
die
t com
posit
ion
of th
e ec
olog
ical
gro
ups u
sed
in th
e Ec
opat
h an
alys
is. T
he P
reda
tor n
umbe
rs c
orre
spon
d to
the
prey
num
bers
.
Pred
ator
Prey
12
34
56
78
910
1112
1314
1516
1718
1920
2122
2324
2526
1.La
rge p
reda
tors
––
––
––
––
––
––
––
––
––
––
––
––
––
2.Tu
na–
––
––
––
––
––
––
––
––
––
––
––
––
–
3.La
rge z
oobe
ntho
s fe
eder
s–
––
––
––
––
––
––
––
––
––
––
––
––
–
4.In
tern
atio
nal
pred
ator
s0.
200.
22–
0.01
––
0.01
–0.
01–
––
––
––
––
––
––
––
––
5.Lu
tjani
ds–
––
––
––
––
––
––
––
––
––
––
––
––
–
6.Se
rrani
ds–
––
––
––
––
––
––
––
––
––
––
––
––
–
7.Ca
rang
ids
0.10
0.11
––
––
––
––
––
––
––
––
––
––
––
––
8.Fla
tfish
es/S
oles
0.02
––
––
––
––
––
––
––
––
––
––
––
––
–
9.Sc
iaeni
ds0.
10–
––
––
––
0.02
––
––
––
––
––
––
––
––
–
10.
Small
pela
gics
0.20
0.11
–0.
050.
050.
050.
05–
–0.
01–
––
––
––
––
––
––
––
–
11.
Engr
aulid
s/Clu
peid
s0.
100.
22–
0.10
–0.
050.
05–
0.03
––
0.01
––
––
––
––
––
––
––
12.
Squi
ds0.
100.
11–
0.05
––
0.05
0.05
––
––
––
–0.
02–
––
––
––
––
–
13.
Dem
ersa
l zoo
bent
hos
feed
er0.
040.
11–
0.13
0.30
0.20
0.15
0.15
0.05
0.01
––
0.01
––
––
––
––
––
––
–
14.
Leio
gnat
hids
0.02
––
0.05
0.05
0.05
0.10
0.05
–0.
10–
–0.
01–
––
––
––
––
––
––
15.
Mul
lids
0.02
––
0.05
0.05
0.10
0.10
0.05
–0.
01–
–0.
01–
––
––
––
––
––
––
16.
Nem
ipte
rids
0.02
––
0.05
0.05
0.10
0.10
0.05
–0.
01–
–0.
01–
––
––
––
––
––
––
17.
Balis
tids
0.02
––
0.02
0.05
0.10
0.10
––
––
–0.
01–
––
––
––
––
––
––
18.
Lact
arid
s0.
02–
–0.
050.
050.
050.
100.
05–
0.01
––
0.01
––
––
––
––
––
––
–
19.
Reef
asso
ciate
d fis
h0.
02–
–0.
010.
050.
100.
02–
––
––
––
––
––
––
––
––
––
20.
Oct
opus
/Sep
ia0.
02–
0.10
–0.
05–
––
––
––
––
––
––
–0.
02–
––
––
–
21.
Crab
s/Lob
sters
–0.
030.
050.
020.
150.
100.
10–
0.10
0.04
––
––
––
0.05
––
0.01
0.01
––
––
–
22.
Shrim
ps–
0.06
0.20
0.15
0.10
0.05
0.05
–0.
150.
050.
150.
15–
––
0.06
0.05
––
–0.
040.
01–
––
–
23.
Small
crus
tace
ans
–0.
020.
150.
050.
02–
–0.
100.
200.
050.
200.
150.
150.
150.
150.
150.
200.
15–
0.10
0.04
0.30
––
––
24.
Mac
robe
ntho
s–
–0.
400.
200.
020.
050.
020.
250.
300.
100.
100.
100.
250.
460.
450.
450.
300.
45–
0.10
0.38
0.20
––
––
25.
Meio
bent
hos
––
0.05
0.01
0.01
––
0.15
0.05
––
–0.
300.
050.
050.
050.
100.
05–
0.07
0.13
0.05
–0.
30–
–
26.
Zoop
lankt
on–
––
––
––
–0.
050.
500.
400.
440.
200.
240.
200.
200.
200.
240.
100.
100.
03–
0.40
0.10
0.05
0.05
27.
Mac
robe
nthi
c flo
ra–
––
––
––
––
––
––
––
––
–0.
60–
0.02
––
0.10
––
28.
Phyt
oplan
kton
––
––
––
––
–0.
200.
100.
10–
0.05
0.10
––
0.05
0.30
0.10
–0.
050.
500.
050.
050.
70
29.
Detri
tus
––
0.05
––
––
0.10
0.04
–0.
050.
050.
040.
050.
050.
060.
100.
06–
0.50
0.35
0.39
0.10
0.45
0.90
0.25
Sum
1.00
1.00
1.00
1.00
1.00
1.00
1.00
1.00
1.00
1.00
1.00
1.00
1.00
1.00
1.00
1.00
1.00
1.00
1.00
1.00
1.00
1.00
1.00
1.00
1.00
1.00
342 WorldFish Center 343
Results and DiscussionTrophic Model
The basic estimates of the Ecopath model for the coastal fisheries off Sarawak are presented in Table 4a; Table 4b presents the parameters estimated for the trophic model of the West Coast of Sabah. The biomass values obtained from Ecopath when com-pared with estimates of fishery catches given in Table 2 (a & b) imply a relatively low exploitation level of fishery resources in 1972. Under the as-sumption of steady state conditions, estimates of total mortality (Z) are reasonable estimates of turn-over rates (P/B ratios). However, these values should be compared with independent fisheries assess-ments to confirm the estimates.
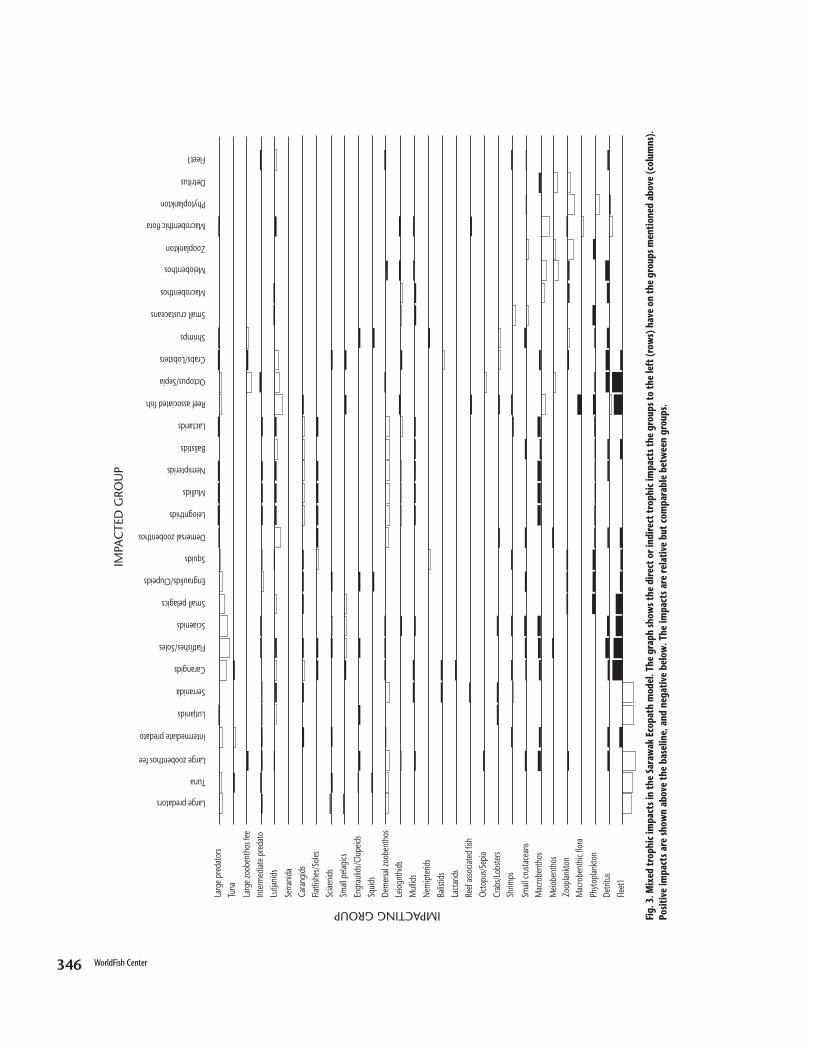
Fig. 3 presents a mixed trophic impact analysis for the Sarawak ecosystem. This analysis quantifies all direct and indirect trophic impacts (be it through predation or competition), and can be seen both as a sensitivity analysis (what groups are important),
and as a measure of the groups and the fishing fleets relating to trophic importance. The figure also indicates that fishing fleets target mainly inter-mediate predators, carangids, demersal species groups (flatfishes/soles, sciaenids), small pelagics including engraulids/clupeids, and shrimps. The fleets have also shown negative impacts on large predators, tuna, large zoobenthos feeders, lutjanids and serranids since the fisheries are exploiting their prey.
It is interesting to note that a relatively higher phy-toplankton biomass has been estimated for the Sabah Ecopath model compared to the Sarawak model. This trend is consistent with the genera-lization from the oceanographic study (SEAFDEC 2000) in the area, wherein relatively higher pri-mary productivity values were obtained from the coastal waters off Sabah and Brunei Darussalam as compared to Sarawak waters. Primary produc-tion levels have an influence on fish abundance as well as biomass of fisheries resources in the study area.
344 WorldFish Center 345
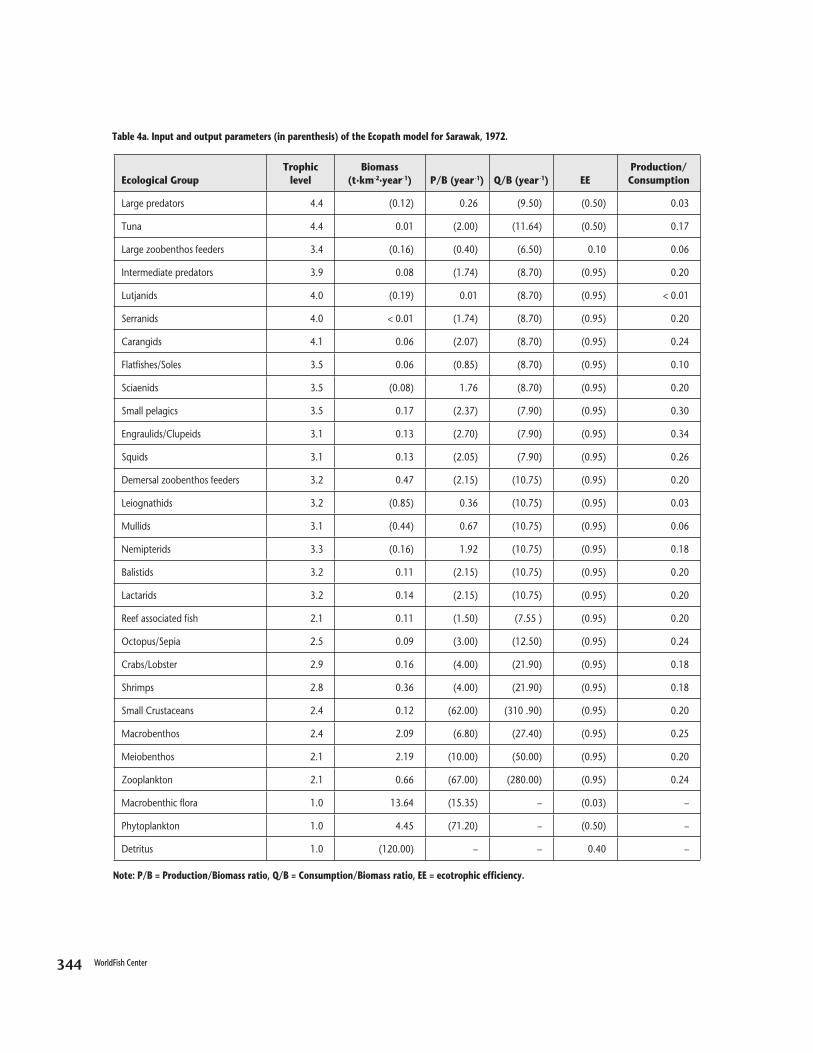
Table 4a. Input and output parameters (in parenthesis) of the Ecopath model for Sarawak, 1972.
Ecological GroupTrophic
levelBiomass
(t·km-2·year-1) P/B (year-1) Q/B (year-1) EEProduction/Consumption
Large predators 4.4 (0.12) 0.26 (9.50) (0.50) 0.03
Tuna 4.4 0.01 (2.00) (11.64) (0.50) 0.17
Large zoobenthos feeders 3.4 (0.16) (0.40) (6.50) 0.10 0.06
Intermediate predators 3.9 0.08 (1.74) (8.70) (0.95) 0.20
Lutjanids 4.0 (0.19) 0.01 (8.70) (0.95) < 0.01
Serranids 4.0 < 0.01 (1.74) (8.70) (0.95) 0.20
Carangids 4.1 0.06 (2.07) (8.70) (0.95) 0.24
Flatfishes/Soles 3.5 0.06 (0.85) (8.70) (0.95) 0.10
Sciaenids 3.5 (0.08) 1.76 (8.70) (0.95) 0.20
Small pelagics 3.5 0.17 (2.37) (7.90) (0.95) 0.30
Engraulids/Clupeids 3.1 0.13 (2.70) (7.90) (0.95) 0.34
Squids 3.1 0.13 (2.05) (7.90) (0.95) 0.26
Demersal zoobenthos feeders 3.2 0.47 (2.15) (10.75) (0.95) 0.20
Leiognathids 3.2 (0.85) 0.36 (10.75) (0.95) 0.03
Mullids 3.1 (0.44) 0.67 (10.75) (0.95) 0.06
Nemipterids 3.3 (0.16) 1.92 (10.75) (0.95) 0.18
Balistids 3.2 0.11 (2.15) (10.75) (0.95) 0.20
Lactarids 3.2 0.14 (2.15) (10.75) (0.95) 0.20
Reef associated fish 2.1 0.11 (1.50) (7.55 ) (0.95) 0.20
Octopus/Sepia 2.5 0.09 (3.00) (12.50) (0.95) 0.24
Crabs/Lobster 2.9 0.16 (4.00) (21.90) (0.95) 0.18
Shrimps 2.8 0.36 (4.00) (21.90) (0.95) 0.18
Small Crustaceans 2.4 0.12 (62.00) (310 .90) (0.95) 0.20
Macrobenthos 2.4 2.09 (6.80) (27.40) (0.95) 0.25
Meiobenthos 2.1 2.19 (10.00) (50.00) (0.95) 0.20
Zooplankton 2.1 0.66 (67.00) (280.00) (0.95) 0.24
Macrobenthic flora 1.0 13.64 (15.35) – (0.03) –
Phytoplankton 1.0 4.45 (71.20) – (0.50) –
Detritus 1.0 (120.00) – – 0.40 –
Note: P/B = Production/Biomass ratio, Q/B = Consumption/Biomass ratio, EE = ecotrophic efficiency.

344 WorldFish Center 345
Table 4b. Input and output parameters (in parenthesis) of the Ecopath model for Sabah, 1972.
Ecological GroupTrophic
levelBiomass
(t·km-2·year-1) P/B (year-1) Q/B (year-1) EEProduction/Consumption
Large predators 4.4 (0.23) 0.55 (9.50) (0.50) 0.06
Tuna 4.4 0.03 (2.00) (11.64) (0.50) 0.17
Large zoobenthos feeders 3.4 (0.15) (0.40) (6.50) 0.48 0.06
Intermediate predators 3.9 0.25 (1.74) (8.70) (0.95) 0.20
Lutjanids 4.0 (0.05) 0.22 (8.70) (0.95) 0.03
Serranids 4.0 0.01 (1.74) (8.70) (0.95) 0.20
Carangids 4.1 0.14 (2.07) (8.70) (0.95) 0.24
Flatfishes/Soles 3.5 0.19 (0.85) (8.70) (0.95) 0.10
Sciaenids 3.5 (0.31) 1.13 (8.70) (0.95) 0.13
Small pelagics 3.0 0.32 (2.37) (7.90) (0.95) 0.30
Engraulids/Clupeids 3.1 0.34 (2.70) (7.90) (0.95) 0.34
Squids 3.1 0.34 (2.05) (7.90) (0.95) 0.26
Demersal zoobenthos feeders 3.2 0.80 (2.15) (10.75) (0.95) 0.20
Leiognathids 3.2 (1.99) 0.30 (10.75) (0.95) 0.03
Mullids 3.1 (1.26) 0.43 (10.75) (0.95) 0.04
Nemipterids 3.3 (0.57) 0.94 (10.75) (0.95) 0.09
Balistids 3.2 0.16 (2.15) (10.75) (0.95) 0.20
Lactarids 3.2 0.24 (2.15) (10.75) (0.95) 0.20
Reef associated fish 2.1 0.13 (1.50) (7.55) (0.95) 0.20
Octopus/Sepia 2.5 0.10 (3.00) (12.50) (0.95) 0.24
Crabs/Lobster 2.9 0.22 (4.00) (21.90) (0.95) 0.18
Shrimps 2.8 0.79 (4.00) (21.90) (0.95) 0.18
Small Crustaceans 2.4 0.27 (62.00) (310 .00) (0.95) 0.20
Macrobenthos 2.4 4.75 (6.80) (27.40) (0.95) 0.25
Meiobenthos 2.1 4.85 (10.00) (50.00) (0.95) 0.20
Zooplankton 2.1 1.50 (67.00) (280.00) (0.95) 0.24
Macrobenthic flora 1.0 29.76 (15.35) – (0.03) –
Phytoplankton 1.0 10.06 (71.20) – (0.50) –
Detritus 1.0 (120.00) – – – –
Note: P/B = Production/Biomass ratio, Q/B = Consumption/Biomass ratio, EE = ecotrophic efficiency.
346 WorldFish Center 347
Large predators
Tuna
Large zoobenthos fee
Intermediate predato
Lutjanids
Serranida
Carangids
Flatfishes/Soles
Sciaenids
Small pelagics
Engraulids/Clupeids
Squids
Demersal zoobenthos
Leiognthids
Mullids
Nemipterids
Balistids
Lactarids
Reef associated fish
Octopus/Sepia
Crabs/Lobsters
Shrimps
Small crustaceans
Macrobenthos
Meiobenthos
Zooplankton
Macrobenthic flora
Phytoplankton
Detritus
Fleet1
Larg
e pre
dato
rs
Tuna
Larg
e zoo
bent
hos f
eeIn
term
ediat
e pre
dato
Lutja
nids
Serra
nida
Cara
ngid
sFla
tfish
es/S
oles
Sciae
nids
Small
pela
gics
Engr
aulid
s/Clu
peid
sSq
uids
Dem
ersa
l zoo
bent
hos
Leio
gnth
ids
Mul
lids
Nem
ipte
rids
Balis
tids
Lact
arid
sRe
ef as
socia
ted
fish
Oct
opus
/Sep
ia
Crab
s/Lob
sters
Shrim
ps
Small
crus
tace
ans
Mac
robe
ntho
s
Meio
bent
hos
Zoop
lankt
onM
acro
bent
hic f
lora
Phyt
oplan
kton
Detri
tus
Fleet
1
IMPACTING GROUP
IMPA
CTE
D G
ROU
P
Fig.
3. M
ixed
trop
hic
impa
cts i
n th
e Sa
raw
ak E
copa
th m
odel
. The
gra
ph sh
ows t
he d
irect
or i
ndire
ct tr
ophi
c im
pact
s the
gro
ups t
o th
e le
ft (r
ows)
hav
e on
the
grou
ps m
entio
ned
abov
e (c
olum
ns).
Posit
ive
impa
cts a
re sh
own
abov
e th
e ba
selin
e, a
nd n
egat
ive
belo
w. T
he im
pact
s are
rela
tive
but c
ompa
rabl
e be
twee
n gr
oups
.

346 WorldFish Center 347
Parameter Sabah Sarawak
Sum of all consumption (t·km-2·year -1) 972.4 434.6
Sum of all exports (t·km-2·year -1) 605.5 273.0
Sum of all respiratory flows (t·km-2·year -1) 567.7 253.4
Sum of all flows into detritus (t·km-2·year -1) 1 006.4 453.3
Total system throughput (t·km-2·year -1) 3 152.0 1 414.0
Sum of all production (t·km-2·year -1) 1 383.0 616.0
Calculated total net primary production (t·km-2·year -1) 1 173.2 536.4
Net system production (t·km-2·year -1) 605.5 273.0
Total primary production/total respiration 2.07 2.08
Total primary production/total biomass (year -1) 19.62 19.37
Total biomass/total throughput (year) )0.02 0.02
Total biomass (excluding detritus) (t·km-2) 59.8 27.2
Mean trophic level of the fisheries catch 3.33 3.38
Total catches (t·km-2·year -1) 1.32 0.21
Gross efficiency (catch/net primary production) 0.0011 0.0004
Connectance Index 0.27 0.27
System Omnivory Index 0.22 0.22
Table 5. Summary of ecosystem parameter values for Ecopath models.
The summary statistics of the trophic models for Sabah and Sarawak are presented in Table 5. Total throughput is estimated at 3 152 t·km-2·year-1 for the trophic model for Sabah and 14 14 t·km-2
·year-1 for Sarawak. Mean trophic level of the fish-ery is 3.33 and 3.38, respectively. Biomass estimates for the various trophic levels (excluding detritus) for Sabah is 59.8 t·km-2, and 27.2 t·km-2 for Sar-awak. The relatively higher biomass in Sabah wa-ters may justify the relatively higher fishery catches (see Table 2) compared to Sarawak. In addition, the sum of all production is also relatively higher in Sabah than Sarawak. It is interesting to note that the 1972 levels in biomass and production in these areas are comparable to the values obtained from
the Ecopath model for Brunei Darussalam coastal fisheries (Silvestre et al. 1993), in which the ecosys-tem was considered as a system under a low level of fishing.
Other derived parameters indicate that the coastal ecosystem in the study areas is in a stage of devel-opment. These include: (1) a P/R ratio greater than 1; (2) relatively high net system production (Sabah: 605 t·km-2 and Sarawak: 273 t·km-2); and (3) P/B ratio greater than 1. Moreover, these indicators may suggest that the system has been under a moderate level of exploitation. Generally this situation can drive development of the system back to earlier stages (Odum 1971).

348 WorldFish Center 349
It is suggested that these Ecopath models be uti-lized with time series information (e.g. catch data or CPUE) and that estimates (e.g. biomasses) be evaluated from fishery-independent surveys. As highlighted earlier, the Ecosim routine of the EwE software permits evaluation of the effects of changes in the ecosystem (such as a change in the fishery and any other measurable change such as nutrient loading or pollution) to be accurately simulated and the outcome predicted. In addition, the models can be used for temporal analysis and in under-standing the declines in biomass and the associated changes in species composition due to the increased intensity of fishing from 1972 to the present.
References
Abitia-Cardenas, L.A., F. Galvan-Magaña, F.J. Guitierrez-Sanchez, J. Rodriguez-Romero, B. Aguilar-Palomino and A. Moehl-Hitz. 1999. Diet of blue marlin Makaira mazara off the coast of Cabo San Lucas, Baja California Sur, Mexico. Fisheries Research 44 : 95 - 100.
Blaber, S.J.M., D.A. Milton and N.J.F. Rawlinson. 1990. Diets of lagoon fishes of the Solomon Islands: Predators of tuna baitfish and trophic effects of baitfishing on the subsistence fishery. Fisheries Research 8 : 263 - 286.
Bundy, A. and D. Pauly. 2001. Selective harvesting by small scale fisheries: ecosystem analysis of San Miguel Bay, Philippines. Fisheries Research 53 : 263 - 281.
Christensen, V. 1998. Fishery-induced changes in marine ecosystem: insight from models of the Gulf of Thailand. Journal of Fish Biology 53(Supplement A): 128 - 142.
Christensen, V. and D. Pauly. 1992a. A guide to the ECOPATH software system (version 2.1). ICLARM Software 6, Manila, Philippines.
Christensen, V. and D. Pauly. 1992b. ECOPATH II- A software for balancing steady-state ecosystem models and calculating network characteristics. Ecological Modelling 61 : 169 - 185.
Christensen, V. and D. Pauly. 1993. Trophic models of aquatic ecosystems. ICLARM Conference Proceedings 26, p. 390, Manila, Philippines.
Christensen, V., C.J. Walters and D. Pauly. 2000. Ecopath with Ecosim: A User’s Guide Fisheries Centre, University of British Columbia, Vancouver, Canada. ICLARM, Penang, Malaysia.
de Lestang, S., M.E. Platell and I.C. Potter. 2000. Dietary composition of the blue swimmer crab Portunus pelagicus L. Does it vary with body size and shell state and between estuaries? Journal Experimental Marine Biology and Ecology 246 : 2241 - 2257.
DOF (Department of Fisheries). 1999. Annual Fisheries Statistics 1999 Department of Fisheries, Malaysia, Kuala Lumpur , Malaysia. Froese, R. and D. Pauly. 2000. FishBase [Online]. Available by World Wide Web electronic publication. www.fishbase.org.
Froese, R. and D. Pauly. 2000. FishBase 2000: Concepts, design and data sources. ICLARM, Los Baños, Laguna, Philipines. 344p.
Latiff, M.S.S.A., W. Weber, A.K. Lee and W.C. Lam. 1976. Demersal fish resources in Malaysian waters-6. First Trawl Survey off the Coastal of Sarawak, Brunei and the west Coast of Sabah (29 March to 1 May 1972). Fisheries Bulletin No.8. Ministry of Agriculture and Rural Development, Malaysia, Kuala Lumpur, Malaysia.
Liew, H.C. and E.H. Chan. 1987. ECOPATH model of a tropical shallow-water community in Malaysia. International Development Research Centre. Unpublished, Singapore
MAF (Ministry of Agriculture and Fisheries). 1972. Annual Fisheries Statistics Ministry of Agriculture and Fisheries, Fisheries Division , Malaysia, Kuala Lumpur, Malaysia.
Odum, E.P. 1971. Fundamentals of ecology. 3rd edition W.B. Saunders, Philadelphia.
Pauly, D. 1984. Fish Population dynamics in tropical waters: a manual for use with programmable calculators ICLARM Studies and Review 8, Manila, Philippines.
Pauly, D. 1996. Biodiversity and the retrospective analysis of demersal trawl surveys: a programmatic approach, p. 1 - 6. In D. Pauly and P. Martosubroto, eds. Baseline studies of biodiversity: the fish resources of Western Indonesia. ICLARM Studies Review 23, 312 p., Manila, Philippines.
Platell, M.E. and I.C. Potter. 2001. Partitioning of food resources among 18 abundant benthic carnivorous fish species in marine waters on the lower coast of Australia. Journal Experimental Marine Biology and Ecology 261 : 31 - 54.
Polovina, J.J. 1984. Model of a coral reef ecosystems I. The ECOPATH model and its application to French Frigate Shoal. Coral Reefs 3:1-11.Salini, J.P., S.J.M. Blaber and D.T. Brewer. 1994. Diets of trawled predatory fish of the Gulf of Carpentaria, Australia, with particular reference to predation on prawns. Australia Journal of Freshwater & Marine research 45 : 397 - 411.
348 WorldFish Center 349
Salini. J.P., S.J.M. Blaber and D.T. Brewer 1994. Diets of predatory fish of the gulf of Carpentania, Austrialia, with particular reference to predation on prawns. Australia Journal of Freshwater & Marine research 45 : 397 - 411.
SEAFDEC. 2000. Highlights of the SEAFDEC interdepartmental collaborative research program on fishery resources in the South China Sea, Area II: Waters of Sabah, Sarawak (Malaysia) and Brunei Darussalam. Special Paper no. SEC/SP/40. Southeast Asian Fisheries Development Center, Bangkok, Thailand.
Silvestre, G.T. 1990. Overexploitation of the demersal stocks of Lingayen Gulf, Philippines, p. 873 - 876. In R. Hirano and I. Hanyu (eds.) The second Asian Fisheries Forum, 991p. Asian Fisheries Society, Manila, Philippines.
Silvestre, G.T., S. Selvanathan and A.H.M. Salleh. 1993. Preliminary trophic model of the coastal fisheries resources of Brunei Darussalam, South China Sea, p. 300 - 306. In V. Christensen and D. Pauly, eds. Trophic models of aquatic ecosystems. ICLARM Conference Proceedings 26, 390 p., Manila, Philippines.
Ulanowicz, R.E. 1986. Growth and development: Ecosystem phenomenology Springer- Verlag, New York, USA.
Velasco, F., I. Olaso and F. Sanchez. 2001. The role of cephalopods as forage for the demersal fish community in the southern Bay of Biscay. Fisheries Research 52 : 65 - 77.
Ecological Group Local name English name Family
Large Predators
Tuna
Yu MersujiAya/TongkolTenggiri
Grey reef sharkBlack marlinLongtail tunaIndo-Pacific Spanish mackerel/Spotted Spanish mackerel
CarcharhinidaeIstiophoridaeScombridaeScombridae
Large zoobenthos feeders PariAruan tasik
Pale-edged rayBlack kingfish
DasyatidaeRachycentridae
Intermediate predators SiakapDuri/PulutanDuri/JahanPedukangMalongKaciSemilangKurauIkan buluParangTimahGerut-gerutAlu-alu
Barramundi/Giant seaperchEngraved catfishGiant catfishSea catfishDagger tooth pike conger/Silver conger eelPainted sweetlipsCanine catfish eelFourfinger threadfinBlackhand paradise fishDorab wolf-herringHairtailLined silver grunterBanded barracuda/Slender sea pike
Lates CalcarifesAriidaeAriidaeAriidaeMuraenesocidaePlectorhynchidaePlotosidaePolynemidaePolynemidaeChirocentridaeTrichiuridaePomadasyidaeSphyraenidae
Lutjanids MerahJenahakKerisi baliRemong
Malabar red snapperJohn’s snapper/Giant snapperSharptooth snapper Bigeye snapper
LutjanidaeLutjanidaeLutjanidaeLutjanidae
Serranids Kerapu Six-banded grouper Serranidae
Carangids BulanCerminCincaruDemudokJamahPisang-pisangSelunsongTalang
Indo-Pacific tarponHorse mackerel/Malabar cavallaHardtail scadBlue trevallyBigeye trevallyRainbow runnerTrevallyQueenfish/Slender leatherskin
CarangidaeCarangidaeCarangidaeCarangidaeCarangidaeCarangidaeCarangidaeCarangidae
Appendix A. Taxonomic composition of the 29 ecological groups of the Sabah and Sarawak Ecopath models.
350 WorldFish Center 351
Ecological Group Local name English name Family
Flatfishes/Soles Lidah/Sebelah Tongue soles Psettodidae
Sciaenids GelamaPanjang/Terusan
Sin croakerCroaker
SciaenidaeSciaenidae
Small pelagics DelahPelata/SelarSelar kuningSelayangJolong-jolongKembong
FusilierHerring trevallyYellowbanded scadRound scadHalfbeakShort bodied mackerel
CaesionidaeCarangidaeCarangidaeCarangidaeHemiramphidaeScombridae
Engraulids/Clupeids KebasiPuputTerubukEmpiritTambanBilisBulu ayamImpirang
Chacunda gizzard shadSlender shad/Elongate illishaToli shadLongtail shadFringescale sardinellaShorthead anchovyGrenadier anchovyScaly hairfin anchovy
ClupeidaeClupeidaeClupeidaeClupeidaeClupeidaeEngraulidaeEngraulidaeEngraulidae
Squids Sotong biasaSotong kereta/katak/biasa
SquidCephalopods
Demersal zoobenthos feeders Daun baharuDengkisBulusMengkerongLumiSebelahKerong-kerongPelandokBelanakBawal/KilatDueh/Bawal putihDueh/Bawal hitamDueh/Bawal tambakKitangIkan bajaIkan campurKekapas/KapasKering/Lidi
Spotted sicklefishRabbitfishSilver whitingGreater lizardfishBombay duckMalayan flounderLarge scale theraponEmperorLarge scale mulletPomfretSilver pomfretBlack pomfretChinese pomfretSpotted scadTrash fishMixed fishMojarra (long-rayed)Razorfish
DrepanidaeSiganidaeSillaginidaeSynodontidaeSynodontidaeBothidaeTheraponidaeLethrinidaeMugilidaeStromatidaeStromatidaeFormionidaeStromatidaeScatophagidaeTrash fishMixed fishGerridaeCentriscidae
Leiognathids KikekIkan baja
Common ponyfishTrash fish (~20%)
LeiognathidaeTrash fish
Mullids Biji nangka Goatfishes Mullidae
Nemipterids KerisiPasir
Japanese threadfin breamsMonocle bream
NemipteridaeNemipteridae
Balistids Jebong Stary triggerfish Balistidae
Lactarids Shrumbu False trevally Lactariidae
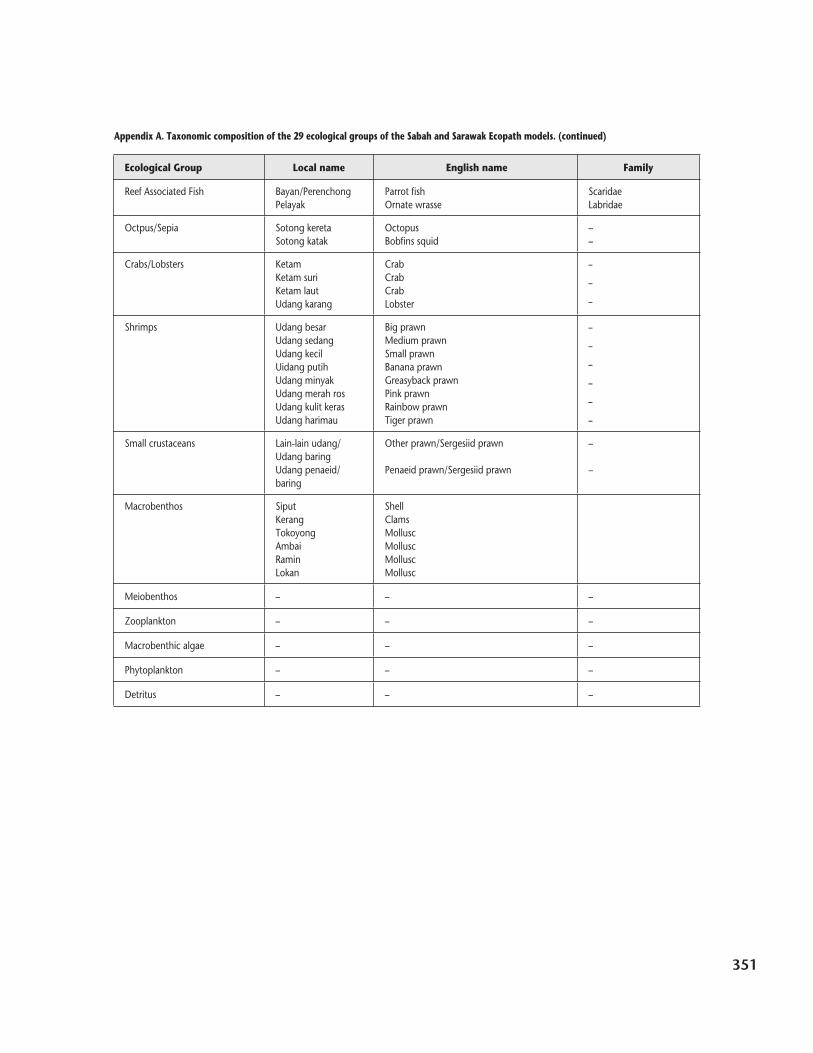
Appendix A. Taxonomic composition of the 29 ecological groups of the Sabah and Sarawak Ecopath models. (continued)
350 WorldFish Center 351
Appendix A. Taxonomic composition of the 29 ecological groups of the Sabah and Sarawak Ecopath models. (continued)
Ecological Group Local name English name Family
Reef Associated Fish Bayan/PerenchongPelayak
Parrot fishOrnate wrasse
ScaridaeLabridae
Octpus/Sepia Sotong keretaSotong katak
OctopusBobfins squid
––
Crabs/Lobsters KetamKetam suriKetam lautUdang karang
CrabCrabCrabLobster
–
–
–
Shrimps Udang besarUdang sedangUdang kecilUidang putihUdang minyakUdang merah rosUdang kulit kerasUdang harimau
Big prawnMedium prawnSmall prawnBanana prawnGreasyback prawnPink prawnRainbow prawnTiger prawn
–
–
–
–
–
–
Small crustaceans Lain-lain udang/Udang baringUdang penaeid/baring
Other prawn/Sergesiid prawn
Penaeid prawn/Sergesiid prawn
–
–
Macrobenthos SiputKerangTokoyongAmbaiRaminLokan
ShellClamsMolluscMolluscMolluscMollusc
Meiobenthos – – –
Zooplankton – – –
Macrobenthic algae – – –
Phytoplankton – – –
Detritus – – –

352 WorldFish Center