Embed Size (px)
Citation preview
A ternary model of decompression sickness in the rat
by
Peter Buzzacott, Kate Lambrechts, Aleksandra Mazur, Qiong Wang, Virginie Papadopoulou,
Michael Theron, Costantino Balestra, François Guerrero.
Peter Buzzacott is a Marie Curie Experienced Research Fellow, Université de Bretagne
Occidentale, Laboratoire Optimisation des Régulations Physiologiques (ORPhy), UFR
Sciences et Techniques, 6 avenue Le Gorgeu, CS 93837, 29200 Brest Cedex 3, France, and
an Adjunct Lecture at the School of Sports Science, Exercise and Health, the University of
Western Australia, 35 Stirling Highway, Crawley, WA 6009, Australia.
E-mail: [email protected]
Kate Lambrechts, PhD student, Université de Bretagne Occidentale, Laboratoire
Optimisation des Régulations Physiologiques (ORPhy), UFR Sciences et Techniques, 6
avenue Le Gorgeu, CS 93837, 29200 Brest Cedex 3, France. E-mail:
Aleksandra Mazur, PhD student, Université de Bretagne Occidentale, Laboratoire
Optimisation des Régulations Physiologiques (ORPhy), UFR Sciences et Techniques, 6
avenue Le Gorgeu, CS 93837, 29200 Brest Cedex 3, France. E-mail : [email protected]
Qiong Wang, PhD student, Université de Bretagne Occidentale, Laboratoire Optimisation des
Régulations Physiologiques (ORPhy), UFR Sciences et Techniques, 6 avenue Le Gorgeu, CS
93837, 29200 Brest Cedex 3, France. E-mail: [email protected]
Virginie Papadopoulou MSci is a PhD candidate of the Department of Bioengineering,
Imperial College London, London, United Kingdom and a research fellow at Haute Ecole
Paul Henri Spaak, Brussels, Belgium
Michael Theron, Director, Université de Bretagne Occidentale, Laboratoire Optimisation des
Régulations Physiologiques (ORPhy), UFR Sciences et Techniques, 6 avenue Le Gorgeu, CS
93837, 29200 Brest Cedex 3, France. E-mail : [email protected]
Costantino Balestra, MSc, PhD; Full-time Professor and Head of the Biophysiology and
Environmental Physiology Lab at the Haute Ecole Paul Henri Spaak (University of Brussels,
Belgium); Vice-President DAN Europe Research & Education; Area Director DAN Europe
Benelux & France. E-mail: [email protected]
François Guerrero, Director, Université de Bretagne Occidentale, Laboratoire Optimisation
des Régulations Physiologiques (ORPhy), UFR Sciences et Techniques, 6 avenue Le Gorgeu,
CS 93837, 29200 Brest Cedex 3, France. E-mail : [email protected]

A ternary model of decompression sickness in the rat
Abstract
Introduction: Decompression sickness (DCS) in the rat is most commonly modelled as a
binary outcome. The present study aimed to develop a ternary model of predicting probability
of DCS in the rat, (as no-DCS, survivable-DCS or death), based upon the
compression/decompression profile and physiological characteristics of each rat.
Methods: A literature search identified dive profiles with outcomes no-DCS, survivable-DCS
or death by DCS. Inclusion criteria were that at least one rat was represented in each DCS
status, not treated with drugs or simulated ascent to altitude, that strain, sex, breathing gases
and compression/decompression profile were described, and that weight was reported. A
dataset was compiled (n=1602 rats) from 15 studies using 22 dive profiles and two strains of
both sexes. Inert gas pressures in five compartments were estimated. Model-fit of the
calibration dataset, using ordinal logistic regression, was optimised by maximum log
likelihood and likelihood ratio test. Two validation datasets (one interpolation, one
extrapolation) assessed model robustness.
Results:
ii
iiii
BubblebMax
MaxFemaleWeightxjDCS
3.166.21.350.43
1.956.42435.1015.0|Pr
Where α1=-25.483, α2=-26.838
In the interpolation dataset the model predicted 10/15 cases of nDCS, 3/3 sDCS and 2/2
dDCS, totalling 15/20 (75% accuracy) and 18.5/20 (92.5%) were within 95% confidence
intervals. Mean weight in the extrapolation dataset was more than 2 SD outside of the
calibration dataset and the probability of each outcome was not predictable.
Discussion: This model is reliable for the prediction of DCS status providing the dive profile
and rat characteristics are within the range of parameters used to optimise the model. The
addition of data with a wider range of parameters should improve the applicability of the
model.
Keywords: Decompression illness, ordinal logistic regression, modelling, marginal
decompression sickness, animal model, trinary outcome
A ternary model of decompression sickness in the rat
Introduction
Animal models offer an alternative to human studies into decompression sickness (DCS) that
is both ethically preferable for speculative research and logistically convenient. Prawns, mice,
rabbits, dogs, goats, pigs and primates have all contributed to mankind’s understanding of
DCS but the leading role in animal model research surely belongs to the laboratory rat, Rattus
norvegicus. Pressure exposures designed to elicit DCS in only a proportion of rats vary in
depth, time at maximum exposure, breathing gas, rates of compression/decompression and
other parameters. Treatments and/or risk factors are then typically evaluated by the degree of
difference in the proportion of animals that are diagnosed with DCS following
decompression.1
DCS in the rat has been variously defined and diagnostic criteria include survival time,2-4
observable signs such as walking difficulties,3, 5-14
paralysis,5-19
rolling in a rotating cage,5-9,
12, 13, 15, 16, 20 twitching/convulsions
5-9, 12, 13, 15, 16 and/or respiratory distress
5-7, 9-11, 13, 14, 17-19.
Objective measures have been proposed, in particular observable or audible bubble grades.10,
21, 22 Only rarely have objective measures been correlated with subjective observer
agreement. Recently a promising grip-score test was found significantly associated (p=0.004)
with observable signs of what was assumed to have been DCS.23
Unexpectedly, based upon
the correlation between loss of grip strength and perceived DCS, Buzzacott et al discovered
the post-decompression probability of any asymptomatic rat having DCS was 0.5. The
precise diagnosis of DCS in the rat, therefore, remains a desirable goal.
In almost all studies to date DCS in the rat has been modelled as the probability of either no-
DCS vs. DCS,9, 12, 15, 16, 24, 25
or as Dead vs. Alive4, 11
. Occasionally both models will be
sequentially used in the same study but without delineating the relative probabilities of each
DCS status.5, 26
To our knowledge, only one study has used ordinal logistic regression for
ternary DCS outcomes in the rat, for an assessment of the effects of ascent rate and post-dive
exercise.27
In this study Pollard and colleagues used ordinal logistic regression to model the
probability p of a DCS outcome state j (either no DCS, survivable DCS or death), given i
independent covariates with respective coefficients β1:n, as
(
) ∑
where α = [α1, α2,… αk] is a vector of intercepts (one less than the number of outcome states).
For k+1 states, the probability of the ith
observation being in state j is given in Equation 2.
=j| {
|
| |
The present study aimed to develop a ternary model of predicting the probability of DCS in
the rat, (as either no DCS, survivable DCS or death), based upon compression/decompression
profile-dependent inert gas compartment pressure estimates, after adjustment for sex, weight
and strain.
Methods
An electronic literature search identified protocols with compression/decompression profiles
that elicited a predictable proportion of DCS greater than 0 but less than 100%. From these,
studies classifying decompression outcomes as no-DCS (nDCS), survivable-DCS (sDCS) or
death by DCS (dDCS) were identified. The inclusion criteria for the rats in each study were
that at least one rat was represented in each DCS classification post-decompression to 1
ATA, that the rats were not treated (or pre-treated) with experimental drugs or exercise (only
control rats were included in our dataset), that the strain, sex, breathing gases (only
oxygen:nitrogen combinations) and compression/decompression profile were described, and
that either individual weights or the group mean with relatively small standard deviation
(<15% of the mean) were reported. Where only one of these parameters was unclear in the
published paper then the original authors were contacted with a request to clarify the missing
detail. Only 100% complete data was accepted into the dataset. As soon as the dataset
contained in excess of 1600 rats then further inputting was curtailed. By this stage the dataset
had been compiled from 15 studies2-4, 7, 10, 13, 17, 18, 20, 22, 28-32
using 22 different dive profiles
and two strains of rat, Sprague-Dawley (n=1421, 89%) and Wistar (n=181, 11%).
Diagnostic criteria for DCS classification was either explicitly stated in each paper (i.e. based
on observed respiratory distress or motor ataxia) or else implied by gas emboli score.4, 22
From the description of each profile, ambient and gas partial pressures in msw at 10 sec
intervals or less were calculated in MS Excel. Using the R package SCUBA, stepwise inert
gas pressures (in ATA) in 17 Bühlmann compartments (ZH-L16A) were estimated from the
MS Excel profiles.33, 34
As rats are thought to saturate in less than 90 mins,6, 26, 35
only
compartments 1-4 (including 1b) with nitrogen half-times of 4.0, 5.0, 8.0, 12.5 and 18.5 mins
respectively were included in the initial model,34
shown in Equation 3. Longer total saturation
times have been proposed but are the exception.36
From the estimated compartment inert gas
pressures two parameters were estimated. For each compartment the maximum positive
difference between compartment inert gas pressure and inspired inert gas pressure (in ATA)
during ascent (Max1-4 : a measure of positive pressure gradient, for off-gassing) and
maximum positive difference between compartment inert gas pressure and ambient pressure
(in ATA) during ascent (Bubble1-4 : a measure of bubble production capacity). Model
optimisation is described below, in Analysis.
iiii
iiiiiii
iiiiiji
BubbleBubbleBubblebBubble
BubbleMaxMaxMaxbMaxMaxExercise
DiveAgeSexStrainWeightxjDCSLogit
4321
143211
)|Pr(
16151413
1211109876
54321
(3)
where DCS was nDCS=0, sDCS=1 and dDCS=2. Weight=the weight in grams, Strain was
either Sprague-Dawley (0) or Wistar (1), Sex was 0 for male and 1 for female, age was in
whole weeks, Dive was the stratification variable for which particular
compression/decompression profile each rat underwent, Exercise was if each rat exercised in
a rotating wheel either during or after the dive, where no exercise=0 and with exercise=1. The
final model was optimised by logistic regression and backwards elimination of least
significant parameters. At n=1602 rats in the calibration dataset, there was an initial mean of
no less than 27 rats per parameter in each of the three outcome status’, nearly triple the
recommended minimum.37
To validate the resultant model for interpolation two control groups (from previous
experiments) of 10 male (age 11 wks, wt 401±18) and 10 female (age 14 wks, wt 266±22)
rats were combined. These 20 rats had been compressed and decompressed according to the
protocol (Figure 1) described by Eftedal, vide infra.22
This profile, but not these rats, was
included in the calibration dataset. To validate the resultant model for extrapolation 119
control rats from four previous experiments (109 male and 10 female) were combined into a
single dataset, including 20 Wistar (wt 384±15) and 99 Sprague-Dawley (wt 428±60), age
10-13 wks.
All rats in the validation datasets were obtained from Janvier SAS (Le Genest St Isle, France)
at age 10 weeks. The rats were housed for at least one week in the University vivarium in
standard conditions, (mean temperature 21.2°C +/- 0.2 SD, relative humidity 27% +/- 16%
SD, 12 hour light:dark cycle), during which they had access to rat chow and water ad libitum.
The rats were weighed on the day of diving and then compressed in a 170-litre Comex
hyperbaric chamber in groups of up to seven at a time. All dives commenced in the morning
after 8am.
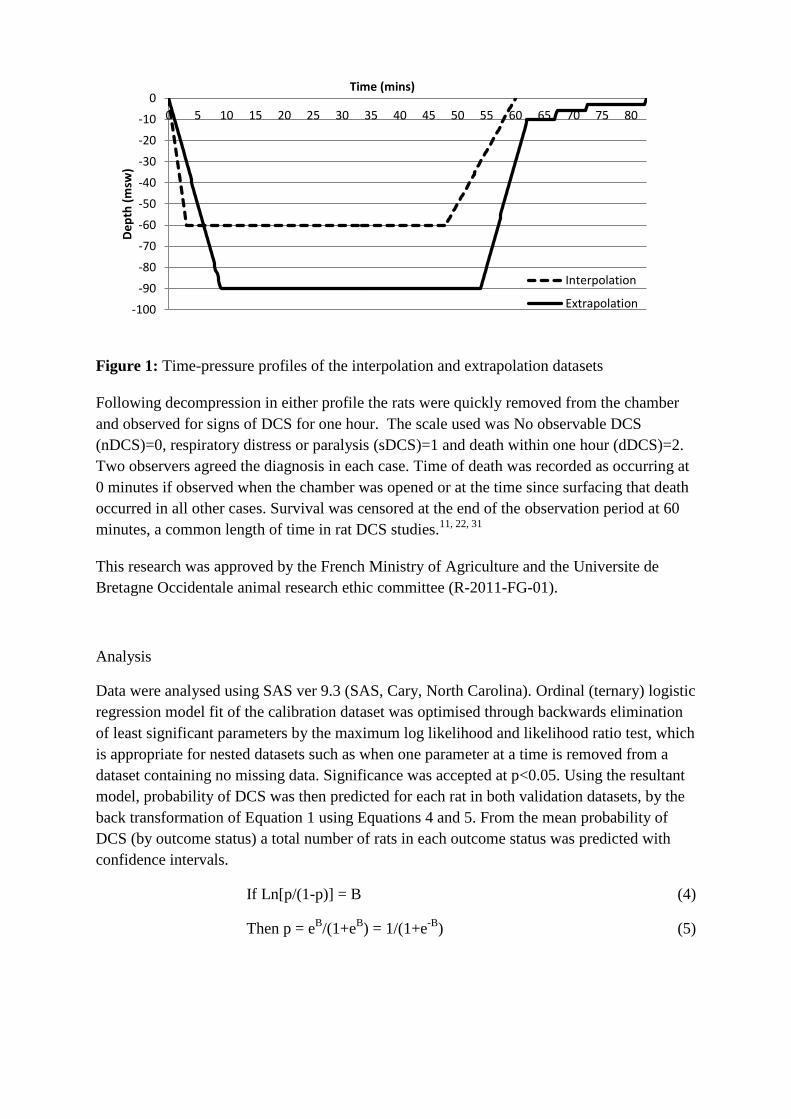
For the interpolation profile, compression with air occurred at the rate of 2 ATA.min-1
to a
pressure of 7 ATA (60 msw) and maintained for 45 mins. At the end of the exposure period
these rats were decompressed linearly to the surface at a rate of -0.5 ATA.min-1
. Total
duration of the hyperbaric exposure was 60 mins. For the extrapolation profile, compression
using air to 10 ATA (90 msw) occurred at the rate of 1 ATA.min-1
. Maximum pressure was
maintained for 45 mins followed by decompression at -1 ATA.min-1
to 2 ATA (10 msw).
Decompression was thereafter staged with five mins at 2 ATA, five mins at 1.60 ATA (6
msw) and 10 mins at 1.3 ATA (3 msw)(Figure 1). Total hyperbaric exposure for the
extrapolation dataset was 83 mins. Both these protocols have been shown to produce DCS
signs in a predictable proportion of male and female Sprague-Dawley and Wistar rats aged
10-13 weeks.1, 23, 38
-100
-90
-80
-70
-60
-50
-40
-30
-20
-10
0
0 5 10 15 20 25 30 35 40 45 50 55 60 65 70 75 80D
ep
th (
msw
)
Time (mins)
Interpolation
Extrapolation
Figure 1: Time-pressure profiles of the interpolation and extrapolation datasets
Following decompression in either profile the rats were quickly removed from the chamber
and observed for signs of DCS for one hour. The scale used was No observable DCS
(nDCS)=0, respiratory distress or paralysis (sDCS)=1 and death within one hour (dDCS)=2.
Two observers agreed the diagnosis in each case. Time of death was recorded as occurring at
0 minutes if observed when the chamber was opened or at the time since surfacing that death
occurred in all other cases. Survival was censored at the end of the observation period at 60
minutes, a common length of time in rat DCS studies.11, 22, 31
This research was approved by the French Ministry of Agriculture and the Universite de
Bretagne Occidentale animal research ethic committee (R-2011-FG-01).
Analysis
Data were analysed using SAS ver 9.3 (SAS, Cary, North Carolina). Ordinal (ternary) logistic
regression model fit of the calibration dataset was optimised through backwards elimination
of least significant parameters by the maximum log likelihood and likelihood ratio test, which
is appropriate for nested datasets such as when one parameter at a time is removed from a
dataset containing no missing data. Significance was accepted at p<0.05. Using the resultant
model, probability of DCS was then predicted for each rat in both validation datasets, by the
back transformation of Equation 1 using Equations 4 and 5. From the mean probability of
DCS (by outcome status) a total number of rats in each outcome status was predicted with
confidence intervals.
If Ln[p/(1-p)] = B (4)
Then p = eB/(1+e
B) = 1/(1+e
-B) (5)
Results
Following the elimination of non-significant parameters, the resultant model is shown in
Equation 6.
ii
iiii
BubblebMax
MaxFemaleWeightxjDCSLogit
3..166.21.350.43
1.956.42435.1015.0)|Pr(
(6)
Where α1=-25.483, α2=-26.838
Adjusted odds ratios with confidence limits and p-values are given for the retained
parameters in Table 1.
Table 1: Adjusted odds ratios with confidence intervals and p-values for the parameters
retained in the final model
Odds Ratio 95% CI P-value
Weight (g) 1.02 1.01, 1.02 <0.0001
Female 17.6 6.5, 47.7 <0.0001
Max1 (ATA) <0.01 <0.01, 0.04 0.03
Max1b (ATA) >999 35.0, >999 0.03
Bubble3 (ATA) 8.73 5.24, 14.5 <0.0001
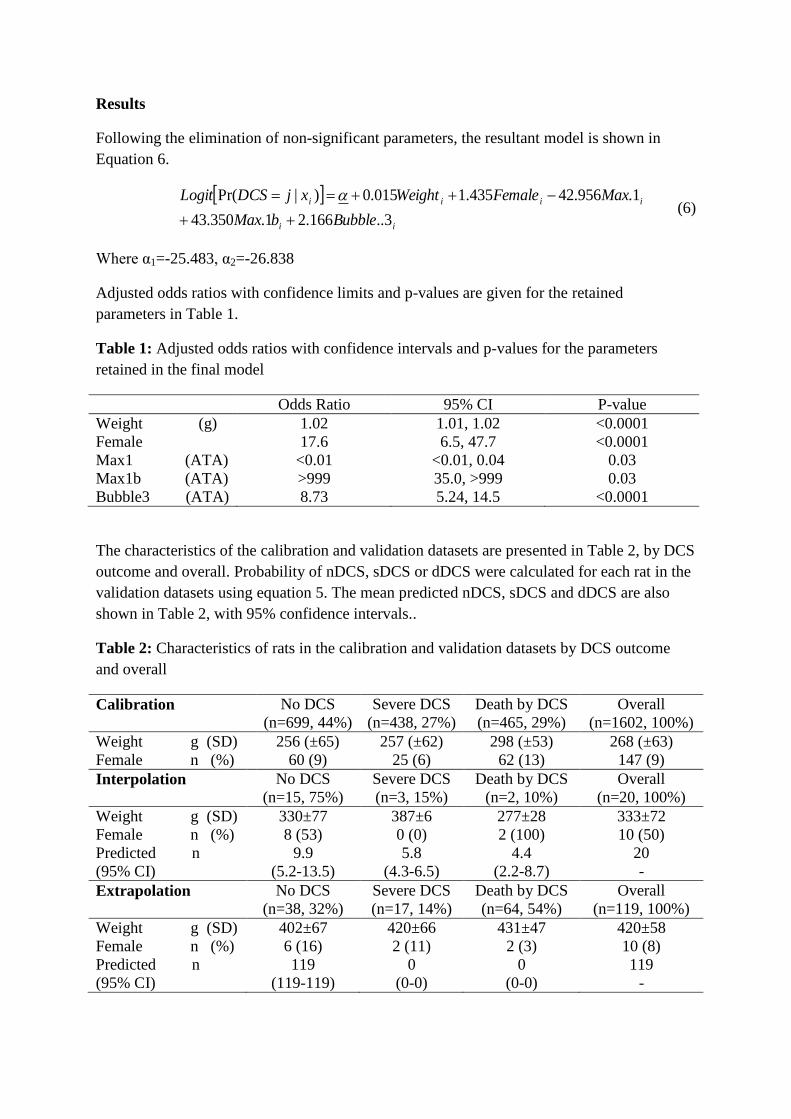
The characteristics of the calibration and validation datasets are presented in Table 2, by DCS
outcome and overall. Probability of nDCS, sDCS or dDCS were calculated for each rat in the
validation datasets using equation 5. The mean predicted nDCS, sDCS and dDCS are also
shown in Table 2, with 95% confidence intervals..
Table 2: Characteristics of rats in the calibration and validation datasets by DCS outcome
and overall
Calibration No DCS
(n=699, 44%)
Severe DCS
(n=438, 27%)
Death by DCS
(n=465, 29%)
Overall
(n=1602, 100%)
Weight g (SD) 256 (±65) 257 (±62) 298 (±53) 268 (±63)
Female n (%) 60 (9) 25 (6) 62 (13) 147 (9)
Interpolation No DCS
(n=15, 75%)
Severe DCS
(n=3, 15%)
Death by DCS
(n=2, 10%)
Overall
(n=20, 100%)
Weight g (SD) 330±77 387±6 277±28 333±72
Female n (%) 8 (53) 0 (0) 2 (100) 10 (50)
Predicted n
(95% CI)
9.9
(5.2-13.5)
5.8
(4.3-6.5)
4.4
(2.2-8.7)
20
-
Extrapolation No DCS
(n=38, 32%)
Severe DCS
(n=17, 14%)
Death by DCS
(n=64, 54%)
Overall
(n=119, 100%)
Weight g (SD) 402±67 420±66 431±47 420±58
Female n (%) 6 (16) 2 (11) 2 (3) 10 (8)
Predicted n
(95% CI)
119
(119-119)
0
(0-0)
0
(0-0)
119
-
The predicted outcomes in Table 2 indicate that for the interpolation validation dataset the
model predicted 9.9/15 cases of nDCS, 3/3 sDCS and 2/2 dDCS, totalling 14.9/20 (75%
accuracy) and 13.5/15 nDCS, 3/3 sDCS and 2/2 dDCS (18.5/20, 92.5%) were within 95%
confidence intervals. The model over-predicted male DCS. The extrapolation dataset did not
allow prediction of DCS (Table 2) and all rats were predicted in the nDCS outcome. Table 3
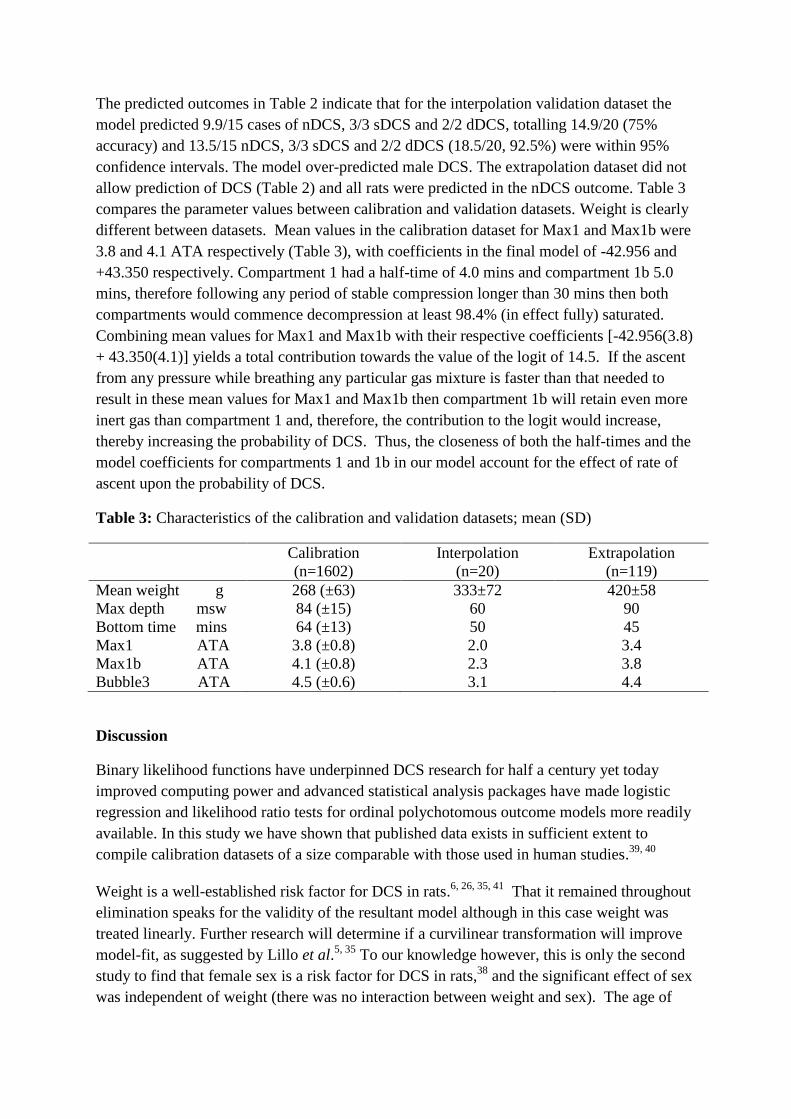
compares the parameter values between calibration and validation datasets. Weight is clearly
different between datasets. Mean values in the calibration dataset for Max1 and Max1b were
3.8 and 4.1 ATA respectively (Table 3), with coefficients in the final model of -42.956 and
+43.350 respectively. Compartment 1 had a half-time of 4.0 mins and compartment 1b 5.0
mins, therefore following any period of stable compression longer than 30 mins then both
compartments would commence decompression at least 98.4% (in effect fully) saturated.
Combining mean values for Max1 and Max1b with their respective coefficients [-42.956(3.8)
+ 43.350(4.1)] yields a total contribution towards the value of the logit of 14.5. If the ascent
from any pressure while breathing any particular gas mixture is faster than that needed to
result in these mean values for Max1 and Max1b then compartment 1b will retain even more
inert gas than compartment 1 and, therefore, the contribution to the logit would increase,
thereby increasing the probability of DCS. Thus, the closeness of both the half-times and the
model coefficients for compartments 1 and 1b in our model account for the effect of rate of
ascent upon the probability of DCS.
Table 3: Characteristics of the calibration and validation datasets; mean (SD)
Calibration
(n=1602)
Interpolation
(n=20)
Extrapolation
(n=119)
Mean weight g 268 (±63) 333±72 420±58
Max depth msw 84 (±15) 60 90
Bottom time mins 64 (±13) 50 45
Max1 ATA 3.8 (±0.8) 2.0 3.4
Max1b ATA 4.1 (±0.8) 2.3 3.8
Bubble3 ATA 4.5 (±0.6) 3.1 4.4
Discussion
Binary likelihood functions have underpinned DCS research for half a century yet today
improved computing power and advanced statistical analysis packages have made logistic
regression and likelihood ratio tests for ordinal polychotomous outcome models more readily
available. In this study we have shown that published data exists in sufficient extent to
compile calibration datasets of a size comparable with those used in human studies.39, 40
Weight is a well-established risk factor for DCS in rats.6, 26, 35, 41
That it remained throughout
elimination speaks for the validity of the resultant model although in this case weight was
treated linearly. Further research will determine if a curvilinear transformation will improve
model-fit, as suggested by Lillo et al.5, 35
To our knowledge however, this is only the second
study to find that female sex is a risk factor for DCS in rats,38
and the significant effect of sex
was independent of weight (there was no interaction between weight and sex). The age of
our female rats in the calibration dataset was at the time they reached sexual maturity. A
study on humans investigating the influence of sex on the outcome of altitude DCS did not
find significant differences.42
However women using hormonal contraception showed
significantly greater susceptibility to DCS than those not using hormonal contraception
during the latter two weeks of the menstrual cycle, implicating the hormonal system’s
influence.
Max1 and Max1b differ to Bubble1 and Bubble1b in that they focus on the off-gassing
diffusion rate in well-perfused tissues (half-times of 4.0 and 5.0 respectively). They are the
fastest tissues to off-gas during ascent. Max1 and Max1b are close to each other in effect size,
but their interaction was not significant, suggesting their inclusion as separate parameters
accounts for the rate of ascent, which is a known risk factor for DCS. The difference between
them increases with ascent rate which, thus, increases the probability of DCS. This is well
known in diving while the precise effect diffusion rate exerts upon cell membrane integrity
remains the focus of some experimental research effort in our laboratory. Early results
suggest that, in future improvements to the rat model described here, Max1 and Max1b may
be replaced with alternate related parameters, for example inspired oxygen partial pressures.
Both their ORs and P-values (Table 1) render Max1 and Max1b tentative in our current
model.
The Bubble parameters were estimated by subtracting the ambient pressure at any time
during ascent from the estimated pressure in each compartment to yield a raw supersaturation
pressure in ATA. That Bubble3 was also significant, given that compartment 3’s half-time is
12.5 mins, suggests that compartments in the rat that do not off-gas so swiftly are more likely
to produce bubbles. Once again, this is logical and also neatly in keeping with previous
research which identified the time for saturation in the rat as one hour.6 In a compartment
with 12.5 mins halftime, 98.4% saturation would occur in 75 mins. Compartment 4, with a
halftime of 18.5 mins, would be 98.4% saturated after 111 mins and Bubble4 was eliminated
from the model as not significant. Future research will utilise a custom vector of
compartment halftimes from 1.0 mins to 18.0 mins in 1 min increments. No doubt this will
further improve model-fit.
Sprague-Dawley and Wistar were not significantly different to each other in their resistance
to DCS, in either the calibration or extrapolation validation datasets. Furthermore, we
experimentally confirmed that DCS incidence in this compression/decompression profile
elicited similar incidence of DCS between Wistar and Sprague-Dawely.23
This should be
reassuring to the scientific community who rely on previous research utilising either one
strain or the other. That exercise was not significant may be explained by the inclusion
criteria that at least one rat must be represented in each outcome state. Accordingly, studies in
which the rats exercised used compression/decompression profiles calibrated to produce a
proportion of DCS in each category, often empirically. Future research might more
specifically investigate models that include exercise, compared with those that do not, to
elucidate more precisely the effect of exercise during DCS research involving rats. Exercise
may affect tissues with different half-times to protocols with no exercise but this has not yet
been shown and would be of interest. No doubt the timing of exercise is also critical as
during maximum compression exercise would increase inert gas uptake and during
decompression exercise would increase inert gas washout. This may be another reason
Exercise was not found to be significant, because we did not delineate between pre- and post-
decompression and hence these opposites cancelled each other out. That DCS differs between
the sexes confounds much previous research on exercise and DCS. Appropriate weighting of
survivable DCS also requires further work to optimise both maximum log likelihood and the
R2, and exercise may well play a role in this. If sDCS is eventually optimally weighted
anywhere between 0.0 (nDCS) and 2.0 (dDCS) then the superiority of ternary DCS
classification over either typical binary model will be demonstrated.
As with any meta-analysis the protocols and classification differences between experiments
included in this study will have introduced a bias that could prove significant. Including a
stratification variable for compression/decompression profile (Dive) somewhat adjusted for
that bias, though probably not completely. The number of studies and the size of the
calibration dataset is however a potential advantage in the face of this. Future research will
calibrate models with even larger datasets containing a wider range of both parameters and
parameter values. With an R2 of 0.18 this model has plenty of room for improvement,
confirmed by the extrapolation dataset, and considerably increasing the size of the calibration
dataset is a current priority.
Table 3 indicates that the extrapolation profile had compartment pressure parameters that
were closer to mean values for the calibration dataset than those of the interpolation profile.
All else being equal it is clear the rats in this extrapolation dataset had a mean weight more
than two standard deviations heavier than the mean weight of the animals in the calibration
dataset. This may explain, at least in part, the inability of the model to predict DCS in the
extrapolation dataset. Nonetheless, significance of the independent variables Weight, Sex and
Bubble3 (p<0.0001) suggest their effect upon the risk of DCS is far from negligible. That the
model predicted 75% of observer diagnoses in the interpolation validation dataset (92.5%
within 95% CI) also demonstrates a solid foundation upon which to build improved
goodness-of-fit. The chi-square test for the proportional odds assumption was significant
suggesting that the null hypothesis of unequal independent parameter coefficients may be true
although the SAS handbook does suggest that the null is rejected more often than it should,
particularly with large datasets containing many variables, as was the case in this study. To
accept the null hypothesis in this study would imply that death was by a cause other than
DCS, or that diagnosed DCS was not associated with those factors in our model, (which have
now been experimentally confirmed). Again, an appropriate weighting for sDCS may have an
appreciable effect upon this test. Overall, the relationship between DCS and weight, sex and
strain have all been experimentally confirmed in our laboratory,23, 38
and the relationship
between DCS and Max1, Max1b and Bubble3 are in accord with what is known of DCS,
namely that ascent rate and supersaturation are key factors, and that saturation in the rat
occurs at around 60-90 mins.
Ternary classification of DCS could potentially add power to modelling research and
continued development in predictive accuracy is leading towards to the identification of
associated parameters which, in turn, may assist mankind identify potential mechanisms of
this arcane disease. Our model is reliable for the prediction of DCS status providing the dive
profile and rat characteristics are within the range of parameters used to optimise the model.
The addition of further profiles and rats of wider physiological variety will likely improve the
robustness of the model.
Acknowledgements
The authors thank Jean-Eric Blatteau, Frans Cronje, Ingrid Eftadel and Wiegang Xu for
supplying additional data to that published, and Adrian Baddeley for his assisitance with the
package SCUBA. The research leading to these results has received funding from the People
Programme (Marie Curie Actions) of the European Union's Seventh Framework Programme
FRP/2007-2013/ under REA grant agreement n° 264816.
References
1. Mazur A, Lambrechts K, Buzzacott P, Wang Q, Belhomme M, Theron M, et al. Influence of Decompression Sickness on Vasomotion of Isolated Rat Vessels. International Journal of Sports Medicine. 2014;35:551-58. 2. Abbate A, Kusmic C, Matteucci M, Pelosi G, Navari A, Pagliazzo A, et al. Gas embolization of the liver in a rat model of rapid decompression. Am J Physiol Regul Integr Comp Physiol. 2010;299:R673-R82. 3. Bennett PB, Hayward AJ. Relative decompression sickness hazards in rats of neon and other inert gases. Aerospace Med. 1968:301-2. 4. Bondi M, Cavaggioni A, Gasperetti A, Rubini A. A new method of measure of bubble gas volume shows that interleukin-6 injected into rats has no effect on gas embolism. Undersea & Hyperbaric Medicine. 2009;36(2):103-15. 5. Lillo RS, Flynn ET, Homer LD. Decompression outcome following saturation dives with multiple inert gases in rats. Journal of Applied Physiology. 1985;59(5):1503-14. 6. Lillo RS, Himm JF, Weathersby PK, Temple DJ, Gault KA, Dromsky DM. Using animal data to improve prediction of human decompression risk following air-saturation dives. Journal of Applied Physiology. 2002;93(1):216-26. 7. Arieli R, Boaron E, Abramovich A. Combined effect of denucleation and denitrogenation on the risk of decompression sickness in rats. Journal of Applied Physiology. [Research Support, Non-U.S. Gov't]. 2009;106(4):1453-8. 8. Berghage TE, Gomez JA, Roa CE, Everson TR. Pressure-reduction limits for rats following steady-state exposures between 6 and 60 ATA. Undersea Biomed Res. 1976 Sep;3(3):261-71. 9. Bigley NJ, Perymon H, Bowman GC, Hull BE, Stills HF, Henderson RA. Inflammatory cytokines and cell adhesion molecules in a rat model of decompression sickness. Journal of Interferon & Cytokine Research. [Research Support, Non-U.S. Gov't]. 2008;28(2):55-63. 10. Blatteau J, Brubakk AO, Gempp E, Castagna O, Risso J. Sidenafil pre-treatment promotes decompression sickness in rats. PLOSone. 2013;8(4). 11. Bondi M, Cavaggioni A, Michieli P, Schiavon M, Travain G. Delayed effect of nitric oxide synthase inhibition on the survival of rats after acute decompression. Undersea and Hyperbaric Medicine. 2005;32(2):121-8. 12. Lillo RS, Parker EC. Mixed-gas model for predicting decompression sickness in rats. Journal of Applied Physiology. 2000;89(6):2107-16.
13. Fan DF, Liu K, Xu WG, Zhang RJ, Liu Y, Kang ZM, et al. Hyperbaric oxygen preconditioning reduces the incidence of decompression sickness in rats via nitric oxide. Undersea and Hyperbaric Medicine. 2010;37(3):173-80. 14. Freeman DJ, Philp RB. Changes in blood enzyme activity and hematology of rats with decompression sickness. Aviation Space and Environmental Medicine. 1976;47(9):945-49. 15. Berghage TE, Goehring GS, Donelson Ct. Pressure reduction limits for rats subjected to various time/pressure exposures. Undersea Biomed Res. 1978 Dec;5(4):323-34. 16. Berghage TE, McCracken TM. Use of oxygen for optimizing decompression. Undersea Biomed Res. 1979 Sep;6(3):231-9. 17. Ersson A, Linder C, Ohlsson K, Ekholm A. Cytokine response after acute hyperbaric exposure in the rat. Undersea and Hyperbaric Medicine. 1998 Winter;25(4):217-21. 18. Frattali V, Quesada M, Robertson R. Interdependence of decompression sickness and plasma enzymes on dive profile and vitamin B-6 status. Aviat Space Environ Med. 1977;48(1):29-32. 19. Frattali V, Quesada M, Robertson R. Supportive evidence for altered platelet function in the dived rat. Undersea Biomed Res. 1975 Sep;2(3):167-72. 20. Broome JR, Pearson RR, Dutka AJ. Failure to prevent decompression illness in rats by pretreatment with a soluble complement receptor. Undersea & hyperbaric medicine : journal of the Undersea and Hyperbaric Medical Society, Inc. 1994 Sep;21(3):287-95. 21. Loset A, Jr., Mollerlokken A, Berge V, Wisloff U, Brubakk AO. Post-dive bubble formation in rats: effects of exercise 24 h ahead repeated 30 min before the dive. Aviation Space and Environmental Medicine. 2006;77(9):905-8. 22. Eftedal I, Jorgensen A, Rosbjorgen R, Flatberg A, Brubakk AO. Early genetic responses in rat vascular tissue after simulated diving. Physiological Genomics. 2012;44:1201-7. 23. Buzzacott P, Mazur A, Wang Q, Lambrechts K, Theron M, Mansourati J, et al. A new measure of decompression sickness in the rat. BioMed Research International. 2014;Vol. 2014, Article ID 123581, 6 pages, 2014. doi:10.1155/2014/123581. 24. Berghage TE, Donelson Ct, Gomez JA. Decompression advantages of trimix. Undersea Biomed Res. 1978 Sep;5(3):233-42. 25. Caviness JA. [Masters Degree thesis] Stress biomarkers in a rat model of decompression sickness: Uniformed Services University of the Health Sciences; 2005. 26. Lillo RS, MacCallum ME. Decompression comparison of N2 and O2 in rats. Undersea Biomed Res. 1991 Jul;18(4):317-31. 27. Pollard GW, Marsh PL, Fife CE, Smith LR, Vann RD. Ascent rate, post-dive exercise, and decompression sickness in the rat. Undersea & hyperbaric medicine : journal of the Undersea and Hyperbaric Medical Society, Inc. 1995 Dec;22(4):367-76. 28. Katsenelson K, Arieli Y, Abramovich A, Feinsod M, Arieli R. Hyperbaric oxygen pretreatment reduces the incidence of decompression sickness in rats. European Journal of Applied Physiology. [Research Support, Non-U.S. Gov't]. 2007;101(5):571-6. 29. Cronje FJ, Meintjes WAJ, Bennett PB, Fitchat S, Marroni A, Hyldegaard O. Analysis of clinical outcomes of linear vs. deep stop decompression from 3.5 to 6 atmospheres absolute (350 - 600 kpa) in awake rats. Undersea & Hyperbaric Medicine. [Evaluation Studies]. 2011 Jan-Feb;38(1):41-8. 30. Ni X-X, Ni M, Fan D-F, Sun Q, Kang Z-M, Cai Z-Y, et al. Heat-shock protein 70 is involved in hyperbaric oxygen preconditioning on decompression sickness in rats. Experimental Biology & Medicine. [Research Support, Non-U.S. Gov't]. 2013 Jan 1;238(1):12-22. 31. Sallee T, Adams GM. Symptamology of decompression sickness in male Sprague-Dawley rats. Aerospace medicine. 1970;41(12):1358-61. 32. Zhang RJ, Mao HD, Fan DF, Kang ZM, Liu Y, Cai ZY, et al. Protective effects of intravenous perflurocarbon on decompression sickness models in rats. Chinese Journal of Nautical Medicine and Hyperbaric Medicine. 2010;17(3):129-32. 33. Baddeley A. The scuba package for the R system. Perth, WA: Available at cran.r-project.org/web/packages/scuba; 2011.
34. Bühlmann AA. Tauchmedizin. Berlin: Springer-Verlag; 1995. 35. Lillo RS. Effect of N2-He-O2 on decompression outcome in rats after variable time-at-depth dives. Journal of Applied Physiology. [Research Support, U.S. Gov't, Non-P.H.S.]. 1988;64(5):2042-52. 36. Berghage TE, David TD, Dyson CV. Species differences in decompression. Undersea Biomed Res. 1979 Mar;6(1):1-13. 37. Stolzfus JC. Logistic regression: A brief primer. Academic Emergency Medicine. 2011;18(10):1099-104. 38. Mazur A, Buzzacott P, Lambrechts K, Wang Q, Belhomme M, Theron M, et al. Different effect of L-NAME treatment on susceptibility to decompression sickness in male and female rats. Applied Physiology, Nutrition, and Metabolism.(doi: 10.1139/apnm-2014-0148). 39. Gerth WA, Vann RD. Probabilistic gas and bubble dynamics models of decompression sickness occurrence in air and nitrogen-oxygen diving. Undersea & hyperbaric medicine : journal of the Undersea and Hyperbaric Medical Society, Inc. 1997 Winter;24(4):275-92. 40. Howle LE, Weber PW, Vann RD. A computationally advantageous system for fitting probabilistic decompression models to empirical data. Computers in Biology and Medicine. 2009;39:1117-29. 41. Philp RB, Gowdey CW. Experimental analysis of the relation between body fat and susceptability to decompression sickness. Aerospace Medicine. 1964(April):351-6. 42. Webb JT, Kannan N, Pilmanis AA. Gender not a factor for altitude decompression sickness risk. Aviation, space, and environmental medicine. 2003 Jan;74(1):2-10.