Embed Size (px)
Citation preview

Journal of Anthropological Archaeology 35 (2014) 23–31
Contents lists available at ScienceDirect
Journal of Anthropological Archaeology
journal homepage: www.elsevier .com/ locate/ jaa
A tale of two technologies: Prehistoric diffusion of pottery innovationsamong hunter-gatherers
http://dx.doi.org/10.1016/j.jaa.2014.04.0060278-4165/� 2014 Elsevier Inc. All rights reserved.
⇑ Corresponding author.E-mail address: [email protected] (J.W. Eerkens).
Jelmer W. Eerkens a,⇑, Carl P. Lipo b
a University of California, Davis, United Statesb California State University, Long Beach, United States
a r t i c l e i n f o a b s t r a c t
Article history:Received 30 November 2012Revision received 11 April 2014
Keywords:Diffusion of innovationPotteryCaliforniaBrownwareHunter-gatherersLuminescence dating
We examine the diffusion of a successful and an unsuccessful innovation among hunter-gatherers in thewestern Great Basin, using a diffusion of innovation model. Modern and historical studies on the diffusionof innovations suggest that diffusion processes follow S-shaped curves, with small numbers of earlyadopters, followed by more rapid uptick in the rate of diffusion as the majority adopt a technology, con-cluding again with small numbers of late-adopting laggards. Distributions of luminescence dates on sur-face-collected pottery sherds show that the technology had a long period of experimentation. Beginningabout AD 1000, direct-rimmed pots were introduced in Southern Owens Valley and were used in smallnumbers over hundreds of years. Likewise, around AD 1350 pots with recurved rims were introducedin Death Valley and were also used in small numbers. Around AD 1550 the direct-rimmed technology dif-fused to the east, to China Lake and Death Valley, where it was rapidly adopted. By contrast, recurved-rimtechnologies were abandoned, a failed innovation. Our data suggest that prehistoric pottery diffusionsfollow a similar S-shaped curve, but that diffusion among hunter-gatherers happens at a much slowerrate, over centuries instead of decades.
� 2014 Elsevier Inc. All rights reserved.
Introduction
One of the key components of human technology is informa-tion, and the means by which such information spreads amongpotential users. Anthropologists, especially archaeologists, havelong made variation in technology a major focus of research. Thearchaeological record documents a remarkable and diverse rangeof technologies over time and across space. It is clear that technol-ogy, much more so than human biology, has been the major forcein the spread of humans across the globe, promoting occupation ofeven the harshest of arctic, desert, and high altitude environments.
One long-standing pursuit of archaeologists is the identificationof the oldest instance of a particular technology (e.g., Kuttruff et al.,1998; Pinhasi et al., 2010) since it is assumed that these eventsmark important inventions in human evolution (e.g., oldest fire,oldest tools) and their recognition contributes to national pride(e.g., oldest noodle). However, documenting the oldest often erro-neously treats technological innovation as a single instance ofhuman ingenuity (i.e., the ‘‘solitary genius’’), rather than placingtechnology in a broader evolutionary context. A similar argumentcan be made regarding the youngest, or last, instance of a
technology (i.e., its extinction). As Basalla (1988) has argued,changes in technology are contingent since technological innova-tion continually borrows ideas and materials from other domains.The evolution of technologies, then, focuses on issues such as thetechnological environment and context of innovation, recombina-tion and inheritance, the production and winnowing of technolog-ical variation, and rates of technological change (Henrich, 2001).
Such an approach is common among scholars of contemporarytechnology and it is not unusual to find ideas from the diffusionof innovation integrated into research (e.g., Hargadon, 2003;Henrich, 2001, 2009; Kameda and Nakanishi, 2002; Mesoudi andWhiten, 2008; Moore, 1991; Rogers, 2003; Wejnert, 2002). Archae-ology, in contrast, has labored in isolation with its own limited andindiosyncratic language (e.g., Sackett, 1986; Schiiffer, 2002, 2005a,2005b, 2008). Due to its general common-sense based treatment oftechnology, the diffusion of this body of scholarship into archaeo-logical research has been slow, despite the suitability of archaeolog-ical data for contributing to hypothesis testing and theory building.
Diffusion of innovations
Research on the diffusion of technologies in contemporary andhistorical settings suggests that technologies are adopted within
24 J.W. Eerkens, C.P. Lipo / Journal of Anthropological Archaeology 35 (2014) 23–31
communities in a predictable manner (Rogers, 2003). A commu-nity, here, refers to a set of individuals who regularly interact withone another. It is assumed that the members of a communityacquire traits with a distribution of probabilities. Individuals whoare never exposed to a technology have zero chance of adoptingit (unless they independently invent it, see below), while increas-ing exposure increases the probability of adoption. The absoluteprobability for any individual is related to a host of factors dis-cussed further below. As a result, individuals of a communityrarely adopt new technologies in a simultaneous fashion (Moore,1991; Rogers, 2003). Instead, technological change occurs over aperiod of time by individuals with different goals and needs.
Although individuals within a community may be aware of andexposed to a new technology at the same time, some are more aptto try it out. A fraction of those may then decide to adopt the tech-nology, either adding it to the suite of items they already use orreplacing an existing technology with the new one. Such individu-als are often termed ‘‘early adopters’’ or ‘‘innovators’’ (Rogers,2003). Ethnographic studies characterize early adopters as ventur-ous (i.e., not risk averse) and readily able to integrate novel and/orcomplex technical knowledge (Moore, 1991). These early adoptersand innovators also play an important role in the subsequentspread of a technology within a community.
Others within the community, the ‘‘majority,’’ only acquiretraits from adopters in a secondary fashion. Although these indi-viduals delay potential benefits of adopting a new technology, theyalso minimize risk by viewing the success and failure of earlyadopters. Observing early adopters using a new technology pro-vides additional information regarding social and economicimpacts of new technology, thus reducing the costs of trial-and-error use. Finally, some individuals within a community,‘‘laggards,’’ will only reluctantly, or never, adopt a new technology,preferring long-standing solutions to meet their technologicalneeds. These individuals are often suspicious of innovation andchange agents and have a strong connection to traditional means.Typically, they are unable to buffer against the possible risks offailure if they were to adopt a new technology (e.g., Martinezet al., 1998; Uhl et al., 1970; though see Goldenberg and Oreg,2007 for a different interpretation of laggards).
Any single community is composed of a mixed population ofattitudes towards innovation adoption at any point in time. Thecombination of innovators, early adopters, majority, and laggardswithin a community helps explain the way a technology changesand diffuses, but this structure is a dependent value and does not‘‘cause’’ an adoption pattern per se. Thus, with time arrayed onthe x-axis and the cumulative number of adopters on the y-axis,we can generate an ‘‘adoption curve’’ for a given technology in acommunity, generating a characteristic logistic or S-shaped distri-bution of values over time. The slope of the curve varies as a func-tion of cost and performance of the technology relative to thestructure of the local environment and communities. The steeperthe leading edge of the slope, the more rapidly that diffusion tookplace. While the speed at which a technology is adopted has beenshown to vary (e.g., Fischer et al., 1996; Mansfield, 1961) the basicshape of the adoption curve has been replicated in study afterstudy (Brown and Cox, 1971; see also examples in Rogers, 2003).Indeed, the regularity of this finding in modern and historical stud-ies has led some to suggest that this basic process explains config-uration of all diffusions of innovation (Mahajan and Peterson,1985:8).
Determinants for the speed of diffusion can be divided intothree broad dimensions. The first dimension is composed of theproperties of the technology relative to alternatives. These proper-ties include its relative performance advantage, cost, indirect ben-efits (economic, or convenience), compatibility (especially withvalues of a community and other existing technologies),
complexity (highly complex technologies are less likely to beadopted), trialability, rate of beneficial returns (the faster the per-ceived return, the more likely a technology will be adopted), andobservability (technologies that are easier to observe are morequickly adopted). The second dimension relates to the social andtechnological environment in which the technology interacts. Thisdimension includes how well an existing, competing technology isembedded within and/or interdependent with other parts of cul-ture (the greater the number of interdependencies the lower theprobability of adoption of a new technology) and the structure ofthe community, that is, whether individuals are alike (homophil-ous) or different (heterophilous) in their language and morals(more alike increases the probability). The third dimension con-cerns transmission of information within a community. Thisincludes how individuals learn about a new technology (mode ofcommunication; e.g., mass media vs. interpersonal, the formeraccelerating the rate of adoption) and how isolated a communityand individuals within a community are from potential outsidesources of innovation (communities on islands are often slowerto adopt).
Together these dimensions explain why communities see rapidadoption of some technologies (e.g., mobile phone), while othershave been slow to diffuse (e.g., electric vehicles), require state-levelmandates (e.g., seat belts), or are not adopted at all (e.g., DVORAKkeyboards) despite being generally perceived as ‘‘good’’ or ‘‘advan-tageous.’’ Indeed, even ‘‘bad’’ or ‘‘useless’’ technologies, such as petrocks, cigarette smoking, and the Windows operating system canbe adopted by a majority of individuals within a community whencosts are either negligible or difficult to assess over the lifetime ofany individual, or are dependent on part of a contingent technolog-ical ecosystem.
Archaeological applications of diffusion of innovations research
Archaeological data are unlike historic and modern studies onthe diffusion of innovations in two main ways. First, while archae-ologists try to date artifacts as best as they can, the temporal res-olution of most dating techniques, including luminescence datingof pot sherds used below, is at an altogether different scale thanmodern studies. For example, luminescence dates are associatedwith the measurement of events with a precision of roughly 10%of the absolute value in years. Thus, even in late prehistory, archae-ological events have a degree of uncertainty measured in decades(for example, our average below is ±25.9 years, ranging between8 and 160 years, for 167 luminescence dates). By contrast, modernethnographic studies regarding the diffusion of modern innova-tions have error terms on the scale of months or weeks.
On the one hand, this difference may seem to put measure-ments of the archaeological record beyond the scale at which wecan examine the diffusion of a technology. With such an uncer-tainty it is difficult to isolate individual events of technology adop-tion. In contemporary studies one may observe examples oftechnology diffusing through a community, often in a decade orless. Such examples suggest that archaeological descriptions maynot provide good material for the study of prehistoric diffusions:our archaeological data may be at such a coarse scale that we can-not effectively observe and track a diffusion event. If so, a diffusionevent will appear as a flash, with little evidence for ‘‘innovators,’’‘‘early adopters,’’ ‘‘laggards,’’ and the like.
On the other hand, there is reason to believe that prehistoricdiffusions occurred over longer periods of time. In the historicand modern cases, mass communication (e.g., radio, television),rapid transportation (e.g., automobiles, trains), and a greaterdegree of interconnectedness of people within communities rap-idly spread information and knowledge about a technology over
J.W. Eerkens, C.P. Lipo / Journal of Anthropological Archaeology 35 (2014) 23–31 25
a large spatial area. Moreover, corporate capitalistic goals, wheremanufacturing companies are encouraged by profit to spread theirtechnology within as many communities as possible (using adver-tising and other means), also accelerate diffusion curves. The scaleof populations who share language also contributes to more rapidtechnology changes in the contemporary world. Thus, diffusions inhistoric and modern settings are typically within more homophil-ous populations where people speak a single language and sharesimilar cultural values. For example, a common cultural value ofusing technology to reduce time spent cleaning houses or increas-ing profit margins has been shown to increase the rate of diffusion(Rogers, 2003).
By contrast, in small-scale prehistoric settings such corporatecapitalistic goals are minimal to non-existent. Communities wereoften more isolated from one another and interactions betweencommunities were often limited to special events (e.g., marriage,feasts, religious ceremonies). Transmission of information abouttechnologies was also limited to oral and personal (one-to-one)settings, such as parental training and/or apprenticeships. Withtransmission occurring between limited sets of individuals and pri-marily between generations, the rate of adoption of technologywas necessarily slower and more limited than what we see today.
Furthermore, in many archaeological studies, the communityunder investigation is formed based artifact similarity, not neces-sarily cultural similarity, and we have no control over ethnicity.As a result, we are more likely to sample across what represent dif-ferent language, religious, and cultural communities. As discussedabove, such heterophilous conditions will slow the apparent rate ofdiffusion of innovations.
The second difference between archaeological data and histori-cal/modern data concerns non-adopters of a technology. In ethno-graphic cases, it is often possible to observe which members in acommunity did not adopt a technology (and subsequently to askthem why they did not do so, though see Abrahamson, 1991 fora critique even in modern settings). In archaeological data setssuch as this one, we can only examine the timing and archaeolog-ical context of people who did adopt a particular technology. Bydating only pot sherds, as in this study, the people who did notadopt pottery are not represented. Thus, measuring relative adop-tion within a population is often not possible. Schiffer’s (1987:356) observation that the absence of archaeological evidence isnot always evidence of absence clearly applies in this setting.
In order to address issues of comparability and visibility in thestudy of technology diffusion in our present study we make threemain assumptions. First, we assume that our physical collections ofceramic sherds represent unbiased samples of sherds across time.That is, we assume our sample is not disproportionately repre-sented by materials from particular windows of time because theyare more visible archaeologically or because they preserve better.Given that our sample is primarily from surface surveys, that pot-tery is a durable material, and sediment deposition is low in thesedesert environments, we believe our samples are diachronicallyrepresentative of pottery production and use.
Second, we assume that the number of sherds deposited on thelandscape in a given window of time is directly proportional to thenumber of people using pottery technologies. In other words, weassume that the average number of pots used by an individual ora family group was roughly constant over time. In this way,increasing numbers of sherds over time represents either increas-ing populations (see below) or an increasing frequency of individ-uals using pottery technologies, rather than a small number offamilies ramping up the scale of vessel production. We believe thatour sampling strategy minimizes the potential of this factor toskew our results because, first, we tended to sample widely fromdifferent sites or site component (i.e., one or two sherds per siteor house depression), rather than intensively from certain sites.
Different sites or site components will tend to reflect the behaviorof different family groups. Second, there is no evidence that thephysical form or composition of a vessel led disproportionatelyto more or less numbers of sherds present in the archaeologicalrecord (i.e., certain pot forms are more brittle and break into moresherds).
Third, we assume that population levels were relatively con-stant through time (at least during the ceramic period), such thatincreases or decreases in the absolute number of sherds reflectchanges in the proportion of people using pots rather than changesin the number of people. If the population significantly increased,for example, then our study would overestimate the frequency ofindividuals who had adopted pottery. This is probably the mostquestionable of our three assumptions. Controlling for populationlevels is notoriously difficult in archaeological research. However,tabulations of radiocarbon and obsidian hydration dates in theOwens Valley (Basgall, 2008), one means of estimating populationlevels (though see Surovell and Brantingham, 2007), suggests thatthere is no marked increase or decrease in population levels in theWestern Great Basin during the last 600 years of prehistory.
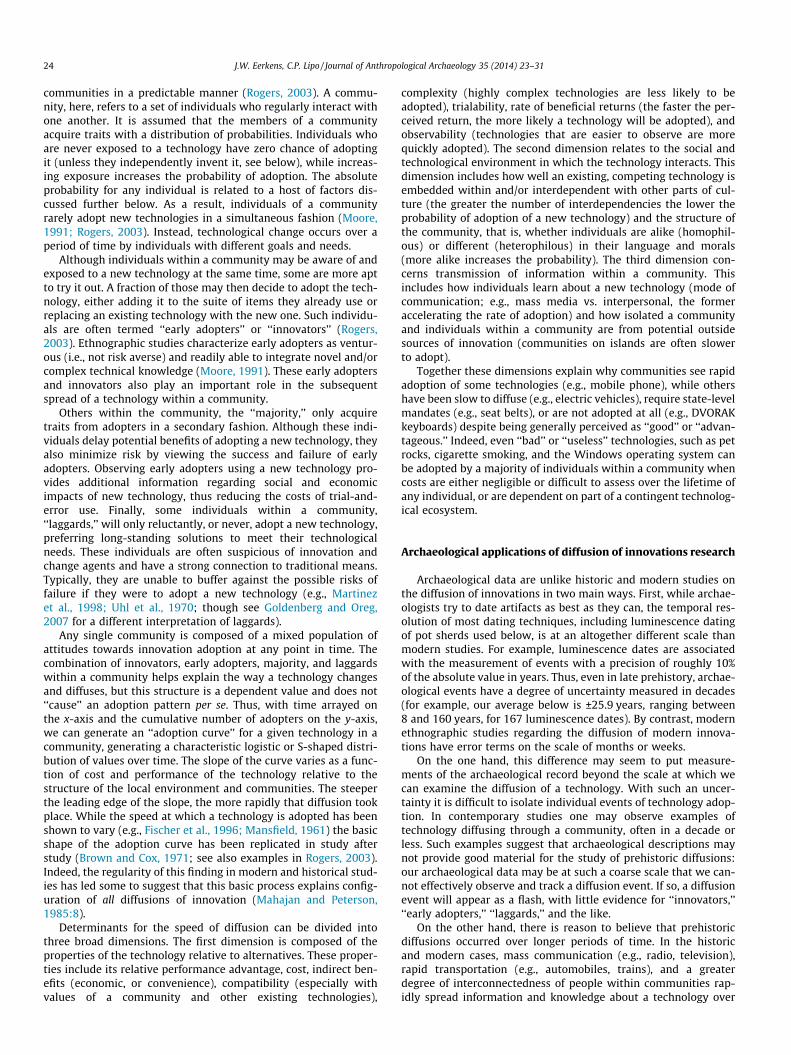
Given these assumptions, histograms of dated artifacts can thenpotentially inform us about the waxing or waning of popularity ofa particular technology. Fig. 1 presents several idealized possibili-ties. A rapid diffusion of a widely used technology should generatea histogram that approximates the shape of a box (Fig. 1A), wherethe technology suddenly appears and is used by a significant andconstant proportion of the population. After appearing, the com-munity becomes saturated with this new technology and there isno further proportional increase in the number of artifacts. Sucha curve is predicted by the diffusion of innovations model if therate of diffusion is faster than the precision of the dating method.For example, if the performance/cost advantage of a technologyhas a dramatic beneficial effect and is adopted by everyone in awindow of time that is smaller than the error terms (precision)of a particular dating method, we are unable to resolve the detailsof the diffusion process.
An alternative scenario (Fig. 1B) is a more triangular-shapedhistogram of dates. Such a distribution suggests a constant rateof diffusion throughout the population, where the numbers ofadopters increases linearly with time. As discussed above, this typeof curve is not predicted by the diffusion of innovations model. Themodel in Fig. 1B suggests that we cannot divide individuals intoearly adopters, majority, and laggards, but instead, that all individ-uals adopt at the same rate.
Fig. 1C shows a third possibility, where a technology diffusesslowly at first, but then rapidly reaches saturation. Again, thismodel would not be predicted by the diffusion of innovationmodel. The model in 1C lacks laggards who are predicted to beslow in the adoption of the technology.
Finally, Fig. 1D shows the classic diffusion of innovations model.A technology is innovated, diffuses slowly within the population atfirst (early adopters), is gradually adopted by more and more (themajority), with the rate of adoption decreasing thereafter (lag-gards), followed by eventual saturation.
Predictions for western great basin pottery
Our goal in this paper is to evaluate whether the diffusion ofinnovations research is suitable for application in the archaeologi-cal record and to explore the degree to which diffusion modelsaccount for technological change in a prehistoric instance. Ourstudy examines pottery from four areas of the Western GreatBasin. In our analysis, we make several predictions. First, we pre-dict that the diffusion of pottery technology within a region willfollow an S-shaped pattern, as is consistent with modern and

Fig. 1. Hypothetical diffusions of an innovation, and resulting histograms of predicted dates.
26 J.W. Eerkens, C.P. Lipo / Journal of Anthropological Archaeology 35 (2014) 23–31
historical cases. In other words, we predict that the diffusion ofinnovations model applies in prehistoric cases as well.
Second, given the lack of mass media, we also predict that thediffusion process will transpire more slowly than in a modern set-ting, in particular, over several generations within a community.This is particularly important given our resolution in dating arti-facts, where error terms are typically at the level of a generation(e.g., ±25 years). As a result, we predict a distribution of datessimilar to what is shown in Fig. 1D (as opposed to Fig. 1A).
Finally, we predict that the areas where pottery appears firstwill have a longer period of experimentation, that is, a longerand more gradual left-hand tail. In these cases initial use of potterywill not compete with alternative technologies or have costs thatmitigate its initial adoption. These initial areas of experimentationexhibit the first cases of the use of pottery and thus in the long runwill become areas where pottery is more frequently used (i.e., ahigher density of users). As pottery out-performs other containertechnologies in these regions and the details for adapting potteryto local conditions are worked out, pottery will spread geographi-cally to nearby areas. Such details include where to obtain clay,which members of society will be responsible for procuring rawmaterials and/or producing items, and what form of pot works bestgiven clay, temper, fuel, and use in a given environment.
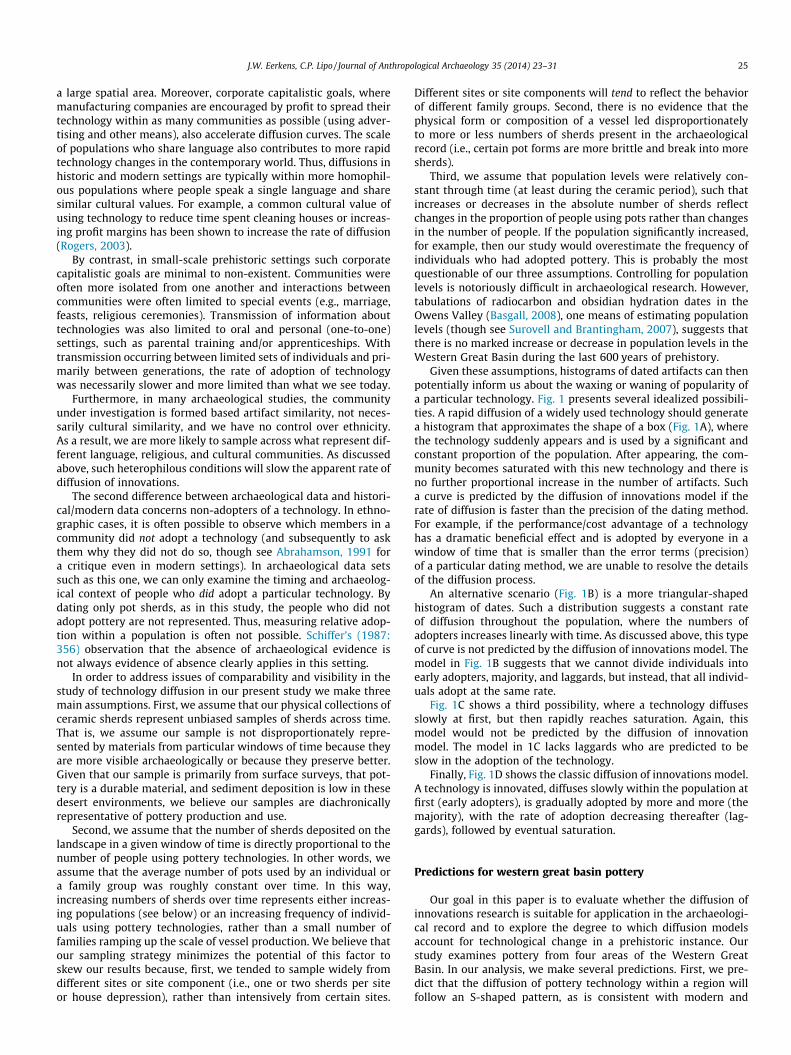
Fig. 2. Map of the western Great Basin region.
Western great basin pottery
Despite the fact that many hunting and gathering groups pro-duced pottery around the world (e.g., Close, 1995; Griset, 1986;Jordan and Zvelebil, 2010; Mack, 1990; Thompson et al., 2008),we still know relatively little about ceramic technological develop-ments among such populations. Prehistoric populations of thewestern Great Basin (see Fig. 2) provide an opportunity to studysuch processes. Past work has documented the role of pottery inplant processing and cooking (Eerkens, 2003a, 2004, 2005), but less
is known about the timing and development of pottery in thisregion.
This semi-arid region averages just 5–15 cm of rainfall per yearand is characterized by mountain ranges that rise over 3000 m sep-arated by deep valleys at elevations ranging between 0 and1400 m. Paiute and Shoshone people exclusively occupied thisregion prior to the mid 1800s, at which point Euroamerican settlersbegan to displace local groups and/or remove them to small reser-vations. Although Paiute and Shoshone people continue to live inthese regions, pottery quickly disappeared from the toolkit as theygained access to metal pots. Hunter-gatherers here were residen-tially mobile, though the degree varied from group to group(Steward, 1933, 1938), ranging from semi-sedentary in Owens Val-ley to highly residentially mobile in places such as China Lake.
Pottery is a late prehistoric technology in the western GreatBasin and is consistently associated with sites that date after 650

J.W. Eerkens, C.P. Lipo / Journal of Anthropological Archaeology 35 (2014) 23–31 27
BP (Pippin, 1986; Rhode, 1994). In the Owens Valley, small num-bers of pots appear around 1200 BP, indicating some latent knowl-edge and experimentation with the technology (Eerkens et al.,1999). It is possible that technological information about potterydiffused from agricultural societies in the Southwest, where pot-tery production already had a long history (Crown and Wills,1995; LeBlanc, 1982). However, if so, it is clear that the technologywas organized in a manner that is completely different than in theSouthwest, and resulting vessels have a markedly different formand aesthetic. In other words, even if the technology diffused,Great Basin communities adapted it to suit their local needs.
Despite some early experimentation, radiocarbon dates fromfeatures associated with pottery indicate that the craft did notbecome commonplace in Owens Valley until 650 BP (Delacorte,1999). The distinctive pottery is often referred to as ‘‘Owens Valleybrownware,’’ even when found in other geographic locations, how-ever, we prefer the a-geographic and more general term of ‘‘brown-ware.’’ This period (650 BP – contact) is also a time when smallseeds such as chenopod, blazing star, rice grass, and other grassesbegan to be intensively harvested (Bettinger, 1979, 1983, 1989;Delacorte, 1999). Residue studies suggest that a major role of potswas to boil such seeds (Eerkens, 2005).
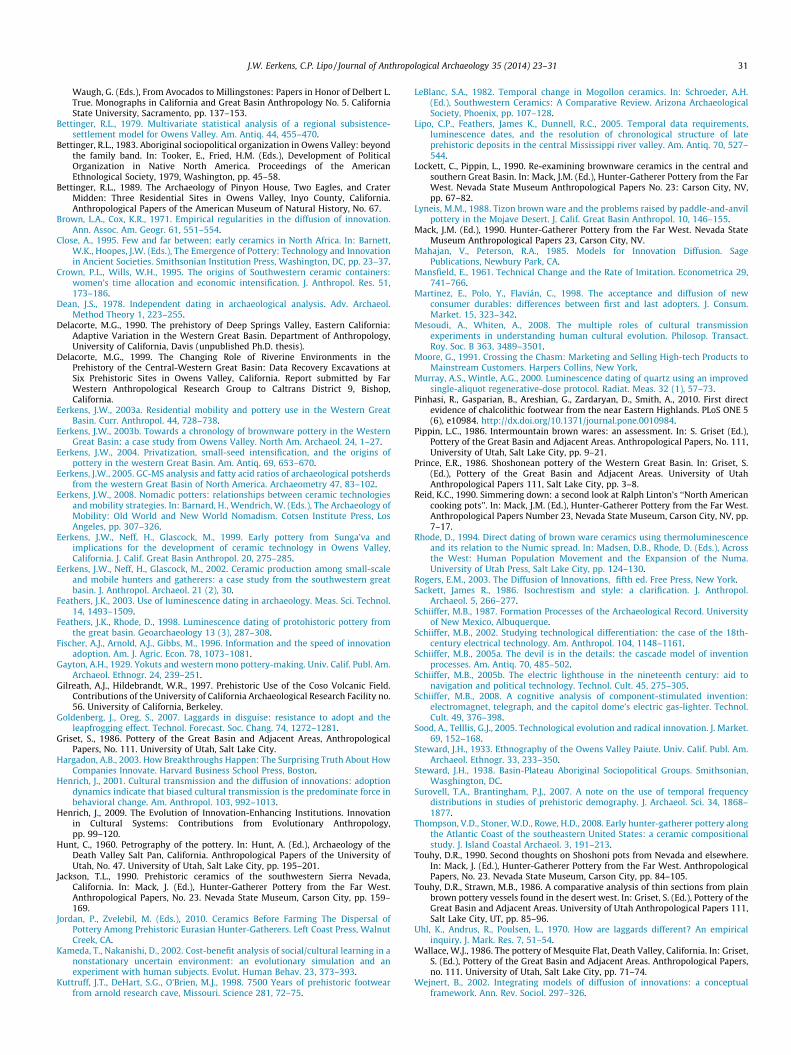
Although there is variance in form and design, brownware cera-mic vessels are generally plain (undecorated) and usually medium-sized (ca. 15–25 cm high and 18–25 cm wide at the mouth). Vesselwall thickness varies between 4 and 9 cm just below the rim. Con-ical straight-sided pots (i.e., V-shaped) are the most common form,but spherical bowls with recurved rims are also present (Bettinger,1989; Hunt, 1960; Lyneis, 1988; Pippin, 1986; Prince, 1986; Touhy,1990; Touhy and Strawn, 1986; Wallace, 1986). Fig. 3 shows twoexamples of complete pots that represent typical forms found inthe region.
Based on ethnographic descriptions (Gayton, 1929; Steward,1933) and archaeological analyses (Bettinger, 1989; Hunt, 1960),vessels were constructed mainly by stacking coils of clay on a cir-cular disk base and scraping these together with fingers or a smallsmooth object. Most pots are tempered with sand and/or crushedgranitic rock, though organic fibers were also commonly added(or were present naturally within the clay). Vessels were fired atrelatively low temperatures, often in uncontrolled atmospheres, aprocess that resulted in uneven oxidation and brown-red coloredpastes.
Chemical composition analyses using Instrumental NeutronActivation Analysis (INAA) demonstrate that prehistoric pottersused a range of discrete and local clay sources to make pots(Eerkens et al., 2002). It is not yet known if these different claysources were used simultaneously, perhaps by different pottersor for different functions, or if there is a temporal component toclay source use, for example, if potters were experimenting with
Fig. 3. Two examples of complete pots from the China Lake region.
different clay-temper recipes. Analysis of the spatial distributionof sourced sherds suggests that pots were only occasionally trans-ported outside their region of manufacture (Eerkens et al., 2002).Typically, only 5-15% of sherds are exotic. Overall, productionseems to have been on a small scale, likely at the family or individ-ual level, for local and domestic use (Eerkens, 2004; Eerkens et al.,2002).
At the same time, research shows that pottery was not a statictechnology. Instead, there appears to be experimentation and inno-vation in pot form throughout the late prehistoric period. Forexample, Eerkens (2003b) showed that the earliest pots in south-ern Owens Valley, those dating older than 450 BP, are generallyover 7.0 mm thick, often contain mica, more frequently haveorganic temper, and are usually smoothed on their exterior sur-faces. Between 300 and 450 BP pots become somewhat thinner(ca. 6.5 mm), contain less mica, and are less frequently smoothedon their exterior surfaces. After 300 BP, assemblages contain thethinnest sherds, usually less than 5.5 mm, have little mica ororganic temper present, and are rarely smooth on their exterioror interior surfaces. Eerkens argued that these diachronic changesreflect experimentation, including the use of different clay andtemper recipes, a result of the transmission of accumulated infor-mation on potting knowledge. Small innovations spread withinthe population and made the technology more suitable to locallifestyles.
Case study
Here, we examine the temporal distribution of optically stimu-lated luminescence (OSL) dates of pot sherds in two regions, South-ern Owens Valley (SOV) and Death Valley. Sherds were dated usingtechniques described by Murray and Wintle (2000) and Banerjeeet al. (2001). Pot sherds are common in late prehistoric sites inboth regions and were an integral part of the technological toolkitand represent at least two different vessel forms. One is a pot witha recurved or reverted rim (i.e., a constricted neck) that is foundprimarily in Death Valley (see Fig. 4). The other is a vessel with adirect and non-constricted neck found in both regions. As we willdemonstrate, the former was a failed invention that was ultimatelyreplaced by the latter.
The use of luminescence dating as a means of dating ceramicshas distinct advantages over other forms of archaeological dating.First, luminescence dating of ceramics reflects the event of pot fir-ing (Aitken, 1985; Feathers, 2003; Lipo et al., 2005). In the case ofradiocarbon dating, in contrast, the event that is measured is asso-ciated with the removal of the organism from the carbon cycle.This event may or may not be associated with the event of interest,the manufacture of the pot. Consequently, radiocarbon dates have
Fig. 4. Examples of rim forms present in Southern Owens and Death Valleys.

28 J.W. Eerkens, C.P. Lipo / Journal of Anthropological Archaeology 35 (2014) 23–31
an unknown amount of error that can be hundreds of years ormore, in the case of the use of old wood, from the event relatedto the creation and use of the vessel (Dean, 1978).
Second, quantitative uncertainty associated with OSL dating ismeasurement error that has a normal distribution. This situationcontrasts with calibrated radiocarbon dates that have complexprobabilistic relations between the radiocarbon measurementsand the calendric age of the sample. This relation is particularlycomplicated in last 300 years of prehistory due to variability inthe amount of 14C in the atmosphere and radiocarbon age esti-mates often have multiple calibrated windows of calendrical dates.This situation makes distinguishing the hypothetical cases positedin Fig. 1 difficult.
In addition to the OSL dates generated for SOV and Death Valley,we also examined a small series of luminescence dates from aregion between Owens and Death Valleys, China Lake, where pot-tery is less common. These data provide information about thetiming and structure of pottery adoption in an area where thereappears to have been fewer consumers. In addition, we have com-piled previously published luminescence dates from the NevadaTest Site (NTS; Rhode, 1994; Feathers and Rhode, 1998), to exam-ine the timing and adoption process of pottery there.
Luminescence samples from SOV, Death Valley, and China Lakeare all new dates produced by the authors. Sherds represent sur-face-collected artifacts generated from surveys carried out by arange of researchers (e.g., Delacorte, 1999; Gilreath andHildebrandt, 1997; Hunt, 1960; Wallace, 1986; as well as still-unpublished collections generated by JWE). The goal in our studywas to sample widely from a range of different sites in each region.Sherds included are mainly from the rim, and each sherd repre-sents a different pot (i.e., sherds that looked alike from the samesite, and thus, could have come from the same pot, were only sam-pled once). In this respect, our sample is intended to maximizeregional variation in the size, shape, temper, and surface character-istics of pots. By contrast, the NTS sample simply represents anassemblage of dates produced in two previous studies, but we haveno further information about the form of the pots or the archaeo-logical context.
In total, we have assembled 97 dates from SOV, 37 from DeathValley, 17 from China Lake, and 16 from NTS in the analyses below,for a total of 167 OSL dates.
Results
Fig. 5 shows the distribution of luminescence dates from SOVand Death Valley, binned into 50-year intervals. In Death Valley,dates from pots with recurved rims (n = 9) are shown separatelyfrom those with direct rims (n = 28). The numbers along the x-axisindicate the midpoint within each bin (i.e., the bin marked 1600 isactually AD 1575-1624). One outlying old date from Owens Valley
Fig. 5. Distribution of luminescence dates in S
at AD 954 is not shown to focus attention on the later diffusionprocess, but supports the notion that there was some early exper-imentation with potting technologies in the region (Eerkens et al.,1999).
The distribution of dates from SOV and Death Valley is consis-tent with the technology diffusion model and suggests that peoplewere experimenting with pottery in both regions between AD1275 and 1375 (and perhaps earlier in SOV as indicated by the dateof AD 954). In SOV this was a direct-rimmed pot, with relativelythick and smoothed walls and more organic temper and mica(Eerkens, 2003b). In Death Valley these pots were bowled with arecurved and relatively thick rim. In both regions, the frequencyof these early-dating sherds is small, suggesting experimentationwith a new, or at least rare, technology.
In the ensuing centuries, pottery slowly diffused throughout theSOV region, as witnessed by the increasing number of lumines-cence dates between AD 1425 and 1824 (median date = AD1701). A drop-off in the frequency of dates after AD 1825 is consid-ered further below. The slow increase in dates is much as weexpect for a successful innovation that is spread within a hunter-gatherer population. As the costs for learning the technologydecrease due to greater numbers of people become increasinglyfamiliar with the technology, including various clay sources, firingconditions, and functional properties of different forms, new initi-ates adopt the technology and begin producing pots as well.
By contrast, the pot with the recurved rim in Death Valley doesnot successfully spread. Initially, only recurved pots were producedin Death Valley and it appears that they became more popular inthe ensuing two centuries, peaking between AD 1425 and 1525.This pattern suggests, as with direct-rimmed pots in SOV, a suc-cessful start to the diffusion process. However, no recurved potsdate between AD 1525 and 1675, suggesting an abandonment ofthe technology, and only a minority of the 28 pots dating afterAD 1710 are recurved (n = 4). This suggests that the technologymay have been occasionally revived, but never again became thedominant pot form.
In some respects the shape of the histogram of luminescencedates on direct-rimmed pots in Death Valley is more similar to thatin SOV. Here, there are a small number of early-dating direct-rimsherds, followed by a sharp increase after AD 1750 as the technol-ogy spreads, pointing to a very successful diffusion. Relative toSOV, it is also notable that the diffusion of direct-rimmed pots inDeath Valley is shifted later in time by 100–200 years (mediandate = AD 1801) and is much quicker, as indicated by the steeperslope in Death Valley.
Fig. 6 shows the distribution of luminescence dates from ChinaLake and NTS. The dates from China Lake represent a small sample(n = 17), but all are from direct-rimmed pots (recurved pots arerare in this region and were not in our sample). Together, the datesshow a very similar pattern to the direct-rimmed pots in DeathValley. The dates are shifted slightly earlier in time compared to
outhern Owens Valley and Death Valley.

Fig. 6. Distribution of luminescence dates in China Lake and NTS.
J.W. Eerkens, C.P. Lipo / Journal of Anthropological Archaeology 35 (2014) 23–31 29
Death Valley, by about 25 years, but indicate some early experi-mentation followed by a relatively rapid adoption of the technol-ogy. As in Owens and Death Valleys, a fall-off after AD 1850 isevident.
By contrast, the NTS distribution is clearly bimodal, with one setof dates between AD 1375 and 1625 and a second set between AD1760 and 1840 (one early outlier at AD 1081 is not plotted).Because we did not generate or analyze this sample of sherds, itis unclear whether this is a byproduct of sampling strategy or rep-resents a random sample of all sherds in the NTS region. Further-more, we do not have the information to determine whetherthese samples are from direct-rimmed or recurved pots, as themajority are wall, not rim, sherds. However, recurved pots arenot uncommon in the NTS (Lockett and Pippin, 1990), and the dis-tribution of early dates is similar to those of recurved pots in DeathValley (though the sample sizes are admittedly small for both). Weconsider this issue briefly again below.
Table 1Results of K–S Tests on distributions of dates, comparing regions (with Death Valleyrun twice, once for all sherds and once for sherds with direct rims only). The uppershaded cells give the D statistic (maximum distance between curves), while the lowerunshaded cells give the probability the two curves are drawn from the sameunderlying distribution.
SOV China Lake
Death Valley
DV direct NTS
SOV - .45 .36 .47 .32China Lake .007 - .19 .11 .56Death Valley .001 .777 - - .50
- DV direct .000 .999 - - .59NTS .086 .009 .005 .001 -
Discussion
We believe the distribution of luminescence dates from thewestern Great Basin suggest a tale of two innovations, one success-ful (direct-rimmed pots), the other a failure (recurved pots). Wehave only sampled pots from three regions and some of the detailsmay change with additional data, especially from other regions andvalleys. Based on the evidence at hand, however, we believe thetale of the successful innovation begins in Owens Valley, likelythe southern end. Here, the innovation of the direct-rimmed potincluded a long and extended period, lasting several centuries,where few pots were produced. We interpret this period as anextended window of early experimentation with pottery. Basedon our luminescence dates, this may have begun as early as AD950 and continued through AD 1475. Such an early date for exper-imentation with pottery is not unprecedented, and is supported byadditional data from excavation (Eerkens et al., 1999).
The period of experimentation in SOV is followed by a gradualincrease in the adoption of the technology, between AD 1475 and1825. This slow and steady diffusion resulted in increasing num-bers of pots at sites in the region through AD 1800, producing anadoption curve that is most visually similar to that in Fig. 1D. Thissuggests something similar in basic structure to a typical diffusionof an innovation. We note that there is a slight inflection in the his-togram curve around 1650 BP. Our sample size is not large enoughto determine if this is a real pause in the diffusion of direct-rimtechnologies, or simply a sampling error. We note, however, thatsuch curves have been observed in modern studies where a signif-icant innovation occurs within a technology, or when two rivaltechnologies compete with one another and one ultimately out-competes the other (Sood and Telllis, 2005). In other words, suchcurves are expected when two diffusion S-curves intersect oneanother. Additional technological analyses of the direct-rim sherds
before and after AD 1650, as well as additional luminescence dat-ing, may help resolve this issue. In particular, this may indicate theshift from thicker to more thin-walled pots (Eerkens, 2003b).
In the late 16th century AD, we suggest that direct-rimmed potsdiffused from SOV to other regions, but only after a significant per-iod of experimentation in SOV. In other words, SOV potters mayhave gained enough experience that technological informationabout the craft could be transmitted to inhabitants of nearbyregions, who could successfully incorporate the craft into localtoolkits. Luminescence dates suggest direct-rim pottery technolo-gies diffused to China Lake around AD 1580 (one earlier date atAD 1329 notwithstanding), and to Death Valley shortly thereafter.In both these regions, the subsequent internal diffusion is muchfaster than it was in SOV. Direct-rimmed pots are rapidly adoptedand the technology quickly spreads among inhabitants in theseregions, as indicated by a steep increase in the number of lumines-cence dates on direct-rimmed sherds over time (i.e., steeper slopeof the adoption curve).
A comparison of the distribution of dates from direct-rimmedpots in China Lake and Death Valley, using a Kolmogorov–Smirnov(K–S) test, shows the suites of dates are nearly identical (Table 1).By contrast, K–S tests indicate that the cumulative frequency curveof dates in Southern Owens Valley is significantly different thanthe curves for Death Valley and China Lake. In other words, theprocess of diffusion for direct-rimmed pots was entirely differentin the former. This is due to the significantly longer period ofexperimentation and the slower rate of adoption in SouthernOwens Valley.
The second tale is that of the failed innovation of the recurvedpot. We lack sufficient information to establish where therecurved form was originally invented. We suspect it wasinvented in an area to the east of Death Valley, such as NTS,and diffused into the former. This hypothesis should be testedwith additional luminescence dating of recurved rim sherds fromDeath Valley and NTS. In any case, the recurved pot was the dom-inant form in Death Valley between AD 1325-1525. This innova-tion, however, did not diffuse west into China Lake or SOV, at

30 J.W. Eerkens, C.P. Lipo / Journal of Anthropological Archaeology 35 (2014) 23–31
least in significant numbers such that it appeared in our sampleof sherds. Furthermore, the direct-rimmed form in Death Valleyeventually replaced it. We note that recurved pots do appear insmall numbers in areas to the north of SOV, such as centralOwens Valley and Deep Springs Valley (Delacorte, 1990).Although they are never dominant and co-occur with direct-rimmed pots, we hope to conduct future luminescence datingon a suite of recurved and direct rim sherds from these otherareas to evaluate this hypothesis.
Why the recurved pot failed as an innovation in Death Valley isunclear and must await additional analysis. However, a clue maycome from residue analyses. Eerkens (2005) found that thatrecurved pots have residue profiles that are consistent with thecooking of meat, while direct-rimmed pots were typically used tocook seeds. Functionally, a pot with a recurved rim will retain heatbetter than a pot with a direct rim and open mouth. A recurvedrim, then, is better suited to simmering and stewing activities,those typically associated with meat preparation, while a direct-rimmed pot is better suited to high temperature boiling, which istypically associated with seed preparation (Reid, 1990). Becauseseeds were an ever-increasing component of the Late Prehistoricdiet, recurved pots may not have met the needs of western GreatBasin inhabitants as well as direct-rimmed pots.
Conclusions
We made three predictions about the diffusion of pottery tech-nologies among hunter-gatherers of the western Great Basin. First,we predicted that pottery would diffuse following the same pat-tern observed in modern and historical cases. In particular, we pre-dicted S-shaped curves to the diffusion process. We believe thisprediction is mostly met. All four regions show long left-hand tailsin their distribution of dates, indicating the presence of earlyexperimenters with the technology, followed by a shorter windowwhere the majority of dates appear. We believe the latter repre-sents when the majority of people within the population adoptedthe technology.
At present, we lack the kind of resolution to determine whetherother elements of the S-shaped curve are present. In particular, it isdifficult to detect the presence of laggards as predicted from diffu-sion of innovation models, that is, people or families who onlygrudgingly adopt the technology long after the majority. This ispartly due to a common attribute of the distribution of dates inall four regions, which show a fall-off of dates at the end of thesequence, or complete absence in the case of the NTS. We believethis fall-off effect is caused by two factors that disrupted the diffu-sion of pottery. First, there appears to have been a reduction inpopulation levels in the proto-historic or early historical-perioddates due to the spread of European diseases ahead of actual con-tact with Euroamericans (ca. AD 1850 in the western Great Basin).Second, following contact, there was a general replacement ofearthenware pots with metal containers, such as cast-iron pots(Eerkens, 2003a). Both of these factors then serve to confoundthe detection of laggards in our sample.
Our second prediction was that the diffusion process amonghunter-gatherers of the past would be slower than in modernand historical settings where mass media and modern transporta-tion is more effective at transmitting information over time andspace. We believe the suites of dates in all four regions support thishypothesis. Although the diffusion of pottery was faster in someregions where it appeared later (e.g., China Lake, and for direct-rimmed pots in Death Valley), the process took place over centu-ries, rather than decades. Based on our data, the rate of diffusionseems to be an order of magnitude slower than in modern andhistorical settings.
Our third prediction was that there would be a longer period ofexperimentation, causing a longer left-hand tail to the distributionof dates, in regions where pottery appears first. Again, this predic-tion was supported by data from SOV and the NTS, where the ear-liest dates on pottery were obtained. There, the bulk of dates comelong after this early experimentation. By contrast, the majority/bulk of dates Death Valley and China Lake come sooner after theearliest recorded date, as if there was minimal experimentationrequired after initial diffusion to bring the technology into wide-spread use.
Overall, our results demonstrate that the diffusion model accu-rately accounts for patterns of technology change within prehis-toric populations of the western Great Basin. Just as modernstudies on the diffusion of innovation have revealed importantinsight into cultural transmission processes and individual deci-sion-making, there is much potential for this approach in archaeol-ogy in general, though to date applications are few.
We argue that certain aspects of the modern literature on thediffusion of innovation are directly relevant to archaeological stud-ies regarding the diffusion of ancient innovations. In particular, ourdata set is able to detect the effects of early innovators and earlyadopters of pottery technologies in the Western Great Basin. Twodifferent pot forms were developed within three centuries of oneanother, one with a direct rim and one with a recurved rim. Theuse of pots continued in low frequencies for two to five centuriesand slowly spread within local communities. While the recurvedpot failed to spread, the direct-rimmed form was very successful.
We argue that the several centuries of experimentation withthe direct-rimmed pot in Southern Owens Valley set the stage forits adoption by the majority and its eventual spatial diffusion,especially to the east, but likely to the west as well (Jackson,1990). The slope of the adoption curve in Southern Owens Valleyis quite gradual, indicating slower internal diffusion. By compari-son, direct-rim pots were adopted much more quickly in ChinaLake and Death Valleys. Experimentation in Southern OwensValley likely worked out many of the difficulties that hunter-gatherers of the Western Great Basin faced in trying to incorporatepotting into their lives (Eerkens, 2008). Once improved in SouthernOwens Valley, the new technology spread easier in adjacentregions. In this respect, our data set is also able to detect the effectsof the majority on diffusion processes. While the effects of laggardsmay also be present in the data set, disruptions in diffusionprocesses caused by contact with Euroamericans may obscuretheir detection archaeologically.
Acknowledgments
This material is based upon work supported by the NationalScience Foundation under Grant No. BCS-0723484 and BCS-0723857, to the authors. We thank the many individuals whomade this research possible, including access to collections (MarkAllen, Robert Bettinger, Caven Clark, Lisa Deitz, Kish LaPierre,Amy Gilreath, and Bill Hildebrandt) and preparation of samples(Sachiko Sakai). We also thank the anonymous reviewers of aprevious draft for their valuable comments.
References
Abrahamson, E., 1991. Managerial fads and fashions: the diffusion and rejection ofinnovations. Acad. Manage. Rev. 16, 586–612.
Aitken, M.J., 1985. Thermoluminescence Dating. Academic Press, London.Banerjee, D., Murray, A.S., Bøtter-Jensen, L., Lang, A., 2001. Equivalent dose
estimation using a single aliquot of polymineral fine grains. Radiat. Meas. 33,73–94.
Basalla, George, 1988. The Evolution of Technology. Cambridge University Press,Cambridge.
Basgall, Mark E., 2008. An Archaeological Assessment of Late-HoloceneEnvironmental Change in the Southwestern Great Basin. In: Basgall, M.E.,
J.W. Eerkens, C.P. Lipo / Journal of Anthropological Archaeology 35 (2014) 23–31 31
Waugh, G. (Eds.), From Avocados to Millingstones: Papers in Honor of Delbert L.True. Monographs in California and Great Basin Anthropology No. 5. CaliforniaState University, Sacramento, pp. 137–153.
Bettinger, R.L., 1979. Multivariate statistical analysis of a regional subsistence-settlement model for Owens Valley. Am. Antiq. 44, 455–470.
Bettinger, R.L., 1983. Aboriginal sociopolitical organization in Owens Valley: beyondthe family band. In: Tooker, E., Fried, H.M. (Eds.), Development of PoliticalOrganization in Native North America. Proceedings of the AmericanEthnological Society, 1979, Washington, pp. 45–58.
Bettinger, R.L., 1989. The Archaeology of Pinyon House, Two Eagles, and CraterMidden: Three Residential Sites in Owens Valley, Inyo County, California.Anthropological Papers of the American Museum of Natural History, No. 67.
Brown, L.A., Cox, K.R., 1971. Empirical regularities in the diffusion of innovation.Ann. Assoc. Am. Geogr. 61, 551–554.
Close, A., 1995. Few and far between: early ceramics in North Africa. In: Barnett,W.K., Hoopes, J.W. (Eds.), The Emergence of Pottery: Technology and Innovationin Ancient Societies. Smithsonian Institution Press, Washington, DC, pp. 23–37.
Crown, P.L., Wills, W.H., 1995. The origins of Southwestern ceramic containers:women’s time allocation and economic intensification. J. Anthropol. Res. 51,173–186.
Dean, J.S., 1978. Independent dating in archaeological analysis. Adv. Archaeol.Method Theory 1, 223–255.
Delacorte, M.G., 1990. The prehistory of Deep Springs Valley, Eastern California:Adaptive Variation in the Western Great Basin. Department of Anthropology,University of California, Davis (unpublished Ph.D. thesis).
Delacorte, M.G., 1999. The Changing Role of Riverine Environments in thePrehistory of the Central-Western Great Basin: Data Recovery Excavations atSix Prehistoric Sites in Owens Valley, California. Report submitted by FarWestern Anthropological Research Group to Caltrans District 9, Bishop,California.
Eerkens, J.W., 2003a. Residential mobility and pottery use in the Western GreatBasin. Curr. Anthropol. 44, 728–738.
Eerkens, J.W., 2003b. Towards a chronology of brownware pottery in the WesternGreat Basin: a case study from Owens Valley. North Am. Archaeol. 24, 1–27.
Eerkens, J.W., 2004. Privatization, small-seed intensification, and the origins ofpottery in the western Great Basin. Am. Antiq. 69, 653–670.
Eerkens, J.W., 2005. GC-MS analysis and fatty acid ratios of archaeological potsherdsfrom the western Great Basin of North America. Archaeometry 47, 83–102.
Eerkens, J.W., 2008. Nomadic potters: relationships between ceramic technologiesand mobility strategies. In: Barnard, H., Wendrich, W. (Eds.), The Archaeology ofMobility: Old World and New World Nomadism. Cotsen Institute Press, LosAngeles, pp. 307–326.
Eerkens, J.W., Neff, H., Glascock, M., 1999. Early pottery from Sunga’va andimplications for the development of ceramic technology in Owens Valley,California. J. Calif. Great Basin Anthropol. 20, 275–285.
Eerkens, J.W., Neff, H., Glascock, M., 2002. Ceramic production among small-scaleand mobile hunters and gatherers: a case study from the southwestern greatbasin. J. Anthropol. Archaeol. 21 (2), 30.
Feathers, J.K., 2003. Use of luminescence dating in archaeology. Meas. Sci. Technol.14, 1493–1509.
Feathers, J.K., Rhode, D., 1998. Luminescence dating of protohistoric pottery fromthe great basin. Geoarchaeology 13 (3), 287–308.
Fischer, A.J., Arnold, A.J., Gibbs, M., 1996. Information and the speed of innovationadoption. Am. J. Agric. Econ. 78, 1073–1081.
Gayton, A.H., 1929. Yokuts and western mono pottery-making. Univ. Calif. Publ. Am.Archaeol. Ethnogr. 24, 239–251.
Gilreath, A.J., Hildebrandt, W.R., 1997. Prehistoric Use of the Coso Volcanic Field.Contributions of the University of California Archaeological Research Facility no.56. University of California, Berkeley.
Goldenberg, J., Oreg, S., 2007. Laggards in disguise: resistance to adopt and theleapfrogging effect. Technol. Forecast. Soc. Chang. 74, 1272–1281.
Griset, S., 1986. Pottery of the Great Basin and Adjacent Areas, AnthropologicalPapers, No. 111. University of Utah, Salt Lake City.
Hargadon, A.B., 2003. How Breakthroughs Happen: The Surprising Truth About HowCompanies Innovate. Harvard Business School Press, Boston.
Henrich, J., 2001. Cultural transmission and the diffusion of innovations: adoptiondynamics indicate that biased cultural transmission is the predominate force inbehavioral change. Am. Anthropol. 103, 992–1013.
Henrich, J., 2009. The Evolution of Innovation-Enhancing Institutions. Innovationin Cultural Systems: Contributions from Evolutionary Anthropology,pp. 99–120.
Hunt, C., 1960. Petrography of the pottery. In: Hunt, A. (Ed.), Archaeology of theDeath Valley Salt Pan, California. Anthropological Papers of the University ofUtah, No. 47. University of Utah, Salt Lake City, pp. 195–201.
Jackson, T.L., 1990. Prehistoric ceramics of the southwestern Sierra Nevada,California. In: Mack, J. (Ed.), Hunter-Gatherer Pottery from the Far West.Anthropological Papers, No. 23. Nevada State Museum, Carson City, pp. 159–169.
Jordan, P., Zvelebil, M. (Eds.), 2010. Ceramics Before Farming The Dispersal ofPottery Among Prehistoric Eurasian Hunter-Gatherers. Left Coast Press, WalnutCreek, CA.
Kameda, T., Nakanishi, D., 2002. Cost-benefit analysis of social/cultural learning in anonstationary uncertain environment: an evolutionary simulation and anexperiment with human subjects. Evolut. Human Behav. 23, 373–393.
Kuttruff, J.T., DeHart, S.G., O’Brien, M.J., 1998. 7500 Years of prehistoric footwearfrom arnold research cave, Missouri. Science 281, 72–75.
LeBlanc, S.A., 1982. Temporal change in Mogollon ceramics. In: Schroeder, A.H.(Ed.), Southwestern Ceramics: A Comparative Review. Arizona ArchaeologicalSociety, Phoenix, pp. 107–128.
Lipo, C.P., Feathers, James K., Dunnell, R.C., 2005. Temporal data requirements,luminescence dates, and the resolution of chronological structure of lateprehistoric deposits in the central Mississippi river valley. Am. Antiq. 70, 527–544.
Lockett, C., Pippin, L., 1990. Re-examining brownware ceramics in the central andsouthern Great Basin. In: Mack, J.M. (Ed.), Hunter-Gatherer Pottery from the FarWest. Nevada State Museum Anthropological Papers No. 23: Carson City, NV,pp. 67–82.
Lyneis, M.M., 1988. Tizon brown ware and the problems raised by paddle-and-anvilpottery in the Mojave Desert. J. Calif. Great Basin Anthropol. 10, 146–155.
Mack, J.M. (Ed.), 1990. Hunter-Gatherer Pottery from the Far West. Nevada StateMuseum Anthropological Papers 23, Carson City, NV.
Mahajan, V., Peterson, R.A., 1985. Models for Innovation Diffusion. SagePublications, Newbury Park, CA.
Mansfield, E., 1961. Technical Change and the Rate of Imitation. Econometrica 29,741–766.
Martinez, E., Polo, Y., Flavián, C., 1998. The acceptance and diffusion of newconsumer durables: differences between first and last adopters. J. Consum.Market. 15, 323–342.
Mesoudi, A., Whiten, A., 2008. The multiple roles of cultural transmissionexperiments in understanding human cultural evolution. Philosop. Transact.Roy. Soc. B 363, 3489–3501.
Moore, G., 1991. Crossing the Chasm: Marketing and Selling High-tech Products toMainstream Customers. Harpers Collins, New York.
Murray, A.S., Wintle, A.G., 2000. Luminescence dating of quartz using an improvedsingle-aliquot regenerative-dose protocol. Radiat. Meas. 32 (1), 57–73.
Pinhasi, R., Gasparian, B., Areshian, G., Zardaryan, D., Smith, A., 2010. First directevidence of chalcolithic footwear from the near Eastern Highlands. PLoS ONE 5(6), e10984. http://dx.doi.org/10.1371/journal.pone.0010984.
Pippin, L.C., 1986. Intermountain brown wares: an assessment. In: S. Griset (Ed.),Pottery of the Great Basin and Adjacent Areas. Anthropological Papers, No. 111,University of Utah, Salt Lake City, pp. 9–21.
Prince, E.R., 1986. Shoshonean pottery of the Western Great Basin. In: Griset, S.(Ed.), Pottery of the Great Basin and Adjacent Areas. University of UtahAnthropological Papers 111, Salt Lake City, pp. 3–8.
Reid, K.C., 1990. Simmering down: a second look at Ralph Linton’s ‘‘North Americancooking pots’’. In: Mack, J.M. (Ed.), Hunter-Gatherer Pottery from the Far West.Anthropological Papers Number 23, Nevada State Museum, Carson City, NV, pp.7–17.
Rhode, D., 1994. Direct dating of brown ware ceramics using thermoluminescenceand its relation to the Numic spread. In: Madsen, D.B., Rhode, D. (Eds.), Acrossthe West: Human Population Movement and the Expansion of the Numa.University of Utah Press, Salt Lake City, pp. 124–130.
Rogers, E.M., 2003. The Diffusion of Innovations, fifth ed. Free Press, New York.Sackett, James R., 1986. Isochrestism and style: a clarification. J. Anthropol.
Archaeol. 5, 266–277.Schiiffer, M.B., 1987. Formation Processes of the Archaeological Record. University
of New Mexico, Albuquerque.Schiiffer, M.B., 2002. Studying technological differentiation: the case of the 18th-
century electrical technology. Am. Anthropol. 104, 1148–1161.Schiiffer, M.B., 2005a. The devil is in the details: the cascade model of invention
processes. Am. Antiq. 70, 485–502.Schiiffer, M.B., 2005b. The electric lighthouse in the nineteenth century: aid to
navigation and political technology. Technol. Cult. 45, 275–305.Schiiffer, M.B., 2008. A cognitive analysis of component-stimulated invention:
electromagnet, telegraph, and the capitol dome’s electric gas-lighter. Technol.Cult. 49, 376–398.
Sood, A., Telllis, G.J., 2005. Technological evolution and radical innovation. J. Market.69, 152–168.
Steward, J.H., 1933. Ethnography of the Owens Valley Paiute. Univ. Calif. Publ. Am.Archaeol. Ethnogr. 33, 233–350.
Steward, J.H., 1938. Basin-Plateau Aboriginal Sociopolitical Groups. Smithsonian,Wasghington, DC.
Surovell, T.A., Brantingham, P.J., 2007. A note on the use of temporal frequencydistributions in studies of prehistoric demography. J. Archaeol. Sci. 34, 1868–1877.
Thompson, V.D., Stoner, W.D., Rowe, H.D., 2008. Early hunter-gatherer pottery alongthe Atlantic Coast of the southeastern United States: a ceramic compositionalstudy. J. Island Coastal Archaeol. 3, 191–213.
Touhy, D.R., 1990. Second thoughts on Shoshoni pots from Nevada and elsewhere.In: Mack, J. (Ed.), Hunter-Gatherer Pottery from the Far West. AnthropologicalPapers, No. 23. Nevada State Museum, Carson City, pp. 84–105.
Touhy, D.R., Strawn, M.B., 1986. A comparative analysis of thin sections from plainbrown pottery vessels found in the desert west. In: Griset, S. (Ed.), Pottery of theGreat Basin and Adjacent Areas. University of Utah Anthropological Papers 111,Salt Lake City, UT, pp. 85–96.
Uhl, K., Andrus, R., Poulsen, L., 1970. How are laggards different? An empiricalinquiry. J. Mark. Res. 7, 51–54.
Wallace, W.J., 1986. The pottery of Mesquite Flat, Death Valley, California. In: Griset,S. (Ed.), Pottery of the Great Basin and Adjacent Areas. Anthropological Papers,no. 111. University of Utah, Salt Lake City, pp. 71–74.
Wejnert, B., 2002. Integrating models of diffusion of innovations: a conceptualframework. Ann. Rev. Sociol. 297–326.