Embed Size (px)
Citation preview

A tale of two functions: enzymatic activity andtranslational repression by carboxyltransferaseGlen Meades Jr, Brian K. Benson, Anne Grove and Grover L. Waldrop*
Division of Biochemistry and Molecular Biology, Louisiana State University, Baton Rouge, LA 70803, USA
Received August 17, 2009; Revised November 2, 2009; Accepted November 4, 2009
ABSTRACT
Acetyl-CoA Carboxylase catalyzes the first commit-ted step in fatty acid synthesis. Escherichia coliacetyl-CoA carboxylase is composed of biotincarboxylase, carboxyltransferase and biotincarboxyl carrier protein functions. The accA andaccD genes that code for the a- and b-subunits,respectively, are not in an operon, yet yield an a2b2
carboxyltransferase. Here, we report thatcarboxyltransferase regulates its own translationby binding the mRNA encoding its subunits. Thisinteraction is mediated by a zinc finger on theb-subunit; mutation of the four cysteines to alaninediminished nucleic acid binding and catalyticactivity. Carboxyltransferase binds the codingregions of both subunit mRNAs and inhibits transla-tion, an inhibition that is relieved by the substrateacetyl-CoA. mRNA binding reciprocally inhibitscatalytic activity. Preferential binding of carboxyl-transferase to RNA in situ was shown usingfluorescence resonance energy transfer. Wepropose an unusual regulatory mechanism bywhich carboxyltransferase acts as a ‘dimmerswitch’ to regulate protein production and catalyticactivity, while sensing the metabolic state of the cellthrough acetyl-CoA concentration.
INTRODUCTION
Acetyl-CoA carboxylase (ACCase, EC 6.4.1.2) catalyzesthe first committed step in fatty acid biosynthesis in allorganisms. The overall reaction is the biotin-dependentcarboxylation of acetyl-CoA to form malonyl-CoA andit takes place in two separate half-reactions.
The first half-reaction is catalyzed by biotincarboxylase, where ATP is used to activate bicarbonatefor carboxylation of biotin. The natural substrate is thebiotin carboxyl carrier protein (designated asEnzyme-biotin in the above scheme). The secondhalf-reaction, catalyzed by carboxyltransferase, transfersthe activated carboxyl group from carboxybiotin toacetyl-CoA to form malonyl-CoA. In eukaryotes, eachof the three different proteins, biotin carboxylase, biotincarboxyl carrier protein and carboxyltransferase formindividual domains in a single polypeptide chain. Incontrast, Escherichia coli encodes separate polypeptidesgenerating a homodimeric biotin carboxylase (BC),biotin carboxyl carrier protein (BCCP) and an a2b2heterotetrameric carboxyltransferase (CT) (1).Because the reaction involves two separate
half-reactions, coordinated expression of the genescoding for the various subunits of bacterial ACCase isessential in order to achieve efficient conversion ofsubstrate to product. This is readily accomplished forthe first half-reaction because the genes coding for biotincarboxylase (accC) and the biotin carboxyl carrier protein(accB) are in a single operon that is transcriptionally con-trolled (2,3). However, the genes encoding the CT a (accA)and CT b (accD) subunits are not in an operon, but arefound on nearly opposite poles of the chromosome (4.50
and 52.40, respectively) in opposing directions (4,5). Yet,the expression of accA and accD should yieldstoichiometric amounts of the a- and b-subunits to formthe a2b2 heterotetramer of CT. Sequence analyses revealno obvious clues to a mechanism of concerted expressionof accA and accD, however, an alternative totranscriptional control for modulating expression ofaccA and accD has been suggested (2).The crystal structures of both E. coli (PDB: 2f9y) and
Staphylococcus aureus (PDB: 2f9i) CT reveal a Cys4-typezinc ribbon motif on the b-subunit (6) (Figure 1). The zinc
(1) Enzyme-biotin + MgATP + HCO3-
Mg2+
Enzyme-biotin-CO2- + MgADP + Pi
(2) Enzyme-biotin-CO2- + Acetyl CoA Malonyl CoA + Enzyme-biotin
*To whom correspondence should be addressed. Tel: +1 225 578 5209; Fax: +1 225 578 7258; Email: [email protected]
Published online 3 December 2009 Nucleic Acids Research, 2010, Vol. 38, No. 4 1217–1227doi:10.1093/nar/gkp1079
� The Author(s) 2009. Published by Oxford University Press.This is an Open Access article distributed under the terms of the Creative Commons Attribution Non-Commercial License (http://creativecommons.org/licenses/by-nc/2.5), which permits unrestricted non-commercial use, distribution, and reproduction in any medium, provided the original work is properly cited.
Downloaded from https://academic.oup.com/nar/article-abstract/38/4/1217/3112436by gueston 29 January 2018
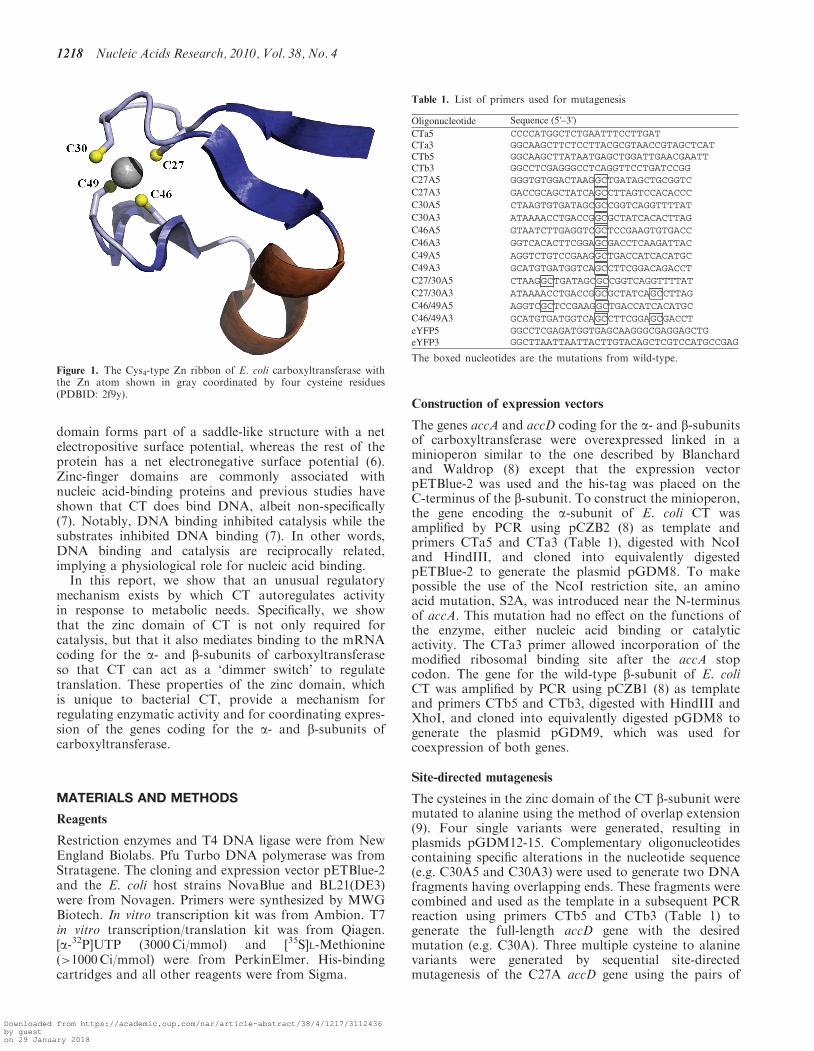
domain forms part of a saddle-like structure with a netelectropositive surface potential, whereas the rest of theprotein has a net electronegative surface potential (6).Zinc-finger domains are commonly associated withnucleic acid-binding proteins and previous studies haveshown that CT does bind DNA, albeit non-specifically(7). Notably, DNA binding inhibited catalysis while thesubstrates inhibited DNA binding (7). In other words,DNA binding and catalysis are reciprocally related,implying a physiological role for nucleic acid binding.In this report, we show that an unusual regulatory
mechanism exists by which CT autoregulates activityin response to metabolic needs. Specifically, we showthat the zinc domain of CT is not only required forcatalysis, but that it also mediates binding to the mRNAcoding for the a- and b-subunits of carboxyltransferaseso that CT can act as a ‘dimmer switch’ to regulatetranslation. These properties of the zinc domain, whichis unique to bacterial CT, provide a mechanism forregulating enzymatic activity and for coordinating expres-sion of the genes coding for the a- and b-subunits ofcarboxyltransferase.
MATERIALS AND METHODS
Reagents
Restriction enzymes and T4 DNA ligase were from NewEngland Biolabs. Pfu Turbo DNA polymerase was fromStratagene. The cloning and expression vector pETBlue-2and the E. coli host strains NovaBlue and BL21(DE3)were from Novagen. Primers were synthesized by MWGBiotech. In vitro transcription kit was from Ambion. T7in vitro transcription/translation kit was from Qiagen.[a-32P]UTP (3000Ci/mmol) and [35S]L-Methionine(>1000Ci/mmol) were from PerkinElmer. His-bindingcartridges and all other reagents were from Sigma.
Construction of expression vectors
The genes accA and accD coding for the a- and b-subunitsof carboxyltransferase were overexpressed linked in aminioperon similar to the one described by Blanchardand Waldrop (8) except that the expression vectorpETBlue-2 was used and the his-tag was placed on theC-terminus of the b-subunit. To construct the minioperon,the gene encoding the a-subunit of E. coli CT wasamplified by PCR using pCZB2 (8) as template andprimers CTa5 and CTa3 (Table 1), digested with NcoIand HindIII, and cloned into equivalently digestedpETBlue-2 to generate the plasmid pGDM8. To makepossible the use of the NcoI restriction site, an aminoacid mutation, S2A, was introduced near the N-terminusof accA. This mutation had no effect on the functions ofthe enzyme, either nucleic acid binding or catalyticactivity. The CTa3 primer allowed incorporation of themodified ribosomal binding site after the accA stopcodon. The gene for the wild-type b-subunit of E. coliCT was amplified by PCR using pCZB1 (8) as templateand primers CTb5 and CTb3, digested with HindIII andXhoI, and cloned into equivalently digested pGDM8 togenerate the plasmid pGDM9, which was used forcoexpression of both genes.
Site-directed mutagenesis
The cysteines in the zinc domain of the CT b-subunit weremutated to alanine using the method of overlap extension(9). Four single variants were generated, resulting inplasmids pGDM12-15. Complementary oligonucleotidescontaining specific alterations in the nucleotide sequence(e.g. C30A5 and C30A3) were used to generate two DNAfragments having overlapping ends. These fragments werecombined and used as the template in a subsequent PCRreaction using primers CTb5 and CTb3 (Table 1) togenerate the full-length accD gene with the desiredmutation (e.g. C30A). Three multiple cysteine to alaninevariants were generated by sequential site-directedmutagenesis of the C27A accD gene using the pairs of
Figure 1. The Cys4-type Zn ribbon of E. coli carboxyltransferase withthe Zn atom shown in gray coordinated by four cysteine residues(PDBID: 2f9y).
Table 1. List of primers used for mutagenesis
Oligonucleotide CTa5 CTa3 CTb5 CTb3 C27A5 C27A3 C30A5 C30A3 C46A5 C46A3 C49A5 C49A3 C27/30A5 C27/30A3 C46/49A5 C46/49A3 eYFP5 eYFP3
CCCCATGGCTCTGAATTTCCTTGAT GGCAAGCTTCTCCTTACGCGTAACCGTAGCTCAT GGCAAGCTTATAATGAGCTGGATTGAACGAATT GGCCTCGAGGGCCTCAGGTTCCTGATCCGG GGGTGTGGACTAAGGCTGATAGCTGCGGTC GACCGCAGCTATCAGCCTTAGTCCACACCC CTAAGTGTGATAGCGCCGGTCAGGTTTTAT ATAAAACCTGACCGGCGCTATCACACTTAG GTAATCTTGAGGTCGCTCCGAAGTGTGACC GGTCACACTTCGGAGCGACCTCAAGATTAC AGGTCTGTCCGAAGGCTGACCATCACATGC GCATGTGATGGTCAGCCTTCGGACAGACCT CTAAGGCTGATAGCGCCGGTCAGGTTTTAT ATAAAACCTGACCGGCGCTATCAGCCTTAG AGGTCGCTCCGAAGGCTGACCATCACATGC GCATGTGATGGTCAGCCTTCGGAGCGACCT GGCCTCGAGATGGTGAGCAAGGGCGAGGAGCTG GGCTTAATTAATTACTTGTACAGCTCGTCCATGCCGAG
Sequence (5'–3')
The boxed nucleotides are the mutations from wild-type.
1218 Nucleic Acids Research, 2010, Vol. 38, No. 4
Downloaded from https://academic.oup.com/nar/article-abstract/38/4/1217/3112436by gueston 29 January 2018

primers C46A5 and C46A3, C46/49A5 and C46/49A3,and C27/30A5 and C27/30A3. All constructs weresequenced to confirm the mutations and verify therewere no other changes.
Expression, purification and enzymatic assay
The plasmids encoding wild-type and CT variants weretransformed into E. coli BL21(DE3) and grown asdescribed by Blanchard and Waldrop (8) with the follow-ing exceptions. The temperature was reduced to 25�Cprior to induction with 2.8mM b-lactose. Expressedprotein was purified by nickel affinity chromatographyusing a HisSelect cartridge (Sigma) following the manu-facturer’s protocol. The wash buffer contained 10mMimidazole, 300mM NaCl, 50mM KH2PO4, pH 7.0 andthe elution buffer contained 200mM imidazole, 500mMNaCl, 20mM Tris–Cl, pH 8.0. Eluents were subjected to24 h dialysis first against 134mM KCl, 1mM Na2EDTA,10mM KH2PO4, pH 7.0 and second against 500mM KCl,10mM HEPES, pH 7.0, followed by concentration to0.5–10mg/ml using Amicon Ultra 4 (Millipore) centrif-ugal concentrators with a 10 000 molecular weightcutoff. CT activity was measured in the reverse, ornon-physiological, direction with a spectrophotometricassay in which the production of acetyl-CoA wascoupled to citrate synthase and malate dehydrogenasereactions (8). NADH formation was followed spectropho-tometrically at 340 nm using a Uvikon 810 (KontronInstruments) spectrophotometer interfaced to acomputer equipped with a data acquisition program.
Inactivation studies
Enzyme modification by N-ethylmaleimide (NEM) wasperformed in 500mM KCl, 10mM HEPES, pH 7.0. ForNEM inactivation, reactions were initiated by the additionof NEM to the CT solution at a final concentration of4mM. An aliquot was removed every 5min and assayedfor enzymatic activity. The aliquots were of sufficientlysmall volume compared with the assay volume such thatthe modifying agents were diluted 50-fold.
Data analysis
The kinetic parameters Km and Vmax were determined bynonlinear regression analysis. The initial velocities versusthe substrate concentration were fitted to the Michaelis–Menten equation using the programs of Cleland (10). Thedissociation constant (Kd) for RNA binding was deter-mined using the program Enzfitter. The binding isothermsfor CT binding to RNA were analyzed by fitting the datato Equation 1, where Kd reflects half maximal saturation,Y is the fractional complex, X is concentration of CT andYmax is the maximal complex or horizontal asymptote.
Y ¼ Ymax � X = ðKd þ XÞ 1
Zinc determination and circular dichroism
The molar ratio of Zn to CT tetramer was determinedusing Atomic Absorption Spectroscopy using a VarianSpectra AA 220 Atomic Absorption Spectrometer
equipped with a zinc lamp and absorption recorded at213.9 nm. Protein concentrations for wild-type andvariants ranged from 15 to 50 mM. CD spectra wererecorded on an AVIV Model 202 CD spectropolarimeterusing a 1 cm pathlength quartz cuvette. Data points wereaveraged from triplicate scans from 200 to 250 nm.Spectra for wild-type and each variant were recorded at25�C at a protein concentration of 0.1mg/ml in a buffer of500mM KCl, 10mM HEPES, pH 7.0.
DNA Electrophoretic mobility shift assay
Wild-type CT and variants were incubated for 0.5 h at25�C with an 800 bp linear dsDNA at final concentrationsof 0.88mM and 50 nM, respectively. The DNA wasobtained by gel extraction following PCR using primersC46A5 and CTb3 and the accD gene as the template. Afteraddition of glycerol to a final concentration of 2.5%,samples were resolved on 0.8% (w/v) agarose gels in1�TAE (40mM Tris–Cl at pH 8.0, 20mM acetate,1mM Na2EDTA) followed by staining with ethidiumbromide and visualized by UV irradiation.
In vitro transcription and RNA electrophoretic mobilityshift assay
A cell-free extract was used to produce mRNA using theMEGAscript Kit (Ambion) following the manufacturer’sprotocol with 0.2mg PCR product as the template. Each20 ml reaction contained [a-32P]UTP at 167 nM. The reac-tions also contained 7.5mM ATP, CTP, GTP and3.75mM UTP. The resultant mRNA was purifiedaccording to the manufacturer’s instructions with theMEGAclear Kit (Ambion) and eluted in 100 ml, to whichwas added 20 ml of 80% glycerol and 20 ml of 10�EMSAbuffer (200mM Tris–Cl at pH 8.0, 1mM Na2EDTA,500mM NaCl, 50mM MgCl2). Seven microliter of thissolution was added to each 10 ml reaction, with CTtitrated from 0 to 1 mM in the remaining 3 ml. Forthe inhibition of RNA binding, acetyl-CoA was titratedfrom 0 to 4.0mM. Reactions were incubated on icefor 0.5 h. Samples were loaded with the power on ontoprerun 5.0% (w/v) native polyacrylamide gels (39: 1acrylamide:bisacrylamide) and electrophoresed at roomtemperature in TBE buffer (45mM Tris borate at pH8.3, 1.25mM Na2EDTA). After 3–6 h of electrophoresis,the gels were dried and complexes were visualized by phos-phorimaging and quantified using Molecular DynamicsImageQuant software. The protein–RNA complex wasdefined as the slowest migrating band on the gel, whilefree RNA was the lower band. For calculating percentcomplex formation, the region on the gel from theslowest migrating complex to the free nucleic acid wasconsidered as complex. The percent complex was cal-culated as complex intensity divided by total intensity(complex plus free RNA). Each gel shift was done in atleast duplicate.
Coupled in vitro transcription/translation
Translation repression of the mRNA encoding the a- andb-subunits via CT binding was examined using a coupledin vitro transcription/translation system. The EasyXpress
Nucleic Acids Research, 2010, Vol. 38, No. 4 1219
Downloaded from https://academic.oup.com/nar/article-abstract/38/4/1217/3112436by gueston 29 January 2018

Protein Synthesis System (Qiagen) was used following themanufacturer’s protocol with 1 mg (�10 nM) plasmid orunlabeled mRNA as templates. To examine the effect ofCT on the expression of both genes simultaneously,pCZB5 was used as a template. The plasmid pCZB5 isan expression vector of similar construction to pGDM9and contains the accA and accD genes in tandem with highlevels of overexpression from those genes (8). The abilityof CT to attenuate translation of only the mRNA forthe b-subunit utilized the vector pGLW39, whichcontains only the accD gene cloned into pET28. Theproteins expressed from these templates were visualizedby polyacrylamide gel electrophoresis, where each 50 mlreaction contained 5 mCi of [35S]L-Methionine. Thereaction mixtures were run on 5.0% (w/v) denaturingpolyacrylamide gels (39:1 acrylamide:bisacrylamide,2.5% SDS) at 2V/cm for 10–12 h and dried. Bands werevisualized by phosphorimaging. Each assay was done intriplicate.
Detection of CT–RNA interaction in situ
Detection of CT binding to RNA in situ was accomplishedusing a fluorescence resonance energy transfer (FRET)assay with a CT b-enhanced yellow fluorescent protein(eYFP) fusion protein as the donor and the RNAbinding dye Sytox Orange (Molecular Probes) as theacceptor. The gene for eYFP was amplified with primerseYFP5 and eYFP3, digested with XhoI and PacI, andcloned into equivalently digested pGDM9 and pGDM18to generate pGDM24 and pGDM25, respectively. The useof XhoI and PacI restriction sites eliminates thevector-encoded His6-tag and stop codon, while placingthe stop codon following the coding region for the CTb-eYFP fusion protein. Plasmid pGDM24 containswild-type CT-eYFP fusion and pGDM25 contains thequadruple cysteine variant of CT-eYFP fusion. E. coliBL21(DE3) harboring the plasmids pGDM24 andpGDM25 were grown at 37�C until the A600 reached0.7, at which point lactose was added to 28mM.Samples of 100 ml were collected just prior to inductionwith lactose, and every 0.5 h afterward for 3 h and flashfrozen in liquid nitrogen. Each sample was then thawedand divided equally into thirds. The divided samples wereeither left as is, subjected to 0.3 mg/ml RNase A (Qiagen),or 1.0 U/ml DNase I for 0.5 h at 37�C. Sytox Orange is ahigh-affinity nucleic acid stain that readily enters cells withcompromised membranes. The dye was added to controland nuclease treated cells to a final concentration of250 nM. There is considerable overlap of YFP emissionand Sytox Orange absorption spectra; the Foersterdistance (R0) is 5.6 nm. Spectra were collected using aJasco FP-6300 spectrofluorometer equipped to hold a3 � 3mm quartz cuvette. A 500 nm incident light wasused to achieve sufficient FRET with minimal direct exci-tation of the acceptor. Emission spectra were measuredperpendicular to the incident light at 540–600 nm toavoid the peak due to refracted light and to sufficientlyspan the absorption maximum of 573 nm when the stain isbound to nucleic acid. Each assay was done in triplicate.
RESULTS
The Zn domain is required for catalysis andnucleic acid binding
The Zn finger of CT is a member of the Cys4-type family,with the divalent metal coordinated in a tetrahedralfashion by four cysteine sulfhydryl groups (Figure 1).Each of the cysteines (residues 27, 30, 46 and 49)coordinating the zinc atom were mutated to alanine indi-vidually followed by multiple mutations to remove two(double; C27A, C46A), three (triple; C27A, C46A,C49A), and all four (quadruple) cysteines.
The effect of the cysteine mutations on enzymaticactivity was assessed using a coupled enzyme assaywhere the reaction is run in the non-physiological direc-tion in which malonyl-CoA and biocytin [biocytin is abiotin molecule with a lysine affixed to the carboxylgroup of the valeric acid side chain via an amide linkageat the e-amino group and is preferred over biotin in thisassay because it produces a maximal velocity three ordersof magnitude greater than does biotin (8)] are thesubstrates. The kinetic results indicate that mutation ofindividual cysteine residues 27, 46 and 49 decreases theVmax only 8- to 11-fold, whereas the Vmax for the C30Avariant decreases by over 100-fold (Table 2). Similarresults were obtained with analogous mutations to theCys4-type zinc finger of pea plastidic ACCase CT b (11).Mutation of a single cysteine has only small effects on theMichaelis constant for both substrates, biocytin andmalonyl-CoA. None of the multiple site variants havemeasureable activity. The results suggest that theZn-finger cysteines are not directly involved in substratebinding, but rather play a role in the catalytic step orproduct release.
The decrease in activity as a result of mutating thecysteines in the zinc domain explains earlier observationsthat the thiol modifying reagent N-ethylmaleimide(NEM) inactivated carboxyltransferase and that thesubstrate malonyl-CoA protected against inactivation(8). Reaction of NEM with the most active single-site
Table 2. Steady state kinetic parameters for wild-type CT and
variants
Construct Vmax
(min�1)Km (biocytin,mM)
Km
(malonyl-CoA, mM)
Wild-type CT 211±7 11.4±0.4 40.0±5.6C27A 22.8±1.4 11.5±0.5 53.2±9.2C30A 1.5±0.2 5.0±1.1 20.2±2.4C46A 18.8±0.7 4.0±0.7 72.2±10.4C49A 26.7±0.9 9.7±0.6 106.8±9.8C27/46A ‘double’ 0C27/46/49A ‘triple’ 0C27/30/46/49A
‘quadruple’0
The apparent maximal velocities and Michaelis constant for biocytinwere obtained by varying biocytin while holding malonyl-CoA constantat 100mM. The apparent Michaelis constant for malonyl-CoA wasobtained by varying malonyl-CoA while holding biocytin constant at20mM. The standard errors on Vmax and Km were determined from thenonlinear regression analysis.
1220 Nucleic Acids Research, 2010, Vol. 38, No. 4
Downloaded from https://academic.oup.com/nar/article-abstract/38/4/1217/3112436by gueston 29 January 2018

variants (C27A, C46A and C49A) showed less susceptibil-ity to NEM when normalized and compared to wild-type(data not shown), which is consistent with NEM modify-ing these cysteine residues in the zinc domain and inturn affecting enzymatic activity. In addition, thelocation of the zinc domain on the b-subunit (whichcontains the malonyl-CoA binding site) is consistentwith malonyl-CoA protecting against inactivation.
Mutation of the cysteines in the zinc domain not onlyaffected catalytic activity but also nucleic acid binding. Anelectrophoretic mobility shift assay (EMSA) was used toassess the effect of the mutations on CT binding to DNA(Figure 2). CT with single substitutions at positions 27, 46and 49 appear to exhibit diminished DNA-bindingcapacity as evidenced by complex dissociation duringelectrophoresis, while the C30A variant and the multiplecysteine variants fail to form stable complexes with theDNA. Thus, the zinc-finger cysteines are required forDNA-binding, as expected.
Substitution of the cysteines likely altered theelectrostatic structure of the zinc finger, resulting in theloss of zinc coordination. The effect of the mutations onthe molar zinc content was determined using atomicabsorption spectroscopy. Wild-type CT had two zincatoms per CT tetramer as predicted from the structure.CT with single-site substitutions at cysteines 27, 46 and49 contained 1.2–1.3 zinc atoms per CT tetramer, whilethe C30A variant had only 0.76 zinc atoms per CTtetramer. CT variants with multiple substitutions showprogressively lower occupancies decreasing from 0.52 to0.29 molar ratios. Circular dichroism spectroscopywas used to determine if the mutations had an effect onthe overall secondary structure. CT variants C30A, C46Aand C49A show spectra similar to wild-type CT(Supplementary Figure S1). The spectra for the C27Aand variants with double and triple substitutions show suc-cessive changes in the 205–215 nm range; the spectrum ofCT lacking all four cysteines has much more extensive
changes ranging from 205 to as far as 240 nm. Theeffects of the mutations on catalysis and nucleic acidbinding are likely due to loss of the zinc atom and alter-ation in secondary structure and they clearly demonstratethat the zinc domain is the structural feature of CT thatlinks nucleic acid binding with catalysis.
Carboxyltransferase binds preferentially to the a- andb-subunit mRNA
Earlier DNA binding studies showed that DNA bindingwas non-specific and cooperative with half-maximalsaturation of about 1 mM for a variety of DNA sequences,indicating that DNA binding was not likely to be thephysiological role of the zinc domain of carboxyl-transferase (7). However, considering that the closeststructural homolog of the carboxyltransferaseZn-domain is the zinc domain from the 50S ribosomalprotein L37Ae (6), the ability of carboxyltransferase tobind RNA was investigated. Four different types ofRNA were tested for their ability to inhibit formation ofthe CT–DNA complex. The RNA molecules consideredincluded mRNA coding for the a-subunit, mRNA codingfor the b-subunit, a total RNA extract from E. coli, andtRNA from Saccharomyces cerevisiae. All four types ofRNA were found to inhibit formation of the CT–DNAcomplex (data not shown). Notably, a qualitative compar-ison of the data showed that mRNA coding for the a- andb-subunits inhibited complex formation more effectively.A transcript including the a-subunit mRNA starting213 nt upstream of the AUG through the end of the struc-tural gene was therefore used in an EMSA (Figure 3).In contrast to the sigmoidal binding isotherm obtainedfor carboxyltransferase binding to DNA, fractionalcarboxyltransferase–RNA complex formation is best fitto a hyperbolic curve, yielding a half-maximal bindingconstant (Kd) of 145±9nM, which is about 7-foldlower than the half-maximal saturation for DNAbinding. When the data were fitted to the Hill equationa Hill coefficient of �1 was calculated, indicating a lack ofcooperativity (not shown). Moreover, the data were alsoanalyzed according to Hensley et al. (12), which usesvarious linear transformations to detect a low degree ofpositive cooperativity. These analyses also indicate thatthe degree of cooperativity for subunit mRNA bindingto carboxyltransferase is either very small or nonexistent.The tighter binding and hyperbolic binding isotherm forcarboxyltransferase mRNA complex formation maysuggest preferred binding to specific sites.
The CT binding site is within the a- and b-subunit mRNAcoding region
To determine the region(s) of mRNA to which CT isbinding, a series of linear DNA templates were con-structed from which mRNAs of various lengths weretranscribed using runoff transcription (Figure 4).Electrophoretic mobility shift assays were used tomeasure the Kd for each RNA construct binding towild-type CT. Starting with the natural transcriptionstart site of accA and ending with the stop codon,the 1183 nt transcript yielded a Kd of 136±10nM.
Figure 2. An ethidium bromide-stained 0.8% agarose gel image ofDNA binding by CT and variants. Lanes 1–9 contain an 800 bplinear dsDNA with the following proteins: 1, no protein; 2, wtCT; 3,C27A; 4, C30A; 5, C46A; 6, C49A; 7, double variant; 8, triple variant;9, quadruple variant.
Nucleic Acids Research, 2010, Vol. 38, No. 4 1221
Downloaded from https://academic.oup.com/nar/article-abstract/38/4/1217/3112436by gueston 29 January 2018

Systematic truncation of the 30-end by successive �300 ntdeletions generated a 886 nt CT a RNA to which CTbound more tightly with a Kd of 48±8nM, whilefurther truncation resulted in a marked decrease in theability of CT to bind the RNA. The shortest transcriptsconsisting only of the 50 UTR yielded no complex on incu-bation with CT. To confirm that the 50 UTR region is notinvolved in CT binding, similar sized templates were madewithout the 50 UTR and tested for CT binding. Thelongest transcript lacking the 50 UTR but containing theentire a-subunit coding region (966 nt) bound to CT with aKd of 250 ± 20nM. The 684 nt transcript representing a30-truncation yielded a CT–RNA complex, however thefractional complex could not be measured due to the exis-tence of numerous CT–RNA complexes comigrating withfree RNA. The shortest transcript (328 nt) showed noability to bind to CT.
A series of templates similar to the ones described abovefor accA were also made for the accD coding region(Figure 4). The 50 UTR was excluded from the accDtranscripts because it was found not to play a role in CTbinding to accA mRNA. The transcript (912 nt) contain-ing the entire open reading frame of CT b had a Kd of290±20nM, while truncating 228 nt from the 30-end(684 nt transcript) resulted in a decrease in Kd to83±9nM. This pattern for the two longest transcriptswas also observed with accA. Moreover, just as withaccA, shorter transcripts of accD bound CT only poorly.
Comparison of the a- and b-subunit mRNA regionsrequired for CT binding reveals a striking similarity. Forboth subunits, 684 nt fragments beginning at the start siteswere optimal. Within this sequence were 356 nt in amRNA, and 335 nt in b mRNA that translate into
Figure 4. mRNA in vitro transcription products.
Figure 3. (A) Electrophoretic analysis of the transcript from CTa-subunit titrated with CT. (A) All lanes contain 50 fmol 32P-labeledmRNA, while lanes 2–15 contain 1.0, 5.0, 10, 25, 40, 55, 70, 85, 100,200, 300, 400, 500 and 600 nM CT. (B) Binding isotherm for CTbinding to the transcript from CT a-subunit. The points representaverages from triplicate measurements. The error bars shown are thestandard deviation. The curve represents the best fit of the data toEquation 1. No conclusions about the stoichiometry of binding canbe made from this curve.
1222 Nucleic Acids Research, 2010, Vol. 38, No. 4
Downloaded from https://academic.oup.com/nar/article-abstract/38/4/1217/3112436by gueston 29 January 2018

regions of higher amino acid sequence homology (41%)compared to the alignment of the entire protein sequence(30%). This region of the mRNA of the a- and b-subunitswill be hereafter referred to as the ‘symmetry box’. AllRNA constructs from either subunit that excluded thisregion lacked the ability to bind CT, suggesting its contri-bution to enzyme recognition. Two additional templateswere constructed consisting of only the regions from eachgene representing this symmetry box to determine whetherthese regions are not only necessary, but sufficient for CTbinding. Neither transcript had any affinity for CT,indicating that regions upstream of the symmetry boxare also necessary for CT binding. The upstream regionand the symmetry box must be connected for binding toCT because simply combining the two regions individuallydid not result in CT binding for either mRNA (data notshown).
Carboxyltransferase inhibits translation of a- andb-subunit mRNA
If CT binds to the mRNA coding for the a- andb-subunits, then does CT binding inhibit translation ofthe mRNA? This question was addressed using anin vitro coupled transcription/translation reaction. ThemRNA for both a- andb-subunits was generated by tran-scription from a plasmid containing the genes for bothsubunits. The reaction was carried out in the presence of35S-labeled methionine, and products separated on apolyacrylamide gel and visualized by phosphorimaging(Figure 5). Increasing amounts of unlabeled wild-typeCT added to the reaction prior to initiation by additionof plasmid progressively decreased the in vitro synthesis ofCT (Figure 5, lanes 6–10). The decrease in expression inthe presence of unlabeled CT is not due to an inhibition oftranscription because CT also inhibited translation whenan mRNA transcript was used to initiate expression(Figure 5A, lanes 3 and 4). The inhibition of translationwas partially reversed by the addition of the substrateacetyl-CoA, indicating a reversible competition betweenmRNA and substrate and consistent with the notionthat nucleic acid binding and catalysis are mutually exclu-sive (Figure 5A, lanes 11–15). To ensure that CT bindingto a mRNA does not affect translation of the b-subunit,the ability of CT to inhibit translation of the b-subunitmRNA was examined. The coupled transcription/transla-tion reaction from a plasmid containing only the accDgene showed that CT does indeed inhibit translation ofthe b-subunit mRNA (Figure 5B, lanes 4–7). The inhibi-tion was again relieved by the substrate acetyl-CoA(Figure 5B, lanes 8–11). The inhibition of translationwas specific for the mRNA coding for the a- andb-subunits because CT did not inhibit translation of thegene coding for the 32 kDa elongation factor EF-Ts whichwas provided as a control in the in vitro coupled transcrip-tion/translation reaction (Figure 5C). Reinforcing the roleof the zinc domain in nucleic acid binding, addition of thequadruple variant of CT had no effect on the level oftranslation (data not shown.)
To confirm that acetyl-CoA relieved inhibition of trans-lation by reversible competition between mRNA and the
substrate acetyl-CoA, inhibition of CT–RNA complexformation by acetyl-CoA was examined. The transcript(912 nt) containing the entire open reading frame of CTb was incubated with 166 nM CT and increasing amountsof acetyl-CoA (Figure 6A). With increasing [acetyl-CoA],a concomitant decrease in CT–RNA complex formation isevident. This demonstrates reversible competition betweenmRNA and substrate. Conversely, since the substrateacetyl-CoA inhibited the binding of CT to RNA, andgiven that catalysis and nucleic acid binding in CT arelinked through the zinc domain, RNA should inhibitcatalysis as well. An 1183 nt CT a mRNA was found toinhibit CT activity in a dose-dependent manner, withnearly a 4-fold drop in activity at 90 nM (Figure 6B).
Figure 5. Five percent denaturing polyacrylamide gels of in vitrocoupled transcription/translation reactions expressing 35S-labeledproteins. (A) Lane 1, no DNA template. Lane 2, positive control testplasmid encoding the 32 kDa elongation factor EF-Ts protein. Lane 3,polycistronic mRNA generated in vitro from pCZB5 plasmid showingCT a (37 kDa) and CT b (33 kDa). Lane 4, same as lane 3 with theaddition of 166nM unlabeled wild-type CT to the transcription/trans-lation reactions. Lanes 5–15 contain 1 mg (�10 nM) pCZB5 plasmid.Lanes 5–10 contain 0, 63, 125, 250, 500 and 1000 nM unlabeledwild-type CT. Lanes 10–15 contain 1 mM unlabeled wild-type CT andacetyl-CoA at 0, 88, 175, 350, 700 and 1400 mM. (B) Lane 1, no DNAtemplate. Lane 2, positive control test plasmid showing a 32kDaprotein. Lane 3–11 contain 1 mg (�10nM) pGLW39 plasmid. Lanes3–7 contain 0, 63, 125, 250 and 1000 nM unlabeled wild-type CT.Lanes 7–11 contain 1 mM unlabeled wild-type CT and acetyl-CoA at0, 175, 350, 700 and 1400 mM. (C) Lane 1, no DNA template. Lanes2–8 contain positive control test plasmid as in (A), lane 2. Lanes 3–8contain 31, 63, 125, 250, 500 and 1000 nM unlabeled wild-type CT.
Nucleic Acids Research, 2010, Vol. 38, No. 4 1223
Downloaded from https://academic.oup.com/nar/article-abstract/38/4/1217/3112436by gueston 29 January 2018

As a control, CT retained >80% activity in the presence ofa 90 nM 1040 nt mRNA coding for EF-Ts (Figure 6B);that EF-Ts inhibits CT activity at higher concentrationsis consistent with the nonspecific binding to nucleic acidsreflected in DNA binding. These results confirm thatmRNA binding to CT inhibits enzymatic activity.
CT–RNA interaction occurs in situ
CT binds to RNA in vitro, but does CT interact with RNAin the context of a cell? To address this issue, a FRET(fluorescence resonance energy transfer) assay was used.The assay is based on the work of Lorenz (13) and utilizedeYFP (enhanced yellow fluorescent protein) fused towildtype or the quadruple variant of CT b as the donorand the nucleic acid stain Sytox Orange as the acceptor.Cells containing plasmids where the genes for CT a andeither wildtype CT b fused to eYFP or quadruple variantCT b fused to eYFP were induced to express the CT aand CT b-eYFP fusion proteins. After 0–3 h, samples werefreeze-thawed followed by various nuclease digestions.Sytox Orange was added to the treated cells and fluores-cence was measured to determine proximity of CT b-eYFPto nucleic acid-bound stain. As shown in Figure 7 a FRETsignal was observed only after induction of protein expres-sion (blue trace). The maximal signal occurred 1 h afterinduction with no change up to 3 h post-induction. Little
to no signal was detected prior to induction (purple trace).Since Sytox Orange can also bind to DNA, cells weretreated with DNase or RNase in order to confirm thesignal is a result of RNA interaction. Treatment withDNase I had little effect on the fluorescence signal (redtrace); however, digestion with RNase A attenuated thesignal to near pre-induction levels (green trace). The qua-druple variant-eYFP fusion protein showed no FRETsignal consistent with its inability to bind nucleic acids(orange trace). These data indicate that in situ theprimary nucleic acid binding target of CT is RNA.While these results show that CT prefers to bind toRNA over DNA in the cell, they do not address thequestion of RNA specificity. As a control, the CTb-eYFP fusion protein was expressed, purified, andshown in vitro to exhibit fluorescence with 500 nmincident light. The emission peak at 547 nm dropssignificantly with a concomitant appearance of a newemission peak at 574 nm upon addition of Sytox Orangeto the sample (data not shown). This indicates a functionaldonor/acceptor pair for FRET with an excitation wave-length of 500 nm.
DISCUSSION
The zinc domain is required for enzymatic activity andtranslational repression
Site-directed mutagenesis of the zinc domain conclusivelyestablishes that it is the structural link between nucleicacid binding and catalysis. The coupling of nucleic acidbinding to catalysis implies a selective pressure tomaintain the zinc domain on the b-subunit and that theability to bind nucleic acids has a specific purpose; consis-tent with this inference, we find that CT binds RNAin situ. Notably, in vitro analyses demonstrate that CTpreferentially binds the mRNA encoding its own a- andb-subunits, implying the existence of an uncommon regu-latory mechanism.
Figure 6. (A) Electrophoretic analysis of the transcript from CTb-subunit titrated with CT. All lanes contain 50 fmol 32P-labeledmRNA, lane 1 contains only mRNA, while lanes 2–14 contain166 nM CT and acetyl-CoA at 0, 20, 50, 100, 200, 300, 400, 500,600, 750, 1000, 2000 and 4000mM. (B) RNA inhibition of CTactivity. Circles represent averages from triplicate measurements forreactions containing the 1040 nt EF-Ts transcript at 0, 11.3, 22.6,45.3 and 90.6 nM. Triangles represent averages from triplicate measure-ments for reactions containing the 1183 nt CT a transcript at 0, 11.6,23.2, 46.4 and 92.8 nM. The error bars shown are the standard devia-tion. Note that enzymatic reactions contain only 1mM KCl, conditionsunder which the affinity of CT for RNA is higher than that determinedfrom EMSA assays.
Figure 7. FRET emission scan showing absorption peak generated byincident light at 500 nm. Blue trace, wild-type CT fused to eYFP, 1 hpost-induction, not subjected to nucleic acid digestion. Purple trace,wild-type CT fused to eYFP, pre-induction, not subjected to nucleicacid digestion. Red trace, wild-type CT fused to eYFP, 1 hpost-induction, treated with DNase. Green trace, wild-type CT fusedto eYFP, 1 h post-induction, treated with RNase. Orange trace, qua-druple variant CT fused to eYFP, 1 h post-induction, not subjected tonucleic acid digestion.
1224 Nucleic Acids Research, 2010, Vol. 38, No. 4
Downloaded from https://academic.oup.com/nar/article-abstract/38/4/1217/3112436by gueston 29 January 2018

The binding of CT to the mRNA coding for the a- andb-subunits inhibited translation in a dose-dependentmanner, while the substrate acetyl-CoA inhibited RNAbinding and relieved the inhibition of translation also ina dose-dependent manner. Consistent with the couplednature of nucleic acid binding and catalysis by CT, themRNA also inhibited catalysis. These findings indicate aphysiological role for the zinc domain in regulating notonly production of the a- and b-subunits of CT, but alsoits enzymatic activity. The basic premise of the model ofregulation illustrated in Figure 8 is that in bacteria, fattyacids are only used for membrane biogenesis, hencecarboxyltransferase is only needed when nutrients areabundant. In contrast, during the stationary phase ofE. coli growth where nutrients are limited, carbo-xyltransferase would act as a ‘dimmer switch’ on theexpression of the a- and b-subunits by binding to themRNA and inhibiting translation. Reciprocally, RNAbinding by CT renders it catalytically inactive, limitingunneeded and wasteful conversion of acetyl-CoA tomalonyl-CoA. During the growth phase when nutrientsare abundant, the level of acetyl-CoA would increase dra-matically and compete with the mRNA for binding tocarboxyltransferase. This alleviates both the inhibition ofcatalytic activity and the repression of translation charac-teristic of stationary phase, leading to increased levels ofCT and ultimately fatty acids. The levels of acetyl-CoA inE. coli during the log phase (600 mM) and stationary phase(20 mM) (14) are in accord with the data in Figure 5A,because relief of translational repression was observed at350 mM acetyl-CoA, whereas very little protein productionwas observed at 88 mM acetyl-CoA. This model of regula-tion is also consistent with reports that levels of themRNA coding for the a- and b-subunits do not changeappreciably between the log and stationary phases (15,16).
The model of regulation in Figure 8 also provides aplausible explanation for how the cell maintains
stoichiometric amounts of the a- and b-subunits. Insteadof transcriptional control of gene expression of the genesfor the a- and b-subunits, bacteria appear to utilizetranslational repression where CT binds to the mRNAfor both of its subunits.The mechanism of gene regulation proposed here is not
without precedent. For example, thymidylate synthasefrom both E. coli and humans contains a Cys4-typezinc-binding motif and binds its own mRNA within theprotein-coding region, repressing translation (17–19).Also, it is important to note that this type of regulationis not found in eukaryotic carboxyltransferase because thea- and b-subunits are fused to one another as well as to theBC and BCCP components to form one polypeptide chainand because the zinc domain is absent (20). The one excep-tion to the multidomain homomeric ACCase found ineukaryotes is the heteromeric ACCase found in plastids.The chloroplast ACCase of all plants except for thegrasses (Graminae) consists of the same four subunits asE. coli ACCase, but their genetic origins are different (21).The BC, BCCP and CT a peptides originate fromnuclear-encoded genes and are shuttled to the chloroplast(22–24). The CT b protein, however, is expressed from achloroplast-encoded gene, and like the E. coli accD gene,encodes a Cys4-type zinc-binding domain, which is consis-tent with the theory that chloroplasts evolved from bacte-rial symbiosis (24). Perhaps the zinc domain in chloroplastCT b binds to the ;b mRNA to regulate translation in amanner similar to the model presented here for E. coli CT.
A symmetry-based model
The fundamental tenet of the gene regulation model pre-sented in Figure 8 rests on the ability of CT to bind themRNA encoding both a- and b-subunits. The molecularbasis of how it does so is rooted in the symmetry of thechemical mechanism and 3D structure of CT. Transfer ofthe carboxyl group from carboxybiotin to acetyl-CoA
Figure 8. Proposed mechanism for autoregulation of CT enzymatic activity and mRNA translation. The RNA-binding and catalytic functions of CTare sensitive to the metabolic state of the cell. During stationary phase when de novo fatty acid synthesis is unneeded, glucose and thus acetyl-CoAlevels are low, allowing CT to bind the mRNA for its subunits, attenuating expression of the enzyme as well as enzymatic activity on remainingacetyl-CoA stores.During log phase growth membrane biogenesis is needed. Glucose is abundant, increasing the availability of acetyl-CoA for fattyacid synthesis. Acetyl-CoA binds to CT permitting translation of the mRNA for the a- and b-subunits. This ‘dimmer switch’ model gives the cell ameans of rapid response to changes in cellular metabolic state.
Nucleic Acids Research, 2010, Vol. 38, No. 4 1225
Downloaded from https://academic.oup.com/nar/article-abstract/38/4/1217/3112436by gueston 29 January 2018
involves formation of enolate or enolate-like anions inboth carboxybiotin and acetyl-CoA. To this end, boththe a- and b-subunits have evolved tertiary folds that sta-bilize oxyanions. Acetyl-CoA binds to the b-subunit, whilecarboxybiotin binds to the a-subunit and the tertiarystructure of both the a- and b-subunits contain a similara/b spiral core of two b-sheets surrounded by a-helicessuggesting a gene duplication event. This type of foldplaces carboxyltransferase in the crotonase superfamilyof enzymes whose members all catalyze reactions thatgenerate enolate anions (25,26). Within the spiral core ofboth the a- and b-subunits of CT are oxyanion holesformed by main chain amides from glycine residues (6).The regions of the mRNA for the a- and b-subunits thatbind to CT also reveal a symmetrical pattern. CT bindsonly to the coding region of the mRNA of the a- andb-subunits, a region that included the symmetry box,which corresponds to the spiral core of the tertiary struc-ture containing the oxyanion holes. While the symmetrybox is required for CT binding, it is not sufficient. ThemRNA upstream of the symmetry box is also needed forbinding, probably to achieve the proper 3D fold of mRNAto interact with CT. This observation is consistent with thenotion that mRNA sequences close to the start site aremore likely to be involved in regulatory events. Thus,while there are numerous examples of how the chemistryof a reaction drives the evolution of enzyme structure, theresults presented here for carboxyltransferase not onlysuggest a physiological role for the zinc domain but alsoextend the concept of chemistry directing enzyme evolu-tion to also include directing the mechanism of generegulation.
SUPPLEMENTARY DATA
Supplementary Data are available at NAR Online.
ACKNOWLEDGEMENTS
The authors thank Dr N. Kato for the plasmid containingthe eYFP gene. We thank F. Kizilkaya for assistance withthe Zn atomic absorption spectroscopy measurements.
FUNDING
Funding for open access charge: National ScienceFoundation (MCB-0841134 to G.L.W.).
Conflict of interest statement. None declared.
REFERENCES
1. Cronan,J.E. Jr and Waldrop,G.L. (2002) Multi-subunitacetyl-CoA carboxylases. Prog. Lipid Res., 41, 407–435.
2. Li,S.J. and Cronan,J.E. Jr (1993) Growth rate regulation ofEscherichia coli acetyl coenzyme A carboxylase, which catalyzesthe first committed step of lipid biosynthesis. J. Bacteriol., 175,332–340.
3. James,E.S. and Cronan,J.E. (2004) Expression of two Escherichiacoli acetyl-CoA carboxylase subunits is autoregulated. J. Biol.Chem., 279, 2520–2527.
4. Li,S.J. and Cronan,J.E. Jr (1992) The genes encoding the twocarboxyltransferase subunits of Escherichia coli acetyl-CoAcarboxylase. J. Biol. Chem., 267, 16841–16847.
5. Blattner,F.R., Plunkett,G. III, Bloch,C.A., Perna,N.T.,Burland,V., Riley,M., Collado-Vides,J., Glasner,J.D., Rode,C.K.,Mayhew,G.F. et al. (1997) The complete genome sequence ofEscherichia coli K-12. Science, 277, 1453–1474.
6. Bilder,P., Lightle,S., Bainbridge,G., Ohren,J., Finzel,B., Sun,F.,Holley,S., Al-Kassim,L., Spessard,C., Melnick,M. et al. (2006)The structure of the carboxyltransferase component of acetyl-CoAcarboxylase reveals a zinc-binding motif unique to the bacterialenzyme. Biochemistry, 45, 1712–1722.
7. Benson,B.K., Meades,G. Jr, Grove,A. and Waldrop,G.L. (2008)DNA inhibits catalysis by the carboxyltransferase subunit ofacetyl-CoA carboxylase: implications for active sitecommunication. Protein Sci., 17, 34–42.
8. Blanchard,C.Z. and Waldrop,G.L. (1998) Overexpression andkinetic characterization of the carboxyltransferase component ofacetyl-CoA carboxylase. J. Biol. Chem., 273, 19140–19145.
9. Ho,S.N., Hunt,H.D., Horton,R.M., Pullen,J.K. and Pease,L.R.(1989) Site-directed mutagenesis by overlap extension using thepolymerase chain reaction. Gene, 77, 51–59.
10. Cleland,W.W. (1979) Statistical analysis of enzyme kinetic data.Methods Enzymol., 63, 103–138.
11. Kozaki,A., Mayumi,K. and Sasaki,Y. (2001) Thiol-disulfideexchange between nuclear-encoded and chloroplast-encodedsubunits of pea acetyl-CoA carboxylase. J. Biol. Chem., 276,39919–39925.
12. Hensley,P., Yang,Y.R. and Schachman,H.K. (1981) On thedetection of homotropic effects in enzymes of low co-operativity.Application to modified aspartate transcarbamoylase. J. Mol.Biol., 152, 131–152.
13. Lorenz,M. (2009) Visualizing protein-RNA interactions insidecells by fluorescence resonance energy transfer. RNA, 15, 97–103.
14. Takamura,Y. and Nomura,G. (1988) Changes in the intracellularconcentration of acetyl-CoA and malonyl-CoA in relation to thecarbon and energy metabolism of Escherichia coli K12.J. Gen. Microbiol., 134, 2249–2253.
15. Sundararaj,S., Guo,A., Habibi-Nazhad,B., Rouani,M., Stothard,P.,Ellison,M. and Wishart,D.S. (2004) The CyberCell Database(CCDB): a comprehensive, self-updating, relational database tocoordinate and facilitate in silico modeling of Escherichia coli.Nucleic Acids Res., 32(Database issue), D293–D295.
16. Selinger,D.W., Cheung,K.J., Mei,R., Johansson,E.M.,Richmond,C.S., Blattner,F.R., Lockhart,D.J. and Church,G.M.(2000) RNA expression analysis using a 30 base pair resolutionEscherichia coli genome array. Nat. Biotechnol., 18, 1262–1268.
17. Voeller,D.M., Changchien,L., Maley,G.F., Maley,F., Takechi,T.,Turner,R.E., Montfort,W.R., Allegra,C.J. and Chu,E. (1995)Characterization of a specific interaction between Escherichia colithymidylate synthase and Escherichia coli thymidylate synthasemRNA. Nucleic Acids Res., 23, 869–875.
18. Chu,E., Voeller,D., Koeller,D.M., Drake,J.C., Takimoto,C.H.,Maley,G.F., Maley,F. and Allegra,C.J. (1993) Identification of anRNA binding site for human thymidylate synthase. Proc. NatlAcad. Sci. USA, 90, 517–521.
19. Chu,E., Koeller,D.M., Casey,J.L., Drake,J.C., Chabner,B.A.,Elwood,P.C., Zinn,S. and Allegra,C.J. (1991) Autoregulation ofhuman thymidylate synthase messenger RNA translation bythymidylate synthase. Proc. Natl Acad. Sci. USA, 88, 8977–8981.
20. Bai,D.H., Pape,M.E., Lopez-Casillas,F., Luo,X.C., Dixon,J.E. andKim,K.H. (1986) Molecular cloning of cDNA for acetyl-coenzymeA carboxylase. J. Biol. Chem., 261, 12395–12399.
21. Nikolau,B.J., Ohlrogge,J.B. and Wurtele,E.S. (2003) Plantbiotin-containing carboxylases. Arch. Biochem. Biophys., 414,211–222.
22. Bao,X., Shorrosh,B.S. and Ohlrogge,J.B. (1997) Isolation andcharacterization of an Arabidopsis biotin carboxylase gene andits promoter. Plant Mol. Biol., 35, 539–550.
23. Sun,J., Ke,J., Johnson,J.L., Nikolau,B.J. and Wurtele,E.S. (1997)Biochemical and molecular biological characterization of CAC2:the Arabidopsis thaliana gene coding for the biotin carboxylasesubunit of plastidic acetyl-coenzyme A carboxylase.Plant Physiol., 115, 1371–1383.
1226 Nucleic Acids Research, 2010, Vol. 38, No. 4
Downloaded from https://academic.oup.com/nar/article-abstract/38/4/1217/3112436by gueston 29 January 2018

24. Ke,J., Wen,T., Nikolau,B.J. and Wurtele,E.S. (2000) Coordinateregulation of the nuclear and plastidic genes coding for thesubunits of the heteromeric acetyl-coenzyme A carboxylase. PlantPhysiol., 122, 1057–1071.
25. Holden,H.M., Benning,M.M., Haller,T. and Gerlt,J.A. (2001) TheCrotonase superfamily: divergently related enzymes that catalyze
different reactions involving acyl coenzyme A thioesters. Acc.Chem. Res., 34, 145–157.
26. Hamed,R.B., Batchelar,E.T., Clifton,I.J. and Schofield,C.J. (2008)Mechanisms and structures of crotonase superfamily enzymes –How nature controls enolate and oxyanion reactivity. Cell. Mol.Life Sci., 65, 2507–2527.
Nucleic Acids Research, 2010, Vol. 38, No. 4 1227
Downloaded from https://academic.oup.com/nar/article-abstract/38/4/1217/3112436by gueston 29 January 2018


![MSc in Translational (Neuroscience) · PDF fileMSc in Translational Pathology [Neuroscience] Why Translational Pathology? The MSc Translational Pathology (Neuroscience) course combines](https://img.dokumen.tips/doc/110x75/5a7454947f8b9a0d558bb440/msc-in-translational-neuroscience-a-msc-in-translational-pathology-neuroscience.jpg)