Embed Size (px)
Citation preview

Sutter Medical Foundation
A Sutter Health Affiliate
AMGA CFO Council
Increasing Care Team
Productivity March 13, 2013
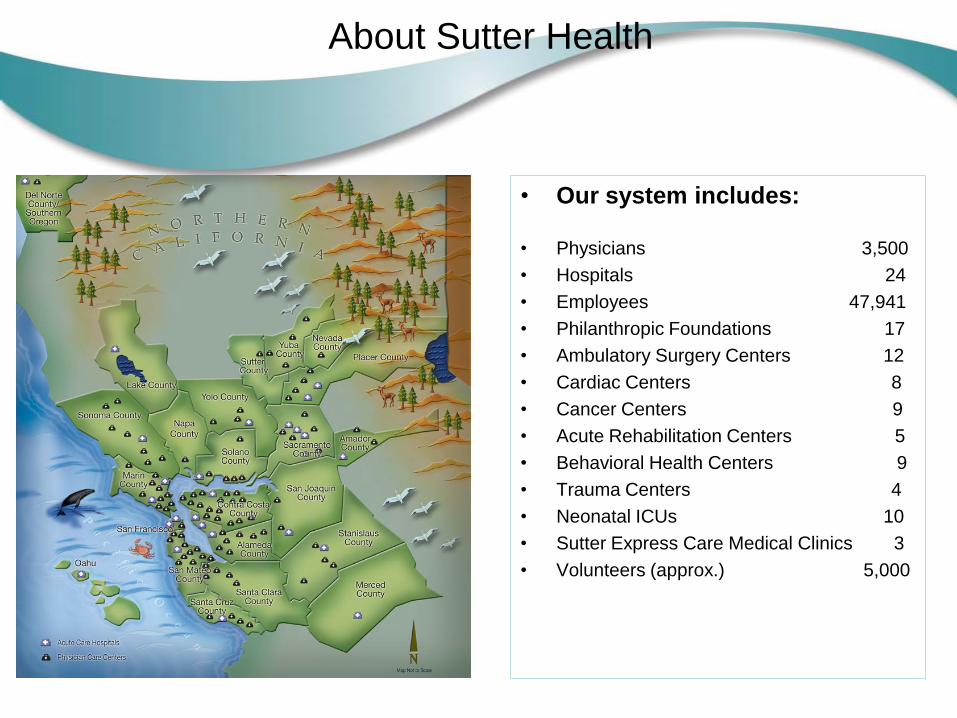
About Sutter Health
• Our system includes:
• Physicians 3,500
• Hospitals 24
• Employees 47,941
• Philanthropic Foundations 17
• Ambulatory Surgery Centers 12
• Cardiac Centers 8
• Cancer Centers 9
• Acute Rehabilitation Centers 5
• Behavioral Health Centers 9
• Trauma Centers 4
• Neonatal ICUs 10
• Sutter Express Care Medical Clinics 3
• Volunteers (approx.) 5,000

Sutter Medical Foundation
Sutter Medical Foundation • Sutter Medical Group (SMG) • Sutter North Medical Group (SNMG) • Sutter Express Care Medical Group
(SECMG) • Sutter Independent Physicians (SIP) 2010 Consolidated Quick Facts • Patient Visits: 3.9M • Aligned MDs
– Medical Groups: 563 – SIP: 566
• Employees: 2,574 • Payroll: $108.1M • 2010 Community Benefit Contribution:
$35.5M • Active Patients: 650,000 Sutter Medical Foundation Ancillaries • Surgery Centers (3 sites)
– Sutter Fairfield Surgery Center – Sutter Surgical Hospital – North Valley – Sutter North Ambulatory Surgery Center
• Diagnostic Imaging (20 locations) • Laboratories (30 locations) • Physical Therapy (15 locations) • Sutter Express Care (3 locations)
Tom Blinn
Title: CEO, SMF/SPA and SHSSR Ambulatory Care
Years in Position: 11
Years with Sutter: 11
3/15/2
013

15 785\90\187005(pptx)-E2
California Medical Foundation Structure Since the early 1980s, the medical foundation structure has been widely utilized
by California providers due to the state’s corporate practice of medicine statute.
Clinical
Services PSA
Regional
Board SMF
SMG
Board SMG
Compensation for
Professional Services As a separate legal entity and the employer of physicians and allied health
providers, SMG controls its own compensation plan; the system has the
power only to set the rates in the aggregate PSA payments to the group.

17 785\90\187005(pptx)-E2
Funding the Model The group receives funding from a variety of sources.
Clinical Compensation
SMG
Managed
Care (MC)
Revenue FFS Revenue
Admin. Other Prof. Income and Credits
Risk Share
Admin./ Other
Incentives/ Bonus
Physician Revenue
QIP

Our Key Initiatives
Communities
We Serve
ROI
Access
SSOS
TCA
•Revenue and
Operational
Efficiencies
•Patient Access
•Specialty Services
Operating System
•Total Cost of Care

You want us to see how
many patients today?
Copyright – Team Care Medicine, LLC, 2011 SPIN Conference - 2011
7

Increasing number of medical problems and symptoms Increasing number of choices of medications Increasing number of preventative responsibilities Increasing number of documentation requirements Increasing administrative responsibilities
Provider has too many responsibilities in 15 minutes
Both provider and patient experience chaos and frustration
indicating a real measure of failure in primary care today
Copyright – Team Care Medicine, LLC, 2011 SPIN Conference - 2011
Why the Patient Visit is
Broken 6 The patient’s needs cannot be fulfilled in 15 minutes

Is it even possible to deliver
great healthcare today?
Copyright – Team Care Medicine, LLC, 2011 SPIN Conference - 2011
8

Revenue and Operational Efficiency
ROI
Understand the roles of the physician and
staff, and ensure the processes optimizes
the use of their knowledge and skills
– Increase Care Team Productivity
–Spread Care Teams
–Decrease Costs through elimination of waste (Lean)
10

Team Based Care
Expected Benefits:
Reduced Cost/tRVU
Open panels and increased panel size
Increased patient & physician satisfaction
Improved performance on P4P measures through standard work
Reduced ED visits, hospital admissions, and re-admissions
through improved access to timely care
Increased use of My Sutter Health On Line (MHO) for virtual
care
Medial Assistance at full performance
Provides a foundation to build a practice model which includes
care coordination and population management
11
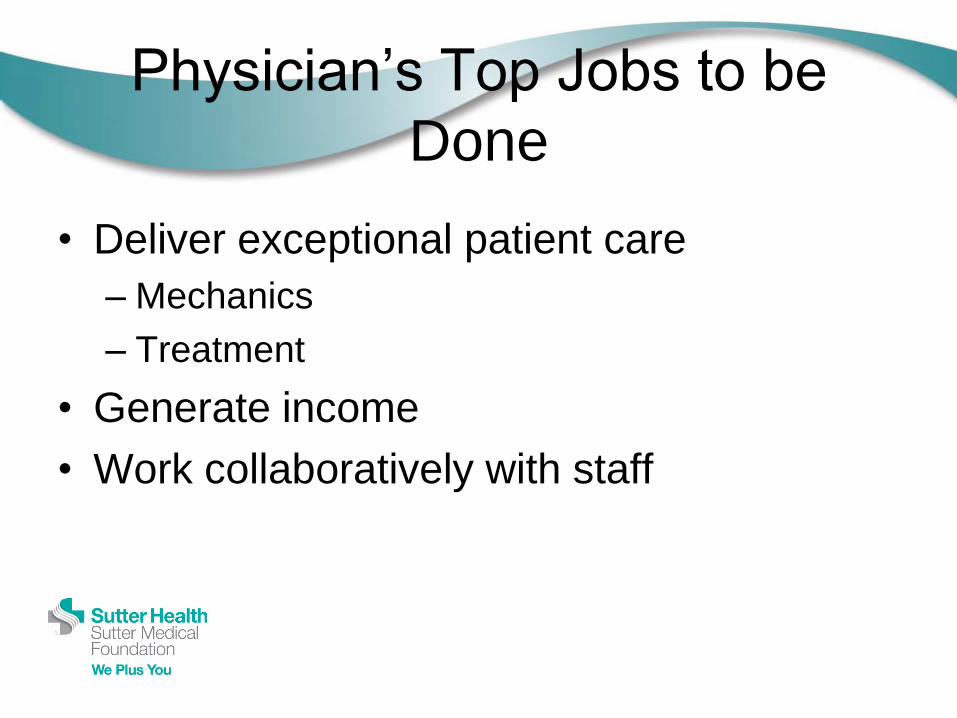
Physician’s Top Jobs to be
Done
• Deliver exceptional patient care
– Mechanics
– Treatment
• Generate income
• Work collaboratively with staff

Clinical Staff’s Top Jobs to be
Done • Assist physicians
• Deliver exceptional patient care
– Room patients
• Perform other non-patient care tasks
– Patient forms
– Replenishing supplies

Top 3 Physician Values
• Efficiency
– Less rework, finishing work before going home,
smooth patient flow
• Work-life balance
– Not doing EPIC at home
– More family time
• Compensation
– Compensation that is fair

Prioritization of Metrics
Patient Visit Lead Time
Physician Satisfaction
Compensation compared to benchmarks
MD Time spent in EPIC per scheduled
visit
Open encounters at end of business day
Panel size

Proposed Solution
2 MA Scribe Model
By increasing the staffing ratio, 2 Medical Assistant/
Clinician
Incoming work can be processed efficiently and appropriately.
Allowing current work to flow and avoid batching delays will
improve the quality of care and patient satisfaction.
Introducing a new role for medical assistant is one way
to create an efficient care team.

Administrative MA
Add administrative MA for 4 physicians
for non rooming work
Back line calls
EPIC in-Basket

Criteria for Scribe Model
At least 2 physicians willing to participate in practice with staff
Meet minimum productivity standards
Agree to sign a Compact (Primary Care Redesign MA Support Pilot
Project Clinician Compact)
Agreement between the group and the physician to agree to the terms of the
Increased MA Support
18

Terms of the Compact
Agree to increase daily patients visits
Agree to close encounters within 2 days of date
of service
Agree to utilize and support through mentoring
the additional MA staff to perform the tasks as
outlined
Failure to meet the criteria at end of six months
of the program my result in the loss of the
additional MA allocated to his practice

MA Scribe Workflow
• MA does the normal MA work/ pre-work for the day prepping charts, collecting lab/DI results etc,
reviewing health maintenance, pending orders, to ensure all in EPIC;
• Will work the EPIC In Basket.
• They will room patient according to normal MA workflow then leaves room and reports out to
Doctor on reason for visit.
• The MA and Doctor enter room together; MA scribes notes as Doctor dictates Review of systems
and physical exam;
• Doctor dictates orders and instructions then signs chart and leaves;
• MA stays and reviews After Visit Summary instructions then discharges the patient. While doctor
is in the room with the first MA the second is rooming next patient; then doctor enters 2nd room to
see patient with 2nd MA.
• Co locating their workstations allows for quick discussions of In Basket work to respond to patient,
call center or other requests.

Labor Standards Report
Dept Description RAD
Daily
Encounters MA / LVN PSR RN CC Lead Total MA / LVN PSR RN CC Lead Total
Clinical
FTEs
Encounters
/ Clinical
FTE
Family Medicine21-101-1110 Elk Grove Family Med I Lois Northeimer 269 18.15 6.84 2.39 27.38 15 39 112 9.8 18.90 14.2
21-111-1110 Alhambra Family Medicine Lois Northeimer 63 5.05 3.04 0.33 8.42 12 21 192 7.4 5.16 12.1
21-121-1110 Greenhaven Family Med Lois Northeimer 43 2.78 2.54 0.32 5.64 15 17 132 7.6 2.40 17.8
21-122-1110 Natomas Primary Care Center Lois Northeimer 74 4.33 3.71 0.86 8.90 17 20 86 8.3 5.62 13.2
21-123-1110 Greenback Family Med Joyce Swan 89 6.48 3.33 0.05 9.86 14 27 1,758 9.0 5.52 16.1
21-201-1110 Auburn AMC Family Medicine Joyce Swan 85 6.39 3.17 9.56 13 27 8.9 6.73 12.6
21-202-1110 Auburn Parkhill Family Med Joyce Swan 32 2.15 1.62 0.32 4.10 15 20 100 7.9 1.80 18.0
21-203-1110 Auburn Bell Family Medicine Joyce Swan 53 6.32 1.78 8.09 8 30 6.6 5.86 9.1
21-211-1110 Grass Valley LOP Family Med Joyce Swan 33 2.91 1.69 0.77 5.36 12 20 44 6.2 1.99 16.8
21-221-1110 Folsom Family Med Joyce Swan 66 4.90 4.14 9.05 13 16 7.3 4.94 13.3
21-231-1110 Lincoln Family Med Joyce Swan 88 5.56 3.23 8.79 16 27 10.1 5.67 15.6
21-241-1110 Rocklin Family Med Joyce Swan 74 5.75 2.56 8.31 13 29 8.9 6.30 11.8
21-251-1110 Roseville Family Med Joyce Swan 125 10.07 8.59 0.91 19.57 12 14 137 6.4 8.32 15.0
21-252-1110 North Sunrise Family Med Joyce Swan 91 6.66 3.44 0.92 11.01 14 26 99 8.2 5.16 17.6
21-301-1110 Davis MOB Family Med 2 Randy Pirtle 64 5.53 5.29 0.72 11.54 12 12 88 5.5 5.06 12.6
21-302-1110 Davis MOB Family Med 1 Randy Pirtle 29 2.91 2.92 0.54 6.38 10 10 53 4.6 2.11 13.8
21-303-1110 Davis Family Med Randy Pirtle 78 6.06 6.82 0.90 13.78 13 11 86 5.6 5.90 13.2
21-311-1110 Dixon Family Med Randy Pirtle 56 3.25 1.65 4.90 17 34 11.5 2.87 19.6
21-321-1110 Winters Family Med Randy Pirtle 18 1.58 0.98 0.38 0.20 3.13 12 19 49 94 5.9 1.08 17.0
21-331-1110 Woodland Family Med Randy Pirtle 70 4.42 4.59 0.30 9.31 16 15 236 7.5 4.33 16.1
Total for Family Medicine 1,500 111.25 71.94 4.85 5.06 193.10 13 21 309 296 7.8 105.72 14.2
Direct Staff FTE Labor Utilization (encounters / FTE)

Physician Productivity
Current State SMF Financial Impact - Break Even SMF Financial Impact - Enhance3
additional
4
additional
PROVIDER NAME Home AU Home Care Center FTE wRVUs visits
wRVU /
visit
visits /
day
MGMA
Percentile
visits /
day % increase
MGMA
Percentile
visits /
day % increase
MGMA
Percentile
AUWINGER DO,BRAD HENRY 211231110 Greenback Family Med 1.0 6,967 4,673 1.49 20.3 89th %tile 23.3 14.8% 90th %tile 24.3 19.7% 90th %tile
PADILLA MD,DAVID A 212521110 North Sunrise Family Med 1.0 6,843 5,674 1.21 24.7 88th %tile 27.7 12.2% 90th %tile 28.7 16.2% 90th %tile
GRUENEFELDT MD,ALAN 212021110 Auburn Parkhill Family Med 1.0 6,618 5,643 1.17 24.5 85th %tile 27.5 12.2% 90th %tile 28.5 16.3% 90th %tile
HISATOMI MD,GEORGE 211011110 Elk Grove Family Med I 1.0 6,530 5,507 1.19 23.9 84th %tile 26.9 12.5% 90th %tile 27.9 16.7% 90th %tile
SHERWOOD MD,BRAD 211011110 Elk Grove Family Med I 1.0 6,503 4,913 1.32 21.4 84th %tile 24.4 14.0% 90th %tile 25.4 18.7% 90th %tile
LUGO MD,PHIL M 212211110 Folsom Family Med 1.0 6,425 4,981 1.29 21.7 83rd %tile 24.7 13.9% 90th %tile 25.7 18.5% 90th %tile
FIELDS MD,DANIEL J 211011110 Elk Grove Family Med I 1.0 6,301 5,044 1.25 21.9 81st %tile 24.9 13.7% 90th %tile 25.9 18.2% 90th %tile
MOYNIHAN MD,KEVIN M 213311110 Woodland Family Med 1.0 6,246 4,567 1.37 19.9 80th %tile 22.9 15.1% 90th %tile 23.9 20.1% 90th %tile
ANG MD,ROGER 212511110 Roseville Family Med 1.0 6,103 4,599 1.33 20.0 78th %tile 23.0 15.0% 89th %tile 24.0 20.0% 90th %tile
CANNON MD,SCOTT C 211011110 Elk Grove Family Med I 1.0 5,862 4,550 1.29 19.8 74th %tile 22.8 15.2% 87th %tile 23.8 20.2% 89th %tile
GRANOVSKY MD,SABRA 211111110 Alhambra Family Medicine 1.0 5,628 4,039 1.39 17.6 70th %tile 20.6 17.1% 84th %tile 21.6 22.8% 88th %tile
ASKEW MD,KATIE C 211011110 Elk Grove Family Med I 1.0 5,587 4,269 1.31 18.6 69th %tile 21.6 16.2% 83rd %tile 22.6 21.5% 87th %tile
SULLIVAN MD,MARK 214021110 Fairfield Family Medicine I 1.0 5,550 4,406 1.26 19.2 68th %tile 22.2 15.7% 83rd %tile 23.2 20.9% 86th %tile
HACKER MD,TREVOR W 211011110 Elk Grove Family Med I 1.0 5,458 4,932 1.11 21.4 66th %tile 24.4 14.0% 80th %tile 25.4 18.7% 83rd %tile
AUYEUNG MD,TERESA 214211110 Vacaville Family Medicine 1.0 5,429 4,611 1.18 20.0 65th %tile 23.0 15.0% 80th %tile 24.0 20.0% 84th %tile
DOOLITTLE MD,JOHN 212521110 North Sunrise Family Med 1.0 5,201 3,818 1.36 16.6 60th %tile 19.6 18.1% 78th %tile 20.6 24.1% 83rd %tile
DIAZ JR DO,MANUEL C 213311110 Woodland Family Med 1.0 5,174 3,872 1.34 16.8 59th %tile 19.8 17.8% 78th %tile 20.8 23.8% 82nd %tile
MOSHIER MD,MICHAEL 214021110 Fairfield Family Medicine I 1.0 5,129 4,466 1.15 19.4 58th %tile 22.4 15.4% 75th %tile 23.4 20.6% 79th %tile
MAPLE MD,SEEMA S 212111110 Grass Valley LOP Family Med 1.0 5,129 4,016 1.28 17.5 58th %tile 20.5 17.2% 76th %tile 21.5 22.9% 81st %tile
GOPALAPURAM MD,RAJANI 214211110 Vacaville Family Medicine 1.0 5,025 4,036 1.25 17.5 55th %tile 20.5 17.1% 74th %tile 21.5 22.8% 79th %tile
RUGGLES MD,CRAIG STEWART 211011110 Elk Grove Family Med I 1.0 4,940 4,137 1.19 18.0 53rd %tile 21.0 16.7% 72nd %tile 22.0 22.2% 77th %tile
DOAN MD,TUAN ANH 212411110 Rocklin Family Med 1.0 4,921 4,281 1.15 18.6 52nd %tile 21.6 16.1% 71st %tile 22.6 21.5% 76th %tile