Embed Size (px)
Citation preview

A suppressed demand analysis method of the transportationdisadvantaged in policy making
Yavuz Duvarcia* and Shoshi Mizokamib
aIzmir Yuksek Teknoloji Enst., Sehir ve Bolge Pl., Gulbahce, Urla Izmir 35437, Turkey;bDepartment of Civil and Environmental Engineering, Kumamoto University, 2-39-1,
Kurokami, Kumamoto 860-8555, Japan
(Received 16 September 2007; final version received 2 March 2009)
This paper proposes a method for estimating transportation supplyrequirements when the suppressed demand of the transportationdisadvantaged (TD) can be calculated and added to existing demandfor travel. The underlying assumption is that the travel conditions ofthese TD groups must be equal to the ‘conventional’ demand, known as‘full release’. Utilising the modelling approach for TD, suppresseddemand analysis, diagnosis of difficulties and equity between conven-tional and disadvantaged groups were realised, while elaborating specialcases for the most vulnerable TD groups (such as elderly and disabledpersons) and simultaneously identifying areas of difficulty. From theearly virtual results, it is concluded that, for the full release of suppressedtrips (only a 5% increase), policy makers must be ready to face somefinancial burdens, requiring coordination of effort to both standardisethese TD groups and reduce the costs incurred by operators.
Keywords: suppressed travel demand; transportation disadvantage;disabled and elderly persons
Introduction
At present, there is continued growth in both the number of transportation
disadvantaged (TD) persons and the various forms and aspects of
disadvantage faced by them. This is primarily due to demographic trends
(an increasing number of elderly users, as well as disabled and young users in
developing countries), suburbanisation and a de-emphasis on coordination
issues, still in their infancy. The essence of the problem is that elderly and
disabled persons will require more assistance (Howe 1992, Lucas 2006). Hine
and Mitchell’s (2003) work summarises such efforts and points out policy
directives for future coordination and planning efforts, while also presenting
examples of prior applications that must be re-initiated. Many well-intended
5
10
15
20
25
30
*Corresponding author. Email: [email protected]
ISSN 0308-1060 print: ISSN 1029-0354 online
# 2009 Taylor & Francis
DOI: 10.1080/03081060902861400
http://www.informaworld.com
Transportation Planning and Technology
Vol. 32, No. 2, April 2009, 167�194
C:/3B2WIN/temp files/GTPT386312_S100.3d[x] 6th April 2009 19:57:32 Ts: N.A.; Qa: G.K.
policies have been proposed, but in reality most have been hampered in
implementation by funding and coordination difficulties. Meanwhile,
continuing developments such as big retailers replacing smaller local shops,
increased distances to major local activities, centralisation of health services
and the removal of transit routes from low income districts are taking place
at an ever increasing rate (Pennycook et al. 2001, Lucas 2006). In order tofoster the coordination necessary for equity in accessibility, transportation
and human services agencies need to collaborate during the planning process
and take into account all these social aspects (Grieco 2003, Hine and
Mitchell 2003). Successful transport policies must be sensitive to types of
people affected and differentiate accordingly (Heggie and Jones 1978). This
policy analysis can be fundamentally based upon identifying and separating
out TD and non-disadvantaged individuals (or households). Despite the
growing literature and interest in this issue upon the recent call forgovernmental policy on matters of social exclusion in the UK, and as
identified in the 2004 Transport White Paper, there remain both methodo-
logical and conceptual struggles in tackling this issue in a comprehensive
manner even in developed countries. Multidimensionality in the definition of
TD prevails and complicates the frame of analysis for deriving travel
patterns in addition to the inherent measurement difficulties.
While locating the issue to an extent and enriching the discussion, most
studies have failed to define and address the issue of integrating suppresseddemand comprehensively into the modelling, which is necessary for a
knowledge-based analysis of policies. In previous studies by Duvarci and
Yigitcanlar (2007), methodological issues of such integration were addressed
to the extent that there is now at least a working model for TD travel
demand. The model of integration proposed therein was developed in order
to enable the formulation of policies sensitive to the needs of disadvantaged
persons. The measurability of suppressed demand, and that of disadvan-
taged groups in particular, remained unaddressed within the context of thatmodel and no clear method had been proposed to tackle this issue since
there had been no clear yardstick defined to measure it. In the new model
approach, the degree to which the disadvantages (the marks on the TD
yardstick) can be defined in both social and geographical terms has been
investigated; however, the levels of suppressed demand remain unexplored.
Defining disadvantage levels for each stage of the model and obtaining
assignment indicators is one thing, while defining the amount of suppressed
demand (and the release if all disadvantages are removed) is another.Preceding the modelling steps, a clear review of travel demand types must be
undertaken. As Pendyala and Bhat (2006) stated, one of the key considera-
tions in determining the efficacy of a model is to examine the ability of the
model to quantify induced or suppressed travel demand. Thus, the purpose of
this paper is, first, to determine a method of calculation for quantifying
suppressed demand, or in other words, a measurement technique for the
35
40
45
50
55
60
65
70
75
168 Y. Duvarci and S. Mizokami
C:/3B2WIN/temp files/GTPT386312_S100.3d[x] 6th April 2009 19:57:35
inclusion of the TD population, or the socially excluded (SE) population, to
introduce a degree of quantification throughout the modelling steps, and
then, to find a measure of the impact from the hypothetical release of this
suppressed demand as the traffic assignment results of these TD groups,
especially those of the most vulnerable in this particular case. Full removal
of all disadvantages for these TD groups means their being equated to the
conventional population’s travel characteristics. This ‘completion’ rule
comprises the very backbone of the quantification method of the so-called
‘suppressed demand difference’ in this study.
In the previous study, results from modelling showed that the TD
population produced an overall trip rate per person that was less than that of
the conventional population: 1.65 to that of 1.73. The present study
concludes that, if all the suppressed trips of TD were released, this number
will have risen to 1.78. Therefore this study takes as it an assumption that
showing fewer trips is a sign of demand suppression. The TD population
was also overwhelmingly inclined to use public modes of travel, as was
expected, and this is also assumed to be a sign of suppression. The reasons
behind classifying these populations as TD, and why they produce fewer
trips, are extensively discussed in studies by Church et al. (2000), Pennycook
et al. (2001), Hine and Grieco (2003), Hine and Mitchell (2003) and Duvarci
and Yigitcanlar (2007).
To maintain equity, the hypothetical traffic impacts of the increased (or
released) trips of the ‘once’ TD were observed and the additional cost
burdens on the local government providing transportation services as well as
the required infrastructure were determined, using a ‘what if?’ approach
based upon previous modelling results. The realised results are only on the
basis of these increased productions, and remain hypothetical, but are still
informative and have the potential to be used as a decision support
mechanism by planners and traffic engineers. The simulation results tell
us, first of all, that with the addition of the total release of the suppressed
trips (an increase of 5%), no serious stress on existing road capacity
appeared, with the qualification, however, of these results being very specific
to the case city. Secondly, the results show that in the trip distribution stage,
the focus zone pairs of policy, and thus, the critical paths that the particular
groups under consideration (elderly and disabled persons) employ over-
whelmingly could be identified with ease, along with the adjoining link-
based results concerning what existing problems and costs (or congestion)
these groups may encounter with the release impact. Analysts will be able to
observe the special groups’ positions and define what special transportation
services and policies would be required in meeting this extra demand. Thus
policy makers can find means to alleviate the disadvantages, while still
following the Pareto optimality principle of not disturbing the present
situation of the remaining users.
80
85
90
95
100
105
110
115
120
Transportation Planning and Technology 169
C:/3B2WIN/temp files/GTPT386312_S100.3d[x] 6th April 2009 19:57:35
This methodology-driven study concerns only trip production and its
run-down implications up to the assignment stage, addressing operability
through a four-step model. The uncontaminated impact of trip production
suppressed demand release is also observed. Two assumptions to be stressed
here in the analytical framework are: (1) the Pareto optimality principle is
applied, not interfering with the demands of other populations; and (2) the
requirement that the demand characteristics of the conventional population
be the ideal target for the TD population.
In the second section, the literature concerning the concepts of demand
types in connection to the TD concept is briefly reviewed. In the third
section, the basic structure of the model for TD from the previous study
and its major findings are highlighted. In the fourth section, both the
suppressed demand calculation method and the method of integrating this
calculation into the modelling for simulations of the net impacts are covered.
In the fifth section, the results from the simulation are analysed and
evaluated as to their policy implications. Finally, the conclusions and areas
for further study are considered.
A review of the literature on transportation disadvantage and suppressed
demand
While related to the TD concept, that of the SE population is a much
broader term implying people or households that are not simply poor but
that have additionally lost the ability to both literally connect with many of
the jobs, services and facilities that they need to fully participate in society.
Accordingly, there are seven basic possible exclusion types: (a) physical;
(b) geographical; (c) exclusion from facilities; (d) economic; (e) time-based
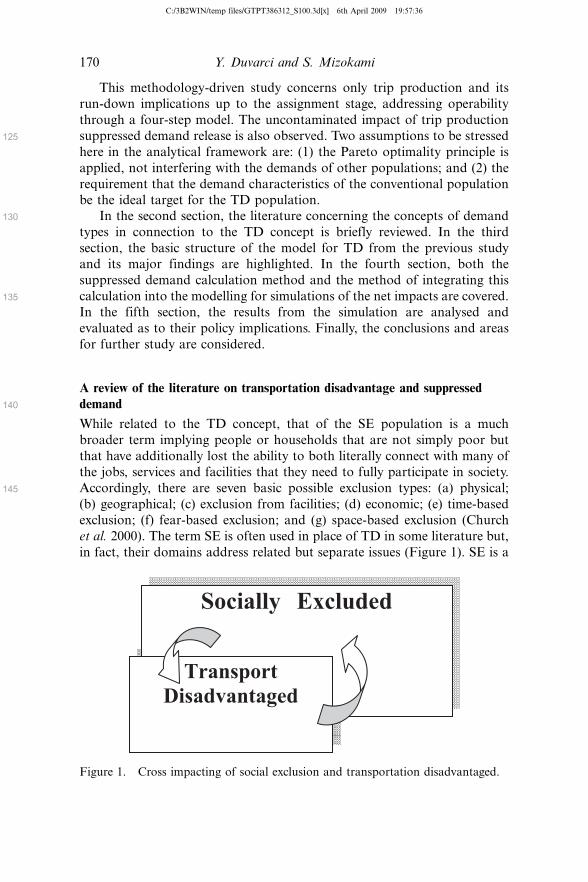
exclusion; (f) fear-based exclusion; and (g) space-based exclusion (Church
et al. 2000). The term SE is often used in place of TD in some literature but,
in fact, their domains address related but separate issues (Figure 1). SE is a
125
130
135
140
145
Socially Excluded
Transport Disadvantaged
Figure 1. Cross impacting of social exclusion and transportation disadvantaged.
170 Y. Duvarci and S. Mizokami
C:/3B2WIN/temp files/GTPT386312_S100.3d[x] 6th April 2009 19:57:36
term referring in general to socio-economic wellbeing, with this relationship
affecting TD, and vice versa, while TD refers simply to the disadvantageous
conditions of transport, or accessibility. Accessibility and transportation are
of vital importance in maintaining contact with the rest of society, and
therefore, very closely linked to the concept of SE. Thus, the transport
system itself has a role in creating barriers (Church et al. 2000, SEU 2003).Hine and Grieco (2003) argue that the combination of poor accessibility
with low levels of mobility and low levels of sociability intensifies this
exclusion.
Because of the multidimensionality (accessibility, mobility, cost, conve-
nience and access to information) of TD, difficulties arise in measurement
and levels of analysis. The present methods employed are far from being
mature. A few disjointed studies have attempted to measure levels of
exclusion. Research in the UK tended to adopt either a categorical approachor spatial approaches (Church et al. 2000) largely making use of GIS tools
(PTAL or CAPITAL tools and ACCMAP, ABRA in those more advanced).
However, these were found to be inefficient (Grieco 2003). Particular groups
may not remain homogeneous throughout category analyses and other
underlying non-physical factors (such as mode reliability or the time
valuation of socio-demographic groups) may affect accessibility (Grieco
2003). Using the London Area Travel Survey done in 2001, the trip making
characteristics of elderly and disabled persons for four trip purposes using anordinal probit model technique were determined (Schmocker et al. 2005).
According to these results, retired people can make trips in a similar fashion
to those of the conventional population, but if disabilities intervene, overall
trip rates drop dramatically.
Recently, a consensus was achieved concerning these disjointed efforts
and requiring a comprehensive integration of these disadvantaged groups.
The issue should be of concern to many related institutions and the
following areas should be seen as priorities: the sustainability of accessibletransport; better demand forecasting methods; and the needs of TD persons
(Suen and Mitchell 2000). In addition to the awareness in the UK
government, legislation in many other countries (including the USA,
Sweden, Canada, Australia, etc.) require that transportation services be
improved and made accessible to all members of the population, with routes
more accessible to health services and shopping centres as well as housing,
employing taxies with user-side subsidies, especially in assisting disabled
persons, and pedestrian infrastructure and travel information for peoplewith sensory, cognitive or linguistic impairments employing advanced
technologies (Suen and Mitchell 2000). For example, it was found that
low-floor buses increase the bus travel of TD groups (an inducement effect).
Special infrastructure may be required in order to aid disabled and elderly
groups, which may bring with it additional costs, and funding these will be
the biggest obstacle for local authorities who may be unwilling to undertake
150
155
160
165
170
175
180
185
190
Transportation Planning and Technology 171
C:/3B2WIN/temp files/GTPT386312_S100.3d[x] 6th April 2009 19:57:38
heavy financial burdens. In order to relieve this funding obstacle, it is likely
that the money charged to those who benefit most from the system will be
specified for use in the improvement of public transport (PT), especially in
emphasising the quality of service, and in improving service for those who
benefit less at present, or suffer from a lack of service (Newman and
Kenworthy 1999, Lucas 2006). There is currently a ‘local transport planning’concept where equity between users is taken into consideration, and local
participation is involved in more areas than simple efficiency and congestion
concerns. The necessity for governmental assistance and intervention is
strongly emphasised, with policies of active intervention needed to repair the
areas of exclusion once the measurement problems in modelling are solved
(Grieco 2003, Mokhtarian et al. 2006). With the increasing numbers of
elderly and disabled populations, a gradual rise in the demand for demand
responsive, door-to-door, ITS (Intelligent Transportation Systems) trans-portation services, and community transport alternatives in-between private
and public modes are expected to replace private vehicles.
However, ascertaining the required amount of this additional infra-
structure and its attendant costs depends, first of all, on determining the
suppressed demand of those TD groups. Although some research literature
exists on the measurability of induced demand using an elasticity approach
as the ratio of the change in quantity of travel demanded over the change in
travel supplied (Transtech Management Inc. and Bailly 2000, Cervero2003a), less focus has been devoted to measuring the amount of suppressed
demand and its impact. In particular, to what extent overall conditions
should be improved remains an unknown issue. The elasticity technique can
be also used for calculating suppressed demand. Empirical impact studies
have been primarily confined to added lane miles on the amount and length
of travel. Measuring the impact of induced or suppressed demand is also
difficult due to the far reaching, complex and longer term impacts which are
hard to calculate and where the impacting factors and those impacted shouldbe clearly identified. The most easily forgone trips (suppressed trips) would
be trips for social or leisure purposes, or some for maintenance, which are
travel behaviours that are even harder to model. Most likely the suppressed
demand of TD groups would be of this form, and those that they can most
easily forego rather than obligatory trips, such as those for work, although
their leisure activities and the number of trips are increasing (in the USA at
least) (Mokhtarian et al. 2006). If the public transportation service level TD
groups depend on is low, they are then more severely affected (Porter 2002,Lucas 2006). It has also been observed that TD groups comprise a majority
of those ‘peak captives’ (Duvarci and Yigitcanlar 2007). As mentioned
previously, this is partly due to the fact that they either defer social and
leisure trips which are less important to them, or strictly plan trips at
household level, combining them with these obligatory trips into a one-end
vehicular trip. Family dependence in trip making is not only exhibited in the
195
200
205
210
215
220
225
230
235
172 Y. Duvarci and S. Mizokami
C:/3B2WIN/temp files/GTPT386312_S100.3d[x] 6th April 2009 19:57:38

economic sense but also in the mobility sense, which is verified in the
Srinavasan and Ferreira’s (2002) study using large household survey data
(1991) from Boston. Households without children tend to have fewer trips
overall. The presence of children, residential location and employment seem
to affect modal choices within a household. For elderly people living in
suburban environments, there are no other alternative travel modes and they
are forced to be ‘mode captives’ of the automobile after retiring (Davidse
2006). Elderly and disabled persons seem to be the most critical groups
among the disadvantaged population with as much as 48% of those with
disabilities and 53% of all elderly persons defined to be in the general
category of TD (Duvarci and Gur 2003).
Travel demand types
Suppressed demand and induced demand are key subjects in the identifica-
tion of the TD population and a heavy emphasis has been placed on
measurements of disadvantages in the last decade, especially in the studies of
Cervero (2003a,b), Mokhtarian and Salomon (2001) from the USA, and
Litman (2005) providing a vast amount of empirical data for discussion.
However, debates remain on specific definitions of demand types, primarily
those of automobile traffic, which still have measurability and integration
difficulties in modelling demand. Thus, there is an urgent need to understand
travel patterns and the needs of the TD population and in parallel with this,
the level of their suppressed demands in general.
The basic demand types are presented in correspondence with other
types below and can be relevant in identifying inherent travel disadvantages,
and the nature of TD travel:
. derived demand;
. generated and Induced demand;
. latent (referred to as ‘real’ demand); and
. suppressed demand (along with ‘subverted’ demands).
Wider definitions are provided by Litman (2005). Of these, the concepts
related to suppressed demand will be discussed in depth in the next section.
Derived demand does not actually refer to a type of demand but to a
state of analysis in demand modelling; from one extreme viewpoint, derived
demand is the ideal demand, free from the existing demand in reality. From
another viewpoint, according to that of descriptive modelling, the travel is
‘derived’ if it is not made for the purpose of travel itself but pursuant to
other activities (Mokhtarian and Salomon 2001). The definition of
generated demand is largely based on the assumption that the traffic
exhibits behaviour analogous to that of a gas rather than that of a fluid � it
tends to expand if the network capacity is increased simultaneously (Litman
240
245
250
255
260
265
270
275
Transportation Planning and Technology 173
C:/3B2WIN/temp files/GTPT386312_S100.3d[x] 6th April 2009 19:57:38
2001). Thus for example, when new roads are opened, traffic fills them
quickly, and the expected marginal utility of the new resource declines. On
the other hand, induced demand is a sort of layer placed on top of generated
demand. Through the changes made, more travel is attracted and the total
volume of trips is also increased, usually as a factor of land use impacts
(Litman 2001, Cervero 2003a). Thus, the total generated demand includesinduced demand as a substantial part of its makeup.
New and longer trips quickly fill the increased capacity until the
congestion equilibrium is re-established; however, pursuing this equilibrium
in the real world would not be cost-effective (Downs 1992). For example, the
huge suppressed demand for private cars in China does not seem satiable,
and building the enormous infrastructure required to satiate this demand
cannot be justified by any means (Zhang and Hu 2003). Cervero (2003a)
criticises Hansen’s famous finding that each additional 10% infrastructurespurs a 9% increase in traffic as ‘overstated’, because the increase must not
be totally due to the induced impact but rather to the release of the once
suppressed demand (or, the latent demand which was actually hidden and had
not come to light until transport infrastructure conditions were improved,
which he refers to as a ‘causality’ problem, and has yet to be well treated in
demand estimation studies). He also relates the demand changes to the
‘diverted’ trips as induced trips. However, some studies distinguish between
induced travel and diverted travel (Litman and Colman 2001, Noland andLem 2002). Mode choice especially (as a diverted demand) is affected by the
physical infrastructure available and the environmental characteristics such
as the existence of sidewalks and the topography (Rodriguez and Joo 2004).
Suppressed demand of transportation disadvantaged (TD) groups and itsrelation to other demand types
Suppressed demand can be linked to the induced demand concept. If theassumption that induced demand is the contrary side of suppressed demand
is accepted, then this must be valid especially for the TD population,
whenever their travel conditions are improved. The suppressed demand of
TD groups is only released where conditions such as accessibility and ease
of mobility, lowered travel costs, etc. are improved. Those with lower levels
of accessibility tend to plan and combine trips into one stop trips (Limanond
and Niemeier 2004), which is also a form of demand suppression. But, some
believe that induced demand is not simply a re-appearance of ‘deferred’demand released at a later time, but that it is artificially created by traffic
engineers and is beyond the impact of suppression (Newman and Kenworthy
1999). But, even if increased capacity and improved infrastructure make
trips more attractive and cheaper, there must still be a ceiling point to the
demand, and this is what is actually meant by the derived or desired demand.
Suppressed demand can be alternatively defined as a form of oppression
280
285
290
295
300
305
310
315
174 Y. Duvarci and S. Mizokami
C:/3B2WIN/temp files/GTPT386312_S100.3d[x] 6th April 2009 19:57:38
which is socio-spatially produced rather than naturally given. Thus, such
disadvantaged individuals may tend to avoid travel if it becomes too
troublesome in regards to the compared net utility gain from the outcome
(accomplishing the activity at the destination) versus the disutility of making
the trip, where quality of life depends to a large extent on ease of movement.
For example, if an individual wishes to go work by bicycle but is unable toand must go by motor vehicle simply because there are not enough facilities
for cycling, this means that their modal preference for the bicycle is
suppressed. Thus, it is quite reasonable to think that suppression is primarily
based upon the existence of adequate physical facilities in order for the latent
demand to be fulfilled. Congestion may cause people to defer trips that are
not urgent, choose alternative destinations or modes or even forego
avoidable trips (Litman and Colman 2001). Many barriers were found
limiting the social inclusion of excluded groups � limited travel choices (bothspatially and temporally); excessive access distances to PT services and
various problems encountered on route; the time required to reach
destinations (as compared to going by car); poor service reliability (and
thus, many trips cancelled or delayed); the limited availability of PT
information in suitable formats; and the cost of using PT. However, the
impacts and intensity of these barriers vary between population groups and
the time of day. Similarly, improved environments (perceived safety,
aesthetics of the road, etc.) and street design (traffic calming, rest facilitiesand slope), the quality and existence of bicycle facilities along major routes
can all be cited as factors leading to an increase in bicycle trip rates. What
was once suppressed demand can turn out to be realised demand, improving
the level of equity, and thus, can help increase mobility with an increase in
the level of personal satisfaction.
One dimension of suppressed demand, and interestingly also that of
induced demand, is the number of ‘diverted’ trips that would be channelled
to usually undesired modes, times and/or paths (that is why this type could beclassified under suppressed demand). Another type is subverted demand,
meaning that the trips were actually made but the activity that was the object
of the trip was not accomplished because of late arrival or the absence of the
activity due to a lack of information (Grieco 2003). Subverted trips can also
likely be attributed to TD or SE groups. According to Grieco (2003),
1.4 million people missed appointments in one year in her UK study due to
access difficulties. Subverted trips can be compensated for by more frequent,
more direct and more reliable PT services.From the literature review above, we can clearly see that the demand type
of the TD population is a type of suppressed demand, since they are not
provided with accessibility and transportation services to the extent that the
conventional population is, and that this is due to personal or transport
system based reasons, and the possible release of this suppressed demand
could be interpreted as ‘induced’ in one sense, and as finding their ‘derived
320
325
330
335
340
345
350
355
360
Transportation Planning and Technology 175
C:/3B2WIN/temp files/GTPT386312_S100.3d[x] 6th April 2009 19:57:38
demand’ in another, as method of analyses if the purpose is to equate them
to the conventional population, thus conforming to the aforementioned
Pareto optimality rule. The basic relation set to induced demand is through
inducement impact as travel increases or the diverted traffic of added
infrastructure. Thus, considering a hypothetical scenario whereby means of
some added capacity, technological support (such as ITS), special para-transit service and infrastructure, a sort of induced demand impact could be
artificially conceived as those groups could then take trips as far as
conventional people could and, thus, traffic impacts and other costs could
be observed through this analytical framework. These types of observations
are much more likely in a simulated environment based on the previous
TRANUS model prepared for TD groups than could possibly be observed
in reality. The results of such a simulation would be informative and useful
as guidance in the policy-making stage. Also, measurability and ananalytical framework can be devised through such a scenario approach.
It is also intended herein to introduce a new concept called ‘suppressed
demand difference’ which is totally based on the unique cluster analysis
methodology of TD modelling. In the next section, addressing methodology,
we assume that the real (or latent) demand of the TD population is the ideal
(or ‘derived’) demand, which is equal to the demand of the conventional
population, and a measure is devised showing to what extent the suppressed
demand of those TD groups could be released, a previous unknown. Insimple arithmetical terms, this idea can be stated symbolically as:
RTD�DN�DTD (1)
where, RTD (later denoted as Dij(rel) for the calculation of trip numbers in
Eq. (5)) is the demand difference to be released for the TD (Transport
Disadvantage) population, DN is the existing demand of the conventional
population but here assumed to be the actual latent demand of TD, and DTD
is the existing (suppressed) demand of the TD. If the transportation
conditions and accessibility of TD are restored, the released demand of
TD becomes a sort of ‘induced’ demand of the TD due to the improvement
impact.
Description of the modelling approach adopted for transportation
disadvantaged (TD)
Case city and data: Aydin
Together with the usual transport network data included in the 2000 Census
for Turkey, a household survey was conducted of 326 randomly selected
households and interviews with a total of 932 persons. The sampling ratio of
this survey was 0.7 per cent. Questions related to individual household
members aimed to determine individual travel patterns in order to reveal
disadvantage-related information (Duvarci and Yigitcanlar 2007). The
365
370
375
380
385
390
395
400
176 Y. Duvarci and S. Mizokami
C:/3B2WIN/temp files/GTPT386312_S100.3d[x] 6th April 2009 19:57:38
model was tested in the city of Aydin, which is near Izmir, and had a
population of 135,365 in 2000 with a compact settlement form. Wealthier
groups reside in the areas surrounding the city centre, with the urban fringe
mainly home to low income groups in contrast to the situation in most
Western cities.
Brief findings from the previous model
The structure of the model that this study is based upon consisted of two
basic stages after processing the data: (a) determining the disadvantaged
population through cluster analysis and; (b) modelling the disadvantaged
and conventional populations and comparing the results. A brief summary
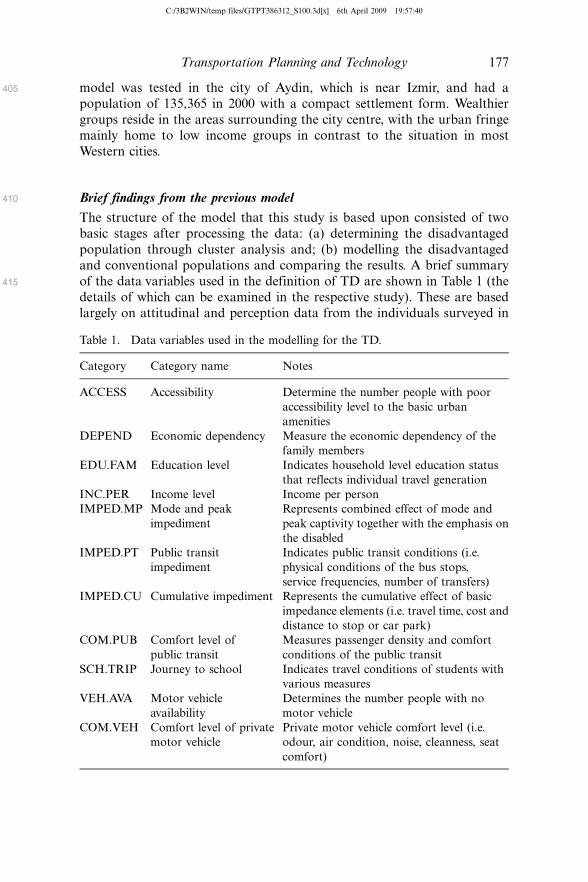
of the data variables used in the definition of TD are shown in Table 1 (the
details of which can be examined in the respective study). These are based
largely on attitudinal and perception data from the individuals surveyed in
405
410
415
Table 1. Data variables used in the modelling for the TD.
Category Category name Notes
ACCESS Accessibility Determine the number people with poor
accessibility level to the basic urban
amenities
DEPEND Economic dependency Measure the economic dependency of the
family members
EDU.FAM Education level Indicates household level education status
that reflects individual travel generation
INC.PER Income level Income per person
IMPED.MP Mode and peak
impediment
Represents combined effect of mode and
peak captivity together with the emphasis on
the disabled
IMPED.PT Public transit
impediment
Indicates public transit conditions (i.e.
physical conditions of the bus stops,
service frequencies, number of transfers)
IMPED.CU Cumulative impediment Represents the cumulative effect of basic
impedance elements (i.e. travel time, cost and
distance to stop or car park)
COM.PUB Comfort level of
public transit
Measures passenger density and comfort
conditions of the public transit
SCH.TRIP Journey to school Indicates travel conditions of students with
various measures
VEH.AVA Motor vehicle
availability
Determines the number people with no
motor vehicle
COM.VEH Comfort level of private
motor vehicle
Private motor vehicle comfort level (i.e.
odour, air condition, noise, cleanness, seat
comfort)
Transportation Planning and Technology 177
C:/3B2WIN/temp files/GTPT386312_S100.3d[x] 6th April 2009 19:57:40
combined index values that can later be easily used as parameters, or as
policy intervention domains. In addition, other more usual parameters are
used solely in the modelling steps such as figuring travel costs. Eleven major
disadvantages (variables) were identified which constituted the criteria used
in the clustering process to split the sample population into the two groups.
The individuals with relatively low scores were placed in the disadvantaged,
and the ones with high scores to the advantaged clusters. Consequently, the
number of the disadvantaged was 629 and the advantaged was 303. The
modelling approach required the separation of model runs of these two data
sets.
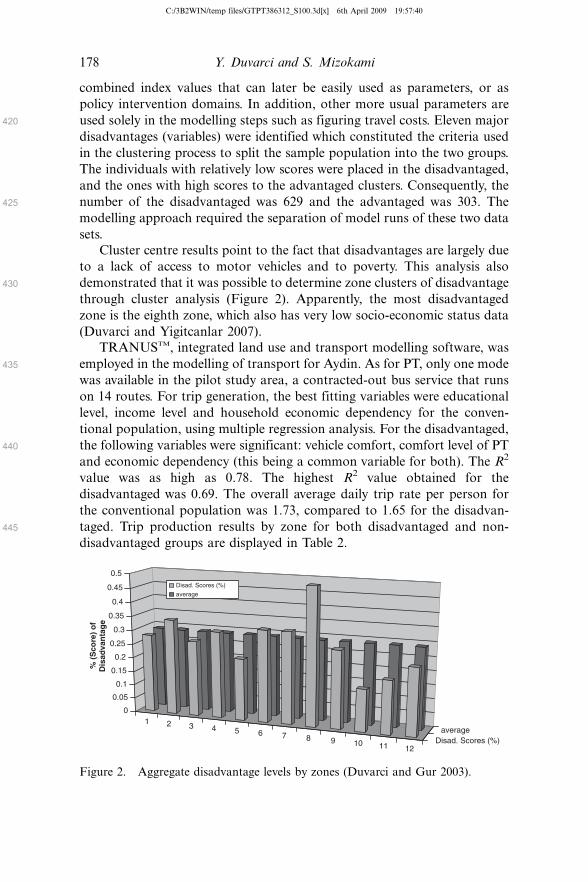
Cluster centre results point to the fact that disadvantages are largely due
to a lack of access to motor vehicles and to poverty. This analysis also
demonstrated that it was possible to determine zone clusters of disadvantage
through cluster analysis (Figure 2). Apparently, the most disadvantaged
zone is the eighth zone, which also has very low socio-economic status data
(Duvarci and Yigitcanlar 2007).
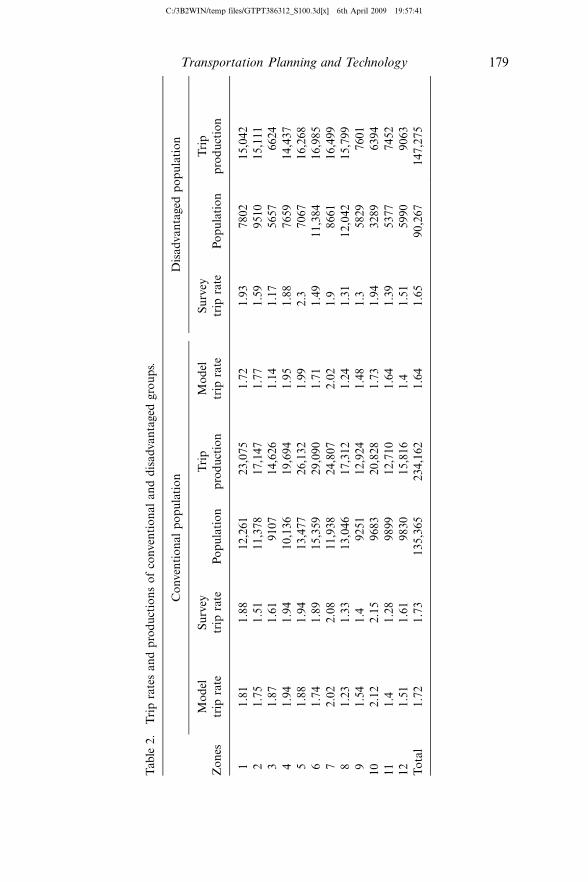
TRANUSTM, integrated land use and transport modelling software, was
employed in the modelling of transport for Aydin. As for PT, only one mode
was available in the pilot study area, a contracted-out bus service that runs
on 14 routes. For trip generation, the best fitting variables were educational
level, income level and household economic dependency for the conven-
tional population, using multiple regression analysis. For the disadvantaged,
the following variables were significant: vehicle comfort, comfort level of PT
and economic dependency (this being a common variable for both). The R2
value was as high as 0.78. The highest R2 value obtained for the
disadvantaged was 0.69. The overall average daily trip rate per person for
the conventional population was 1.73, compared to 1.65 for the disadvan-
taged. Trip production results by zone for both disadvantaged and non-
disadvantaged groups are displayed in Table 2.
420
425
430
435
440
445
1 2 3 4 5 6 7 8 9 10 11 12Disad. Scores (%)
average
0
0.05
0.1
0.15
0.2
0.25
0.3
0.35
0.4
0.45
0.5
% (
Sco
re)
of
Dis
adva
nta
ge
Disad. Scores (%)
average
Figure 2. Aggregate disadvantage levels by zones (Duvarci and Gur 2003).
178 Y. Duvarci and S. Mizokami
C:/3B2WIN/temp files/GTPT386312_S100.3d[x] 6th April 2009 19:57:40
Tab
le2
.T
rip
rate
sa
nd
pro
du
ctio
ns
of
con
ven
tio
na
la
nd
dis
ad
va
nta
ged
gro
up
s.
Co
nven
tio
na
lp
op
ula
tio
nD
isa
dva
nta
ged
po
pu
lati
on
Zo
nes
Mo
del
trip
rate
Su
rvey
trip
rate
Po
pu
lati
on
Tri
p
pro
du
ctio
n
Mo
del
trip
rate
Su
rvey
trip
rate
Po
pu
lati
on
Tri
p
pro
du
ctio
n
11
.81
1.8
81
2,2
61
23
,07
51
.72
1.9
37
80
21
5,0
42
21
.75
1.5
11
1,3
78
17
,14
71
.77
1.5
99
51
01
5,1
11
31
.87
1.6
19
10
71
4,6
26
1.1
41
.17
56
57
66
24
41
.94
1.9
41
0,1
36
19
,69
41
.95
1.8
87
65
91
4,4
37
51
.88
1.9
41
3,4
77
26
,13
21
.99
2.3
70
67
16
,26
8
61
.74
1.8
91
5,3
59
29
,09
01
.71
1.4
91
1,3
84
16
,98
5
72
.02
2.0
81
1,9
38
24
,80
72
.02
1.9
86
61
16
,49
9
81
.23
1.3
31
3,0
46
17
,31
21
.24
1.3
11
2,0
42
15
,79
9
91
.54
1.4
92
51
12
,92
41
.48
1.3
58
29
76
01
10
2.1
22
.15
96
83
20
,82
81
.73
1.9
43
28
96
39
4
11
1.4
1.2
89
89
91
2,7
10
1.6
41
.39
53
77
74
52
12
1.5
11
.61
98
30
15
,81
61
.41
.51
59
90
90
63
To
tal
1.7
21
.73
13
5,3
65
23
4,1
62
1.6
41
.65
90
,26
71
47
,27
5
Transportation Planning and Technology 179
C:/3B2WIN/temp files/GTPT386312_S100.3d[x] 6th April 2009 19:57:41
For the trip distribution stage, a singly constrained (production) gravity
model was used to determine the distribution (for a more detailed
explanation, see Duvarci and Yigitcanlar 2007). For the mode split stage,
employing a binomial utility approach, the utility function for the
disadvantaged could be explained solely by the combined impediment
variable. The mode split preferences in favour of PT were 0.43 for the
disadvantaged and 0.37 for the conventional population. To ascertain the
final traffic results and performance determining indicator results for user
disutility levels, the assignments were run using TRANUS.
Method of accounting for the suppressed demand of transportation
disadvantaged (TD)
Observing the pure impacts of the ‘once-suppressed’ but now released
demand (trip rate increase only) can be handled in two basic steps: first,
calculating the demand surplus (difference) released by the TD and; second,
integrating this released demand to the mainstream model structure and
observing the impacts as the result of this assignment.
Method of calculating ‘suppressed demand difference’
It is no easy task to measure a hidden fact, not simply because of its not
being apparent, but also due to the uncertainties in definition and
delimitation of what is to be measured. This difficulty in handling
suppressed demand in four-step modelling has been stated because of the
differences between the conditions for drawing up general trip making
behaviour based on socio-economic conditions (the derived, or ideal
demand) and the actual demand in actual trip making situations (the
apparent demand) (Kitamura 1996). As mentioned earlier, the measurement
process requires a ‘yardstick’ with which these measurements are to be
taken. Here, the calculation method will be different from the aforemen-
tioned elasticity measurements as simply put in Eq. (1). Since the sum of the
disadvantaged and the advantaged together make up normality, the
suppressed demand of the TD can be found on the basis of this ‘completion’
assumption; suppressed demand is the ‘deviance’ of the disadvantaged from
the normality in the existing situation by all means. Simply put, the subject
of this paper is to explore what impact this extra generated demand would
create on the existing transportation network and infrastructure. In the
following, the released ‘suppressed demand difference’ for Aydin city is
similar to the simple method as in the example shown above.
450
455
460
465
470
475
480
180 Y. Duvarci and S. Mizokami
C:/3B2WIN/temp files/GTPT386312_S100.3d[x] 6th April 2009 19:57:41

Method of integrating suppressed demand into modelling to find model outputs
The study is limited to the impacts of observable trip rate increases, that is,
to the additional released suppressed demand of the disadvantaged. Sincethe previous modelling study used the singly constrained (Oi) trip distribu-
tion approach, only trip production will be introduced in the trip
distribution modelling, and their impacts to the assignment stage, specifying
no other value throughout the model stages, in order to carry out a pure
impact analysis of the increased trips. The integration process can be
explained in four basic steps based upon the previous modelling steps to
obtain the disadvantage population, its trip production and trip rates.
Calculating ‘Released’ production of the disadvantaged (Oidis(rel))
Multiply the population (/Pdisi for each zone) of the disadvantaged by the
conventional populations’ trip production rates:
Odisi (rel)�Pdis
i :tnormi (2)
Calculating released trip distributions of the transportation disadvantaged
(TD) (Tijdis(rel))
Previous attraction factors of the conventional population’s trip distribution
calibration is directly multiplied by the above result (Step 1) for released
production (/Odisi (rel)) (as if future production):
Tdisij (rel)�Odis
i (rel):anormij (3)
where, anormij �d j:f (cij)=ajd j:f (cij); which is calibrated for the conventional
population. dj here means the total attractions by jth zones.The reason for taking the conventional population’s calibrated attraction
factors, instead of the disadvantaged, is that the conventional values are
always the ideal target for TD. The previously defined conventional
parameter values are assumed constant for the new modelling with the
released suppressed demands.
Running of all model steps on TRANUS (or other available software) as the
two separate models, and finally getting the no-release assignment results
(T(base)ijkl and the released demand assignment results T(rel)ijkl) for
comparison
This requires, first, a run of the base year model, and then, a run of the
suppressed demand’s released trips, without changing any other parameter
in the models.
485
490
495
500
505
510
515
Transportation Planning and Technology 181
C:/3B2WIN/temp files/GTPT386312_S100.3d[x] 6th April 2009 19:57:41

Running the reporting programmes of TRANUS for the analysis of the
assignment results, the performance indicators, such as disutility, cost and
service levels
General indicator outputs are derived from the Reporting Programmes
(IMPTRA and MATESP) to compare the basic results of the two models,
checking the appearance of additional volumes, costs, vehicle demand,
worsened level of service (LOS) conditions and disutilities. The results can be
controlled either from the display results from the TRANUS Assignments
Tabs, or from the numeric results from the reporting programmes.
Costs incurring to the operator (or local government) are of special
concern here. The results are discussed in the next section covering policy
implications. Finally, the meaning of these results for special TD groups,
such as elderly and disabled persons, falling under the disadvantaged
category can be analysed at one’s convenience. Through this analysis, the
following issues can be addressed: (a) the costs or additional burden (or
facilities) of TD released suppressed demand; (b) what costs and difficulties
TD groups may encounter as a result of the increased traffic; and (c) what
infrastructure improvement and facilities are required according to the needs
of the TD population. The process can be shown briefly as steps in chart
(Figure 3). In this chart, the released Demand Integration of Special TD
Groups (DSG) (to be explained later) is also shown.
Simulation results and comparison with the base ‘no-release’ case
To obtain the impact of released suppressed demand, simulation results of
the released trips as of assignment results derived from the base model of the
520
525
530
535
540
Calculating “Released” Productions of the disadvantaged
Calculating Released Trip Distributions of the Disadvantaged
Run of 4-step model as two separate models
Running of the Reporting Programs and Evaluation of the
Performance Indicators
The DSG integration (if required)
Summed up proportion of SG
populations (for each zone) (S)
Selecting most signific. proportions
(e.g. above 20%) (Sc)
multiply
Calculated DSG trips release
contrast
Only select OD pairs with SG above
1 (or close to 1) for policy focus
Policy analysis
suppr. dema.differences
Determining the TRANUS’ Exogeneous Trip Distribution Factors
Figure 3. Steps of released demand calculation together with the JDED integration.
182 Y. Duvarci and S. Mizokami
C:/3B2WIN/temp files/GTPT386312_S100.3d[x] 6th April 2009 19:57:42

‘no-release’ case were evaluated on the TRANUS software. Both display
results and general (summary) performance indicators for the ‘release’ and
‘no-release’ (base) cases were contrasted. The total suppressed trip release of
the disadvantaged from the previous section was 154,009 including intra-
zonal trips, this number was previously 147,123, which meant only an
approximately 5% increase from the suppressed situation before releaseoccurs. However, since the intra-zonal trips were not accounted for in the
previous modelling, these numbers became 103,930 and 101,317, respec-
tively, which is a trivial increase of about 3% (Table 4). There are also the
constant external trips added to the base-year trips that pass through five
external zones, which stay constant in all calculations in both the base and
the ‘release’ case. Finally, the net released trips were obtained by subtracting
the number of released trips with from the number of base year (or, ‘no-
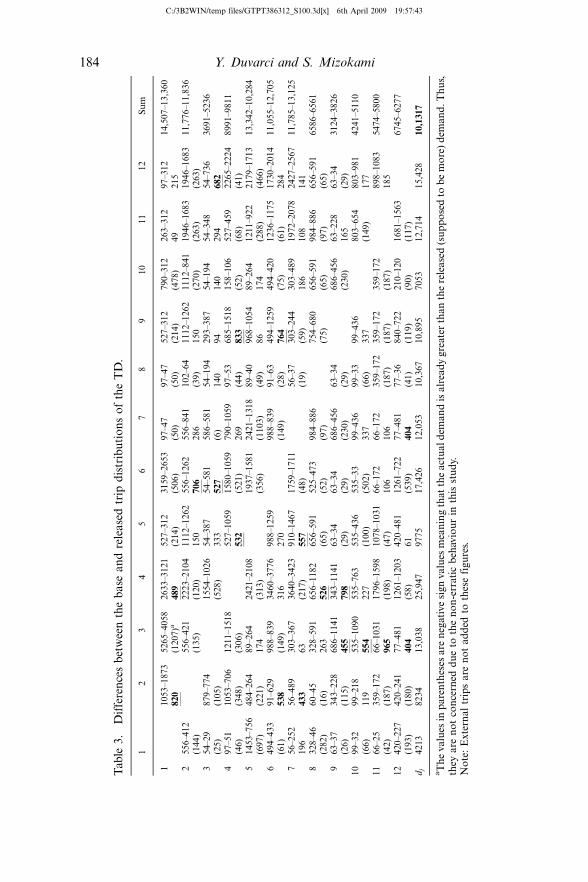
release’ case) trips (see Table 4). As shown in Table 3, we were not interestedin the negative sign results and, thus, they stayed out of our concerns, which
are marked by parentheses, meaning that literally no released trips occurred.
The most significant releases are the bold and underlined ones. These are to
function as the policy concern zone pairs. Only the bold ones are determined
to be significant. The net release (difference) can be denoted as:
Dij(rel) �Tdisij (rel)�Tdis
ij (base) (4)
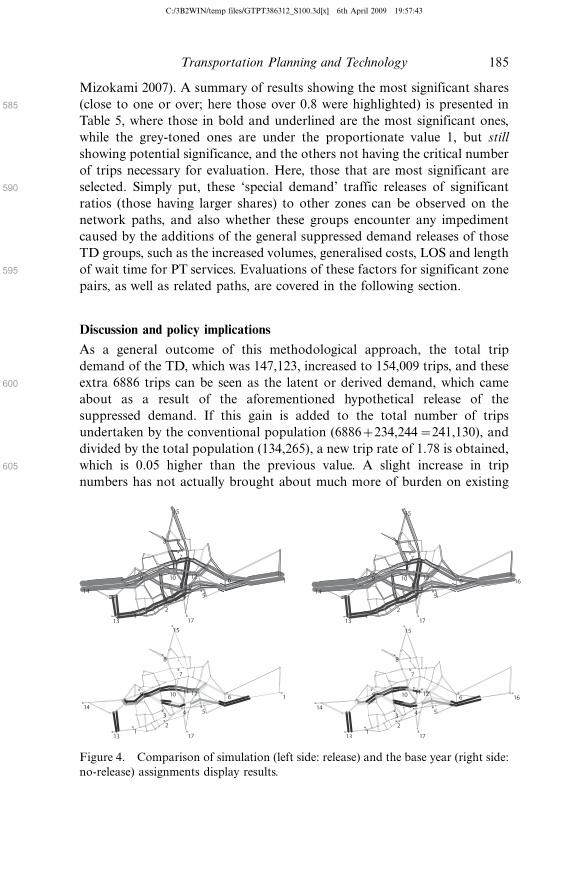
Finally, the results from the simulation and base-year results were compared,
and the basic differences between the two were evaluated across three basic
display indicators (from top to bottom: public and private mode equivalent
vehicles, the LOS and wait times, all with the same scaling) that showed
literally no significant difference between the base ‘release’ and ‘no-release’
cases (because of the present available capacity to accommodate an increase
traffic in the case of Aydin). There were only a few slight differences in the
LOS as released trips heightened congestion levels a bit, especially onpreviously congested links (Figure 4).
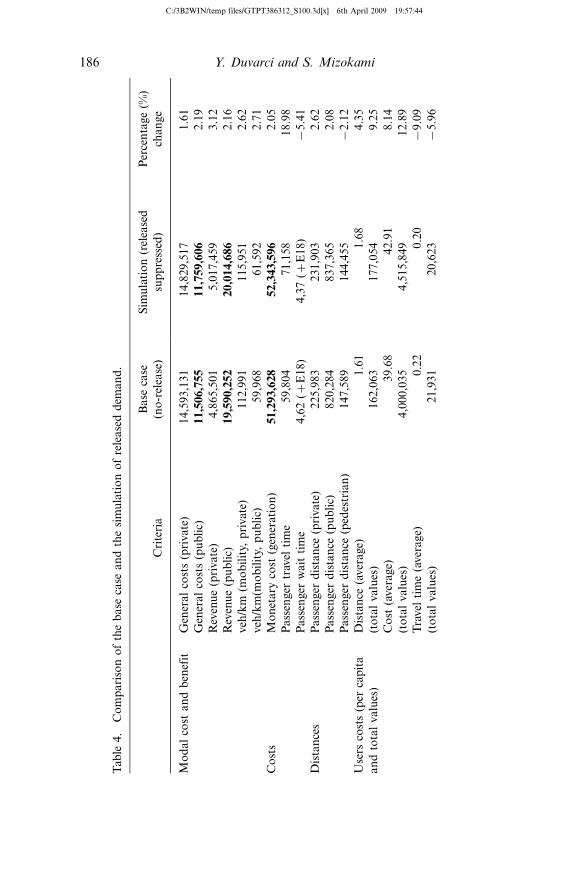
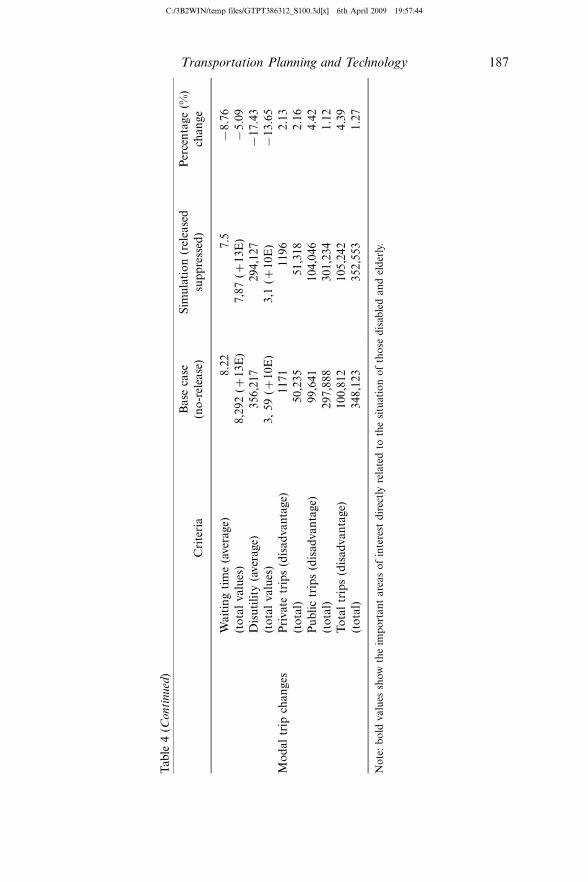
Similarly, utilising the IMPTRA reporting programme of TRANUS,
numerical results for basic costs, disutility and mobility related indicators
could be obtained. The general results achieved, according to the simula-
tions, are summarised in Table 4 and compared to the base-year results.
From these results, it can be generalised that the new case (release of
demand) imposes slightly higher cost burdens on both private and public
modes but, at the same time brings higher revenues, too. A detailedexplanation of these findings is provided in the discussion section.
As mentioned earlier, results peculiar to special demand groups (SDG)
such as the elderly and disabled, and their required transport needs, policies
and the necessary investments could also be captured and approximated by
simply adjoining the population ratios into the trip distribution stage (see
Figure 3), which have been already addressed elsewhere (Duvarci and
545
550
555
560
565
570
575
580
Transportation Planning and Technology 183
C:/3B2WIN/temp files/GTPT386312_S100.3d[x] 6th April 2009 19:57:42
Tab
le3
.D
iffe
ren
ces
bet
wee
nth
eb
ase
an
dre
lease
dtr
ipd
istr
ibu
tio
ns
of
the
TD
.
12
34
56
78
910
11
12
Su
m
11053�1
873
5265�4
058
2633�3
121
527�3
12
3159�2
653
97�4
797�4
7527�3
12
790�3
12
263�3
12
97�3
12
14,5
07�1
3,3
60
820
(1207)a
489
(214)
(506)
(50)
(50)
(214)
(478)
49
215
2556�4
12
556�4
21
2223�2
104
1112�1
262
556�1
262
556�8
41
102�6
41112�1
262
1112�8
41
1946�1
683
1946�1
683
11,7
76�1
1,8
36
(144)
(135)
(120)
150
706
286
(39)
150
(270)
(263)
(263)
354�2
9879�7
74
1554�1
026
54�3
87
54�5
81
586�5
81
54�1
94
293�3
87
54�1
94
54�3
48
54�7
36
3691�5
236
(25)
(105)
(528)
333
527
(6)
140
94
140
294
682
497�5
11053�7
06
1211�1
518
527�1
059
1580�1
059
790�1
059
97�5
3685�1
518
158�1
06
527�4
59
2265�2
224
8991�9
811
(46)
(348)
(306)
532
(521)
269
(44)
833
(52)
(68)
(41)
51453�7
56
484�2
64
89�2
64
2421�2
108
1937�1
581
2421�1
318
89�4
0968�1
054
89�2
64
1211�9
22
2179�1
713
13,3
42�1
0,2
84
(697)
(221)
174
(313)
(356)
(1103)
(49)
86
174
(288)
(466)
6494�4
33
91�6
29
988�8
39
3460�3
776
988�1
259
988�8
39
91�6
3494�1
259
494�4
20
1236�1
175
1730�2
014
11,0
55�1
2,7
05
(61)
538
(149)
316
270
(149)
(28)
764
(75)
(61)
284
756�2
52
56�4
89
303�3
67
3640�3
423
910�1
467
1759�1
711
56�3
7303�2
44
303�4
89
1972�2
078
2427�2
567
11,7
85�1
3,1
25
196
433
63
(217)
557
(48)
(19)
(59)
186
108
141
8328�4
660�4
5328�5
91
656�1
182
656�5
91
525�4
73
984�8
86
754�6
80
656�5
91
984�8
86
656�5
91
6586�6
561
(282)
(16)
263
526
(65)
(52)
(97)
(75)
(65)
(97)
(65)
963�3
7343�2
28
686�1
141
343�1
141
63�3
463�3
4686�4
56
63�3
4686�4
56
63�2
28
63�3
43124�3
826
(26)
(115)
455
798
(29)
(29)
(230)
(29)
(230)
165
(29)
10
99�3
299�2
18
535�1
090
535�7
63
535�4
36
535�3
399�4
36
99�3
399�4
36
803�6
54
803�9
81
4241�5
110
(66)
119
554
227
(100)
(502)
337
(66)
337
(149)
177
11
66�2
5359�1
72
66�1
031
1796�1
598
1078�1
031
66�1
72
66�1
72
359�1
72
359�1
72
359�1
72
898�1
083
5474�5
800
(42)
(187)
965
(198)
(47)
106
106
(187)
(187)
(187)
185
12
420�2
27
420�2
41
77�4
81
1261�1
203
420�4
81
1261�7
22
77�4
81
77�3
6840�7
22
210�1
20
1681�1
563
6745�6
277
(193)
(180)
404
(58)
61
(539)
404
(41)
(119)
(90)
(117)
dj
4213
8234
13,0
38
25,9
47
9775
17,4
26
12,0
53
10,3
67
10,8
95
7053
12,7
14
15,4
28
10,1
317
aT
he
va
lues
inp
are
nth
eses
are
neg
ati
ve
sig
nva
lues
mea
nin
gth
atth
ea
ctu
al
dem
an
dis
alr
ead
yg
reat
erth
an
the
rele
ase
d(s
up
po
sed
tob
em
ore
)d
eman
d.
Th
us,
they
are
no
tco
nce
rned
du
eto
the
no
n-e
rrat
icb
ehav
iou
rin
this
stu
dy.
No
te:
Exte
rna
ltr
ips
are
no
ta
dd
edto
thes
efi
gu
res.
184 Y. Duvarci and S. Mizokami
C:/3B2WIN/temp files/GTPT386312_S100.3d[x] 6th April 2009 19:57:43
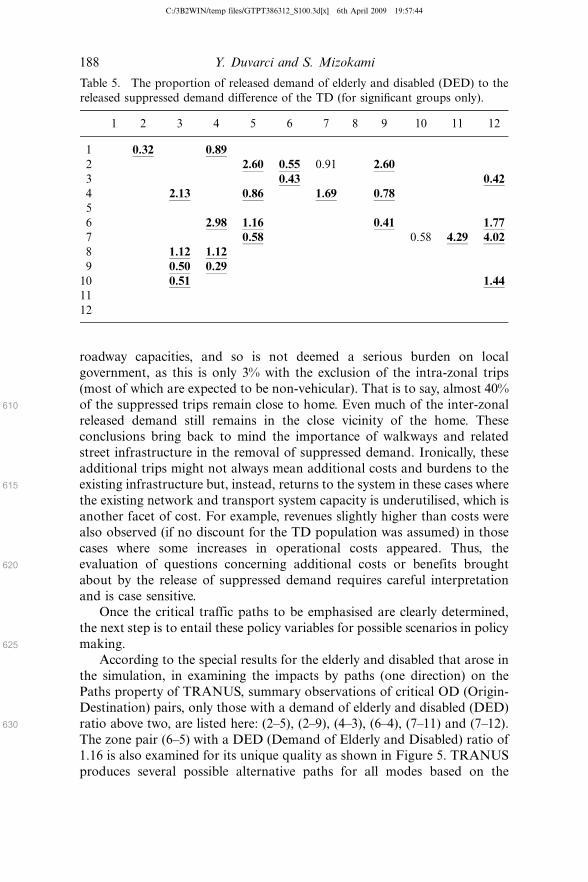
Mizokami 2007). A summary of results showing the most significant shares
(close to one or over; here those over 0.8 were highlighted) is presented in
Table 5, where those in bold and underlined are the most significant ones,
while the grey-toned ones are under the proportionate value 1, but still
showing potential significance, and the others not having the critical number
of trips necessary for evaluation. Here, those that are most significant are
selected. Simply put, these ‘special demand’ traffic releases of significant
ratios (those having larger shares) to other zones can be observed on the
network paths, and also whether these groups encounter any impediment
caused by the additions of the general suppressed demand releases of those
TD groups, such as the increased volumes, generalised costs, LOS and length
of wait time for PT services. Evaluations of these factors for significant zone
pairs, as well as related paths, are covered in the following section.
Discussion and policy implications
As a general outcome of this methodological approach, the total trip
demand of the TD, which was 147,123, increased to 154,009 trips, and these
extra 6886 trips can be seen as the latent or derived demand, which came
about as a result of the aforementioned hypothetical release of the
suppressed demand. If this gain is added to the total number of trips
undertaken by the conventional population (6886�234,244�241,130), and
divided by the total population (134,265), a new trip rate of 1.78 is obtained,
which is 0.05 higher than the previous value. A slight increase in trip
numbers has not actually brought about much more of burden on existing
585
590
595
600
605
Figure 4. Comparison of simulation (left side: release) and the base year (right side:
no-release) assignments display results.
Transportation Planning and Technology 185
C:/3B2WIN/temp files/GTPT386312_S100.3d[x] 6th April 2009 19:57:43
Tab
le4
.C
om
pa
riso
no
fth
eb
ase
case
an
dth
esi
mu
lati
on
of
rele
ase
dd
ema
nd
.
Cri
teri
a
Ba
seca
se
(no
-rel
ease
)
Sim
ula
tio
n(r
elea
sed
sup
pre
ssed
)
Per
cen
tag
e(%
)
cha
ng
e
Mo
da
lco
sta
nd
ben
efit
Gen
era
lco
sts
(pri
vate
)1
4,5
93
,13
11
4,8
29
,51
71
.61
Gen
era
lco
sts
(pu
bli
c)1
1,5
06
,75
51
1,7
59
,60
62
.19
Rev
enu
e(p
rivate
)4
,86
5,5
01
5,0
17
,45
93
.12
Rev
enu
e(p
ub
lic)
19
,59
0,2
52
20
,01
4,6
86
2.1
6
veh
/km
(mo
bil
ity,
pri
vat
e)1
12
,99
11
15
,95
12
.62
veh
/km
(mo
bil
ity,
pu
bli
c)5
9,9
68
61
,59
22
.71
Co
sts
Mo
net
ary
cost
(gen
erati
on
)5
1,2
93
,62
85
2,3
43
,59
62
.05
Pa
ssen
ger
trav
elti
me
59
,80
47
1,1
58
18
.98
Pa
ssen
ger
wa
itti
me
4,6
2(�
E1
8)
4,3
7(�
E1
8)
�5
.41
Dis
tan
ces
Pa
ssen
ger
dis
tan
ce(p
rivat
e)2
25
,98
32
31
,90
32
.62
Pa
ssen
ger
dis
tan
ce(p
ub
lic)
82
0,2
84
83
7,3
65
2.0
8
Pa
ssen
ger
dis
tan
ce(p
edes
tria
n)
14
7,5
89
14
4,4
55
�2
.12
Use
rsco
sts
(per
cap
ita
an
dto
tal
va
lues
)
Dis
tan
ce(a
ver
ag
e)1
.61
1.6
84
.35
(to
tal
va
lues
)1
62
,06
31
77
,05
49
.25
Co
st(a
ver
ag
e)3
9.6
84
2.9
18
.14
(to
tal
va
lues
)4
,00
0,0
35
4,5
15
,84
91
2.8
9
Tra
vel
tim
e(a
ver
ag
e)0
.22
0.2
0�
9.0
9
(to
tal
va
lues
)2
1,9
31
20
,62
3�
5.9
6
186 Y. Duvarci and S. Mizokami
C:/3B2WIN/temp files/GTPT386312_S100.3d[x] 6th April 2009 19:57:44
Tab
le4
(Co
nti
nu
ed)
Cri
teri
a
Ba
seca
se
(no
-rel
ease
)
Sim
ula
tio
n(r
elea
sed
sup
pre
ssed
)
Per
cen
tag
e(%
)
cha
ng
e
Wa
itin
gti
me
(aver
ag
e)8
.22
7.5
�8
.76
(to
tal
va
lues
)8
,29
2(�
13
E)
7,8
7(�
13
E)
�5
.09
Dis
uti
lity
(aver
ag
e)3
56
,21
72
94
,12
7�
17
.43
(to
tal
va
lues
)3
,5
9(�
10
E)
3,1
(�1
0E
)�
13
.65
Mo
da
ltr
ipch
an
ges
Pri
vate
trip
s(d
isa
dva
nta
ge)
11
71
11
96
2.1
3
(to
tal)
50
,23
55
1,3
18
2.1
6
Pu
bli
ctr
ips
(dis
ad
va
nta
ge)
99
,64
11
04
,04
64
.42
(to
tal)
29
7,8
88
30
1,2
34
1.1
2
To
tal
trip
s(d
isa
dva
nta
ge)
10
0,8
12
10
5,2
42
4.3
9
(to
tal)
34
8,1
23
35
2,5
53
1.2
7
No
te:
bo
ldva
lues
sho
wth
eim
po
rta
nt
are
as
of
inte
rest
dir
ectl
yre
late
dto
the
situ
atio
no
fth
ose
dis
able
da
nd
eld
erly
.
Transportation Planning and Technology 187
C:/3B2WIN/temp files/GTPT386312_S100.3d[x] 6th April 2009 19:57:44
roadway capacities, and so is not deemed a serious burden on local
government, as this is only 3% with the exclusion of the intra-zonal trips
(most of which are expected to be non-vehicular). That is to say, almost 40%
of the suppressed trips remain close to home. Even much of the inter-zonal
released demand still remains in the close vicinity of the home. These
conclusions bring back to mind the importance of walkways and related
street infrastructure in the removal of suppressed demand. Ironically, these
additional trips might not always mean additional costs and burdens to the
existing infrastructure but, instead, returns to the system in these cases where
the existing network and transport system capacity is underutilised, which is
another facet of cost. For example, revenues slightly higher than costs were
also observed (if no discount for the TD population was assumed) in those
cases where some increases in operational costs appeared. Thus, the
evaluation of questions concerning additional costs or benefits brought
about by the release of suppressed demand requires careful interpretation
and is case sensitive.Once the critical traffic paths to be emphasised are clearly determined,
the next step is to entail these policy variables for possible scenarios in policy
making.
According to the special results for the elderly and disabled that arose in
the simulation, in examining the impacts by paths (one direction) on the
Paths property of TRANUS, summary observations of critical OD (Origin-
Destination) pairs, only those with a demand of elderly and disabled (DED)
ratio above two, are listed here: (2�5), (2�9), (4�3), (6�4), (7�11) and (7�12).
The zone pair (6�5) with a DED (Demand of Elderly and Disabled) ratio of
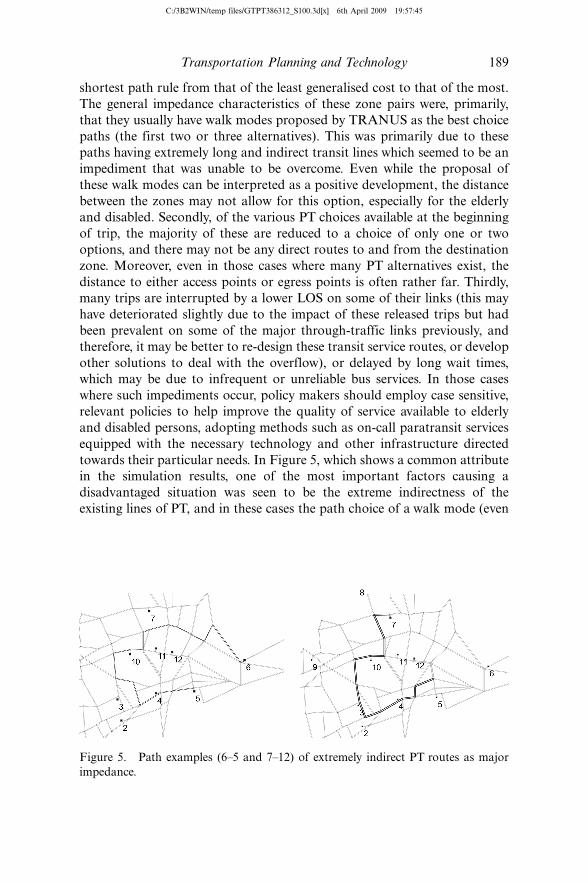
1.16 is also examined for its unique quality as shown in Figure 5. TRANUS
produces several possible alternative paths for all modes based on the
610
615
620
625
630
Table 5. The proportion of released demand of elderly and disabled (DED) to the
released suppressed demand difference of the TD (for significant groups only).
1 2 3 4 5 6 7 8 9 10 11 12
1 0.32 0.89
2 2.60 0.55 0.91 2.60
3 0.43 0.42
4 2.13 0.86 1.69 0.78
5
6 2.98 1.16 0.41 1.77
7 0.58 0.58 4.29 4.02
8 1.12 1.12
9 0.50 0.29
10 0.51 1.44
11
12
188 Y. Duvarci and S. Mizokami
C:/3B2WIN/temp files/GTPT386312_S100.3d[x] 6th April 2009 19:57:44
shortest path rule from that of the least generalised cost to that of the most.
The general impedance characteristics of these zone pairs were, primarily,
that they usually have walk modes proposed by TRANUS as the best choice
paths (the first two or three alternatives). This was primarily due to these
paths having extremely long and indirect transit lines which seemed to be an
impediment that was unable to be overcome. Even while the proposal of
these walk modes can be interpreted as a positive development, the distance
between the zones may not allow for this option, especially for the elderly
and disabled. Secondly, of the various PT choices available at the beginning
of trip, the majority of these are reduced to a choice of only one or two
options, and there may not be any direct routes to and from the destination
zone. Moreover, even in those cases where many PT alternatives exist, the
distance to either access points or egress points is often rather far. Thirdly,
many trips are interrupted by a lower LOS on some of their links (this may
have deteriorated slightly due to the impact of these released trips but had
been prevalent on some of the major through-traffic links previously, and
therefore, it may be better to re-design these transit service routes, or develop
other solutions to deal with the overflow), or delayed by long wait times,
which may be due to infrequent or unreliable bus services. In those cases
where such impediments occur, policy makers should employ case sensitive,
relevant policies to help improve the quality of service available to elderly
and disabled persons, adopting methods such as on-call paratransit services
equipped with the necessary technology and other infrastructure directed
towards their particular needs. In Figure 5, which shows a common attribute
in the simulation results, one of the most important factors causing a
disadvantaged situation was seen to be the extreme indirectness of the
existing lines of PT, and in these cases the path choice of a walk mode (even
Figure 5. Path examples (6�5 and 7�12) of extremely indirect PT routes as major
impedance.
Transportation Planning and Technology 189
C:/3B2WIN/temp files/GTPT386312_S100.3d[x] 6th April 2009 19:57:45
where the zone pairs were not so close to each other) becomes more
beneficial in terms of the generalised cost on the critical paths selected.
An evaluation of the data in Table 4 is required even though the results
do not tell us much about the differences between the base (no-release) case
and that of the simulated release. However, the results indicate the general
results of the entire city, not only those of the TD population. Looking at thecosts and benefits for operators, there are around 2�3% increases with the
observed increase of 5% in the general trip rate, so one can say that costs and
revenues (assuming ticket prices are not discounted for the TD groups)
almost even out. It is interesting to note, however, that there is an almost
5.4% decline in overall wait times, which is a positive indicator. Looking at
per user (average) results, although there is a fair increase in the amount of
distance travelled (4.3%) and the costs (8.1%) per person, there are even
more dramatic decreases in the wait time at bus stops (8.8%) (due mostprobably to the increased frequency of service), disutility (17.4%) and travel
time (9.1%), and these results are beyond what was to be expected. In the
criteria for modal trip changes, there is a slight increase in the number of
private trips (2.15) by the disadvantaged, which can be interpreted as an
improvement in their mobility. Of even more benefit is the greater inclination
of the disadvantaged to use PT modes, most likely because of the improved
conditions in PT, and this allows for transportation policies which focus on
improvements of PT conditions, since it promises greater benefits fordisabled persons.
Accordingly, issues of what can be carried out in practice and how these
results can be utilised are those of the policy making and planning process,
taking into account coordination issues. Although these issues are beyond
the scope of this paper, there is a necessity to connect the outcomes of this
research to these policy making and coordination efforts. First of all, in
compliance with new legislation that has been proposed in many countries,
the use of advanced technology show great promise in aiding thosevulnerable groups, such as the elderly and the disabled, after the level of
their demand and the paths they will use are known. Planners must become
aware of the fact that only if appropriate policies are applied and
improvements, primarily technological aids and facility improvements, are
undertaken for the purpose of providing the TD with service, will
disadvantaged groups release their real travel demands. This is therefore a
method of returning the deferred transportation service utility back to them.
Many on-going UK-based projects as PEDFLOW (Design of PedestrianNetworks and Facilities especially modelling vehicle/pedestrian interaction),
PERMEATE (Pedestrian Activity Measurement in the Transport Environ-
ment) and studies exploring the role of transportation in social exclusion,
and projects such as TELSCAN (TELematic Standards and Coordination
of Advanced Telematics systems in relation to elderly and disabled
travellers), a detailed study aimed at developing a design guidebook for
635
640
645
650
655
660
190 Y. Duvarci and S. Mizokami
C:/3B2WIN/temp files/GTPT386312_S100.3d[x] 6th April 2009 19:57:45
ITS designers, all show some promise in helping to improve present travel
conditions, especially those of the elderly and the handicapped. In the
improvement of trips for the disadvantaged and the release of suppressed
demand, the possible role of ICTs has been shown to be of great worth
(Church et al. 2000).
Information is the second essential parameter on the way to improvingtravel conditions, especially for those who have hearing, visual or other
sensual impairments as well as for conventional travellers, which is an issue
that can also be solved with ITS, and while it was not a major issue among
our sample of PT users, it would seem � as Grieco (2003) has put it � that
those who are dependent on a service tend to know their way around it in
some detail. But the use of some forms of ITS technology, while offering
means of ‘virtual mobility’ to assist TD groups in accomplishing activities
without actually travelling, does not appear to be a satisfactory solution, asthis could lead to more isolated individuals, and more suppression of real
(latent) travel demand under the guise of this ‘virtual mobility’, even in those
cases where the activities are accomplished, this conflicts with the very idea
of helping the disadvantaged to release their suppressed demand. Above all,
coordination efforts and the role of active participation for effective
feedback mechanisms concerning applications is a necessity that local
authorities must encourage. As Grieco (2003) puts it, unless the direct
participation of the SE is built into the design of transport research andtransport operations, the consequences of poor system design remain borne
by the excluded and will continue to go largely unvoiced.
Funding issues are another point that needs to be resolved urgently for
these costly ITS-based applications, but these are, in a sense, a form of
compensation which helps return to the TD groups their deferred rights both
in terms of the effective utilisation of transport facilities and the restoration
of full accessibility. Local governments should be prepared to have available
funds and new organisational structures ready to accomplish this task ofrestoration, while not requiring as large a share of budget as previously
hypothesised (Grieco 2003).
In practice, efforts aimed at reducing travel by private vehicle, employing
non-monetary measures such restrictive car parking (thereby penalising the
use of automobiles), priorities in enabling PT (greater frequency or
alternative modes and more coverage in urban areas) and pedestrianism
have been proposed as a means of overcoming the present inequities. Pricing
and other monetary measures focused on motorists and used as a means ofcompensation favouring disadvantaged groups are suggested as strong tools.
These funds can then be directed to the improvement of the TD population’s
travel conditions. There can be many policy measures of both supply and
demand types, and among these of special interest are: (1) additional transit
services with particular characteristics and improvements in services; and/or
(2) on-call paratransit service operators with flexible routes and discounted
665
670
675
680
685
690
695
700
Transportation Planning and Technology 191
C:/3B2WIN/temp files/GTPT386312_S100.3d[x] 6th April 2009 19:57:45
ticket prices for elderly, disabled and low income riders, which are heavily
utilised by the elderly and the disabled. These propositions may be rather
general but are presented as examples for possible future action. In previous
modelling studies carried out by Duvarci and Gur (2003), similar scenarios
showed good results in simulations, especially for those areas densely
populated by the elderly, disabled and poor. In these areas paratransitservices attracted most of the existing transit rideshare (as much as 90%).
Conclusion
Measuring suppressed demand has, in general, been a neglected subject.
Over and above the small number of elasticity approaches, other techniques
are required to take into consideration matters of transportation equity and
the particular circumstances of TD groups. Measuring the impacts broughtabout by the hypothetical release of suppressed demand, and specifically of
that of the TD population, through a simulation-based approach was the
subject of this study.
Under this assumption, a cluster-based modelling approach for TD
groups shows great promise in use as a yardstick for measuring the
suppressed travel demands of these groups. Using the previous results of
modelling done by Duvarci and Yigitcanlar (2007), a metric was developed
based on a ‘what if?’ approach in the measurement of both the suppresseddemand and the would-be impacts if that demand was released. The main
purpose of this was to answer the question of whether the impacts and costs
of such additional trips are heavier than the local government’s and the
existing infrastructure’s capacity to handle them. In actuality, as was
observed in the ‘release’ case scenario simulation run on TRANUS software,
there was none of the expected heavy burden on the system. Secondly, the
aim was also to identify, using the example of elderly and disabled groups,
problems that can be diagnosed on the basis of a demand analysis of thesespecial TD groups � the paths that will see heavy use (with the released trips),
the attendant infrastructure needs on these paths and whether or not the
impediments they encounter can be overcome. Thus, transportation
authorities can make use of these results and deploy the appropriate
policies, infrastructure designs and technologies in the right places in order
to help to alleviate both general disadvantages and the particular disadvan-
tages of the TD population, without worsening the present situation of
conventional groups through added costs and congestion. The methodologyproposed has worked successfully, and is in compliance with the previous
modelling approach, producing results that can give guidance for evaluation
in the policy-making stage. This study is limited to trip production and their
impacts through the modelling steps. Further studies should also focus on
more detailed interpretation of simulation results for the purpose of policy
analysis, or for future estimation of suppressed demand.
705
710
715
720
725
730
735
740
745
192 Y. Duvarci and S. Mizokami
C:/3B2WIN/temp files/GTPT386312_S100.3d[x] 6th April 2009 19:57:45
References
Cervero, R., 2003a. Are induced travel studies inducing bad investments. Access, 22,22�27.
Cervero, R., 2003b. Road expansion, urban growth, and induced travel: a pathanalysis. Journal of the American Planning Association, 69 (1), 145�163.
Church, A., Frost, M., and Sullivan, K., 2000. Transport and social exclusion inLondon. Transport Policy, 7 (3), 195�205.
Davidse, R.J., 2006. Older drivers and ADAS: which systems improve road safety.IATSS Research, 30 (1), 6�20.
Downs, A., 1992. Stuck in traffic coping with peak hour traffic congestion.Washington, DC: Brookings Institution.
Duvarci, Y. and Gur, G., 2003. The method of policy capturing for the transportationdisadvantaged: simulation results. Proceedings of Urban Transport IX, Sevilla, WITPress, 463�480.
Duvarci, Y. and Mizokami S., 2007. What if the suppressed travel demands of thetransport disadvantaged were released: results of a simulation approach. Journal ofthe Eastern Asia Society for Transportation Studies, 7, 1433�1445.
Duvarci, Y. and Yigitcanlar, T., 2007. An integrated modeling approach for thetransportation disadvantaged. Journal of Urban Planning and Development, 133(3), 188�200.
Grieco, M.S., 2003. Transport and social exclusion: new policy grounds, new policyoptions. In: 10th international conference on travel behaviour research, August.Lucerne. Available from: www.ivt.baum.ethz.ch/allgemein/pdf/grieco.pdf.
Heggie, I.J. and Jones, P.M., 1978. Defining domains for models of travel demand.Transportation, 7, 119�125.
Hine, J. and Grieco, M., 2003. Scatters and clusters in time and space: implicationsfor delivering integrated and inclusive transport. Transport Journal, 10, 299�306.
Hine, J. and Mitchell, F., 2003. Transport disadvantage and social exclusion.Aldershot: Ashgate.
Howe, D.A., 1992. Creating vital communities: planning for our aging society.Planning Commissioners Journal, 7 (November/December). Available from: http://www.plannersweb.com/articles/how030.html.
Kitamura, R., 1996. Applications of models of activity behaviour for activity baseddemand forecasting, TMIP. Activity-based travel forecasting conference proceed-ings, 2�5 June 1996. Washington, DC: USDOT, Texas Transportation Institute,Available from: http://tmip.fhwa.dot. gov/clearinghouse/docs/abtf/kitamura.stm.
Limanond, T. and Niemeier, D.A., 2004. Effect of land use on decisions of shoppingtour generation: a case study of three traditional neighborhoods in WA.Transportation, 31 (2), 153�181.
Litman, T., 2001. Generated traffic and induced travel, implications for transportplanning. ITE Journal, 71 (4), 38�47.
Litman, T., 2005. Induced travel impact evaluation. VTPI. Available from:www.vtpi.org VTPI web site [Accessed 11 May 2005].
Litman, T. and Colman, S.B., 2001. Generated traffic: implications for transportplanning. ITE Journal, 71 (4), 38�47.
Lucas, K., 2006. Providing transport for social inclusion within framework forenvironmental justice in UK. Transportation Research: Part A, 40, 801�809.
Mokhtarian, P.L. and Salomon, I., 2001. How derived is the demand for travel: someconceptual and measurement considerations. Transportation Research: Part A, 35,695�719.
Mokhtarian, P.L., Salomon, I., and Handy, S.L., 2006. The impacts of ICT on leisureactivities and travel: a conceptual exploration. Transportation, 33, 263�289.
750
755
760
765
770
775
780
785
790
Transportation Planning and Technology 193
C:/3B2WIN/temp files/GTPT386312_S100.3d[x] 6th April 2009 19:57:45
Newman, P. and Kenworthy, J., 1999. Sustainability and cities: overcoming automobiledependence. Washington, DC: Island Press.
Noland, R.B. and Lem, L.L., 2002. A review of the evidence for induced travel andchanges in transportation and environmental policy in the US and the UK.Transportation Research: Part D, 7, 1�26.
Pendyala, R.M. and Bhat, C.R., 2006. Validation and assessment of activity basedtravel demand modeling systems, innovations in travel demand modeling, Vol. 2,pp.157�160. Transportation research board conference, 21�23 May 2006. Austin:The University of Texas.
Pennycook, F., et al., 2001. Environmental justice: mapping transport and socialexclusion in Bradford, Friends of the Earth. Available from: www.foe.co.uk/resource/reports/env_justice_bradford.pdf (Accessed 15 June 2007).
Porter, A., 2002. Compromise and constraint: examining the nature of transportdisability in the context of local travel. World Transport Policy and Practice, 8 (2),9�16.
Rodriguez, D.A. and Joo, J., 2004. The relationship between non-motorized modechoice and the local physical environment. Transportation Research: Part D, 9,151�173.
Schmocker, J.D., et al., 2005. Estimating trip generation of elderly and disabledpeople: an analysis of London data. Journal of the Transportation Research Board,1924, 9�18.
Social Exclusion Unit, 2003. Making the connections: final report on transport andsocial exclusion. Office of the Deputy Prime Minister, London. Available from:www.social exclusionunit.gov.uk (Accessed 11 April 2007)
Srinavasan, S. and Ferreira, J., 2002. Travel behaviour at the household level:understanding linkages with residential choice. Transportation Research: Part D, 7,225�242.
Suen, S.L. and Mitchell, C.G.B., 2000. Accessible transportation and mobility:transport in the new millennium. Washington, DC: Transportation Research Board.
Transtech Management, Inc. and Bailly, H., 2000. Assessing the issue of inducedtravel: a briefing on evidence & implications from the literature. A report preparedfor Washington Metropolitan Council of Governments, July.
Zhang, X. and Hu, X., 2003. Enabling sustainable urban road transport in China: apolicy and institutional perspective (working paper). Research Center for Con-temporary Management Institute of Energy, Environment, and Economy,Tsinghua University, Beijing.
795
800
805
810
815
820
825
830
835
840
194 Y. Duvarci and S. Mizokami
C:/3B2WIN/temp files/GTPT386312_S100.3d[x] 6th April 2009 19:57:45