Embed Size (px)
Citation preview

City of Saint Paul Market WatCh rePortVoluMe 7: SPring 2016
A Summary of Development, Economic, and Demographic Trends in the Capital City

Int
rod
uc
tIo
n
2
table of contents
Report Purpose 3 Issue Highlights & Summary 4
Total Permit Numbers & Value 8 Major Construction Projects 12 Residential Construction 15 Demolitions 19 Foreclosures 21 Vacant Buildings 23
Employment in Saint Paul 25 Employment Forecasts 26 Annual Job Trends 29 Jobs by Sector 31 Average Weekly Wages 34
Population Forecasts 37 Population by Age 38 Race & Ethnicity 41 Poverty 42 Educational Attainment 47
buIldIng and development
demographIcs
employment and Wages
IntroductIon

Int
rod
uc
tIo
n
3
report purpose
Seventh Semi-Annual Market Watch ReportThe purpose of this report is to summarize the ways that Saint Paul is influenced by a constantly changing social and economic landscape. Saint Paul Market Watch is published semi-annually, and the indicators featured will continue to evolve to best capture the changes occurring within the city. The data presented in this report are sourced from a number of organizations, including the U.S. Census Bureau, the Minnesota Department of Employment and Economic Development, and various executive departments of the City of Saint Paul. Much of this data has not been previously reported to the public, although some may be available through other sources.
This issue builds on the information presented in previous editions by continuing to analyze trends in three important measures of city growth and development. Three major categories of data are organized according to color:
1. Building and Development (Orange) 2. Employment (Olive) 3. Demographics (Light Blue)
Consolidating this information in a single report provides a clearer, more understandable view of activity occurring within our city. Every stakeholder in the city, including the Mayor and City Council, residents, developers, workers, visitors, and businesses are more able to understand a wide variety of trends important to personal, social, and economic decisions. This report is designed to achieve a wide range of goals:
• Provide a rich source of information for everyone in the community • Demonstrate policy outcomes in order to foster transparency and accountability for policy decisions • Guide future decisions and policies • Foster civic and community pride
Your suggestions, comments, or questions are welcome. Please contact Jake Reilly at [email protected] or 651-266-6618.
City of Saint Paul, Department of Planning & Economic Development (PED)25 W. 4th St., Suite 1300 Saint Paul, MN 55102
Jonathan Sage-MartinsonDepartment [email protected]
Project Coordinator:Jake ReillySenior [email protected]
Research and Design:Vincent FergusonResearch Intern

4
Int
rod
uc
tIo
nIssue hIghlIghts
Building and Development• Building and development activity in the city remains strong. More than $560 million in permits were issued during
2015. This is the highest dollar amount in the past seven years, surpassing the previous record set in 2014. The total number of permits per year has decreased slightly since 2013. However, 50 building permits worth more than $1 million were issued in 2015, more than double last year’s total of 18 permits.
Housing• While the number of building permits for single-family homes has remained steady in the past few years, the
combined value of those permits is steadily increasing year over year. Yearly foreclosures have decreased by nearly 80% since 2008. The number of vacant buildings and total building demolitions show similar downward trends.
Employment and Wages• Unemployment has dropped to 3.2% for the last quarter of 2015, and a 3.8% average for 2015 (down from the
5.3% average for 2014). The number of jobs in the city continues to increase over previous years.
Demographics• Demographic data shows that Saint Paul’s population has become more racially and ethnically diverse since 2009.• The percentage of residents with a college or graduate degree continues to grow moderately, while the percentage
of residents who have obtained a high school diploma declines moderately.• Poverty rates in Saint Paul continue to increase. Communities of color are experiencing poverty at a greater rate
than populations that identify as white.

Int
rod
uc
tIo
n
5
report summary
The summary below shows directional trends for the year of 2015. Arrows indicate the relative direction of change compared to previous years while colors indicate whether these changes can be considered positive or negative for Saint Paul.
Positive trends in both directions represent changes that are generally good for the city, while negative trends represent detrimental changes. Some trends are characterized as neutral because the change is neither good nor bad for the city or its residents.
Total value of building permits• $565.5 million
Total Number of permits• 4,727
New Buildings• 496
Projects over $1 million• 50
Single-family Permits• 1,360
New construction value• $17.6 million
Addition Value• $10.4 million
Remodel value• $20.8 million
Demolitions• 191 Total
• 29 Commercial• 162 Residential
Foreclosures• 465
Vacant buildings• 846
buIldIng and development
Positive
Decreasing
Negative Neutral
Increasing
Little or no change
Trends

Int
rod
uc
tIo
n
6
report summary
employment and Wages*
Unemployment rate: 3.2%
• Total employment: 148,319*
• Total labor force: 153,160*
Total jobs: 177,010
• Total +1.6% • Private +1.9%
• Government: +0.3%
Average weekly wages: $1,060
• +2.7% increase
*Statistics are based on data for the period from December 2014 through December 2015.
Positive
Decreasing
Negative Neutral
Increasing
Little or no change
Trends

Int
rod
uc
tIo
n
7
report summary
Demographic changes 2005 to 2014 • Age groups with large population gains: 20-24 years and 60-64 years
• Age groups with large population losses: 80+ years
Race and Ethnicity • Proportion of Asian, Black/African American, Latino/Hispanic populations • Proportion of White population
Poverty Rate
• Population below 50% of poverty level: 9.6%
• Population below 100% of povery level: 22.9%
• Population below 150% of poverty level: 34.0%
Educational Attainment • College educated residents
• Residents with high school diploma or less
*Demographic estimates (unless otherwise noted) are based on two non-overlapping, American Community Survey 5-year Estimates: 2005-2009 and 2010-2014. This data is more accurate than 1-year estimates for examining demographic trends, and is the most current data available.
Please note that this differs from the 3-year estimates used in previous editions of Market Watch. Since the American Community Survey discontinued 3-year estimates after 2013, the 5-year estimates provide a more accurate basis for comparison and demographic trends.
demographIcs*
Positive
Decreasing
Negative Neutral
Increasing
Little or no change
Trends

Buil
din
g a
nd
de
ve
lopm
en
t
8
value of permIts over $50,000
Building permit value represents the cost of labor and materials for a construction project. Contractors must apply for permits before beginning construction, and typically before hiring construction workers. As a result, building permits are often an indicator of future trends in the rest of the economy. In 2015, new construction permits totaled $341.5 million, exceeding last year’s total by more than $80 million. This is also the first year since 2010 that the majority of permit value came from new construction projects.
Year 2008 2009 2010 2011 2012 2013 2014 2015
New $77.5 M $114.5 M $158.5 M $146.9 M $128.4 M $79.9 M $255.3 M $341.5 M
Addition $75.4 M $81.6 M $26.5 M $18.7 M $31.1 M $87.0 M $71.0 M $57.1 M
Remodel $83.4 M $100.2 M $129.3 M $232.7 M $195.1 M $175.0 M $214.3 M $167.0 M
Total Value $236.3 M $296.2 M $314.3 M $398.4 M $354.6 M $341.9 M $540.6 M $565.5 M
Table 1 - Combined total value of building permits in millons (2015 $)
Figure 1 - Combined total value of building permits in millons, by type of permit (2015 $)
$0
$100
$200
$300
$400
$500
$600
2008 2009 2010 2011 2012 2013 2014 2015
New Addition Remodel
Permit value is the total permit value for permits issued. Since some projects take multiple years to complete, some projects still under construction were excluded. Further, the individual permit value may be lower than the total project cost.
Source: Saint Paul Department of Safety and Inspections, data compiled by Saint Paul Planning and Economic Development.

Bu
ildin
g an
d de
ve
lopm
en
t
9
Figure 2 - Combined total value of select building permits, rolling annual average* (2015 $ in millions)
*The “rolling annual average” puts quarterly fluctuations in context with long term trends. Fluctuations are usually the result of temporarily elevated building activity, or because of large single-project permits within a particular quarter. Seasonality may also impact these figures.
Permit value is the total permit value for permits issued. Since some projects take multiple years to complete, some projects still under construction were excluded. Further, the individual permit value may be lower than the total project cost.
Source: Saint Paul Department of Safety and Inspections, data compiled by Saint Paul Planning and Economic Development
The figure below depicts the trends in the total value of permits issued each year. As of Q4 2015, the rolling annual averages show that an average of $141.9 million in permits was issued each quarter over the past 12 months. This year ended with a total value of new permits substantially greater than previous years, while addition and remodel permits have decreased slightly since 2014. The positive trend in new construction since 2014 can perhaps be attributed to an overall strengthening of the economy as well as the opening of the Green Line in June of that year. New construction along the line includes CHS field, varied affordable housing developments, and streetscape upgrades, among others.
$0
$20
$40
$60
$80
$100
$120
$140
New Addition Remodel Total Value
value of permIts over $50,000

Buil
din
g a
nd
de
ve
lopm
en
t
10
Year 2008 2009 2010 2011 2012 2013 2014 2015
New 288 297 380 451 448 489 499 496
Addition 259 310 300 324 337 296 286 244
Remodel 1,123 1,379 1,649 1,556 1,577 1,834 1,697 1,943
Repair 1,452 2,287 3,198 3,475 3,123 2,283 2,249 2,044
Total Number 3,122 4,273 5,527 5,806 5,485 4,902 4,731 4,727
Table 2 - Number of building permits in Saint Paul, annual totals
The total number of building permits issued each year in Saint Paul has remained close to 5,000 since 2009. The total number of permits issued for new construction in 2014 was the highest in the past seven years, and that total remained nearly as high in 2015. Although the total number of all types of permits is less than in recent years, the value of those permits has increased. Table 3 through Table 5, on the subsequent pages, break down these totals and highlight a few more interesting trends.
Note: Permit value and number totals for past years may vary between this and past reports. This is due to an additional effort to eliminate duplicate permits in the Spring 2014 report. There are certain instances in which a permit record for a building is reported twice due to the necessity of obtaining a building permit for various types of work: electrical, plumbing, etc. In addition, 44 permits associated with LRT facility development between 2010 and 2012 were eliminated from this analysis.
Source: Saint Paul Department of Safety and Inspections, data compiled by Saint Paul Planning and Economic Development.
value of permIts over $50,000

Bu
ildin
g an
d de
ve
lopm
en
t
11
Figure 3 - Number of select building permits, annual totals
0
1,000
2,000
3,000
4,000
5,000
6,000
7,000
2008 2009 2010 2011 2012 2013 2014 2015
New Addition Remodel Repair Total
Note: Permit value and number totals for past years may vary between this and past reports. This is due to an additional effort to eliminate duplicate permits in the Spring 2014 report. There are certain instances in which a permit record for a building shows up twice due to the necessity of obtaining a building permit for various types of work: electrical, plumbing, etc. In addition, 44 permits associated with LRT facility development between 2010 and 2012 were eliminated from this analysis.
Permit value is the total permit value for permits issued. Since some projects take multiple years to complete, some projects still under construction were excluded. Further, the individual permit value may be lower than the total project cost. Source: Saint Paul Department of Safety and Inspections, data compiled by Saint Paul Planning and Economic Development.
The figure below graphically depicts trends in the number of permits issued each year. The number of permits have declined since their peak in the first quarter of 2012, but have remained steady through 2014 and 2015.
value of permIts over $50,000

Buil
din
g a
nd
de
ve
lopm
en
t
12
major constructIon projects
Table 3 - New building permits exceeding $50,000 (2015 $)
*Dataset includes building permits for “New” buildings with the status of “Active/Issued,” “Inspected,” or “Finaled,” indicating active or completed construction activity. Some projects may have permits pulled in one year, with construction continuing into the next year. Particularly large and complex projects may have multiple permits pulled for one construction project. As a result, these tallies do not represent an exact count of unique buildings permitted in any given year.
“Accessory Structure” could include Antenna, Carport, Garage, Shed, Pool-In Ground, Pool-Above Ground, Tower, Tank, Gazebo, or Other Accessory Structure
Source: Saint Paul Department of Safety and Inspections, data compiled by Saint Paul Planning and Economic Development.
Year 2008 2009 2010 2011 2012 2013 2014 2015Residential 22 22 19 25 43 47 67 71
Single-Family Home 15 14 17 23 32 43 61 56
Duplex 2 0 2 1 0 0 3 1
Multi-Unit 7 8 0 1 11 4 3 14
Units 449 348 0 44 382 224 98 1,040
Mixed Comm/Res 0 0 2 2 3 2 2 3
Units 0 0 108 60 435 348 318 627
Accessory Structure 7 9 13 12 16 17 11 8
Non-Residential 28 14 25 26 23 17 30 22
Commercial 25 9 11 16 17 14 18 14
Institutional 3 5 14 10 6 3 12 8
Totals* 55 45 59 65 85 83 110 104
The City’s Department of Safety and Inspections (DSI) issued 104 permits for new buildings in the first half of 2015. Since some projects require multiple permits, this total does not necessarily mean that 104 individual buildings were permitted. 2015 was a record year for residential construction, with more new residential units permitted in 2015 than in the previous five years combined. Some of these new single-family homes were constructed through the Inspiring Communities program. The City’s Housing and Redevelopment Authority has worked to construct new homes through this program since 2010.

Bu
ildin
g an
d de
ve
lopm
en
t
13
major constructIon projects
Table 4 lists new construction projects with at least one permit with a value greater than or equal to $1 million. During 2015, 20 new projects were issued at least one permit worth $1 million or more. As the table shows, eight of these permits were for mixed-use commercial/residential and multifamily residential construction projects. The remaining are a mix of institutional, commercial, and single-family residential construction.
*These projects all had multiple permits worth at least $1,000,000.
Permit value is the total permit value for permits issued only in 2015. Since some projects take multiple years to complete, some projects still under construction were excluded. Further, the individual permit value above may be lower than the total project cost.
Source: Saint Paul Department of Safety and Inspections, data compiled by Saint Paul Planning and Economic Development.
Table 4 - New construction permits worth $1 million or more (2015 $)Address Project Name Building Type Permit value Units
1575 Selby Ave Whole Foods Commercial $4,695,633
1761 University Ave W Saint Paul YMCA Commercial $11,850,000
200 7th St W Hampden Hotel* Commercial $13,353,336
353 7th St W Regional Labor Headquarters Commercial $1,494,699
50 Chester St CHS, Inc. Warehouse Commercial $3,000,000
661 Lasalle St Office Building* Commercial $1,239,860
1533 Dayton Ave Primrose School Institutional $2,189,236
295 Phalen Blvd Health Partners Neuroscience Center* Institutional $51,589,761
690 Birmingham St Twin Cities Academy Institutional $11,897,521
95 University Ave W State Capitol Office Building* Institutional $23,952,614
202 7th St W West 7th Apartments* Mixed (Commercial/Residential) $25,409,885 190
2700 University Ave W City Limits Apartments Mixed (Commercial/Residential) $37,273,368 246
1125 Hamline Ave N Clubhouse and Apartments* Residential (Multi-Fam) $1,195,759 7
1305 Madison St Madison Street Studio Apartments Residential (Multi-Fam) $4,185,317 53
1949 University Ave W Prior Crossing Youth Housing Residential (Multi-Fam) $7,127,847 44
2140 Grand Ave West Grand Avenue Apartments Residential (Multi-Fam) $3,138,868 14
411 Main St Dorothy Day Center* Residential (Multi-Fam) $28,539,000 193
750 Otto Ave Victoria Park Apartments* Residential (Multi-Fam) $20,331,207 197
142 Mississippi River Blvd N New Home Single Family Dwelling $1,706,817 1
420 Mississippi River Blvd S New Home Single Family Dwelling $2,208,823 1

Buil
din
g a
nd
de
ve
lopm
en
t
14
major constructIon projects
Table 5 - Recent construction projects over $1 million (2015 $)
Source: Saint Paul Department of Safety and Inspections, data compiled by Saint Paul Planning and Economic Development.
Table 5 lists building pemits for other types of construction including additions, remodels, and repairs. This list demonstrates the variety of projects located throughout the city. In 2015, 30 projects in Saint Paul were issued million-dollar permits, doubling last year’s total of 15.
Address Description Building Type Activity Permit value10 7th St W Children’s Museum Commercial Addition $13,471,27110 River Park Plaza Comcast Building Commercial Remodel $2,530,1061065 Phalen Blvd Beacon Bluff Business Center Commercial Remodel $1,022,5421133 Rankin St Exterior Remodel Commercial Remodel $2,484,9251301 L'Orient St Metro Mechanical Contractors Commercial Remodel $4,042,428161 St Anthony Ave Sweetwater Grill & Bar & Banquet Commercial Remodel $3,413,63517 7th Place W Palace Theater Commercial Remodel $1,506,015180 Kellogg Blvd E US Post Office Commercial Remodel $16,332,6501800 Ames Ave Academia Cesar Chavez Institutional Addition $3,705,067200 University Ave E Gillette Children’s Hospital Institutional Remodel $1,292,161205 Wabasha St S HealthPartners St Paul Clinic Commercial Remodel $3,110,9862080 Ford Pkwy Target Commercial Remodel $1,414,850209 Page St W Baker Recreation Center Institutional Addition $1,676,056225 Smith Ave N John Nasseff Neuroscience Specialty Clinic Institutional Remodel $1,420,682235 Marshall Ave St Paul College Institutional Remodel $1,197,800261 Chester St FedEx Ship Center Commercial Remodel $1,543,40730 7th St E Wells Fargo Place Commercial Remodel $1,594,346305 St Peter St World Architects & Engineers Commercial Remodel $1,178,560333 Smith Ave N United Hospital Institutional Remodel $6,424,828345 Smith Ave N Children’s Hospital Institutional Remodel $1,553,240354 Wabasha St N American Burger Bar Commercial Remodel $1,160,000380 St Peter St Lawson Commons Commercial Remodel $1,693,992400 Western Ave N Sunlight Senior Living Commercial Addition $2,200,000543 James Ave Premier Storage LLC Commercial Remodel $2,510,02659 10th St W Saint Joseph’s Hospital Parking Ramp Institutional Repair $1,180,000640 Jackson St Regions Hospital Institutional Remodel $1,100,448700 Snelling Ave S Gloria Dei Lutheran Church Institutional Repair $1,359,180701 Barge Channel Rd Hawkins, Inc. Terminal 2 Commercial Addition $1,992,93275 Rev Dr Martin Luther King Jr Blvd State Capitol Building Institutional Remodel $2,989,398781 Palace Ave Palace Recreation Center Institutional Addition $2,820,593

Bu
ildin
g an
d de
ve
lopm
en
t
15
resIdentIal constructIon
The total value of single-family home permits demonstrates increased investment in building, improving, and renovating single-family homes in Saint Paul. While new permit values took a slight dip in the third quarter of 2015, this year’s total value of single family home permits ($48.8 mil) remains higher than any previous year since 2009.
Year 2009 2010 2011 2012 2013 2014 2015New $3.6 $4.2 $4.6 $6.0 $11.3 $15.3 $17.6
Addition $10.7 $10.5 $11.4 $12.4 $11.6 $15.4 $10.4
Remodel $12.8 $13.6 $14.8 $15.3 $19.3 $17.0 $20.8
Total Value $27.1 $28.3 $30.9 $33.7 $42.3 $47.7 $48.8
Figure 4 - Value of select single-family home permits, rolling annual average* (2015 $)
Table 6 - Total Annual Value of Select Permits for Single-Family Homes, in millions (2015 $)
$0 M
$2 M
$4 M
$6 M
$8 M
$10 M
$12 M
$14 M
New Addition Remodel Total Value
*The “rolling annual average” puts quarterly fluctuations in context with long term trends. Fluctuations are usually the result of temporarily elevated building activity, or because of large single-project permits within a particular quarter. Seasonality may also impact these figures.
Permit value is the total permit value for permits issued. Since some projects take multiple years to complete, some projects still under construction were excluded. Further, the individual permit value may be lower than the total project cost.
Source: Saint Paul Department of Safety and Inspections, data compiled by Saint Paul Planning and Economic Development.

Buil
din
g a
nd
de
ve
lopm
en
t
16
resIdentIal constructIon
Figure 5 - Total number of single-family home permits, 2009 - 2015
Table 7 - Total number of Select Permits for Single Family Homes
Source: Saint Paul Department of Safety and Inspections, data compiled by Saint Paul Planning and Economic Development.
Year 2009 2010 2011 2012 2013 2014 2015
Addition 14 18 29 33 45 64 187
New 266 260 275 280 237 232 56
Remodel 783 926 890 933 1,043 1,038 1,117
Total 1,063 1,204 1,194 1,246 1,325 1,334 1,360
The total number of addition, remodel, and new building permits issued for single-family homes has been increasing since 2009. The large increase in total permits issued is primarily due to an increase in the number of permits issued for remodel projects; remodeling permits continue to dominate the total number of single-family home construction permits.
0
50
100
150
200
250
300
350
400
Addition New Remodel Total

Bu
ildin
g an
d de
ve
lopm
en
t
17
resIdentIal constructIon
Thirteen major multi-family residential construction projects were issued permits worth more than $1 million in 2015. The projects with the highest issued permit values include the new City Limits Apartments on University Ave., and the new Waters of Highland Park assisted living building on Snelling Ave. Several other substantial remodel and repair projects are occuring throughout the city.
Table 8 - Current active or completed residential construction projects over $1 million (2015 $)
Address Project Name Building Type Activity Permit value # of Units
1925 Norfolk Ave Saint Mary’s Home Multi-Family Addition $8,171,022 129
2700 University Ave W 2700 University Commercial/Residential New $37,273,368 248
202 7th St W Oxbō Commercial/Residential New $25,409,885 190
411 Main St Dorothy Day Multi-Family New $28,539,000 193
750 Otto Ave Victoria Park Apartments Multi-Family New $20,331,207 197
1949 University Ave W Prior Crossing Multi-Family New $7,127,847 44
1305 Madison St Madison Street Studio Apts Multi-Family New $4,185,317 53
2140 W Grand Ave West Grand Ave Apartments Multi-Family New $3,138,868 14
1125 Hamline Ave N Park Pointe Multi-Family New $1,195,759 7
420 Mississippi River Blvd S New Home Single Family
Dwelling New $2,208,823 1
142 Mississippi River Blvd N New Home Single Family
Dwelling New $1,706,817 1
1247 St Anthony Ave Skyline Towers Multi-Family Repair $7,065,014 505
250 6th St E Cosmopolitan on Mears Park Multi-Family Repair $2,077,808 255
Since some projects take multiple years to complete, some projects still under construction were excluded. Further, the individual permit value may be lower than the total project cost. Some projects under construction in 2015 were issued permits in previous years, at an earlier stage in the development process. Permit value stated in the table represents the total value of individual permits issued in 2015 with individual value over $1 million. For example, if a project has one permit for $8 million and one permit for $1 million, the total permit value would be $9 million. Smaller permits for these projects are not included in the totals.
Source: Saint Paul Department of Safety and Inspections, data compiled by Saint Paul Planning and Economic Development.

Buil
din
g a
nd
de
ve
lopm
en
t
18
!(!(
!(!(_̂!(
_̂
!(
!(
_̂_̂
!(!(
!(
!(
!(!(
!(
!(!(
FG
_̂
!(
!(
_̂
!(
_̂
!(
!(
!(
!(!(
_̂
!(!(!(!(!(
!(
!(
!(
!(
_̂!(!(
!(
_̂
!(!(
!(
_̂
_̂
_̂
_̂
_̂
_̂_̂
_̂_̂ _̂_̂
_̂
_̂
_̂_̂
_̂
_̂
_̂
_̂
_̂
_̂
_̂
_̂
_̂
_̂
_̂
_̂
_̂
_̂
_̂
_̂_̂
_̂
_̂
_̂
_̂
_̂
_̂
_̂
_̂
_̂
_̂
_̂
_̂_̂
_̂_̂
_̂
_̂
_̂
_̂
_̂
_̂
_̂_̂
_̂
§̈¦94
§̈¦35E
£¤52
£¤61
"ï280
§̈¦94
§̈¦35E
LakeComo
LakePhalen
EagleLake
CrosbyLake
Mississippi River
Pig'sEye Lake
4/29/2016
Building type, Permit type
_̂ Multi-Family Residential, New (8)
FG Multi-Family, Addition (1)!( Multi-Family Residential, Remodel (29)
_̂ Mixed Commercial/Residential, New (2)
!( Mixed Commercial/Residential, Remodel (10)
_̂ Single-Family Home, New (56)
resIdentIal constructIon
Figure 6 - Location of selected new, addition, and remodel permits worth at least $50,000 (2015 $)
This map shows the location of permits worth at least $50,000 for new construction, additions, and remodeling of multi-family and mixed-use residential buildings, as well as permits for new single-family homes. Of these permits 12 are worth more than $1 million in value.
Source: Saint Paul Department of Safety and Inspections, mapped by Saint Paul Planning and Economic Development.

Bu
ildin
g an
d de
ve
lopm
en
t
19
buIldIng demolItIons
Year 2009 2010 2011 2012 2013 2014 2015
Commercial 36 37 51 36 32 30 29
Residential 176 151 262 199 151 143 162
Total Demolitions 212 188 313 235 183 173 191
Source: Saint Paul Department of Safety and Inspections, compiled by Saint Paul Planning and Economic Development.
Table 9 - Number of demolitions per year 2009 - 2015
A total of 191 demolition permits were issued in 2015. More than 80% of permits were issued to demolish residential buildings or residential accessory structures. The split between the two was about even with 44% of permits for demolishing residential accessory structures and 41% going to demolish residential buildings. Table 9 lists the number of demolitions across the city dating back to 2009. Figure 7 on the following page shows the locations of residential and commercial demolitions across the city.
The data in Table 9 includes all four types of demolitions reported by the Department of Safety and Inspections: (1) Residential, (2) Residential Accessory Structures, (3) Commercial, and (4) Commercial Accessory Structures. Figure 7 shows only the 104 demolition permits for Residential and Commercial properties, and excludes all demolition permits for accessory structures.

Buil
din
g a
nd
de
ve
lopm
en
t
20
buIldIng demolItIons
!(
!(
!(
!(
!(
!(
!(
!(
!(!(
!(
!(
!(!(
!(!(
!(
!(
!(
!(
!(!(
!(
!(
!(
!(!(
!(!(!(
!(
!(
!(!(!(!(
!(
!(
!(
!(
!(
!(
!(
!(
!( !(!(
!(
!(
!(
!(
!(
!(
!(!(!(!(
!(
!(
!(
!(
!(
!(
!(
!(
!(!(
!(
!(
!(!(
!(
!(
!(
!(
!(
!(
!(
!(
!(
!(
!(
!(
!(
!( !(
!(
!(
!(
!(
!(
!(
!(
!(
!(
!(
!(
!(
!(
!(
!(!(
!(
!(
§̈¦94
§̈¦35E
£¤52
£¤61
"ï280
§̈¦94
§̈¦35E
LakeComo
LakePhalen
EagleLake
CrosbyLake
Mississippi River
Pig'sEye Lake
4/15/2016
!( Commercial Demolition (26)
!( Residential Demolition (78)
Figure 7 - Locations of building demolitions, 2015
Source: Saint Paul Department of Safety and Inspections, mapped by Saint Paul Planning and Economic Development.

Bu
ildin
g an
d de
ve
lopm
en
t
21
foreclosures
Figure 8 - Foreclosure tally, rolling annual average, 2008-2015
Year 2008 2009 2010 2011 2012 2013 2014 2015
Foreclosures 2,224 1,824 1,790 1,372 1,064 733 521 465
Table 10 - Total number of foreclosures - 2008-2015
Sources: Ramsey County Sheriff’s Office, data compiled by Saint Paul Planning and Economic Development.
Foreclosure rates continued to fall in 2015 following significant decreases since the peak in 2008. 2015 was the first year since the recession with fewer than 500 foreclosures in the city. Figure 8 illustrates the past and current trends of foreclosures in Saint Paul: the foreclosure rate has decreased since mid-2010. Figure 9 on the next page illustrates the locations of foreclosures in 2015. These foreclosed properties are spread throughout the city, but are more densely concentrated in northeastern parts of the city, in the West Side neighborhood (south of the Mississippi River), north of University Avenue, and the West Seventh neighborhood. Highland Park and Macalester-Grovelend in southwestern Saint Paul continue to experience relatively few foreclosures.
0
200
400
600
800
1,000
1,200
1,400
1,600
1,800
2,000
2,200
2,400
Foreclosures, rolling annual average

Buil
din
g a
nd
de
ve
lopm
en
t
22
!!
!
!
!
!
!
! !
!!
!
!
!
!
!
!
!
!
!
!
!
!
!
!
!!
!
!
!
!
!
!
!
!
!
!
!
!
!
!
!
! !
!
!
!
!
!
!
!
!
!
!
!
!
!
!
!
!
!
!
!
!
!
!
!
!
!
!
!
!
!
!
!
!
!
!
!
!
!!
!
!
!
!
!
!
!
!
!
!
!
!
!
!
!
!
! !!
!
!
!
!
!!
!
!
!
!
!
!
!
!
!
!
!
!
!
!
!
!
!
!
!
!
!!
!
!
!
!
!
! !
!
!
!
!
!
!
!
!
!
!
!
!
!
!
!
!
!
!
!
!
!
!
!!
!
!
!
!
!
!
!
!
!
!
!
!
!
!
!
!
! !
!
!
!
!
!
!
!
!
!
!
!!
!
!
!
!
!
!
!
!
!
!
!
!!
!
!
!!
!
!
!
!!
!
!
!
!
!
!
!
!
!
!
!
!
!
!
!
!
!
!!
!
!
!
!
! !
!
!
!
!
!
!
!
!
!
!
!
!
!
!
!
!!
!
!
!
!
!
!
!
!
!
!
!
!
!
!
!
!
!
!
!
!
!
!
!
!
!
!
!
!
!
!
!
!
!
!
!
!
!
!
!
!
!
!
!
!
!
!
!
!
!
!
!!
!
!
!
!
!
!
!
!!
! !
!
!
!
!
!
!
!
!
!
!
!
!
!
!
!
!!
!
!
!
!
!
!
!
!
!
!
!
!
!
!
!
!
!
!!
!
!
!
!
!
!
!
!
!
!
!
!
!
!!
!
!
!
!
!
!
!
!
!
!
!
!
!
!
!!
!
!
!
!
!
!
!
!
!
!
!
!
!!
!
! !
!
!
!
!
!
!!
!
!
!
!
!
!
!
!
!
!
!
!
!
!
!
!
!
!
!
!
!
!
!
!
!
!
!
!
!
!
!
!
!
!
!
!
!
!
!
!!
!
!
!
!!
!
!
!
!
!
!
!
§̈¦94
§̈¦35E
£¤52
£¤61
"ï280
§̈¦94
§̈¦35E
LakeComo
LakePhalen
EagleLake
CrosbyLake
Mississippi River
Pig'sEye Lake
4/29/2016
foreclosures
Figure 9 - Locations of foreclosed properties, 2015
Source: Ramsey County Sheriff’s Office, mapped by Saint Paul Planning and Economic Development.

Bu
ildin
g an
d de
ve
lopm
en
t
23
vacant buIldIngs
Note: The City of Saint Paul has ordinances regulating vacant and unoccupied structures, and requires property owners to register these buildings with the Department of Safety and Inspections. A Registered Vacant Building is defined as an unoccupied building that meets one or more of the following criteria: unsecured; secured by other than normal means; a dangerous structure; condemned; has multiple housing or building code violations; condemned and illegally occupied; or has been unoccupied for a period of time longer than one year, during which time an enforcement officer has issued an order to correct nuisance conditions.
Source: Saint Paul Department of Safety and Inspections, data compiled by Saint Paul Planning and Economic Development.
Figure 10 - Number of Registered Vacant Buildings
Year 2009 2010 2011 2012 2013 2014 2015 Change 2009-2015
Number of Vacant Buildings 1,719 1,563 1,422 1,278 1,273 973 845 -873 (-51%)
Table 11 - Total number of Vacant Buildings - 2009-2015
600
800
1,000
1,200
1,400
1,600
1,800
2009 2010 2011 2012 2013 2014 2015
Vacant buildings
The number of registered vacant buildings in Saint Paul fell by 51% between 2009 and 2015. Because data limitations prevent City staff from collecting highly accurate point-in-time tallies for vacant buildings, the data presented below may not be completely precise. Figure 11 on the next page shows the location of vacant buildings in Saint Paul as of December 31, 2015. The map indicates some concentrations of vacant buildings north of Interstate 94, mostly clustered on either side of Interstate 35E. Smaller concentrations of vacant buildings are shown in the West Seventh and West Side neighborhoods. The Inspiring Communities program is one effort by the Saint Paul Housing and Redevelopment Authority designed to reduce the number of vacant and underutilized buildings, and spur additional investment in these neighborhoods.

Buil
din
g a
nd
de
ve
lopm
en
t
24
!!
! ! !!!
!!!!!! !! ! ! ! !
! ! ! !!! !
!
!
!
! ! !
!!!
!
!
!
!
!
!
!
! !
! !!
!
!
! !
!
! ! ! !!
!!
!
!
!
!
!!!!!!!!!
!
!
!
!
!!
!!!
!!!
! ! ! ! ! ! ! !
!
!
!
!
!!!!!!!
!!!
!
!
!
!
!!
!
!! !! ! ! !
!
!!
! ! ! !!! ! !!
!
!
!!!!
!!!!!!!!!!!!
!
!
!
!
!!
!
!
!
! !!!
!
!
!
!!
!!!
!!!!
!!!
! ! ! !!! ! !
! !! ! ! !!
!
! !!!
!
!
!!
!
!
!
!!!!!!
!
!
!!
!!!!
!!
!
!
!
!!
!
!
!
!
!!
!
!!!!!!!!!!!!!!
!!!
!!
!
!!!!
!
!
! !
!
!
!
!
!
!
!!!
!
!
!
!
!! !
!!!!!!
!
!!!!
!!!!!!!!
!
!!
!
!
!
!
!
!
!!!
! ! ! ! !
!
!!!!!
!
!!!!
!!
!
!
!
!
!
!!
!
!
!!!!!
! ! !
!
!
!
!
!
!
!!
!
!
!!
! !! !!
!
! ! !
! !
!!!
! !!!
!
!
! !!!
!
!!!!
!!
!!
!! ! !
! ! !!!!! !! !! !!!!
!
!!
!!
!!!!!
!
!
!
!!
!
!
!!!
!
!
!!!!!!
!!
!
! ! !!!
!
!
!
!
!!
!
!
!! ! ! !! ! ! !
!!! !
!
!!
!
! ! ! ! ! ! ! ! ! !
!!
!
!!
!!!!
! ! !!! ! ! !! ! !!!!
!
!!
!
! !
!!
!
!!!!!
!
!
!! !! !!! !! !!!!!!!!!!
!
!
!!
! ! ! !! !!
!!!
!!
! !
!
!
! ! !! !
!!!
!
!!!
!
!
!
!
!
!
!!!
!
!
!
!
! ! ! !
!
!!
!
!
!
!
!
!
!
!!!
!
!!
!
!
!
!
!
!
!!!
!! ! !! ! !!!! ! ! ! !
!
!
!
!
!!
!
!
!
!
!
!!!
!!!
!
! ! ! !
!! ! !!!
!
!
!
!
!
!!!!!!!
!
!
!!!!!!!!!!!!!!!
!
!
!
!
!
! ! ! !
!
!!
!
!
!
!!
!
!!!
!
!
! !!!!!!
!
!!
!!!
!!
!
! !
!
!
!
!!!!!!!!!!!
!
!
!
!!
!!!!!!!!!!!!!!!!!!!!!
!!
!!!!!!!!!!!!
!!
!
!
!!
!
!
!
!
!
!
!
!!!!!
!
!!
!
!
!
!! !
!
!!
!
!
!!!!!!! ! !
!
!
!
!
! ! ! !
!
!!!
!
!
!!
!
!
!
!!!! !! ! !
!
§̈¦94
§̈¦35E
£¤52
£¤61
"ï280
§̈¦94
§̈¦35E
LakeComo
LakePhalen
EagleLake
CrosbyLake
Mississippi River
Pig'sEye Lake
4/29/2016
vacant buIldIngs
Figure 11 - Locations of vacant buildings, 2015
Source: Saint Paul Department of Safety and Inspections, mapped by Saint Paul Planning and Economic Development.

Em
ploy
mE
nt a
nd W
ag
Es
25
employment of saInt paul resIdents
Employment is measured as the number of Saint Paul residents who are currently employed , regardless of whether those residents work in Saint Paul or in another city. This is different from the analysis of jobs on the following pages, which measures the number of people who work in the city, regardless of where they live. In the past year, employment in Saint Paul has continued to grow. In the fourth quarter of 2015, nearly 3,000 more residents were employed than at the same time last year.
14-Q4 15-Q1 15-Q2 15-Q3 15-Q4Saint Paul - Not seasonally adjusted
Labor Force 150,532 152,317 154,891 154,738 153,160
Employment 145,471 146,053 148,810 148,739 148,319
Unemployment Rate 3.4% 4.1% 3.9% 3.9% 3.2%
Metro - Not seasonally adjusted
Labor Force 1,716,443 1,639,637 1,664,591 1,661,645 1,647,940
Employment 1,663,861 1,576,660 1,606,398 1,605,620 1,601,282
Unemployment Rate 3.1% 3.8% 3.5% 3.4% 2.8%
Saint Paul - Rolling Annual Average*
Labor Force 148,798 150,130 151,753 153,120 153,777
Employment 142,223 143,905 145,718 147,268 147,980
Unemployment Rate 4.4% 4.1% 4.0% 3.8% 3.8%
Metro - Rolling Annual Average
Labor Force 1,699,727 1,702,734 1,707,856 1,670,579 1,653,453
Employment 1,634,519 1,640,690 1,646,838 1,613,135 1,597,490
Unemployment Rate 3.8% 3.6% 3.6% 3.4% 3.4%
Table 12 - Labor force, employment, and unemployment
*Although seasonally adjusted data is not available for Saint Paul, the rolling average of the past 12 months of employment data helps to account for seasonal fluctuation in employment. For example, the rolling average unemployment rate for Saint Paul in 15-Q2 is 4.0%, which means that the average unemployment rate for the period of 14-Q3 to 15-Q2 is 4.0%.
Source: Minnesota Department of Employment and Economic Development, compiled by Saint Paul Planning and Economic Development.

Em
plo
ym
En
t a
nd
Wa
gE
s
26
employment forecasts
The number of employed residents in Saint Paul is the total number of city residents who are employed regardless of the location of their job. The current total number of employed residents in Saint Paul is estimated to be 176,333—slightly fewer than last year. While employment has remained steady after dropping from the city’s peak in 2000, the Metropolitan Council estimates that Saint Paul will surpass that peak number by 2020. The Metropolitan Council’s forecasts predict that Saint Paul will add more than 27,000 jobs by 2030 (16% growth).
Source: Historic data for 1970 through 2010 from the Metropolitan Council; 2014 and 2015 data based on 2nd quarter DEED QCEW estimates; forecasted population data for 2020 through 2040 from the Metropolitan Council’s 2040 adopted forecasts.
Figure 12 - Employed residents in Saint Paul and forecasted changes
213,500
204,100
194,700
176,333
177,279
175,614
175,933
188,124
172,578
176,900
170,490
150,000 175,000 200,000 225,000
2040
2030
2020
2015
2014
2013
2010
2000
1990
1980
1970

Em
ploy
mE
nt a
nd W
ag
Es
27
employment of saInt paul resIdents
The labor force is the total number of residents in Saint Paul who are either employed, or unemployed and actively seeking employment. Figure 13 shows steady employment growth since 2010, making up for large losses experienced during the height of the recession in 2008. The graph also shows that employment rose rapidly and then fell over the course of 2015. However, current employment is still higher than at any time since 2008.
Figure 13 - Changes in Saint Paul employment, unemployment, and labor force trend line*
*Changes in the labor force are based on a rolling annual average. Source: Minnesota Department of Employment and Economic Development, compiled by Saint Paul Planning and Economic Development.
-2,000
-1,500
-1,000
-500
0
500
1,000
1,500
2,000
Change in Employment
Change inUnemployment

Em
plo
ym
En
t a
nd
Wa
gE
s
28
employment of saInt paul resIdents
Saint Paul’s unemployment rate continues to improve steadily. Figure 14 shows an unemployment rate of 3.2% for the fourth quarter of 2015, compared with 3.4% one year prior. Metro area unemployment showed a similar trend to Saint Paul, dropping from 3.1% for 14-Q4 to 2.8% in 15-Q4.
Source: Minnesota Department of Employment and Economic Development, compiled by Saint Paul Planning and Economic Development.
Figure 14 - Unemployment rate, not seasonally adjusted
3.2%
2.8%
0%
2%
4%
6%
8%
10%
12%
Saint Paul
Metro
National
5.0%

Em
ploy
mE
nt a
nd W
ag
Es
29
annual job trends
Table 13 shows the total number of jobs located within the city of Saint Paul. The table also details job trends for private and government sector jobs. Small seasonal fluctuations are evident in the data presented below. These figures do not necessarily reflect long-term changes in the city’s economy, but instead show how local job availability changes from season to season.
*Local Government includes city, county, and school district employees. There is a yearly pattern of decreases in employment numbers between quarters 2 and 3 due to the transition out of temporary summer employees.
Source: Minnesota Department of Employment and Economic Development, compiled by Saint Paul Planning and Economic Development.
'14-Q3 '14-Q4 '15-Q1 '15-Q2 ‘15-Q3
Total Jobs in Saint Paul 177,140 179,754 176,272 180,042 179,897
Private Jobs 142,233 142,992 139,525 142,948 144,419
Change from Prev Qtr 2,221 759 -3,467 3,423 1,471
Total Government Jobs 34,906 36,762 36,747 37,093 35,478
Change from Prev Qtr -2,092 1,856 -15 346 -1,615
Local Government Jobs* 14,519 16,194 16,162 16,566 14,919
Change from Prev Qtr -3,223 1,675 -32 404 -1,647
State Government Jobs 17,698 17,843 17,863 17,786 17,802
Change from Prev Qtr 1,169 145 20 -77 16
Federal Government Jobs 2,688 2,724 2,721 2,741 2,756
Change from Prev Qtr -38 36 -3 20 15
Table 13 - All jobs in Saint Paul, 2014-2015

Em
plo
ym
En
t a
nd
Wa
gE
s
30
annual job trends
Figure 15 - All jobs in Saint Paul, 2007-2015
Figure 15 shows the total number of jobs located in Saint Paul for the years 2007-2015. The graph shows a large drop in job totals between 2008 and 2009, reflecting the worst downward trend of the recession. Since then, job totals have stabilized and have rebounded significantly through 2015.
Jobs indicates the number of positions within the city of St. Paul, regardless of which city the employee lives in. Total jobs statistics are based on second quarter estimates, which tend to be relatively predictive of the annual average.
Source: Minnesota Department of Employment and Economic Development, compiled by Saint Paul Planning and Economic Development.
181,431
183,459
176,976
176,126 176,002
174,799
175,276
177,279
180,042
170,000
172,000
174,000
176,000
178,000
180,000
182,000
184,000
2007 2008 2009 2010 2011 2012 2013 2014 2015

Em
ploy
mE
nt a
nd W
ag
Es
31
changes In jobs by sector2014-2015
The tables below compare the number of jobs in the city, broken down by public and private sector. The most recent data show modest increases in private jobs and a very small increase in government sector jobs. The private sector gained more than 2,000 jobs from 2014 to 2015, while the government sector remained steady and gained 95 jobs.
*Local Government includes city, county, and school district employees.
Sector employment statistics are based on second quarter estimates, which tend to be relatively predictive of the annual average.
Source: Minnesota Department of Employment and Economic Development, compiled by Saint Paul Planning and Economic Development.
Table 14 - Changes in private and government sector jobs, 14-Q2 to 15-Q2
Numerical Change Percent Change
Total, All Sectors 2,763 1.56%
Private Sector 2,667 1.90%
Government Sector 95 0.26%
Numerical Change Percent Change
Federal Government 15 0.55%
State Government 44 0.25%
Local Government* 37 0.22%
Table 15 - Change in jobs by type of government, 14-Q2 to 15-Q2
Em
plo
ym
En
t a
nd
Wa
gE
s
32
changes In jobs by sector2014-2015
Sectors that gained the most jobsOver the five year period from 2011 to 2015, nine industry sectors experienced growth. Growth rates larger than 6% can be categorized as steady to significant while growth rates below 6% can be categorized as modest. The Construction and Professional, Scientific, and Technical Services sectors grew significantly over the five years, suggesting a continued rebound from the recession in those industries. The growth in construction jobs also matches the continued increases in building permits. Growth in the Health Care and Social Assistance sector continues the trend of strong growth reported in previous issues of Market Watch.
Industry Sector 2011 2012 2013 2014 2015 % Change '11-'15
Construction 4,324 4,025 4,656 5,268 5,586 29.2%
Professional, Scientific, and Technical Services 6,832 7,100 7,039 7,876 7,788 14.0%
Health Care and Social Assistance 38,822 38,944 40,569 41,328 42,887 10.5%
Wholesale Trade 4,873 4,831 4,883 5,144 5,341 9.6%
Public Administration 21,875 21,802 22,157 22,888 23,111 5.7%
Retail Trade 9,216 9,303 9,600 9,642 9,732 5.6%
Accommodation and Food Services 11,291 10,230 10,781 11,287 11,823 4.7%
Educational Services 17,463 17,717 18,394 18,022 18,075 3.5%
Utilities 906 878 955 944 923 1.9%
Table 16 - Employment totals by industry sector, and changes 2011-2015
Employment statistics for the Construction sector are based on second quarter estimates of a summation of total employment within the Construction-related subsectors reported (Construction of Buildings, Specialty Trade Contractors, and Heavy and Civil Engineering Construction) as sector totals are not available for every year detailed in Table 16. All other estimates are based on second quarter estimates for the sector listed. Second quarter estimates tend to be relatively predictive of the annual average.
See Appendix 1 for Industry Sector definitions.
Source: Minnesota Department of Employment and Economic Development, compiled by Saint Paul Planning and Economic Development

Em
ploy
mE
nt a
nd W
ag
Es
33
changes In jobs by sector2014-2015
Sectors that lost the most jobsThe sectors in the following table are those that showed the greatest reduction in jobs over the past five years. Table 17 reveals that employment numbers in some sectors, including arts, entertainment, finance, and insurance, appear to fluctuate frequently during the five year period. This suggests that recent losses may not necessarily reflect long-term trends.
Industry Sector 2011 2012 2013 2014 2015 % Change '11-'15
Administrative and Support and Waste Management and Remediation Services 11,341 11,424 9,300 8,828 8,761 -22.9%
Transportation and Warehousing 3,656 3,859 3,347 3,300 3,277 -10.4%
Real Estate and Rental and Leasing 2,669 2,505 2,430 2,393 2,407 -9.8%
Manufacturing 8,412 7,869 7,626 7,837 7,923 -5.8%
Management of Companies and Enterprises 4,361 4,665 4,156 4,091 4,161 -4.6%
Arts, Entertainment, and Recreation 4,285 4,192 3,893 4,069 4,153 -3.1%
Other Services (except Public Administration) 6,584 6,676 6,595 6,726 6,445 -1.4%
Finance and Insurance 12,343 12,142 12,355 12,344 12,239 -0.8%
Table 17 - Employment totals by industry sector, and changes 2011-2015
Employment estimates are based on second quarter estimates for the sector listed. Second quarter estimates tend to be relatively predictive of the annual average.
See Appendix 1 for Industry Sector definitions.
Source: Minnesota Department of Employment and Economic Development, compiled by Saint Paul Planning and Economic Development.

Em
plo
ym
En
t a
nd
Wa
gE
s
34
average Weekly Wages
The average weekly wage in Saint Paul during the second quarter of 2015 was $1,060, an increase of $28 since 2014. This indicates that wages in the city are relatively stable. Figure 16 shows that this trend is fairly consistent with state and metro-level changes over the past year. The graph also shows a general trend of wage increases since early 2012.
Weekly wages are based on the second quarter averages for each year, which tend to be representarive of trends. Inflation is calculated according to 2nd-half 2015 CPI-U, U.S. Bureau of Labor Statistics.
Source: Minnesota Department of Employment and Economic Development, compiled by Saint Paul Planning and Economic Development.
Table 18 - Average weekly wages, 2009-2015 (2015 $)
Average Weekly Wages Change in Wages
Year 2009 2010 2011 2012 2013 2014 2015 2009-2015 2014-2015
Saint Paul $992 $993 $979 $1,015 $1,017 $1,032 $1,060 +$68 +$28
Metro $1,042 $1,059 $1,063 $1,046 $1,052 $1,056 $1,098 +$56 +$42
Minnesota $923 $934 $937 $928 $937 $943 $977 +$54 +$34
Figure 16 - Average weekly wages, 2009-2015 (2015 $)
$900
$1,000
$1,100
2009 2010 2011 2012 2013 2014 2015
Saint Paul
Metro
Minnesota

Em
ploy
mE
nt a
nd W
ag
Es
35
average Weekly Wages
Saint Paul employees saw mixed changes in wages in the sectors that reported wage data for 2014 and 2015. Overall, weekly wages increased by an average of $28. Major changes according to industry sector are summarized below. Wages in Saint Paul declined in four sectors: Construction; Management of Companies and Enterprises; Manufacturing; and Other Services (except Public Administration). Wage decreases may be correlated with increases in hiring*. Weekly wage data for some industry sectors were suppressed, and thus are not included in the table below.
*When new employees are hired for entry-level positions and replace higher-wage retirees, the average wage for that sector may go down.
Source: Minnesota Department of Employment and Economic Development, compiled by Saint Paul Planning and Economic Development.
Industry Group 2014 2015 Change 14-Q2 to15-Q2
% Change 14-Q2 to 15-Q2
Accommodation and Food Services $347 $371 $24 6.8%
Admin Support, Waste Mgmt, Remediation $515 $526 $11 2.2%
Arts, Entertainment, and Recreation $704 $793 $89 12.7%
Construction $1,425 $1,366 -$59 -4.2%
Educational Services $1,073 $1,089 $16 1.5%
Finance and Insurance $1,565 $1,620 $55 3.5%
Health Care and Social Assistance $921 $940 $19 2.1%
Information $1,255 $1,310 $55 4.4%
Management of Companies and Enterprises $1,907 $1,894 -$13 -0.7%
Manufacturing $1,301 $1,285 -$16 -1.2%
Other Services (except Public Administration) $749 $746 -$3 -0.5%
Professional, Scientific, and Technical Services $1,446 $1,591 $145 10.0%
Public Administration $1,248 $1,297 $49 3.9%
Real Estate and Rental and Leasing $802 $842 $40 5.0%
Retail Trade $520 $543 $23 4.5%
Transportation and Warehousing $929 $951 $22 2.4%
Utilities $1,915 $1,969 $54 2.8%
Wholesale Trade $1,159 $1,205 $46 4.0%
Total, All Industries $1,032 $1,060 $28 2.7%
Table 19 - Average weekly wages by industry sector, 2014-2015 (2015 $)

Em
plo
ym
En
t a
nd
Wa
gE
s
36
average Weekly Wages
Figure 17 - Percent change in wages by industry, 14-Q2 TO 15-Q2 (2015 $)
The figure below graphically compares changes in wages by industry sector in Saint Paul, the Twin Cities Metropolitan Area, and Minnesota as a whole. Actual wages are reported in Table 19 on the previous page.
While wages in construction declined in St. Paul between 2014 and 2015, workers in the city were still making more than their metro area and statewide counterparts. Even after the deline in 2015, construction workers in St. Paul made $1,366 per week on average compared to $1,223 and $1,107 per week for workers in the metro area and larger state, respectively.
Source: Minnesota Department of Employment and Economic Development - Quarterly Census of Employment and Wages.
-5.0% 0.0% 5.0% 10.0% 15.0%
Accommodation and Food Services
Admin, Support, Waste Mgmt Remediation Services
Agriculture, Forestry, Fishing and Hunting
Arts, Entertainment, and Recreation
Construction
Educational Services
Finance and Insurance
Health Care and Social Assistance
Information
Management of Companies and Enterprises
Manufacturing
Mining
Other Services (except Public Administration)
Professional, Scientific, and Technical Services
Public Administration
Real Estate and Rental and Leasing
Retail Trade
Transportation and Warehousing
Utilities
Wholesale Trade
Total, All Industries
Saint Paul
Metro
Minnesota

De
mo
gr
aph
ics
37
populatIon forecasts
Figure 18 - Saint Paul population and forecasted changes
The Metropolitan Council’s forecasts indicate that Saint Paul will gain approximately 50,000 residents (18% increase) by 2040.The most recent available estimate of the city’s population is 300,353, representing an estimated increase of more than 15,000 residents since 2010. Continued population growth is consistent with this recent trend and future growth is expected to surpass the city’s historical population peak of 313,000 residents in 1960.
Source: Historic population counts from U.S. Census Bureau Decennial Census; 2015 population from U.S. Census Bureau, Population Estimates Program; Forecasted population data from the Metropolitan Council’s 2040 adopted forecasts.
344,100
329,200
315,000
300,851
285,068
286,840
272,235
270,230
309,866
313,411
200,000 250,000 300,000 350,000 400,000
2040
2030
2020
2015
2010
2000
1990
1980
1970
1960
De
mo
gr
aph
ics
38
populatIon by age
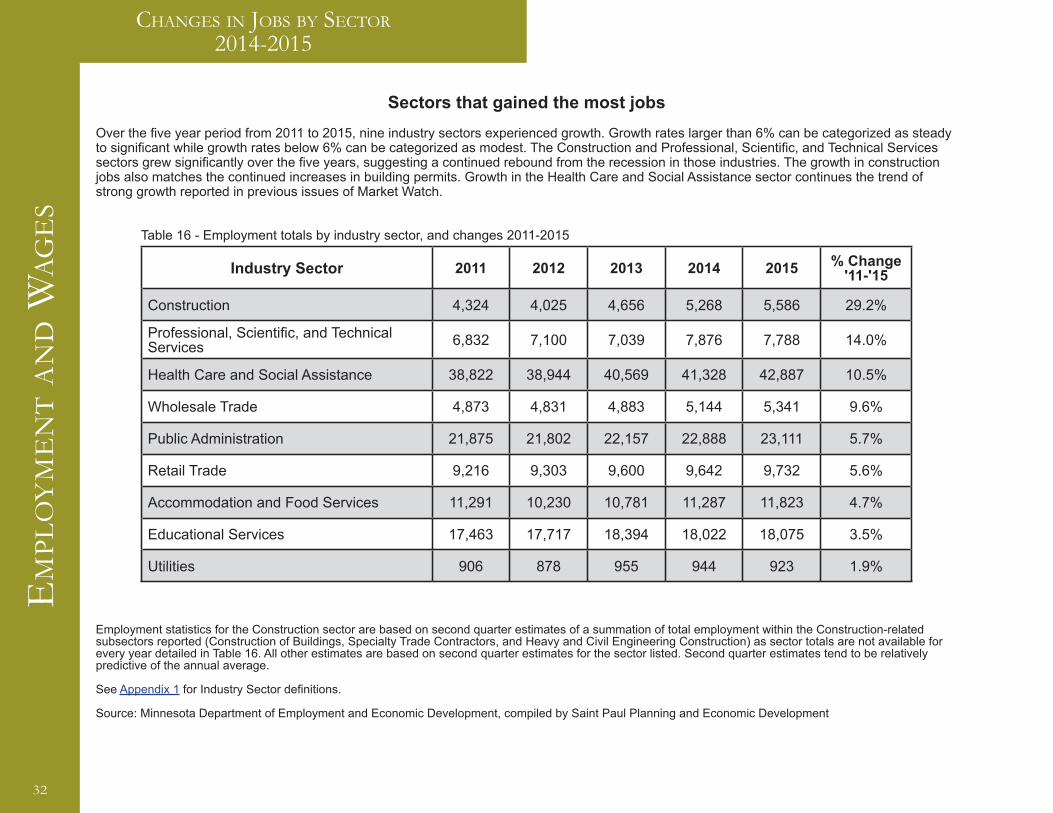
Table 20 - Population by age, Saint Paul, 2005-2009 and 2010-2014
Source: U.S. Census Bureau, 2005-2009 and 2010-2014 American Community Survey 5-Year Estimates. The American Community Survey is a random sample survey of residents used to produce estimates on a more frequent basis than the Decennial Census.
Age Group '05-'09 '10-'14 % Change‘05-'09 to ‘10-'14
Under 5 years 22,543 22,392 -0.67%5 to 9 years 17,941 20,429 +13.87%10 to 14 years 18,085 19,375 +7.13%15 to 19 years 20,966 21,867 +4.30%20 to 24 years 10,935 11,527 +5.41%25 to 29 years 27,381 27,245 -0.50%30 to 34 years 20,463 23,635 +15.50%35 to 39 years 19,158 18,499 -3.44%40 to 44 years 18,051 17,392 -3.65%45 to 49 years 19,413 16,933 -12.77%50 to 54 years 17,887 18,604 +4.01%55 to 59 years 15,214 16,766 +10.20%60 to 64 years 9,748 14,246 +46.14%65 to 69 years 6,811 8,386 +23.12%70 to 74 years 5,709 5,909 +3.50%75 to 79 years 5,037 4,296 -14.71%80 to 84 years 4,593 3,544 -22.84%85+ years 5,188 4,031 -22.30%
Total Population 278,342 291,728 +4.81%
Table 20 summarizes population estimates by age during two non-overlapping American Community Survey 5-year estimates. Changes for key population groups are summarized and displayed in a graph on the next page.

De
mo
gr
aph
ics
39
populatIon by age
Source: U.S. Census Bureau, 2005-2009 and 2010-2014 American Community Survey 5-Year Estimates
Some key trends of note are the increasing population between the ages of 50 and 74 (increase of 8,542 residents), as well as increases in the population aged 20 to 34 (increase of 7,061 residents). During this time period, Saint Paul also saw a decline in the population of residents between 35 and 49 years old, and over 75 years of age.
-25% -15% -5% 5% 15% 25% 35%
Under 5 years
5 to 9 years
10 to 14 years
15 to 19 years
20 to 24 years
25 to 29 years
30 to 34 years
35 to 39 years
40 to 44 years
45 to 49 years
50 to 54 years
55 to 59 years
60 to 64 years
65 to 69 years
70 to 74 years
75 to 79 years
80 to 84 years
85+ years
Figure 19 - Changes in age cohorts, 2005-2009 to 2010-2014

De
mo
gr
aph
ics
40
populatIon by age and sex
This table illustrates the changes in age cohorts by sex. Most of the decrease in the population 70 years old and older were female (likely due to the higher proportion of females who live to be older than 70, compared to males). In contrast, males accounted for a majority of increases in ages 5 to 9 and ages 22 to 24. In the population under 5 years old, the number of females increased while the number of males decreased, resulting in a slight reduction in the total.
Source: U.S. Census Bureau, 2005-2009 and 2010-2014 American Community Survey 5-Year Estimates
Figure 20 - Changes in age cohorts by sex, 2005-2009 to 2010-2014-3,000 -2,000 -1,000 0 1,000 2,000 3,000 4,000
Under 5 years
5 to 9 years
10 to 14 years
15 to 17 years
18 and 19 years
20 years
21 years
22 to 24 years
25 to 29 years
30 to 34 years
35 to 39 years
40 to 44 years
45 to 49 years
50 to 54 years
55 to 59 years
60 and 61 years
62 to 64 years
65 and 66 years
67 to 69 years
70 to 74 years
75 to 79 years
80 to 84 years
85+ years
Total
Female
Male

De
mo
gr
aph
ics
41
-12,000 -8,000 -4,000 0 4,000 8,000 12,000
Two or more races
Some other race
Native Hawaiian and Other Pacific Islander
American Indian and Alaska Native
Asian
Black or African American
Hispanic or Latino
White, not Hispanic or Latino
race and ethnIcIty
Figure 21 - Changes in race and ethnicity of Saint Paul residents, 2005-2009 to 2010-2014
The figure below illustrates Saint Paul’s changing demographics. The population of Black/African American, Hispanic, Asian, and multi-racial residents has increased, while the population of White, non-Hispanic residents decreased over the same period of time. These changes suggest that city residents are becoming increasingly diverse.
Source: U.S. Census Bureau, 2005-2009 and 2010-2014 American Community Survey 5-Year Estimates

De
mo
gr
aph
ics
42
poverty
As of the release of the 2014 5-Year American Community Survey estimates, roughly 34% of the population of Saint Paul lives at or below 150% of the poverty level. The percentage of residents with incomes below 50% of the federal poverty level appears relatively stable between the time periods ‘05-‘09 and ‘10-‘14. However, the percentage of residents at every other poverty level has increased over the same time period. For reference, Table 22 lists the annual income at each poverty level for a single-person household and for a family of four.
Indicator 2005-2009 2010-2014 % Change‘05-’09 to ‘10-‘14
Below 50% of Poverty Level 9.2% 9.6% 0.4%
Below 100% of Poverty Level 19.8% 22.9% 3.1%
Below 125% of Poverty Level 24.1% 28.6% 4.5%
Below 150% of Poverty Level 29.4% 34.0% 4.7%
Table 21 - Saint Paul poverty rates, 2005-2009 to 2010-2014
Figure 22 - Changes in poverty rates over time
Source: U.S. Census Bureau, 2005-2009 and 2010-2014 American Community Survey 5-Year Estimates; US Department of Health and Human Services, Federal Register, Poverty Guidelines
0%
5%
10%
15%
20%
25%
30%
35%
'05-'09 10-'14
Below 50% of Poverty Level Below 100% of Poverty Level
Below 125% of Poverty Level Below 150% of Poverty Level
Indicator Single person
Family of four
50% of Poverty Level $5,835 $11,925
100% of Poverty Level $11,670 $23,850
125% of Poverty Level $14,588 $29,813
150% of Poverty Level $17,505 $35,775
Table 22 - Income at Federal Poverty Level (2014 $)

De
mo
gr
aph
ics
43
poverty and ethnIcIty
Race 2005 - 2009 2010 - 2014 Change‘05-’09 to ‘09-’14
American Indian 33.8% 39.4% +5.6%
Asian 36.1% 34.6% -1.5%
Black or African American 37.4% 42.9% +5.5%
Hispanic or Latino 27.7% 28.4% +0.7%
Other race 19.6% 28.9% +9.3%
Two or more races 30.5% 34.9% +4.4%
White, not Hispanic 10.7% 11.7% +1.0%
Table 23 - Saint Paul poverty rates by race over time
The table below describes the poverty rate in different communities in Saint Paul at different points in time. The growing poverty rates in communities of color are particularly significant. Targeted policies and interventions will likely be necessary to address this issue, and to achieve the vision stated by Mayor Christopher Coleman’s administration: “That Saint Paul will be a city where race does not predetermine opportunities in education, employment, housing, health and safety.”
Source: U.S. Census Bureau, 2005-2009 and 2010-2014 American Community Survey 5-Year Estimates

De
mo
gr
aph
ics
44
poverty and ethnIcIty
Figure 23 - Changes in poverty rates by ethnicity over time
The figure below graphically depicts the concentration of poverty in communities of color presented on the previous page. The chart shows that Saint Paul’s residents of color are significantly more likely to be impoverished than white residents.
Source: U.S. Census Bureau, 2005-2009, 2010-2014 American Community Survey 5-Year Estimates
0% 5% 10% 15% 20% 25% 30% 35% 40% 45% 50%
'05-'09
10-'14
Asian Black or African American Hispanic or Latino Other race Two or more races White, not Hispanic American Indian

De
mo
gr
aph
ics
45
poverty and ethnIcIty
Figure 24 - Changes in poverty rates by ethnicity, 2005-2009 to 2010-2014
The figure below describes the changes in poverty levels by race and ethnicity. In the past five years, poverty levels have increased significantly among communities of color, with the exception of Hispanic or Latino and Asian residents.
Source: U.S. Census Bureau, 2005-2009 and 2010-2014 American Community Survey 5-Year Estimates
0% 2% 4% 6% 8% 10%
American Indian
Asian
Black or African American
Hispanic or Latino
Other race
Two or more races
White, not Hispanic
(-1.5%)

De
mo
gr
aph
ics
46
poverty by age
0.0%
5.0%
10.0%
15.0%
20.0%
25.0%
30.0%
35.0%
Under 18 years Related children under 18 years 18 to 64 years 65 years and over
Figure 25 - Poverty rates by age
Unfortunately, poverty is more likely to affect young residents than adults and senior citizens. This outcome is also likely associated with several other factors, including educational attainment, family size, and race/ethnicity. Regardless, future policies should attempt to prevent and remedy the imbalance of poverty in Saint Paul.
AGE Total Population
Number in Poverty
Percentage of total
Under 18 years 72,733 23,701 32.6%
Related children under 18 years 72,372 23,340 32.3%
18 to 64 years 185,957 38,317 20.6%
65 years and over 25,255 3,117 12.3%
Table 24 - Poverty rates by age
Source: U.S. Census Bureau, 2010-2014 American Community Survey 5-Year Estimates

De
mo
gr
aph
ics
47
educatIonal attaInment
The percentage of residents in Saint Paul with high levels of education (Graduate/Professional and Bachelor’s degrees) has increased since the 2005-2009 estimates. However, the percentage of residents with lower levels of education has also increased moderately.
Education Level ‘05-‘09Total (%)
‘10-‘14Total (%)
Population 25 years and over 174,653 179,486
Graduate or professional degree 25,848 (14.8%) 28,718 (16.0%)
Bachelor's degree 40,170 (23.0%) 40,564 (22.6%)
Associate's degree 11,177 (6.4%) 12,385 (6.9%)
Some college, no degree 33,533 (19.2%) 34,102 (19.0%)
High school graduate 41,916 (24.0%) 39,307 (21.9%)
Some high school, no diploma 10,479 (6.0%) 10,590 (5.9%)
No high school 11,527 (6.6%) 13,820 (7.7%)
Percent high school graduate or higher 152,646 (87.4%) 155,076 (86.4%)
Percent bachelor's degree or higher 66,018 (37.8%) 69,282 (38.6%)
Table 25 - Educational attainment, residents older than 25 years, 2005-2009 to 2010-2014
Source: U.S. Census Bureau, 2005-2009 and 2010-2014 American Community Survey 5-Year Estimates

De
mo
gr
aph
ics
48
educatIonal attaInment
Figure 26 - Change in educational attainment, residents older than 25 years, 2005-2009 to 2010-2014
The figure below illustrates the changing number of residents at each level of education from 2005-2009 to 2010-2014. Saint Paul continues to build on its reputation as a city with a highly educated population.
Source: U.S. Census Bureau, 2005-2009 and 2010-2014 American Community Survey 5-Year Estimates
-3,000 -2,000 -1,000 0 1,000 2,000 3,000
Less than 9th grade
Some high school
High school graduate
Some college; no degree
Associate's
Bachelor's
Grad. or prof. Degree

49
Your suggestions, comments, or questions are welcome. Please contact Jake Reilly at [email protected] or 651-266-6618.
City of Saint Paul, Department of Planning & Economic Development (PED)25 W. 4th St., Suite 1300 Saint Paul, MN 55102
City of Saint Paul Market Watch ReportVolume 7: Spring 2016
Jonathan Sage-MartinsonDepartment [email protected]
Project Coordinator:Jake ReillySenior [email protected]
Research and Design:Vincent FergusonResearch Intern

City of Saint Paul Market Watch ReportVolume 7: Spring 2016
Department of Planning & Economic Development25 W. 4th St., Suite 1300 Saint Paul, MN 55102