Embed Size (px)
Citation preview

© 2018, IJARCSMS All Rights Reserved 170 | P a g e
e-ISJN: A4372-3114 ISSN: 2321-7782 (Online) p-ISJN: A4372-3115 ISSN: 2347-1778 (Print) Impact Factor: 7.327
Volume 6, Issue 2, February 2018
International Journal of Advance Research in Computer Science and Management Studies
Research Article / Survey Paper / Case Study Available online at: www.ijarcsms.com
Special Issue: National Conference on Management, Economics & Social Science (NCMESS 2018)
Organized by: Department of Business Administration, ST. JOSEPH'S COLLEGE (AUTONOMOUS), Tiruchirappalli - 620002, India
A Study on the Influence of Advertising on Consumer Brand
Preference and Loyalty for Hair Shampoo in Dindigul District Dr. D. John Prabakaran
Head and Assistant Professor
Department Of Commerce Computer Application
St.Joseph‟s College (Autonomous)
Tiruchirapalli, Tamil Nadu, India
Abstract: When a market has more variety and substitutes for a product, customers have the option to choose the best among
alternatives. Majority of companies are trying to pull customers towards them and they use all possible methods. Among
them, advertising is the main tool used by almost all companies. This paper aims study on the influence of advertising on
consumer brand preference and loyalty for hair shampoo in Dindigul District. This study is based on a survey of 356
customers in Dindigul town.
The results show that different age segments and sex of the respondents are not influenced by advertising at the time of
purchase of shampoo. Among shampoo brands, Sun Silk, Clinic Plus and Dove are the most preferred brands in Dindigul
district. The advantage of advertising is highlighted in the present study. Advertising serves as a key tool for creating product
awareness and help potential users to take a final decision to purchase. Celebrity and promotional offer in the advertisement
are the influencing factor of the respondents.
Keywords: Advertisement, Brand Preference, Brand loyalty, Brand awareness, consumer loyalty.
I. INTRODUCTION
In the current scenario, many producers are chasing many buyers. Companies are trying different tools of promotion mix.
One of the most important elements in the promotion mix is advertising. Advertising helps companies to communicate their
offerings to present and potential customers. Advertising's main role is to support feelings of satisfaction with brands already
bought.
Advertisement depends on its ability to influence consumer not only for purchase but also to continue repurchase and
ultimately develop-brand loyalty. Therefore, many organizations spend a huge amount of money on advertising and brand
building.
Through advertisement, individual purchaser can recognize and differentiate brands and identify his preferable brand.
Identification of different brands and recalling them from their top of the mind and going continuously for the same brand
creates brand loyalty.
Advertising is often effective. However, it is not as powerful as is sometimes thought, nor is there any evidence that it
actually works by any strong form of persuasion or manipulation. Instead, the sequence, awareness/trial/reinforcement, seems
to account for the known facts. Consumers first gain awareness or interest in a product. Next, they may make a trial purchase.
Finally, a repeat buying habit may be developed and reinforced if there is satisfaction after previous usage.

Dr. D. John et al., Published by: International Journal of Advance Research in Computer Science and Management Studies
Volume 6, Issue 2, February 2018 pg. 170-181
© 2018, IJARCSMS All Rights Reserved ISSN: 2321-7782 (Online) Impact Factor: 7.327 ISSN: 2347-1778 (Print) 171 | P a g e Special Issue: National Conference on Management, Economics & Social Science (NCMESS 2018)
Organized by: Department of Business Administration, ST. JOSEPH'S COLLEGE (AUTONOMOUS), Tiruchirappalli - 620002, India
The message carried out by the advertisement provides necessary information to the customer‟s decision making. The
message may be one or two sided based on the nature of the product or the strategy of the company, which delivers the
advertisement.
Advertisement helps to recognize and where customers have built up favorable attitude towards the product. Individual
purchasers will not go for un-known brands and they continued to purchase the known brand/products. Without brands,
consumer could not tell one product from another and advertising helps to know about the brands. It could be concluded that the
purpose of advertising is to create awareness of the advertised product and provide information that will help the consumer to
make purchase decision. As a result, many organizations use a huge amount of money on advertising and brand management.
II. ADVERTISING, BRAND PREFERENCE AND BRAND LOYALTY
Consumer behavior is „the mental and emotional processes and the observable behavior of consumers during searching
purchasing and post consumption of a product and service (Batra & Kazmi, 2004). Similarly, Engel (et al, 1990) refers
consumer behavior as the action and decision process of people who purchase goods and services for personal consumption.
Brand Preference is the selective demand for a company's brand rather than a product; the degree to which consumers
prefer one brand over another. In an attempt to build brand preference advertising, the advertising must persuade a target
audience to consider the advantages of a brand, often by building its reputation as a long-established and trusted name in the
industry. If the advertising is successful, the target customer will choose the brand over other brands in any category.
Brand Loyalty is the consumer's conscious or unconscious decision, expressed through intention or behavior, to repurchase
a brand continually. It occurs because the consumer perceives that the brand offers the right product features, image, or level of
quality at the right price. Consumer behavior is habitual because habits are safe and familiar. In order to create brand loyalty,
advertisers must break consumer habits, help them acquire new habits, and reinforce those habits by reminding consumers of
the value of their purchase and encourage them to continue purchasing those products in the future.
Advertiser‟s primary mission is to reach prospective customers and influence their awareness, attitudes and buying
behaviour. They spend a lot of money to keep individuals (markets) interested in their products. To succeed, they need to
understand what makes potential customers behave the way they do. The advertisers‟ goal is to get enough relevant market data
to develop accurate profiles of buyers-to-find the common group for communications. (Arens, 1996).
III. LITERATURE REVIEW
Kotler (1988) sees advertising as one of the four communications to target buyers and public noting, “it consists of non-
personal forms of communication conducted through paid media under clear sponsorship”. According to him, the purpose of
advertising is to enhance potential buyers‟ responses to the organization and its offering, emphasizing, “It seeks to do this
providing information, by channeling desire, and by supplying reasons for preferring a particular organization‟s offer.
Advertising and brand loyalty have a mutually beneficial relationship. Raj (1982) found that the loyal users of a brand
increased their volume of purchase in response to increased advertising, while non-loyal users did not increase their purchases
in spite of the increased advertising.
According to Smith and Swinyard (1983), advertising can influence the formation of brand loyalty by establishing source
credibility and setting up a tendency for a favorable usage experience, which would have an effect on subsequent purchases.
Morden (1991) is of the opinion that advertising is used to establish a basic awareness of the product or service in the mind
of the potential customer and to build up knowledge about it.

Dr. D. John et al., Published by: International Journal of Advance Research in Computer Science and Management Studies
Volume 6, Issue 2, February 2018 pg. 170-181
© 2018, IJARCSMS All Rights Reserved ISSN: 2321-7782 (Online) Impact Factor: 7.327 ISSN: 2347-1778 (Print) 172 | P a g e Special Issue: National Conference on Management, Economics & Social Science (NCMESS 2018)
Organized by: Department of Business Administration, ST. JOSEPH'S COLLEGE (AUTONOMOUS), Tiruchirappalli - 620002, India
Aaker, 1991; Dolak, 2003.Branding efforts create a feeling of involvement, a sense of higher quality, and a feeling of
intangible qualities that surround the brand name, mark or symbol.
Srinvasan, Park & Chang, 2005,.Brands create perceptions in the mind of the consumer that it is unique and there is no
other similar product or service in the market. Therefore, a brand is to say to be strong entity if it is consistent over a long period
in providing the product or service, which consumers and prospective purchasers can rely and trust, which will lead to a Brand
promise.
Brand loyalty is a complex construct and it should not be assumed that behavioral loyalty involves feelings or positive
cognitive processes as experience, brand attitude may be one possible determinant of loyal behavior, but there are others such as
distribution, market concentration and promotional activity supporting a brand.
Ms. Roshni P Sawant (2012) The word is speeding into information age. Style is taking a seat next to substance and the
bar gauge of commerce is shifting to images and perceptions from nuts and bolts. As a result everyone is jumping on the brand
wagon. Brands are bigger than ever, but as a result it is also true that more than ever is expected of them. In today‟s world a
brand occupies a space on the consumer landscape much like tat of a person. Advertising also provides the necessary support
after the consumer has made the purchase. If the consumers experience dissonances or discomforts owing to their purchase
decision, then advertisement reduces this feeling of discomforts y providing information on the products attributes. It is even
more necessary to neutralize the impact of the advertisements of rival brands. The subsequent paper endeavors to gauge the role
of advertising in promoting brand predominantly in the perspective of men‟s wear.
Dr. Naheed (2015), The present marketing era shows large dependence on television advertisements which have created
serious social and ethical problems due to their materialistic focus. . The results of his study are significant. Findings of our
study reflect practical implications for marketers to choose appropriate advertisement themes and styles in observance of
cultural values and religious beliefs of local society. The study will be helpful for advertising agencies to prevent them from big
losses by making blameless advertisements which are accepted by all of the peoples of our society including the religious
minded consumers.
Abdul Ghafoor Awan (2016), Advertisement is generally use for creating awareness and promoting products. It is
controversial to measure how much advertisement attracts the customers. The objective of this paper is to find out how much
advertisement brings effect on the consumer‟s buying behavior with reference to FMCGs. Results of this study are robust
because the evidence shows that advertisements have significant impact on consumers‟ buying behavior and their choices.
IV. RESEARCH METHODOLOGY
Objective of the study:
A study on the influence of advertising on consumer brand preference and loyalty for hair shampoo in Dindigul
District. This study tries to figure out the influence of advertising on socio economic variables.
To find out the influence of advertising on consumer buying behaviour
To study the brand awareness among consumers regarding hair shampoos; and
To identify the factors influencing the brand loyalty towards hair shampoos.
The research design for this study is descriptive in nature. Data were collected on a convenience sampling of 356 respondents
of various age groups. The respondents were interviewed and asked to rate their preferred brand of shampoo using a structured
questionnaire. This study has its own limitations. There are chances of the respondents' bias involved in the research. As the

Dr. D. John et al., Published by: International Journal of Advance Research in Computer Science and Management Studies
Volume 6, Issue 2, February 2018 pg. 170-181
© 2018, IJARCSMS All Rights Reserved ISSN: 2321-7782 (Online) Impact Factor: 7.327 ISSN: 2347-1778 (Print) 173 | P a g e Special Issue: National Conference on Management, Economics & Social Science (NCMESS 2018)
Organized by: Department of Business Administration, ST. JOSEPH'S COLLEGE (AUTONOMOUS), Tiruchirappalli - 620002, India
research is restricted with Dindigul town of Tamilnadu, India, the results are not applicable to other parts of the District or State
or Country.
In this research, substitutes of Shampoos like washing soaps or natural products are not considered.
Also Shampoos locally made and unbranded have not been considered. This research is not covering the reasons of specific
shampoo varieties like anti dandruff, Anti hair fall, Shampoo with conditioner, herbal, oil hair, Dry hair or normal hair
shampoo. Particularly the traditional attitude of the female respondents was a limiting factor in gaining information in
this research.
V. DATA ANALYSIS AND INTERPRETATION
Table5. 1- Socio Economic Conditions of the Respondents:
Categories Factors Frequency Percentage
Age of the
respondents
Below 20 years 88 24.7
20-30years 74 20.8
30-40 years 81 22.8
40- 50 years 70 19.7
50 and above years 43 12.1
Total 356 100.0
Sex
Male 168 47.2
Female 188 52.8
Total 356 100.0
Educational
Qualification
SSLC 36 10.1
Plus 2 113 31.7
Graduate 40 11.2
Post Graduate 66 18.5
Diploma 59 16.6
Others 42 11.8
Total 356 100.0
Occupation
Self employed 54 15.2
Government employed 70 19.7
Professional employed 73 20.5
SSI 76 21.3
Business 59 16.6
Others 24 6.7
Total 356 100.0
Marital Status
Single 88 24.7
Married 154 43.3
Unmarried 114 32.0
Total 356 100.0
Monthly Income
Less than 5000 rupees 48 13.5
5000-10000 62 17.4
10000-15000 90 25.3
15000-20000 72 20.2
20000-25000 50 14.0
25000 and above 34 9.6
Total 356 100.0 Source: Primary data
The Table 5.1 table reveals the customer respondents age distribution, Gender difference, marital status, educational
qualification and their monthly income.
Table 5.2 -Number of Persons in the Family
No. of Persons Frequency Percent
0-3 94 26.4
4-6 175 49.2
6 and above 87 24.4 Source: Primary data

Dr. D. John et al., Published by: International Journal of Advance Research in Computer Science and Management Studies
Volume 6, Issue 2, February 2018 pg. 170-181
© 2018, IJARCSMS All Rights Reserved ISSN: 2321-7782 (Online) Impact Factor: 7.327 ISSN: 2347-1778 (Print) 174 | P a g e Special Issue: National Conference on Management, Economics & Social Science (NCMESS 2018)
Organized by: Department of Business Administration, ST. JOSEPH'S COLLEGE (AUTONOMOUS), Tiruchirappalli - 620002, India
The table 5.2 shows that 49.2 percent of the respondents are having 4-6 members in their family. 26.4 and 24.4 percent of
the respondents are having 0-3 and 6 and above members in their family respectively.
Table 5. 3 – Awareness of shampoo brands
Shampoo Brands Frequency*
Clinic plus 281
Sunsilk 272
Johnson & Johnson 227
Pantene 227
Garnier 222
Head & Solder 183
Meera 128
Himalaya 124
Dove 122
Others(Chik,Vivel) 117
Vatika 113 Source: Primary data * Multiple response
The table 5.3 shows the awareness of different shampoo brands in Dindigul. Clinic plus is the well-known brand followed
by Sun silk, Johnson and Johnson, Pantene and Garnier.
Table 5.4 - Expectancy from a brand due to advertisement
Categories Frequency Percent
Recognition 55 15.4
Satisfaction 119 33.4
Value for money 95 26.7
Praise from friends 46 12.9
Social acceptability 23 6.5
Other 18 5.1
Total 356 100.0 Source: Primary data
The above table shows that how much advertisement can influence the customer to fulfill his expectation from a particular
brand of hair shampoo. Advertisement helps the customer to recognize and understand about promotional offers by the
company (if any). 33.4% of the respondents said they expects from their brand is Satisfaction. 26.7% and 12.9% of the
respondents said they expects from their brand is Value for money and Praise from friends respectively. 6.5% and 15.4% of the
respondents said they expects from their brand is Social acceptability and Recognition respectively. 5.1%of the respondents said
other attributes like warranty, Prestige etc., from their brand.
Table 5.5-Factors in selection of a brand
Categories Frequency Percent
Advertisement in the media 121 34.0
Brand name/image 67 18.8
Friends & relatives influence 63 17.7
Current trends 47 13.2
Availability 39 11.0
sales offer 19 5.3
Total 356 100.0 Source: Primary data
The table 5.5 shows that 34 % of the respondents select a brand based on Advertisement in the Medias, 18.8 % of the
respondents select a product based on brand name/image.17.7% of the respondents select a product based on Friends & relatives

Dr. D. John et al., Published by: International Journal of Advance Research in Computer Science and Management Studies
Volume 6, Issue 2, February 2018 pg. 170-181
© 2018, IJARCSMS All Rights Reserved ISSN: 2321-7782 (Online) Impact Factor: 7.327 ISSN: 2347-1778 (Print) 175 | P a g e Special Issue: National Conference on Management, Economics & Social Science (NCMESS 2018)
Organized by: Department of Business Administration, ST. JOSEPH'S COLLEGE (AUTONOMOUS), Tiruchirappalli - 620002, India
influence. 11% of the respondents select a product based on Availability. 13.2% of the respondents select a product based on
current trends, 5.3% of the respondents select a brand based on sales offer.
Table 5.6-Source of information
Sources Frequency Percent
TV 154 43.3
Radio 28 7.9
Friends & relatives 78 21.9
Print 33 9.3
While shopping 37 10.4
Internet 18 5.1
Others 8 2.2
Total 356 100.0
Source: Primary data
From the above table 44.3 % of the respondents come to know about a brand through TV media, 21.9 % of the respondents
come to know about a brand through Friends & relatives. 10.4 % of the respondents come to know about a brand while
shopping. 7.9 % of the respondents come to know about a brand through radio. 9.3% of the respondents come to know about a
brand through Print media. 5.1 % of the respondents come to know about a brand through internet. 2.2% of the respondents
come to know about a brand through others such as word of mouth, Point of Display etc.
Table 5.7-Attribute in the Advertisement Influence
Attributes Frequency Percent
Appeal 54 15.2
Slogan/jingle/song 34 9.6
Theme/message 41 11.5
Offer 69 19.4
Creativity 65 18.3
Celebrity 93 26.1
Total 356 100.0
Source: Primary data
The above table shows that the opinion of the respondent about attribute in the advertisement Influences. Celebrity (26.1%)
and Offer (19.4%) are two attributes in the advertisement influences the customers.15.2% of the respondents were influenced by
Appeal in the advertisement. 11.5% of the respondents were influenced by theme/message in the advertisement. 18.3% and
9.6% of the respondents were influenced by creativity and Slogan /Jingle/song in the advertisement respectively.
Table 5.8- Advertisement Influence on Your Purchase Decision
Categories Frequency Percent
Yes 261 73.3
No 95 26.7
Total 356 100.0
Source: Primary data
The table 5.8 shows that 73.3% of the respondents said their Purchase decisions are influenced by advertisement. 26.7% of
the respondent said advertisement is not influencing them.
Table 5. 9-Frequency of Purchase
Factors Frequency Percent
Within a week 53 14.9
Every fortnight 61 17.1
Once in a month 137 38.5
2-6 months 64 18.0
6 months and above 41 11.5

Dr. D. John et al., Published by: International Journal of Advance Research in Computer Science and Management Studies
Volume 6, Issue 2, February 2018 pg. 170-181
© 2018, IJARCSMS All Rights Reserved ISSN: 2321-7782 (Online) Impact Factor: 7.327 ISSN: 2347-1778 (Print) 176 | P a g e Special Issue: National Conference on Management, Economics & Social Science (NCMESS 2018)
Organized by: Department of Business Administration, ST. JOSEPH'S COLLEGE (AUTONOMOUS), Tiruchirappalli - 620002, India
Total 356 100.0 Source: Primary data
The above table shows that the opinion of the respondents about the frequency of purchase.38.5% of the respondents said
they are purchasing their brand once in a month. 18% said in-between 2 to 6 months. 17.1 % said every fortnight. 14.9% and
11.5% said they are purchasing their brand within a week and 6 months & above respectively.
Table 5.10-How Much Quantity You Purchase?
Quantity (in - ml)/Month Frequency Percent
Below 50 ml 47 13.2
50ml- 100 ml 83 23.3
100ml-150ml 113 31.7
150ml-200ml 69 19.4
200 ml and above 44 12.4
Total 356 100.0 Source: Primary data
The table 5.10 shows that31.7% of the respondents said 100 ml-150ml shampoo they are purchasing every month. 23.3%
and 19.4% of the respondents said 50 ml-100ml & 150 ml-200m shampoo they are purchasing every month respectively. 13.2%
of the respondents said below 50ml shampoo they are purchasing every month. 12.4% of the respondents said 200 ml and above
shampoo they are purchasing every month.
Table 5. 11-How Often You Use Your Hair Shampoo?
Factors Frequency Percent
Everyday 35 9.8
Twice/thrice a week 117 32.9
Once in a week 70 19.6
Once in a fortnight 58 16.4
once in a month 52 14.6
Rarely 24 6.7
Total 356 100.0
Source: Primary data
The table 5.11 shows that 32.9 percent of the respondents said, they are using shampoo twice/thrice a week.19.6 and 16.4
percent of the respondents said once in a week and once in a fortnight respectively.14.6 percent of the respondents said they are
using shampoo once in a month. 9.8 percent of the respondents said they are using shampoo Everyday. 6.7 percent of the
respondents said they are using shampoo rarely.
Table 5.12-Advertisement Influence on Customers
FACTORS
Advertisement
creates
awareness
Advertisement
influences
you to recognize
their brand
Advertisement
makes to recall
the brand
Advertisement
influences for
repeat purchase
Freq % Freq % Freq % Freq %
Mostly
Disagree 16 4.5 22 6.2 24 6.7 20 5.6
Disagree 24 6.7 24 6.7 26 7.3 27 7.6
Neutral 44 12.4 55 15.4 53 14.9 57 16.0
Agree 200 56.2 156 43.8 136 38.2 163 45.8
Mostly agree 72 20.2 99 27.8 117 32.9 89 25.0
Total 356 100.0 356 100.0 356 100.0 356 100.0
Source: Primary data
Dr. D. John et al., Published by: International Journal of Advance Research in Computer Science and Management Studies
Volume 6, Issue 2, February 2018 pg. 170-181
© 2018, IJARCSMS All Rights Reserved ISSN: 2321-7782 (Online) Impact Factor: 7.327 ISSN: 2347-1778 (Print) 177 | P a g e Special Issue: National Conference on Management, Economics & Social Science (NCMESS 2018)
Organized by: Department of Business Administration, ST. JOSEPH'S COLLEGE (AUTONOMOUS), Tiruchirappalli - 620002, India
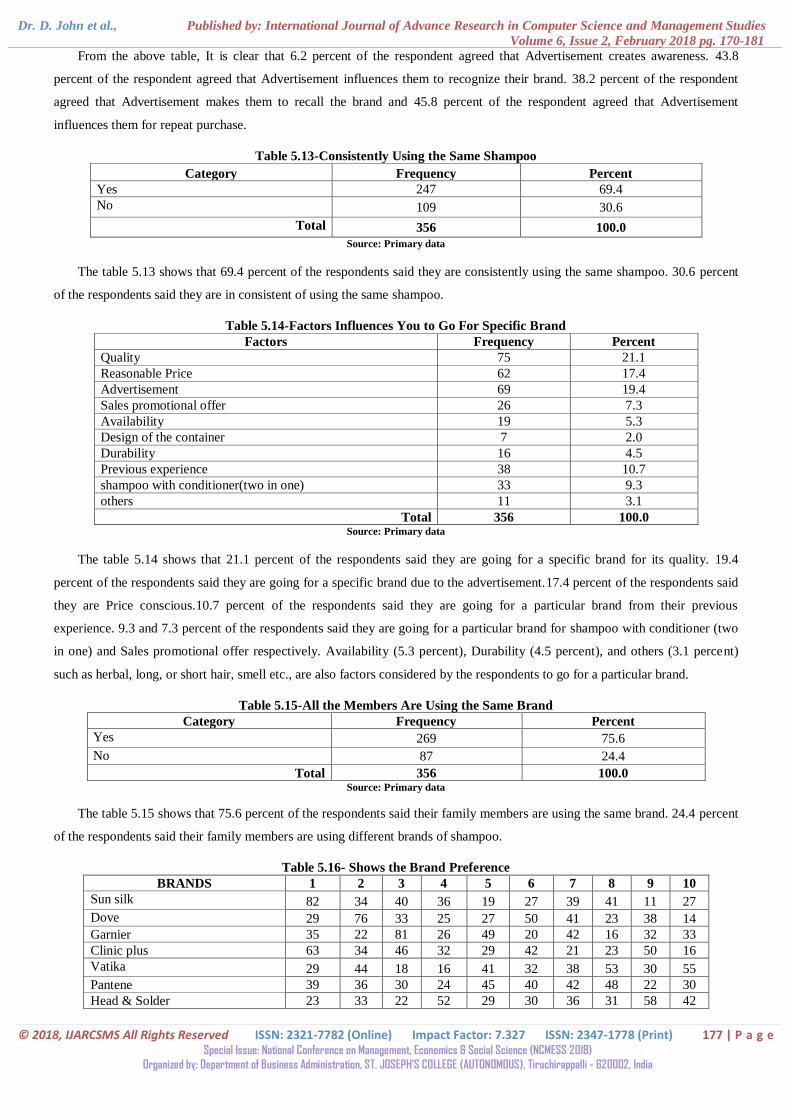
From the above table, It is clear that 6.2 percent of the respondent agreed that Advertisement creates awareness. 43.8
percent of the respondent agreed that Advertisement influences them to recognize their brand. 38.2 percent of the respondent
agreed that Advertisement makes them to recall the brand and 45.8 percent of the respondent agreed that Advertisement
influences them for repeat purchase.
Table 5.13-Consistently Using the Same Shampoo
Category Frequency Percent
Yes 247 69.4
No 109 30.6
Total 356 100.0
Source: Primary data
The table 5.13 shows that 69.4 percent of the respondents said they are consistently using the same shampoo. 30.6 percent
of the respondents said they are in consistent of using the same shampoo.
Table 5.14-Factors Influences You to Go For Specific Brand
Factors Frequency Percent
Quality 75 21.1
Reasonable Price 62 17.4
Advertisement 69 19.4
Sales promotional offer 26 7.3
Availability 19 5.3
Design of the container 7 2.0
Durability 16 4.5
Previous experience 38 10.7
shampoo with conditioner(two in one) 33 9.3
others 11 3.1
Total 356 100.0 Source: Primary data
The table 5.14 shows that 21.1 percent of the respondents said they are going for a specific brand for its quality. 19.4
percent of the respondents said they are going for a specific brand due to the advertisement.17.4 percent of the respondents said
they are Price conscious.10.7 percent of the respondents said they are going for a particular brand from their previous
experience. 9.3 and 7.3 percent of the respondents said they are going for a particular brand for shampoo with conditioner (two
in one) and Sales promotional offer respectively. Availability (5.3 percent), Durability (4.5 percent), and others (3.1 percent)
such as herbal, long, or short hair, smell etc., are also factors considered by the respondents to go for a particular brand.
Table 5.15-All the Members Are Using the Same Brand
Category Frequency Percent
Yes 269 75.6
No 87 24.4
Total 356 100.0 Source: Primary data
The table 5.15 shows that 75.6 percent of the respondents said their family members are using the same brand. 24.4 percent
of the respondents said their family members are using different brands of shampoo.
Table 5.16- Shows the Brand Preference
BRANDS 1 2 3 4 5 6 7 8 9 10
Sun silk 82 34 40 36 19 27 39 41 11 27
Dove 29 76 33 25 27 50 41 23 38 14
Garnier 35 22 81 26 49 20 42 16 32 33
Clinic plus 63 34 46 32 29 42 21 23 50 16
Vatika 29 44 18 16 41 32 38 53 30 55
Pantene 39 36 30 24 45 40 42 48 22 30
Head & Solder 23 33 22 52 29 30 36 31 58 42

Dr. D. John et al., Published by: International Journal of Advance Research in Computer Science and Management Studies
Volume 6, Issue 2, February 2018 pg. 170-181
© 2018, IJARCSMS All Rights Reserved ISSN: 2321-7782 (Online) Impact Factor: 7.327 ISSN: 2347-1778 (Print) 178 | P a g e Special Issue: National Conference on Management, Economics & Social Science (NCMESS 2018)
Organized by: Department of Business Administration, ST. JOSEPH'S COLLEGE (AUTONOMOUS), Tiruchirappalli - 620002, India
Meera 17 29 31 58 44 30 50 33 27 37
Johnson & Johnson 16 26 40 49 39 44 21 44 31 46
Himalaya 23 22 15 38 34 41 26 44 57 56
Source: Primary data
Every respondent have his or her own reasons to prefer a specific brand of shampoo. By referring the Garrett‟s table, the
percent position estimated is converted into scores. Then for each factor the scores of each individual are added and then mean
values is calculated.
The table5. 16 shows the customers brand preference of shampoo in Dindigul. The customer respondents are asked to rank
their preferred brands of shampoo based on their own choice.
Outcome of such ranking have been converted into score value with the help of the following Formula:
Percent Position = 100(Rij-0.5)/Nj
Where, Rij = Rank given for the ith factor by the j
th respondents
Nj = Number of factors ranked by the jth respondents.
Table 5.17 - Shows the Brand Preference with Garrett Score
BRANDS 1 2 3 4 5 6 7 8 9 10
Garrett
score
Mean
score Rank
Sun silk 6724 2380 2520 2088 988 1296 1638 1517 330 486 19967 56.08 I
Dove 2378 5320 2079 1450 1404 2400 1722 851 1140 252 18996 53.35 III
Garnier 2870 1540 5103 1508 2548 960 1764 592 960 594 18439 51.79 IV
Clinic plus 5166 2380 2898 1856 1508 2016 882 851 1500 288 19345 54.33 II
Vatika 2378 3080 1134 928 2132 1536 1596 1961 900 990 16635 46.72 IX
Pantene 3198 2520 1890 1392 2340 1920 1764 1776 660 540 18000 50.56 V
Head & Solder 1886 2310 1386 3016 1508 1440 1512 1147 1740 756 16701 46.91 VIII
Meera 1394 2030 1953 3364 2288 1440 2100 1221 810 666 17266 48.50 VI
Johnson & Johnson 1312 1820 2520 2842 2028 2112 882 1628 930 828 16902 47.47 VII
Himalaya 1886 1540 945 2204 1768 1968 1092 1628 1710 1008 15749 44.23 X Source: Primary data
The above table 5.17 shows Garrett‟s ranking and mean scores. The table highlights Garrett‟s scores, which help to decide
the most important factors adopted by the respondent. The brand sun silk (ranked-1) with a score of 56.08, which is the most
preferred brand in Dindigul. Clinic Plus (ranked-2) with a score of 54.33, which is the second preferred brand, third rank, is
given to Dove with a score of 53.35 and the lowest rank Himalaya (X) is 44.23. It is inferred from these table that an individual
chooses the shampoo based on their own perceptions in order to satisfy their needs.
Table 5.18 -Your Brand Is Not Available- What Will You Do?
Statements Frequency Percent
Go for other brand 75 21.1
Go to other shop and purchase my brand 186 52.2
Wait until to get my brand 95 26.7
Total 356 100.0
Source: Primary data
The table 5.18 shows that 52.2 percent would move to some other shop for purchasing the same brand, while 26.7 would
prefer to stay and wait for the brand at the same shop. 21.1 percent of the respondents said that they would shift to another
brand.

Dr. D. John et al., Published by: International Journal of Advance Research in Computer Science and Management Studies
Volume 6, Issue 2, February 2018 pg. 170-181
© 2018, IJARCSMS All Rights Reserved ISSN: 2321-7782 (Online) Impact Factor: 7.327 ISSN: 2347-1778 (Print) 179 | P a g e Special Issue: National Conference on Management, Economics & Social Science (NCMESS 2018)
Organized by: Department of Business Administration, ST. JOSEPH'S COLLEGE (AUTONOMOUS), Tiruchirappalli - 620002, India
Table 5.19- Advertisement Influence on Socio Economic Variables of the Respondents
NULL HYPOTHESIS (H0): The socio economic variables have no relationship with Advertisement influence.
S.no Demographic
Variables
Chi square Result (P<.05)
Calculated
Value
(CV)
Degrees of
Freedom
Table
value
(TV)
Inference Asymp.
Sig
Null
Hypothesis
1 Age 9.044 4 9.48 CV<TV 0.060 Accepted
2 Sex 0.079 1 3.84 CV<TV 0.779 Accepted
3 Education 15.845 5 11.07 CV>TV 0.007 Rejected
4 Occupation 15.075 5 11.07 CV>TV 0.010 Rejected
5 Monthly
Income
5.046 5 11.07 CV<TV 0.410 Accepted
6 Marital Status 11.230 2 5.99 CV>TV .004 Rejected
Source: Primary data
The above table shows that NULL HYPOTHESIS (H0): The socio economic variables have no relationship with
Advertisement influence.
It is evident from the table 5.19 that the hypothesis is accepted in three cases and in other cases, the hypothesis is rejected.
It is concluded that respondent‟s age, sex and monthly family income are not significantly influenced by advertisement.
However, Education, Occupation and Marital status are significantly related with the advertisement.
Table 5.20-Consistently using the same shampoo Advertisement Influences to go for repeated purchase
Advertisement influences you
to go for repeat purchase
Consistently using the same shampoo
Total Yes No
Mostly Disagree 19 1 20
Disagree 19 8 27
Neutral 44 13 57
Agree 118 45 163
Mostly agree 47 42 89
Total 247 109 356 Source: Primary data
The table 5.20 shows that Consistently using the same shampoo Advertisement Influences to go for repeated purchase.
H0 = There is no significant relationship between the advertisement and consistently using the same shampoo (repeated
purchase).
H1 = There is a significant relationship between the advertisement and consistently using the same shampoo.
X2 Calculated value: 20.031 df: 4 Asymp. Sig. (2-sided): 0.000
Table value at 5% significant level (P<.05): 9.488
X2 Calculated value: 20.031> Table value 9.488. Since H0 – Rejected
Hence, there is a significant relationship between consistently using the same shampoo with the advertisement influence.
VI. FINDING AND DISCUSSION
Advertisements in the Medias, Particularly TV and friends & relatives (word of mouth) are creating awareness to the
respondents about the shampoo brands.

Dr. D. John et al., Published by: International Journal of Advance Research in Computer Science and Management Studies
Volume 6, Issue 2, February 2018 pg. 170-181
© 2018, IJARCSMS All Rights Reserved ISSN: 2321-7782 (Online) Impact Factor: 7.327 ISSN: 2347-1778 (Print) 180 | P a g e Special Issue: National Conference on Management, Economics & Social Science (NCMESS 2018)
Organized by: Department of Business Administration, ST. JOSEPH'S COLLEGE (AUTONOMOUS), Tiruchirappalli - 620002, India
Most of the customers purchase shampoo once in a month and they prefer to buy 100ml- 150ml pack. Customers using
shampoo twice/thrice a week. This study reveals that educated, married and working customers are influenced by
advertisement at the time of their purchase towards shampoo.
72.3 percent of the respondents said advertisement has strong influence on their purchase decision. Sun silk, Clinic plus,
Dove are mostly preferred brands in Dindigul. These brands are having high loyal customers. Celebrity and promotional
offer in the advertisement are the influencing factor of the respondents. Quality, Previous experience, and Price are also
influencing the customers to go for a specific shampoo brand.
It is found that the distinction between repeat purchases and actual brand loyalty. A repeat purchase behavior is the actual
re-buying of a brand whereas loyalty includes previous experience or a reason or fact occurring before the behavior.
It is observed that dandruff removal, value for money, brand image and shine were the most important factors considered
by the respondents. In the study at Dindigul reveals the same attitude of the respondents. Satisfaction and worth (value for
money) are the two important factors considered by the respondents from their shampoo.
52.2 percent of the respondents would move to some other shop for purchasing the same brand if their regular brand is not
available in the shop. While 26.7 would prefer to stay and wait for the brand available in the same shop and shows the
brand loyalty towards their preferred brands of shampoo. This shows strong brand loyalty behaviour of the customers in the
shampoo market.
VII. CONCLUSION
The success of the businesses depends on their ability to create and sustain the customer loyalty. Brand loyalty of the
customers provides strong shielded effects to the particular brand than its competitive brand.
In this study, it was observed that how advertisement influences the customers for brand choice and brand loyalty.
Celebrities, Offer, Quality and Price are the considerable factors in the shampoo market. Therefore, this study reveals how a
customer approaches a product and how he/she made his/her decision towards the purchase of a shampoo.
Hence, information provided from this study will help those companies in the Hair care market, in shaping their marketing
strategies and serving their customers better.
References
1. Aaker, D.A. (2002). Building strong brands.UK: Free press business
2. Aaker, Jennifer (1997), ‘‘Dimensions of Brand Personality,‟ Journal of Marketing Research, 34(August), 347–357.
3. Assael H. (1987). Consumer Behavior and Marketing Action, Boston: Kent Publishing Company.
4. Adeolu B. Ayanwale, Taiwo Alimi and Matthew A. Ayanbimipe, “The influence of advertising on consumer brand preference”, Journal of Social
Science., 10(1):9-16 (2005)
5. Baldinger A.L. and Rubinson J. (1996). Brand Loyalty: The Link between Attitude and Behavior. Journal of Advertising Research, 36, 22-34.
6. Corstjens M. and Lal R., “Building store loyalty through store brands”, Journal of Marketing Research,37(3) ,281-291 (2000)
7. Deighton at al, (1994). “The effect of Advertising on Brand Switching and Repeat Purchasing”, Journal of Marketing Research, pp 28-31
8. Dr.S.L.Gupta, Brand Management (Text cases), Himalaya Publishing House, New Delhi
9. Erdem, Keane, and Sun: “A Dynamic Model of Brand Choice: When Price and Advertising Signal Product Quality”, Marketing Science 27(6), pp. 1111–
1125, 2008: INFORMS.
10. Keller K.L. (2007). Strategic Brand Management-Building, Measuring, and Managing Brand Equity, (2nd ed.), New Delhi: Prentice Hall of India.
11. Kotler P. (2006). Marketing Management (10th ed.). New Delhi: Pearson Education.
12. Lalit Mohan Kathuria and Bhupinder Jit. (2009).A Study of Brand Awareness and Brand Loyalty towards Hair Shampoos in Ludhiana City. The IUP
Journal of Brand Management, 6, (3&4), 122-133.
13. Leon G. Schiffman, Leslie Lazar Kanuk, Consumer Behaviour, Prentice Hall of India, New Delhi, 2005.

Dr. D. John et al., Published by: International Journal of Advance Research in Computer Science and Management Studies
Volume 6, Issue 2, February 2018 pg. 170-181
© 2018, IJARCSMS All Rights Reserved ISSN: 2321-7782 (Online) Impact Factor: 7.327 ISSN: 2347-1778 (Print) 181 | P a g e Special Issue: National Conference on Management, Economics & Social Science (NCMESS 2018)
Organized by: Department of Business Administration, ST. JOSEPH'S COLLEGE (AUTONOMOUS), Tiruchirappalli - 620002, India
14. Lin, Chinho; Wu, Wann-Yih; Wang, Zhi-Feng. A study of market structure: brand loyalty and brand switching behaviours for durable household
appliances. International Journal of Market Research, June 22, 2000.
15. Murugananatham.G and Kaliamoorthy.S. (2006). “Celebrities in Advertising”, Marketing Mastermind, July 2006, pp 15-20, ICFAI Journal.
16. Pamela L.Alreck, Robert B.Settle. Strategies for building consumer brand preference. Journal of Product & Brand Management, 8, 130-144.
17. Russell-Bennett, Rebekah and McColl-Kennedy, Janet R. and Coote, Leonard V. (2007). Involvement, satisfaction, and brand loyalty in a small business
services setting. Journal of Business Research, 60(12), 1253-1260.
18. Rajagopal. (2008). Measuring brand performance through Metrics application. Journal of Measuring Business Excellence, 12(1), 29-38.
19. Wong foong yee and yahyah sidek. (2008). Influence of Brand Loyalty on Consumer Sportswear. International Journal of Economics and Management,
2(2), 221 – 236.
20. Woodside, A.G. (1990), “Measuring advertising effectiveness in destination strategies”, Journal of Travel Research, Vol 29, Issue 2, pp.38.
21. Yong Tae Bang. (2008).How Female Consumers Think of Themselves, Make Consumption and Show Loyalty to a Brand. International Review of
Business Research Papers, 4(3 June), 56-63.
22. Ms. Roshni P Sawant (2012) Impact of Advertising on Brand Awareness and Consumer Preference (With Special Reference to Men`S Wear) , IOSR
Journal of Business and Management (IOSR-JBM) ISSN: 2278-487X.Volume 5, Issue 6 (Nov. - Dec. 2012), PP 54-61
23. Bushra Anjum (2015), Impact of Television Advertisement on Consumer Buying Behavior, International Interdisciplinary Journal of Scholarly Research
(IIJSR), Vol. 1 No. 3, 2015 ISSN 2412-303X, PP 36-48.
24. Prof. Dr. Abdul Ghafoor Awan (2016), Effects of Advertisement on Consumer‟s Buying Behaviour with References to FMCGs in Southern Punjab-
Pakistan, Journal of Marketing and Consumer Research www.iiste.org ISSN 2422-8451 An International Peer-reviewed Journal Vol.19, 2016, PP 22-30.