Embed Size (px)
Citation preview

Master Thesis Degree Project
A Study on Feasibility of the Distributed
Battery Energy Storage Systems in Spanish
Retail Electricity Market
European Institute of Technology
“KIC InnoEnergy” Master of Sciencein
Smart Electrical Networks and Systems
Author Maksims Sisovs
Supervisor Assoc. Prof. F. Javier Heredia CerveraCollaborating entity mentors Enric Farguell Matesanz
Alberto Barroso del Toro
In collaboration withMinsait by Indra
Escola Tecnica Superior d’Enginyeria Industrial de BarcelonaUniversitat Politecnica de Catalunya
Av. Diagonal, 647, 08028 Barcelona, Spain
September, 2016

1 M. Sisovs, “Distributed BESS in Retail Electricity Market”
Abstract
The main focus of this master thesis project is to evaluate the economic,
technical and regulatory feasibility of distributed battery energy storage
systems (BESS) and the potential opportunity of electricity companies to
increase their profits through advanced operation in energy services, such as
electric energy time-shift, ancillary or electric vehicle incentives in Spanish
electricity market.
To assess the feasibility, an optimization tool has been developed. This
tool simulates energy trading between different market participants with
particular features extracted from data analysis and literature.
Load consumption profiles had been developed from smart meter real
data by applying several data mining techniques. This part had been guided
by external collaborating entity Minsait.
Electricity market analysis includes the overview of its functionality prin-
ciples and regulatory side regarding storage adaptation and specific service
applicability. Market historical prices were used for further electricity trad-
ing simulation.
A brief technical insight explains current storage situation and tells about
high-potential technologies in emerging markets. Benchmark analysis covers
several products of battery manufacturers with relevant technical and price
information.
Spanish electricity market showed low adaptability to distributed BESS
solutions: energy arbitrage incomes have resulted being insufficient. An-
cillary services, despite promising economic figures, are to a large extent
prohibited to be provided by distributed storage. Electric vehicle incen-
tives, though, resulted being of a high interest due to absence of direct
investment.

M. Sisovs, “Distributed BESS in Retail Electricity Market” 2
Contents
1 Introduction 9
1.1 Description of the Problem . . . . . . . . . . . . . . . . . . . . . . . 10
1.2 Background and Recent Research . . . . . . . . . . . . . . . . . . . 11
1.2.1 Battery Energy Storage . . . . . . . . . . . . . . . . . . . . 12
1.2.2 Optimal Operation . . . . . . . . . . . . . . . . . . . . . . . 13
1.2.3 Data Analysis . . . . . . . . . . . . . . . . . . . . . . . . . . 13
1.3 Objectives of Study and Main Contributions . . . . . . . . . . . . . 14
1.3.1 Mathematical Model Inputs . . . . . . . . . . . . . . . . . . 14
1.3.2 Mathematical Model Development . . . . . . . . . . . . . . 15
1.3.3 Post-optimization Analysis . . . . . . . . . . . . . . . . . . . 15
1.4 Motivation . . . . . . . . . . . . . . . . . . . . . . . . . . . . . . . . 16
2 Smart Meter Data Analysis 18
2.1 Overview and Understanding . . . . . . . . . . . . . . . . . . . . . 18
2.2 Initial Steps . . . . . . . . . . . . . . . . . . . . . . . . . . . . . . . 18
2.3 Segmentation & Clustering . . . . . . . . . . . . . . . . . . . . . . . 22
2.3.1 Results . . . . . . . . . . . . . . . . . . . . . . . . . . . . . . 25
2.4 Applied Information Analysis . . . . . . . . . . . . . . . . . . . . . 29
2.5 Output Creation . . . . . . . . . . . . . . . . . . . . . . . . . . . . 30
3 Electricity Market Analysis 32
3.1 Electricity Market in Spain . . . . . . . . . . . . . . . . . . . . . . . 32
3.2 Related Regulations and Policies . . . . . . . . . . . . . . . . . . . 34
3.2.1 Energy Storage Policies in Spain . . . . . . . . . . . . . . . . 36
3.3 Electricity Market Historical Data . . . . . . . . . . . . . . . . . . . 38
3.3.1 Day-Ahead Market . . . . . . . . . . . . . . . . . . . . . . . 38
3.3.2 Secondary Regulation Market . . . . . . . . . . . . . . . . . 41
3.4 Output Creation . . . . . . . . . . . . . . . . . . . . . . . . . . . . 43
4 Battery Energy Storage Systems 45
4.1 Technological Perspective . . . . . . . . . . . . . . . . . . . . . . . 45
4.1.1 Battery Types . . . . . . . . . . . . . . . . . . . . . . . . . . 47

3 M. Sisovs, “Distributed BESS in Retail Electricity Market”
4.2 Proposed Product Solutions . . . . . . . . . . . . . . . . . . . . . . 49
4.3 Economics of Energy Storage . . . . . . . . . . . . . . . . . . . . . 51
4.3.1 Energy Arbitrage . . . . . . . . . . . . . . . . . . . . . . . . 52
4.3.2 Support of Renewables . . . . . . . . . . . . . . . . . . . . . 55
4.3.3 Frequency Regulation . . . . . . . . . . . . . . . . . . . . . . 56
4.3.4 Capacity Upgrade Deferral . . . . . . . . . . . . . . . . . . . 57
4.3.5 Other Services . . . . . . . . . . . . . . . . . . . . . . . . . . 57
5 Mathematical Model 59
5.1 Overview . . . . . . . . . . . . . . . . . . . . . . . . . . . . . . . . . 59
5.2 Optimization Model . . . . . . . . . . . . . . . . . . . . . . . . . . 60
5.2.1 Sets . . . . . . . . . . . . . . . . . . . . . . . . . . . . . . . 60
5.2.2 Parameters . . . . . . . . . . . . . . . . . . . . . . . . . . . 61
5.2.3 Variables . . . . . . . . . . . . . . . . . . . . . . . . . . . . . 62
5.2.4 Constraints . . . . . . . . . . . . . . . . . . . . . . . . . . . 63
5.2.5 Objective Function . . . . . . . . . . . . . . . . . . . . . . . 67
5.2.6 Trading Period Profit Estimation . . . . . . . . . . . . . . . 68
5.3 Problem Definition . . . . . . . . . . . . . . . . . . . . . . . . . . . 70
5.3.1 Energy Arbitrage Problem . . . . . . . . . . . . . . . . . . . 71
5.3.2 Secondary Reserve Market Problem . . . . . . . . . . . . . . 71
5.3.3 Electric Vehicle Problem . . . . . . . . . . . . . . . . . . . . 72
5.3.4 Outage Problem . . . . . . . . . . . . . . . . . . . . . . . . . 72
5.3.5 Transmission and Distribution Costs Deferral Problem . . . 74
6 Case Study 76
6.1 Parameter Value Assignation . . . . . . . . . . . . . . . . . . . . . . 76
6.1.1 Data Obtained From Previous Chapters . . . . . . . . . . . 76
6.1.2 Case Study Assumed Values . . . . . . . . . . . . . . . . . . 77
6.2 Problem Complexity . . . . . . . . . . . . . . . . . . . . . . . . . . 80
6.3 Optimization and Results . . . . . . . . . . . . . . . . . . . . . . . 80
6.4 Cost-Benefit Analysis . . . . . . . . . . . . . . . . . . . . . . . . . . 85
6.5 Discussion . . . . . . . . . . . . . . . . . . . . . . . . . . . . . . . . 87
7 Conclusions 91

M. Sisovs, “Distributed BESS in Retail Electricity Market” 4
A Appendix: Complete Optimization Results 100
A.1 Energy Arbitrage Problem . . . . . . . . . . . . . . . . . . . . . . . 100
A.2 Secondary Reserve Market Problem . . . . . . . . . . . . . . . . . . 102
A.3 Electric Vehicle Problem . . . . . . . . . . . . . . . . . . . . . . . . 104
A.4 T&D Deferral and Outage Problem . . . . . . . . . . . . . . . . . . 105
B Appendix: Cash Flow Example for Cost-benefit Analysis 108

5 M. Sisovs, “Distributed BESS in Retail Electricity Market”
List of Figures
1 Electricity market prices on June 1, 2014 [1] . . . . . . . . . . . . . 11
2 Number of daily measurements from “RC1” available throughout
the period . . . . . . . . . . . . . . . . . . . . . . . . . . . . . . . . 20
3 Daily measurements of random consumer . . . . . . . . . . . . . . . 20
4 Average profile and its standard deviation of all “RC1” data . . . . 21
5 Iberian pen. average LV consumption and its standard deviation [2] 22
6 Data segmentation and clustering . . . . . . . . . . . . . . . . . . . 23
7 Eight clusters of winter weekday profile . . . . . . . . . . . . . . . . 27
8 Eight clusters of winter Saturday profile . . . . . . . . . . . . . . . 27
9 Eight clusters of winter Sunday profile . . . . . . . . . . . . . . . . 28
10 Eight clusters of summer weekday profile . . . . . . . . . . . . . . . 28
11 Eight clusters of summer Saturday profile . . . . . . . . . . . . . . . 29
12 Eight clusters of summer Sunday profile . . . . . . . . . . . . . . . 29
13 Example of concentrator location with number of units . . . . . . . 30
14 Overview of market operations . . . . . . . . . . . . . . . . . . . . . 32
15 Illustration of optimal dispatch in a simple electricity market [3] . . 33
16 Electricity market scheduling [2] . . . . . . . . . . . . . . . . . . . . 34
17 All hourly DAM prices, year 2014 [1] . . . . . . . . . . . . . . . . . 38
18 Average daily DAM prices, year 2014 [1] . . . . . . . . . . . . . . . 39
19 Daily minimum and maximum DAM prices [1] . . . . . . . . . . . . 40
20 Influence of wind energy production on DAM prices [2] . . . . . . . 40
21 Daily maximum DAM price variation values [1] . . . . . . . . . . . 41
22 Average secondary reserve market price [2] . . . . . . . . . . . . . . 42
23 Secondary regulation energy characteristics in the system [2] . . . . 43
24 Global installed grid-connected electricity storage capacity (MW) [4] 45
25 Worldwide battery storage forecast [5] . . . . . . . . . . . . . . . . 46
26 Estimated installed battery capacity by type in 2014 [5] . . . . . . . 48
27 Example of CES . . . . . . . . . . . . . . . . . . . . . . . . . . . . 49
28 Simplified visualisation of BESS [5] . . . . . . . . . . . . . . . . . . 50
29 Overview of storage applications and their potential [6] . . . . . . . 52
30 Potential earnings and cycle cost of S&C “PureWave” battery . . . 55

M. Sisovs, “Distributed BESS in Retail Electricity Market” 6
31 Model visualization of day-ahead and secondary reserve markets
trading . . . . . . . . . . . . . . . . . . . . . . . . . . . . . . . . . . 60
32 Visualization of EV operation implementation . . . . . . . . . . . . 79
33 NPV for a range of projects with BESS or EV for 10-year horizon
and different discount rates . . . . . . . . . . . . . . . . . . . . . . 87
List of Tables
1 Initial data overview . . . . . . . . . . . . . . . . . . . . . . . . . . 19
2 Clustering results . . . . . . . . . . . . . . . . . . . . . . . . . . . . 26
3 Comparison of different BESS products . . . . . . . . . . . . . . . . 51
4 Current and expected utility-scale battery storage application mar-
ket share [7] . . . . . . . . . . . . . . . . . . . . . . . . . . . . . . . 57
5 Dimensions of 106 location problems . . . . . . . . . . . . . . . . . 70
6 The Spanish electrical system demand evolution [8] . . . . . . . . . 74
7 Parameter values obtained throughout the study . . . . . . . . . . . 77
8 Parameter values assumed . . . . . . . . . . . . . . . . . . . . . . . 77
9 Locations with different Pmaxl . . . . . . . . . . . . . . . . . . . . . 78
10 Different optimization problem vastness . . . . . . . . . . . . . . . . 80
11 Energy arbitrage problem results (5 locations) . . . . . . . . . . . . 81
12 Secondary reserve market problem results (5 locations) . . . . . . . 82
13 EV problem results (5 locations) . . . . . . . . . . . . . . . . . . . . 82
14 T&D and outage problem results (5 locations) . . . . . . . . . . . . 83
15 Comparison of results . . . . . . . . . . . . . . . . . . . . . . . . . . 84
16 Energy arbitrage problem results (sorted ascending by IPP) . . . . 100
17 Secondary reserve market problem results (sorted ascending by IPP) 102
18 Electric vehicle problem results (sorted descending by TPP per EV) 104
19 T&D deferral and outage problem results . . . . . . . . . . . . . . . 106
20 Cash flow demonstration of “Location-23” investment problem . . . 108

7 M. Sisovs, “Distributed BESS in Retail Electricity Market”
List of AbbreviationsACER Agency for the Cooperation of Energy Regulators
ACF Accumulated cash flow
AGC Automatic generation control
ARMA Autoregressive-moving-average
BESS Battery energy storage systems
BMS Battery management system
CAES Compressed-air energy storage
CAPEX Capital Expenditure
CECOEL Electricity Control Center
CECORE Back-up Electricity Control Center
CES Community energy storage
CO2 Carbon-dioxide
CSV Comma-separated values
CUPS Universal code of supply point
DAM Day-ahead market
DES Distributed energy resources
DoD Depth-of-discharge
DSO Distribution system operator
DSRE Decremental secondary reserve energy
EMS Energy managements systems
ENTSO-E European Network of Transmission System Operators in Europe
EOL End of life
ESS Energy storage systems
EU European Union
EV Electric vehicle
IDM Intra-day market
IPP Investment payback period

M. Sisovs, “Distributed BESS in Retail Electricity Market” 8
IRENA The International Reneable Energy Agency
ISRE Incremental secondary reserve energy
Li-ion Lithium-ion
LV Low-voltage
MILP Mixed-integer linear programming
NPV Net-present value
OMIE Spanish electricity market operator
PHES Pumped-hydro energy storage
PCS Power conversion system
PV Photo-voltaic
R&D Research and development
RCP Shared Peninsular Regulation
REE Red Electrica de Espana
ROI Return of investment
RTE Round-trip efficiency
SAIDI System Average Interruption Duration Index
SMC System marginal cost
SOC State-of-charge
SQL Structured query language
SRM Secondary regulation market
SU Storage unit
T&D Transmission and distribution
TPP Trading period profit
TSO Transmission system operator
V2G Vehicle-to-grid
WCSS Within-cluster sum of squares

9 M. Sisovs, “Distributed BESS in Retail Electricity Market”
1 Introduction
The concept of Smart Grids involves wide range of developments, innovations
and incentives in order to transform current energy systems towards intelligent,
efficient and ecological utilization.
A part of this transformation is referred to power systems’ decentralization,
which is gaining sufficient importance [9] with tremendous growth of renewable
energy [10]. Such decentralization, or distribution of energy resources adds to
sustainability, specifically: reducing congestion of transmission network, providing
distributed resources for grid management, electrifying remote areas and reducing
CO2 emissions in centralised units [9].
On the other hand, distributed energy resources (DES) are introducing new
challenges for existing system topologies. Operation and control are required to
be similarly distributed, therefore, larger number of interconnected energy man-
agement systems (EMS) has to be established. Luckily, technological advances in
communication systems are boosting, thus being able to cope with the majority
of challenges [11].
Energy storage is crucial technology in the scope of Smart Grids, offering ex-
tended list of services for all elements of power system: from generation to con-
sumption [12]. Limited electricity storage opportunities oblige maintaining con-
stant balance between production and consumption.
However, developing storage mechanisms is a key tool on the way towards
flexible generation. In such way, the electricity demand may be solely covered by
stored energy from zero-“generation-cost” resources, such as wind and sun.
Energy storage systems (ESS) is an important driver and contributor to the
evolution of DES for three main reasons. Firstly, renewable generation units, that
require storage support, are normally placed in decentralized areas. Secondly,
long-distance high-power transmission is subject to large losses, whereas storage
allows reducing line congestion, exceeding capacities of installed systems. Thirdly,
distributed energy storage will play a crucial role in grid support.
Taking into account mentioned above, the goal of this master thesis is to per-
form a study on feasibility of the distributed battery energy storage system (BESS)
under defined technical, economic, geographical and regulatory conditions.

M. Sisovs, “Distributed BESS in Retail Electricity Market” 10
1.1 Description of the Problem
In order to achieve the above-mentioned goal and perform a study, it has been
decided to optimize the operation of batteries in distributed network by creating
mathematical optimization model with defined operational conditions. Model has
to input the result of analysing load data, which were provided by Minsait. For un-
derstanding the topic, extensive problems from different areas must be addressed,
when talking about storage implementation.
Energy policies in Spain are opposing small/medium storage unit installations
on the distribution and consumption levels [13], but key energy companies are
curious about the potential of this emerging technology, which in perspective may
positively affect their revenues.
Besides, this topic gets of a high interest since many studies are contributing
to the effectiveness of BESS and forecasting substantial decrease in the costs of
batteries, for example [14].
Modern BESS provide a broad spectrum of energy services and may be dis-
tributed along whole power system, i.e. from generation to consumption. In gener-
ation section, main applications are renewable energy capacity firming, smoothing
and peak-shaving. Transmission systems are provided by ancillary services and fre-
quency control for congestion relief and grid stability issues. BESS may support
the distribution system performing load management, peak-shaving and voltage
control. Finally, for local energy management, time-shifting and local photovoltaic
(PV) generation support, batteries are installed at the consumption level [5].
In Spain, electricity transmission and distribution companies are in charge
of the transportation of power to designated customers, and are responsible for
technical conditions and safety of the grid. Retail energy companies, on the other
hand, are solely responsible for billing the customers, or better said, re-selling the
energy bought from electricity markets [15], providing that in accordance with
bilateral contracts.
Electricity spot market defines the price per unit of energy for every hour,
taking into account several factors, for example, system load, renewable generation,
etc. [15] An example of electricity market daily price distribution is shown in
Figure 1.

11 M. Sisovs, “Distributed BESS in Retail Electricity Market”
Figure 1: Electricity market prices on June 1, 2014 [1]
Local consumers with installed smart meters are capable of providing real-time
data of their hourly consumption. This information may play an important role
in storage management if interpreted and analysed correctly (both in terms of
accuracy and time-efficiency).
As being said, in spot markets prices of energy vary extensively throughout the
day (Figure 1), thus giving an opportunity for BESS-owning companies to store
cheap power and to sell it when the price is on its peak.
Additionally, such institutions may participate in grid stability services, that
may be provided by BESS, such as, reserve capacity or voltage regulation, gaining
extra profits [5].
1.2 Background and Recent Research
As stated before, there are many studies developed by researchers from dif-
ferent energy industries and business sectors regarding technical and economic
performance of energy storage [16, 17, 18, 19].
However, every study or project related to the battery storage is subject to
local regulations, configuration of given electrical grid and storage technology.
Besides, contributors to mentioned studies inevitably have to deal with estimations

M. Sisovs, “Distributed BESS in Retail Electricity Market” 12
regarding operation conditions and economic figures. Hence, it is not a surprise
that performed investigations lead to diverse conclusions for particular examples.
When addressing data analysis, existing papers and publications regarding big
data from smart meters are of a major importance for working with historical
information of electrical load and electricity market prices.
1.2.1 Battery Energy Storage
For energy storage being a part of the evolving and rapidly-developing tech-
nologies, it is important to follow the most up-to-date publications and researches.
That being said, in fast-growing technology and with plummeting prices, the infor-
mation dated more than 5-6 years ago may become misleading or of little validity.
Nevertheless, the unique value and tremendous potential of battery storage
systems is a general message of the majority of researchers.
For instance, The International Renewable Energy Agency (IRENA) had pub-
lished a report on battery storage in 2015 [5], which claims “storage may be es-
sential to integrate reliably power generated by renewables”, as well as provide
frequency support for the grid and “make variable renewables more dispatchable”.
Besides, the report emphasises the potential flexibility of battery storage, which is
to a large extent important in reliability of the system.
The scope of papers [17, 18, 20, 21] discusses the state of development of partic-
ular technologies, pointing out the applicability of each for specific energy service.
Advantages and drawbacks are fairly evaluated, giving sufficient knowledge for
defining specific requirements for a research project.
Although only exceptional research papers and articles provide technical infor-
mation and prices for specific models; in most cases this information is confidential
and is subject to particular project conditions, restrictions and regulations. How-
ever, some manufacturers [22, 23] have limited technical data of their batteries
available publicly.
Talking generally, in almost 100% of cases, the battery design is dependent
on the application, and the storage manufacturer is unlikely to produce a certain
capacity battery for general purposes. This barrier leads to large variations in cost
per kWh among cost-analysis publications. Apart from that, the prediction of cost

13 M. Sisovs, “Distributed BESS in Retail Electricity Market”
reduction with the technology development is also hard to estimate.
One particular publication - “Electricity Storage Handbook” [21] - gives a de-
tailed cost-estimation depending on application areas, storage size and manufac-
turer (the latter are remained anonymous).
More recent report by “Lazard” [14], published in 2015, provides a comparison
of capital costs for various use cases and technology combinations, including pro-
jected/expected capital cost declines. The data, presented in the paper, is based
on the information, collected from a survey of industry participants.
1.2.2 Optimal Operation
Despite the positive tendencies in battery storage, the study [17] had concluded
that “profits from energy arbitrage are insufficient to achieve capital cost recovery”
without providing other services.
The community energy storage (CES) performance report [18] estimated a
levelized cost of battery that could justify the investment, however the actual cost
of battery was almost three times higher.
Another study conducted regarding CES [16] had been able to develop the
gradient-based heuristic optimization algorithm for calculating the optimal charg-
ing and discharging schedule. Author points out the importance of marginal elec-
tricity price, which significantly affected CES profits caused by small derivations,
whilst the impact of feeder losses on profitability was considered “rather small”.
The work in [19] presents a mathematical optimization model for BESS, pro-
viding services of energy arbitrage and ancillary within an operating wind power
plant, resulting in a 10-year investment payback period, whereas over a half of
total profit was coming from trading in secondary reserve market, i.e. services
other than energy time-shifting.
1.2.3 Data Analysis
Consumption data importance is essential for electricity providers, because
revealed and analysed information may affect positively their business processes.
A research paper [24] underlines the central importance of data mining tech-
nologies for the development of future Smart Grids; and along with other publi-

M. Sisovs, “Distributed BESS in Retail Electricity Market” 14
cation [25] proposes a clustering method for grouping consumers with similar load
profiles. Pre-clustering stage involves creating clustering scenarios, that distin-
guish the consumption in winter or summer, during working week or holidays.
Another research paper [26] claims segmentation of load profiles of electricity
consumption “should be characterized through the socio-demographic factors, like
household size, income and employment status and the respective equipment with
electric appliances and new technologies”. However, in most cases, such informa-
tion is unavailable due to high privacy standards.
A common method of consumer profile clustering - “k-means” - is applied in a
conference publication [27], where the number of clusters is decided based on the
“elbow” of the graph which relates within-cluster sum of squares with the number
of clusters. The usefulness of this technique is elevated when working with the
cases of unequal number of daily readings or when there are no data for particular
dates (data gaps). Despite this approach showed similar shapes within a cluster,
actual load readings were fairly wide spread.
1.3 Objectives of Study and Main Contributions
The focus of this thesis project is to develop and analyse a study case of an
installation of BESS in a particular city located in Community of Madrid, Spain.
Therefore, a general objective is to optimize the operation of storage systems
under certain conditions, which would take into account the aspects of desired
interpretation and provide fair and discussable result allowing to conclude on the
perspective of a business case.
1.3.1 Mathematical Model Inputs
Smart meter electricity consumption data provided by Minsait have been used
as a basis for the study. In order to transfer this information into a mathematical
model input, data analysis tools have been used, such as, segmentation, interpre-
tation and clustering of different load profiles.
Another task that needs to be completed for providing an input for the math-
ematical model is a battery systems’ benchmark. The way of storage implemen-
tation has to deal with the most recent and up-to-date information, despite the

15 M. Sisovs, “Distributed BESS in Retail Electricity Market”
limited availability of such data. To tackle this issue, fair assumptions with mini-
mized impact on uncertainty have to be made.
The third input is the Iberian electricity market prices that should serve as a
reference for the prices that electricity companies pay for the power they distribute.
The variability of these prices is playing a key role in time-shifting services of BESS.
As most studies claim that time-shifting services are insufficient for cost recov-
ery [16, 17, 18], additional inputs for a range of optional services may be required.
These services, mainly, are: reserve outage capacity, T&D (transmission & distri-
bution) investment deferral, grid stability.
1.3.2 Mathematical Model Development
Mathematical model must represent electrical and economic relations between
the elements in the system. Such are described in terms of a set of linear equations,
parameters, decision variables and their limits. System design may vary depending
on the optimization scenario and desired output. For example: one may consider
operating batteries in community (small) or distribution grid (larger) scale; or
participating only in desired range of services.
Once defined, the optimization problem is created by stating objective function
and constraints which the optimization is subject to. The goal is to maximize
the profit or to minimize the costs and to output the optimal charge/discharge
schedule, which would comply with mentioned conditions.
Ultimately, for the purpose of addressing particular problem from different
angles, several optimization problems should be formulated, describing different
system and operation conditions, maintaining same goal of maximizing profits or
minimizing costs - the most important measures of feasibility.
1.3.3 Post-optimization Analysis
Once obtained the results of the optimization, it is necessary to identify and
evaluate the main sources of expenses and incomes, thus discussing the opportu-
nities of modifications. The modifications may involve variations in the battery
units, their operation conditions, i.e. increasing/decreasing and combining a cer-
tain number of available energy services.

M. Sisovs, “Distributed BESS in Retail Electricity Market” 16
Post-optimization analysis implies brief economic overview of resolved prob-
lems, leading to conclusion of project feasibility. With the guidance of Minsait
as a business consulting institution, economic analysis is supplied by extended
comments on a potential of business case.
1.4 Motivation
Smart electrical systems (or Smart Grids) is a global challenge for electrical
engineering industry, that aims to reshape the existing structure towards a sus-
tainable, flexible and environmental-friendly way. Finite energy resources and
massive impact of CO2 push towards renewable sources, thus sufficiently decen-
tralising generation.
A study of BESS is of a special interest since being related to several adjacent
electrical engineering fields. Briefly described as follows, these areas make a unique
combination of knowledge, additionally allowing giving a broader outlook on Smart
Grid challenges. In that way, a student can understand the technical and economic
state of development of Smart Grid and learn to approach given problems from
different angles.
Analysing smart meter data allows understanding of behaviour of different type
of consumers, the impact of social-economic, ageing or ambient conditions. The
billing technologies of electricity retail companies help one to get an overview of
their cash flows and evaluate the profitability of any alterations, such as installation
of BESS.
Power system analysis includes technical characteristics of the network, its
capabilities and limitations. Implementing BESS in low-voltage or medium-voltage
networks allows providing different services and has to be evaluated and regulated
corresponding to respective grid stability norms.
On the other hand, the development of optimal dispatch for power plant or
charge/discharge schedule for BESS is resolved by energy planning and optimiza-
tion. Whilst real-time models are stochastic, involving high degree of complexity,
a deterministic programming is preferable when working with historical data. The
trade-off between accuracy and computational time is an important issue of opti-
mization.

17 M. Sisovs, “Distributed BESS in Retail Electricity Market”
Finally, an insight to the current market status of BESS is good measure to
stay up-to-date with the emerging sector of energy storage (in parallel with many
other sectors).
In conclusion, developed project is of an exceptional interest. That being
proved by the range of topics covered: electricity markets, smart meter data anal-
ysis, optimization, BESS technology; and by the orientation to business side of
developing sustainable solutions for Smart Grids.

M. Sisovs, “Distributed BESS in Retail Electricity Market” 18
2 Smart Meter Data Analysis
2.1 Overview and Understanding
A common approach of storing big data is to do so in CSV-files (Comma-
Separated Values). For project development of the potential business case, Minsait
provided 3,37 GB of different CSVs and SQL (Structured Query Language) relation
tables. R-Studio software [28] has been used throughout all the stages of data
analysis and creation of required inputs for mathematical model.
Initial categorisation of available information is as follows: smart meter read-
ings of hourly consumption, ambient temperature data, local calendar of national
and public holidays. Subsequently, smart meter readings are separated into nu-
meric power measurements and applied information, for instance: contracted
power, location, zone codes, etc. Consumers’ geographical distribution remains
in the range of a city within Community of Madrid, Spain.
The data consist of electrical load units that are supplied with electricity by
two Spanish retail companies. For confidentiality sake, those companies from now
on shall be referred as “RC1” and “RC2”, corresponding to “Retail Company 1”
and “Retail Company 2”, respectively.
Each load unit is adjacent to a smart meter, that has a unique identification
number - CUPS (Codigo Universal de Punto de Suministro1) - which corresponds
to one installation.
The initial overview of the available data is presented in Tab. 1.
Data analysis has been applied in order to identify and produce necessary
outputs, according to the objectives of the study. In this case, the goal is to
obtain a range of electricity consumption profiles, distributed geographically.
2.2 Initial Steps
It may occur that data provided by clients of consultancy companies tend to
be incomplete, unstructured or having irrelevant to the problem information. As
a data scientist, one requires to address this challenge, when creating the outputs
of his work by proposing missing value replacement or some assumptions.
1Universal Code of Point of Supply.

19 M. Sisovs, “Distributed BESS in Retail Electricity Market”
Table 1: Initial data overview
“RC1” “RC2”
MeasurementsFile size 2,28 GB 0,98 GB
Num. of observations 20 249 948 19 312 749Num. of meters 6379 12110
Date range2013/12/11 2013/12/23
to 2014/06/29 to 2014/07/01Days observed 201 160
Applied InformationFile size 869 KB 2074 KB
Contracted power 1,1 - 9,9 kW 0,345 - 14,5 kWNum. of meters 6465 9073
Num. of geographical zones 106 1 110
This step involves an overview of the data available and explains the initial
solutions working with data.
The key output for building load profiles is electricity consumption, hence, the
major attention is paid to smart meter readings.
First of all, after studying the data, it had been discovered that energy con-
sumption measurements of retail company 2 (“RC2”) did not stated their matching
CUPS, but rather the code of meter itself. This confusion does not allow perform-
ing extended analysis in relation to the consumer information, because no pattern
to match consumption with CUPS had been found. Thus, “RC2” data become
irrelevant to the study, and are disregarded.
The distribution of smart meter measurements is not monotonous, as specified
in Tab. 1, which means it is represented by different amount of measurements
per day. The availability of this data also is limited. Such data incompleteness is
displayed in Figure 2.
It is important to observe that the number of measurements is high in the
period from May to July, but rest of the time scale is deeply affected by gaps in
measurements. Up to this point, it is unknown whether these gaps follow a pattern
or not, but this definitely restricts from using direct measurements in optimization
for a particular customer during available period of time (Figure 2).

M. Sisovs, “Distributed BESS in Retail Electricity Market” 20
Figure 2: Number of daily measurements from “RC1” available throughout theperiod
When plotting the daily consumption of one random customer, the gaps are
observable from Figure 3. Here, a sufficient lack of measurements is related to the
time interval between April and May.
Figure 3: Daily measurements of random consumer

21 M. Sisovs, “Distributed BESS in Retail Electricity Market”
This issue calls for a solution in terms of data recuperation or approximation,
since in given conditions it would be problematic to use actual consumption data.
Techniques of gap-filling are severely complex and, thus, are considered out of the
scope of this work. Hence, a solution of approximation or generalisation is needed.
Further data processing involves several steps of linking, categorizing and clas-
sification of the information.
When reading the data, some measurements with unnaturally high consump-
tion were spotted. Eventually, in order to reduce the variance and standard de-
viation, those readings were removed, so were the uncharacteristic measurements
with zero power consumption. After having made these corrections, average cus-
tomer load curve with its standard deviation has been constructed in Figure 4.
This consumption pattern is build by plotting 24 average hourly readings of all
available data from “RC1”.
Figure 4: Average profile and its standard deviation of all “RC1” data
Analytically, electrical load pattern for average customer has low consumption
during the night hours and reaches its peaks in the morning and in the evening.
The plot, demonstrated in Figure 4, is scattered for the general average of the
scope of available “RC1” data into 24-hour profile. Standard deviation is quite
high which may conclude on high dispersion of the data. Such issue calls for
heuristic aggrupation solutions.
Indeed, the load is generally low in the night, whereas two local peaks are
reached at hour 15 and hour 22. To validate these peaks, the figure of average

M. Sisovs, “Distributed BESS in Retail Electricity Market” 22
Figure 5: Iberian pen. average LV consumption and its standard deviation [2]
consumption during first six months of 2014 is presented in Figure 5. This figure
has been extracted from REE (Red Electrica de Espana) on-line informational
system.
As may be observed, the LV (low-voltage) grid average consumption in se-
lected period of January to July of 2014 demonstrates the strong correlation with
consumer data from Figure 4. Two daily peaks are representative with first one
occurring at hour 13 (Figure 5), whereas the second one takes place during hour
21. The fact that both graphs are identified with two consumption peaks: after-
noon and late evening; and that they repeat their corresponding incremental and
decremental phases allows validation and confirms the initial steps of analysis had
been performed correctly.
2.3 Segmentation & Clustering
It has been claimed, that sufficient gaps in data are problematic for creation of
usable load profile outputs. This leads to the need of creating several load profiles
and relating each consumer to one of existing patterns. This step may be divided
in three stages:
• Year season segmentation: winter or summer;

23 M. Sisovs, “Distributed BESS in Retail Electricity Market”
• Weekday segmentation: working day, Saturday or Sunday2;
• Load profile generation: number of different profiles, each consisting of 24-
hour vectors.
Figure 6: Data segmentation and clustering
Explanatory scheme of data segmentation and clustering is visualised in Fig-
ure 6.
As mentioned in [26], distinguishing between summer and winter consumption
profiles is of a great importance. In winter season, the load is noticeably higher
due to colder weather conditions, whereas during summer it is considerably lower,
except the peak of the season when, taking into account Spanish climate, air
conditioning is used extensively.
Another important point is to divide the general profile in perspective of week-
days. Generally, consumption varies largely between working days (when people
usually go to work) and holidays (Saturdays, Sundays and public ones) [2]. For
sake of higher accuracy, one may introduce further assumptions. In the scope of
this thesis, three weekday load profiles are assumed: working day (from Monday
2Public holidays are considered to be related to Sunday profile

M. Sisovs, “Distributed BESS in Retail Electricity Market” 24
to Friday), Saturday and Sunday. This choice has been made based on computing
the Euclidean distance between means of each day. Since the largest distances
were obtained between mentioned types of day, these profiles were selected. The
Euclidean distance formula between two n-dimensional vectors p and q is:
d(q, p) =
√√√√ n∑i=1
(qi − pi)2 (1)
Having the data segmented for seasonal and weekday sub-units, one is required
to apply clustering technique, which in this case is “k-means” method. It should
be applied to each one of the six blocks in Figure 6.
“k-means” is a common approach for vector grouping and data partitioning.
This method of quantization aims to partition n vectors into k clusters, in which
each observation belongs to the cluster with the nearest mean.
In a given set of observations, each vector is a d -dimensional vector. For the
study case, d=24, because one vector corresponds to 24 coordinates of daily load
measurement of one smart meter (early referred as CUPS). The partitioning into
k sets is done in such way so it would minimize the total within-cluster sum of
squares (WCSS). In mathematical terms, that is described as in Eq. 2.
minS
k∑i=1
∑x∈Si
||x− µi||2 (2)
where:
(x1, x2, . . . , xn) - a set of observations;
k - number of clusters;
S = {S1, S2, . . . , Sk} - sets;
µi - the mean of points in Si.
The “k-means” clustering method relies on a random starting situation and
requires the number of clusters as an input. Thus, the decision has to be made
regarding the number of clusters k preferred. For that, the relation of WCSS (Eq.
2) to the number of clusters is created for range of k and plotted. The final decision
is then taken based on the graph “elbow”, i.e. such number of clusters k, that

25 M. Sisovs, “Distributed BESS in Retail Electricity Market”
introducing additional one: k+ 1, would give a WCSS reduction with lowest ratio
towards the one of adding the k-th. Built-in function provides a good reasonable
heuristic solution by building the minimum spanning tree for a number of nodes,
however is limited by decided number of iterations and hence, with some degree
of certainty, converge in local minimum WCSS rather than in global.
R-Studio [28] provides developed function for performing “k-means” clustering
on a data matrix. The inputs for this function are:
• Data matrix
• Number of clusters k
• Maximum number of iterations
• Used algorithm
Correspondingly, six data matrices with segmented data, along with k=8, a
maximum of 200 iterations and a default algorithm chosen by R-Studio have been
selected as function inputs. The algorithm of Hartigan and Wong [29] is used by
default.
2.3.1 Results
As a result of clustering, for every segmentation block, 6379 points of supply
(consumers) are grouped to 8 clusters with each cluster having its average rep-
resentative vector of 24 coordinates. Each clustered vector maintains its CUPS
identification name for further relation to its corresponding geographical zone.
This relation is relevant for further stage of the project.
A brief summarizing table is given in Tab. 2. WCSS represents objective
function of Eq. (2), i.e. sum of distance functions (Eq. (1)) of each vector in
the cluster to its center. Additionally, the size of largest and smallest clusters are
given.
Eq. (3) calculates relative average root-mean square derivation per one mea-
surements of n observations within their clusters, expressing the percentage by
which average point in a d-dimensional vector is different from its cluster center.
That index verifies WCSS numbers in Tab. 2 and results in deviations of 32,18

M. Sisovs, “Distributed BESS in Retail Electricity Market” 26
Table 2: Clustering results
ε, % WCSS Largest Smallest
WinterWeekday 6,01 1,74 × 10¹⁰ 3538 41Saturday 6,4 1,96 × 10¹⁰ 2409 12Sunday 7,6 1,96 × 10¹⁰ 2279 115
SummerWeekday 5,92 3,71 × 10⁹ 1622 33Saturday 6,64 4,70 × 10⁹ 2170 29Sunday 6,94 5,08 × 10⁹ 2018 36
- 74,61 Wh/h for within-cluster measurements. These numbers are quite large.
Despite increasing the number of cluster k might reduce the error, additional ex-
periments showed higher values of k have rather small impact on reducing WCSS.
ε =
√WCSS
n∗ 1
d ∗ Lmean∗ 100% (3)
where:
n - number of observations;
d - clustered vector dimension (d = 24);
Lmean - average load measurement among certain group (winter, summer,
working day, etc.) of consumers of “RC1”.
WCSS is effectively larger when clustering winter consumption profiles due to
higher dispersion in load: during winter electrical heating is used actively, lighting
necessity hours are extended and generally, the consumption of other devices is
higher, since consumers spend more time at home because of cold weather condi-
tions.
Also, during the weekdays load is more monotonous since a general labour
schedule is followed by the population, whilst weekend consumption is wider dis-
persed.
Figs. 7 - 12 display the clustering results, showing the centric vectors and
cluster size of each. The curves that are represented by larger number of consumer
profiles are selected to be bolder. Moreover, these curves are fairly correlated to
the all-average consumer in Figure 4 and to LV-grid demand pattern in Figure 5.

27 M. Sisovs, “Distributed BESS in Retail Electricity Market”
Figure 7: Eight clusters of winter weekday profile
Figure 8: Eight clusters of winter Saturday profile
In the range of mentioned figures, the most representative clusters (largest
ones) are repeating the shape of each other, i.e. are more or less uniform, however
are differentiated by the absolute value of hourly load. To be more clearer, in
Figure 7, cluster 3 (green), cluster 5 (magenta) and cluster 1 (black) follow similar
pattern, but are distinguished by nominal Wh/h values. This case may resemble
household consumption units with different amount of inhabitants, for instance:
one, two and three. Typically, with larger occupation, electricity consumption per
household rises, but such per person decreases [26].
Few consumers belong to the clusters with exceptional consumption curves.

M. Sisovs, “Distributed BESS in Retail Electricity Market” 28
Figure 9: Eight clusters of winter Sunday profile
Figure 10: Eight clusters of summer weekday profile
Those could be clusters 2 (red) and 8 (grey) in Figure 7, or cluster 1 (black), 4
(blue) and 5 (magenta) in Figure 8, etc. The nature of such variability is com-
plicated to explain. However, it must be stated that the data information files
claim that not only residential loads are included in datasets, hence, we accept al-
ternative load patterns, which are determined by the necessities of corresponding
unities. The analysis of these necessities, though, is disregarded due to relatively
small amount of consumers actually following those patterns.

29 M. Sisovs, “Distributed BESS in Retail Electricity Market”
Figure 11: Eight clusters of summer Saturday profile
Figure 12: Eight clusters of summer Sunday profile
2.4 Applied Information Analysis
As a matter of fact, the study targets to perform an optimization on a limited
geographic region. Identification of geographic distribution of consumers is done
according to applied information of “RC1”, specifically, locational info (Tab. 1).
Smart meter data were complemented by additional CSVs, which consist of
information on contracted power, geographical location, ambient temperature, etc.
Contracted power information, given in Tab. 1, is useful for identifying residen-
tial or industrial consumer, as far as their type of contract with electricity retailer.
According to mentioned value, customer will pay a capacity tariff as a part of

M. Sisovs, “Distributed BESS in Retail Electricity Market” 30
their bill. Such tariff may be briefly described as a payment for opportunity to
consume. Therefore, in Spain, consumers with contracted power less than 10 kW
are connected to LV grid (230/400 V). All “RC1” customers’ contracted power is
below 10 kW.
Figure 13: Example of concentrator location with number of units
The desired load profiles require the consumers to be distributed along a certain
geographical area. The study case and the data are related to a city in Spain.
Besides that, each CUPS is represented by one out of 106 (Tab. 1) names of
data concentrators. Such unit serves as a common metering collection point or a
layer for processing adjacent smart meters. Their exact geographical location is
unknown, but can be estimated since concentrator point is named after an actual
street where such is placed.
In a similar manner to Figure 13, 106 locations were estimated and a number
of smart meters, attached to each location, has been displayed. Each point on the
map, further on, will be called a “neighbourhood” or a location and will serve as
an input for mathematical model.
2.5 Output Creation
Typically, applied information may serve as a basis for a variety of smart me-
ter analytic algorithms and applications that are widely proposed in literature

31 M. Sisovs, “Distributed BESS in Retail Electricity Market”
[24, 25, 26]. These techniques may provide a high range of important results.
Their relevance for electricity services companies is hard to be over-estimated, be-
cause the key for a precise load planning and grid maintenance prediction lies in
understanding the consumer.
Some utilities are taking the initiatives to provide personalized feedback to
consumers on how to adjust their habits for reducing electricity bills [30] or in-
troducing hourly energy tariffs. Additionally, utility data analytic markets are
growing constantly with advances of digital technologies [31].
This study, though, has been limited with techniques used for data analysis.
Possible improvements may have included load temperature factor removal. This
could have been done applying somewhat linear regression models. Gap avoidance
could have been solved with stochastic estimations, for instance, with ARMA
model.
In conclusion, several statistical data analysis techniques have been applied
with open-source analytic software R-Studio [28]. This resulted in majority of
6379 supply points from initial data of “RC1” have been identified as low-voltage
consumers. Further throughout investigation, by means of “k-means” clustering
their summer, winter, working day, Saturday and Sunday consumption profiles
were assigned to one of eight clusters. Clusters have been selected according to
Euclidean distance equation in Eq. (1).
Geographically, using applied information, a set of concentrator nodes has been
identified. Each one of them is described with a unique name, directed at the
name of the street and with a vector of consumers (CUPS numbers). It then has
been assumed that each specific consumer (CUPS) is following one of eight load
patterns for given season and day of the week, thus leading to a half-year hourly
consumption curve.
Once obtained half-year profile for every CUPS by knowing the cluster it be-
longs to, a complete neighbourhood profile can be calculated. This is done by
summing the load of profiles, belonging to the same location l, resulting in 106 ×4344 array: LNl,t.

M. Sisovs, “Distributed BESS in Retail Electricity Market” 32
3 Electricity Market Analysis
Electricity market is a tool for trading electrical energy between the producers
and consumers. Obviously, the institute of electricity markets has evolved signif-
icantly over the period of its existence. For that reason, the working principle of
that is quite complex.
The uniqueness of such trading is that electricity may not be stored on a large
scale, thus, it has to be consumed at the moment it is generated. Any unbalance
between two terms of generation and consumption causes instability in power
system and increases risks of a range of negative side-effects.
Figure 14: Overview of market operations
Simplified electricity market trading is demonstrated in Figure 14. Fair to
notice, that its functionality varies throughout European countries. The major-
ity of them have surpassed market liberalization, broadening the possibilities for
privately-owned businesses to increase the competition, in such way, increasing the
quality and efficiency of whole system.
3.1 Electricity Market in Spain
In Spain, market liberalization took place in 1997. Since then, many individ-
ual participants are competing in the areas of electricity production, distribution
and retail. However, this market is hugely unbalanced due to only five of these

33 M. Sisovs, “Distributed BESS in Retail Electricity Market”
participants (companies) are in control of 90% of retail consumer market and 60%
of wholesale consumer market [32].
Unless traded between producers and wholesale consumers directly (Figure 14),
producers and resellers are participating in electricity market. This market is
marginal with marginal price determined by most expensive submitted bid that
consumer is willing to accept. Bids are consisting of amount of power (MWh)
players want to sell/buy and a price per unit (e/MWh) they intend to sell/buy it
for. In other words, the final price per unit is set on the intersection of demand
and supply curves. An example of such market equilibrium with SMC (system
marginal cost) defined is shown in Figure 15.
Figure 15: Illustration of optimal dispatch in a simple electricity market [3]
Electricity markets are complex and, as a rule of thumb, are composed of a
range of trading operations, which consist of economic ones, operated by Operador
del Mercado Iberico Espanola (OMIE) [1]; and technical ones, regulated by Span-
ish transmission system operator (TSO) - Red Electrica de Espana. Complete
scheduling and functionality may be observed in Figure 16, which clarifies trading
procedures occurring at certain hours.
Retailers (reseller in Figure 14) neither provide any technical services, nor are
responsible for grid stability; they are in charge of trading, providing a range of
tariffs and, to a final extent, billing their customers.
One of the challenges of electricity retailers is to predict the load of contracted

M. Sisovs, “Distributed BESS in Retail Electricity Market” 34
Figure 16: Electricity market scheduling [2]
consumers, since they have to bid fair amount of energy on day-ahead market
(DAM). Such 24 hourly bids have to be submitted one day before the actual
trading (Figure 16). Uncertainty in planning is compensated in intra-day markets
(IDM), where the prices are noticeably higher, but traded amount of electricity
way lower [1].
BESS is a solution that may tackle mentioned challenge by discharging stored
energy in the hours with high load deviation. In addition to that, storage tech-
nology allows to buy energy at hours with low price and sell to the end-customers
when the price is high - an example of daily DAM prices is shown in Figure 1.
Apart from day-ahead and intra-day trading (Figure 14), there are other elec-
tricity sub-markets for distinct services. Frequency regulation is grid stability
service, which goal is to maintain frequency at regulated level of 50 Hz in Europe,
allowing very small deviations. Frequency regulation service consists of three main
components: primary regulation reacts in milliseconds to seconds; secondary fre-
quency control operates within several minutes; and tertiary extends to hours.
3.2 Related Regulations and Policies
BESS still remains an innovation technology, that has not yet evolved to a
large scale due to its high costs and grid adaptation issues. Governments play sig-
35 M. Sisovs, “Distributed BESS in Retail Electricity Market”
nificant role in technological transfer, for instance: research excellence, innovation
engagement and subsidies for renewable energy are contributing to positive busi-
ness opportunities in electrical storage projects; but limited market competition
and taxation, alternatively, create barriers for sustainable development.
The main European internal electricity market rules are described in Electricity
Directive (directive 2009/72/EC [33]), however storage is not mentioned as a com-
plete market participator. The directive does regulate TSOs and DSOs unbundling
simultaneously with functions of generation and supply.
When it comes to storage, its contribution to system stability is not defined
precisely. Hence, electrical storage systems are often regarded as generation [34].
On the other hand, one of the initiatives, mentioned in [33], regards creation
of ACER (Agency for the Cooperation of Energy Regulators), which developed a
framework for electricity balancing [35], directed by TSOs. Mentioned document
does not restrict any specific technology from balancing operation, thus allowing
utilising storage for such purposes.
Another powerful institution, namely, the European Network of Transmission
System Operators for Electricity (ENTSO-E) in 2014 has finished their develop-
ment of a draft network code for balancing, allowing ESS to provide generation and
consumption balance services. Complementary, standard product for mentioned
services shall “facilitate the participation of energy storage facilities” [36].
Nevertheless, proprietorial issue of storage system, i.e. whether those should
belong to regulated operators or private market ones is undefined, being subject
to local state electricity market politics [34].
Indisputably, European Union policies maintain little power in comparison to
regulations of particular states. In majority of periods of time, member states are
self-sustainable with relatively small amount of power being traded on interna-
tional level. Despite that, few internal regulations support integration of storage
technologies [34].
For instance, in Italy both TSOs and DSOs may build and operate BESS
under certain conditions. These rules are defined in [37], according to the plan of
advances integration of energy storage in national network.
Irish TSO, is about to lauch a program in 2017 that would allow energy storage
owners to participate in regulatory markets by submitting respective bids [38].

M. Sisovs, “Distributed BESS in Retail Electricity Market” 36
3.2.1 Energy Storage Policies in Spain
Current Spanish electricity storage regulation is of a major interest since that
allows concluding on applicability and feasibility of solutions proposed in this mas-
ter thesis.
Spanish electrical system has suffered a major increase in renewable energies
during last decades thanks to positive incentives from government adapting wind
and solar energy and to EU 2020 targets [13]. At the same time, large state-owned
coal and natural gas producers are fighting to protect their market, providing cheap
power from their power plants. This collision results in Spanish electricity market
being redundant, which leads to negative conditions for storage technologies.
[39] collects and discusses major keynotes from regulations about adaptability
of storage systems in various parts of grid both from technical and economic points
of view.
Specifically, it claims electricity and renewable energy regulatory framework
does not mention any storage technologies, apart from pumped-hydro energy stor-
age (PHES) and thermal storage in thermo-electric solar power plants. It describes
them as special regime units, which may be considered as generation or consump-
tion units, depending on operation state [39].
Articles 23-24 of royal decree 6/2010 [40] mention including system load man-
ager participants, which would provide services of electrical charging for accelerat-
ing integration of electric vehicles. Those could be consumers, capable of supplying
EV charging and storage services for better management of electric system.
Royal decree, identified as 1699/2011 [41], that regulates connection to the
grid of low-power units of generation claims neither other generation nor storage
units may be installed in electric circuit at any point before measurement equip-
ment, than authorised one. That being said, legislation opposes low-power storage
(commercial or distributed one) [39].
Additionally, article in [42] discusses the angle of affection of governmental
policies on residential storage installations. Specifically, “battery owners are not
allowed to reduce their contracted power” P contr, which with a high degree of
certainty will keep the electricity bills at current level, since largest share of that
is a capacity payment.

37 M. Sisovs, “Distributed BESS in Retail Electricity Market”
On top of that, battery users will be a subject to several charges and in order
to sell stored energy to the market, such units must be registered as respective
businesses.
Further on, specific notification regarding different services will de explained:
• Energy Arbitrage: Energy storage is not specifically represented in regula-
tion of electricity markets, however, as mentioned before, the participation
requires to be registered as an energy trader. Also, such trader at each hour
must maintain a positive trading balance, if being a seller, or negative in
the case of buyer [39]. This adds to complexity of using other storage than
PHES or “thermo”, for which special operating conditions are allowed. The
differences between day-ahead market (DAM) prices and volatility of storage
are crucial for its feasibility.
• Regulatory Services: Whilst primary regulation is mandatory for all gener-
ation units, secondary regulation participants must comply with a range of
technical requirements, specifically, communication to AGC and real-time
response capability. Additionally, for each special regime production unit,
the sum of all bid blocks must be at least 5 MW [43]. Secondary reserves are
organized into control zones consisting of groups of AGC enabled generat-
ing units and their dispatch is controlled by the Shared Peninsular Regula-
tion (RCP), the Control Center (CECOEL), and the Backup Control Center
(CECORE) when necessary [1].
• T&D Cost Deferral: Even though being limited, compensations for high
efficiency figures are available for electricity distributors. Moreover, the law
does not restrict distribution system operators from using battery storage
for postponing grid maintenance investments - obviously - under conditions
of being acceptable by the main grid and system.
• Minimization of outages: In case of TSO has to limit sufficiently the produc-
tion of power plants, they may justify an installation of storage equipment
until the network is upgraded to necessary operating conditions [39].
Other services, for instance: voltage control, black-start, demand response; do

M. Sisovs, “Distributed BESS in Retail Electricity Market” 38
not mention storage technologies as a potential service provider in regulations and
rules of system operation.
3.3 Electricity Market Historical Data
3.3.1 Day-Ahead Market
This subsection deals with study relevant electricity market data overview and
analysis.
It has been noted before from Figure 5 that average electrical load curve in
Spain peaks at hours 13-14 in the afternoon and at hours 21-22 in the late evening.
Since electricity trading is a real-time process (except for relatively low volumes
of storage), the day-ahead market prices may be expected to peak at same instants
due to market rules. Annual price statistics are illustrated in Figure 17.
Figure 17: All hourly DAM prices, year 2014 [1]
The curve pattern is slightly altered from Figure 5 since load data referred only
to low-voltage consumers. Highlighted peaks may be observable at hours 10, 12
and 21. For the sake of having more readable perspective on average prices, such
daily curve is demonstrated in Figure 18.
Nevertheless, strong correlation between load and price curve remains, thus,
both data are considered valid and appropriate for study case purposes.

39 M. Sisovs, “Distributed BESS in Retail Electricity Market”
Figure 18: Average daily DAM prices, year 2014 [1]
When addressing energy arbitrage feasibility as a service, range of literature
sources [16, 17, 44] emphasize the importance of minimum and maximum price
difference in selected window of time. This gap is crucial due to the buying/selling
strategy of energy arbitrage. Special perspective on DAM prices is required, taking
a closer look at mentioned issue. Figure 19 visualises two daily extremes of prices
in targeted time period of first six months of year 2014 (according to Tab. 1).
It is observable that the variation (in this case: the difference between maxi-
mum and minimum) in DAM prices is noticeably larger during first 90 days. This
period corresponds to winter months of January, February and March. High prices
arise when system demand reaches excessive values - for example, cold weather
provokes increased usage of electric heating.
Low DAM prices are usually explained by exceed of generation. On the contrary
to conventional power plants, which always maintain a certain generation cost due
to burning fuel; renewable energy, like wind and sun, obtain their resources for
free. At some hours with low demand, these generation units become price-setters,
offering price of 0 e/MWh. Figure 20 visualises possible dependence of low-price
occurrence (20a) on high wind power penetration (20b). Winter period, indeed,
seems to complete proposed statement, although deeper research on that question

M. Sisovs, “Distributed BESS in Retail Electricity Market” 40
Figure 19: Daily minimum and maximum DAM prices [1]
is required for more certain conclusions.
Maximum and minimum price difference characterises monetary trading benefit
per unit of energy at a single day - if such unit of energy was bought at instant of
daily lowest DAM price and sold, respectively, at highest.
Daily price variation is better explained in Figure 21 - y-axis units are e/kWh.
In that occasion, a battery with discharge capacity of 50 kW on January 1, if
charged and discharged completely at respective hours, would save 50 kWh x 0.02
e/kWh = 1 e. If battery affords longer discharge time, earnings of following hours
(a) DAM prices: January-June2014
(b) Wind power generation:January-June 2014
Figure 20: Influence of wind energy production on DAM prices [2]

41 M. Sisovs, “Distributed BESS in Retail Electricity Market”
should be added, but those per hour will be decreased.
Figure 21: Daily maximum DAM price variation values [1]
Due to the fact, that every battery storage unit is described with somewhat
value of cycle cost (Eq. (4)), it should be lower than potential earnings from full
cycle trading for profitable operation. Referring to mentioned example of 50 kW
battery and assuming its discharge time is 1 hour (i.e. energy capacity equals
50 kWh), the cycle cost must be less than 1e to gain profits on January 1. For
different batteries, this calculation becomes slightly more complex, since multi-
hour discharge and round-trip efficiency must be taken into account. Nevertheless,
used approach is a good measure to estimate battery’s applicability for arbitrage.
Further sections will mention this approach to compare several storage products.
3.3.2 Secondary Regulation Market
Another point of interest from the study’s perspective is secondary regulation
market operation, hence, that obliges to perform an overview of related market
data.
Secondary regulation is used for frequency control and for balancing system
generation and load. Since these operations are directly related to power system
stability and control, they are gestured by TSO.

M. Sisovs, “Distributed BESS in Retail Electricity Market” 42
Secondary regulation service payment contains two components, referred to
market: availability (secondary reserve) and use (energy) [39].
What can be interpreted as availability is essentially the capacity to either
increase or decrease production in a generating unit according to Automatic Gen-
eration Control (AGC) signals, hence, battery electrical storage may provide such
service due to possessing both somewhat reserve and not-used discharge capacity
at every instant of time.
Secondary reserve of a single generation unit3 is the maximum value of variation
of power, within which it is capable of modifying its generation, according to the
response signal, indicated by the technical requirements of TSO [43].
Figure 22: Average secondary reserve market price [2]
Figure 22 demonstrates average SRM prices for each hour of day. These statis-
tics have been estimated from the data of desired trading period: January 1 - June
30, 2014. There barely is a characteristic pattern for the shape of the curve, since
both reserve and its price depends on specific operation conditions, for instance,
error in demand forecasting, unexpected outages and energy transferred through
interconnections with other systems.
3It says generation unit, because the regulations reflect implementation of SR only in gener-ation units (discussed in Section 3.2.1)

43 M. Sisovs, “Distributed BESS in Retail Electricity Market”
(a) Average energy traded (b) Average energy price
Figure 23: Secondary regulation energy characteristics in the system [2]
It is worth to mention that the upward reserve is always greater than downward
one. This is maintained in order to take into account the possibility of generation
unit failure. The ratio of upward/downward reserves is declared by TSO and is
kept constant [43].
Secondary regulation energy defines amount of energy actually requested by
TSO and traded. Undoubtedly, actual usage is much lower than offered availability
(reserve). Moreover, regulation energy is separated into up-regulation and down-
regulation with individual equilibrium prices. That describes whether energy has
to be injected of withdrawn from the system.
Figure 23 illustrates average traded secondary regulation energy and its average
market price for two terms: incremental (upward) and decremental (downward).
When generation unit provides incremental energy to the system, it gets com-
pensated by market with price λisret times volume of energy supplied. Alternately,
decremental service implies reducing production and may be interpreted as buy-
ing energy from market by generation unit for to a large extent reduced downward
regulation price λdsret .
3.4 Output Creation
Relevant outputs that certainly would be required in mathematical optimiza-
tion of storage system operation have been discussed in this chapter.
Day-ahead market trading is essential for energy arbitrage, thus, historical
prices of related period has been transformed to a problem parameter, namely,

M. Sisovs, “Distributed BESS in Retail Electricity Market” 44
λdamt .
Participation of storage technologies in secondary reserve market is question-
able, but may play significant role in investment justification. Since this service
involves two components of availability and energy, separated into upward and
downward ones, respective prices must be imported. Nomenclature of those is
assigned as λsrmt for secondary reserve market price, λisret for incremental energy
price and λdsret for decremental energy price.
Apart from those parameters, electricity market legislation and functionality
principles should be reflected in constraints and equations. The manner of the
implementation is discussed in consecutive chapters.

45 M. Sisovs, “Distributed BESS in Retail Electricity Market”
4 Battery Energy Storage Systems
Clearly, it is a challenge to perform up-to-date technological and economic out-
look of BESS with high accuracy. Firstly, global energy storage market is surviving
significant changes occurring every year. Secondly, available sources of information
may provide controversial values of battery costs in their surveys, because product
manufacturers maintain confidential pricing politics due to competition.
This chapter aims to give such overview of storage technologies, that would
carry the highest relevance to the study and would somewhat affect conclusions.
4.1 Technological Perspective
This subsection addresses technological aspect of energy storage, emphasizing
batteries; briefly evaluating current market; its tendencies and exampling available
products.
Figure 24: Global installed grid-connected electricity storage capacity (MW) [4]
Nowadays, vast majority of grid-connected storage capacity belongs to PHES,
as observed in Figure 24. Despite huge dominance of one technology, the deploy-
ment of battery storage has suffered a significant increase in recent years [5].
Worldwide energy storage R&D (Research and Development) institutions main-
tain their focus on realising technology cost reduction and improving the perfor-
mance of existing and emerging technologies.
Moreover, government subsidies, research and wide-scale demonstrations are
M. Sisovs, “Distributed BESS in Retail Electricity Market” 46
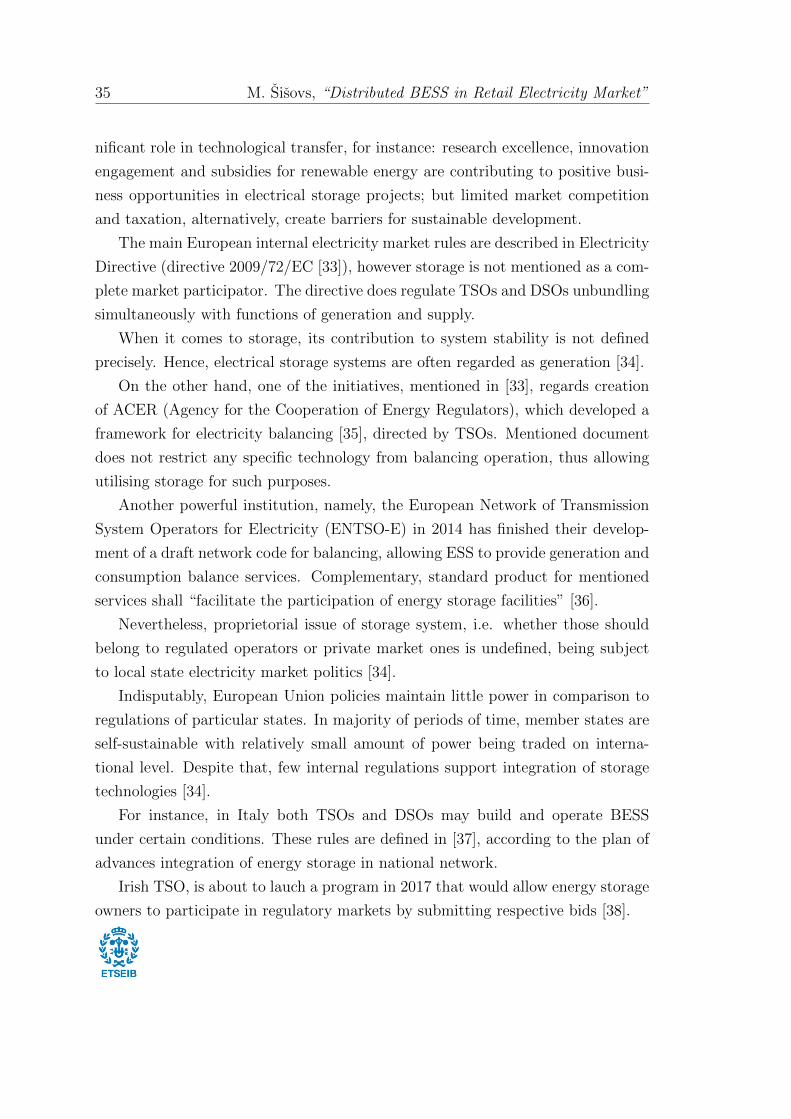
constantly overcoming chains of technical challenges. These factors, along with
cost reduction are expected to drive battery storage to a completely new level
in nearest future. This is expressed in a battery storage development forecast in
Figure 25 (states values for utility-scale storage, excluding residential and PV-
coupled units). Additionally, expected global annual revenue increase for utility-
scale applications is demonstrated.
Figure 25: Worldwide battery storage forecast [5]
Electrical energy storage systems distinguish several physical forms of accumu-
lating power, namely, mechanical, electrochemical, chemical, electrical and ther-
mal. PHES, CAES and flywheel are main representatives of mechanical storage.
Hydrogen fuel cells, possessing high values of efficiencies and low environmental
impact are referred to chemical sub-group. Electrical storage market is supplied
by capacitors and superconducting magnetic coils. Sensible heat storage belongs
to thermal category [45].
Batteries are electrochemical storage units, where chemical reactions create
current and voltage, together transforming into power and supplying the load.
This technology is not new, but, as mentioned previously, in future years it is
expected to occupy the market drastically.
Two primary characteristics of batteries are energy capacity Emax and dis-

47 M. Sisovs, “Distributed BESS in Retail Electricity Market”
charge capacity dmax. All storage technologies may achieve almost any amount of
these by parallel or series connection of units.
Batteries are appropriate for many applications. Their construction time is
roughly around 1 year, which is relatively low in comparison to other technologies.
Apart from that, it is quite flexible in locational issues. However, the disposal or
recycling must be taken into consideration due to existence of toxic materials. Ad-
ditionally, many batteries cannot be discharged completely due to high dependence
of lifetime on the depth-of-discharge (DoD) [45].
This thesis is oriented specifically on batteries, hence, exceptional perspective is
given on its classification, whilst detailed insight to other technologies is considered
to be out of the scope of this thesis.
4.1.1 Battery Types
There are numerous different batteries currently available in the market, and
each technology or manufacturer provide unique performance. Energy capacity of
these batteries range between 1 kWh up to tens of MWh.
Variations in design have led to existence of exceptional amount of products.
Therefore, there is no specific battery design for particular application, rather a
range of factors that affect design specifications.
Battery storage in electricity sector is moving away from sodium-sulphur bat-
teries. The shifting is directed towards lithium-ion and lead-acid technologies,
which may be observed in Figure 26. Li-ion batteries have gained valuable advan-
tages in terms of their characteristics [5].
Sodium-sulphur batteries are required to perform under high temperatures due
to using molten salt as electrolyte. This chemistry has reached its maturity, since
being available in the market since 2003. Those are long-discharge batteries, taking
6 or more hours for complete charge or discharge. Cycle life of sodium-sulphur does
not exceed 3000 cycles. The average estimated cost in 2014 has been, roughly, 530
e/kWh [14, 45, 46].
Lithium-ion batteries, thanks to their high energy density, occupy little space.
They are also suitable for fast-response applications, reacting in milliseconds. Li-
ion batteries maintain high RTE comparing to alternatives, reaching 97 %. More-

M. Sisovs, “Distributed BESS in Retail Electricity Market” 48
Figure 26: Estimated installed battery capacity by type in 2014 [5]
over, technical performance is continuing to improve due to large deployment in
small electronic devices. Among disadvantages it is worth to mention safety, since
cells may easily get overheated and catch fire. Additionally, cycle life is directly
subject to ambient conditions. Bottom average price limit is estimated to be equal
to 485 e/kWh [14, 45, 46].
Advanced lead-acid had been widely usable technology because of relatively
low cost and sufficient maturity since 1980s. Technology still has high demand in
developing countries and emerging markets. Despite that, technical performance
is rather low with short cycle life, slow charging and maintenance issues. Nev-
ertheless, researches are working on a solution to poor performance. Advanced
lead-acid cost ranges from 530 e/kWh [14, 45, 46].
Flow batteries, according to their unique chemistry, are less affected by charge
and discharge, hence, they can be used without severe degradation. On the other
hand, such design remains expensive. Flow batteries optimal storage time ranges
between 2 and 10 hours. Even though they possess small market share nowadays,
they remain a promising long-term solution thanks to large energy capacity. Lower
limit price in 2014 has been approximated to 600 e/kWh [14, 45, 46].

49 M. Sisovs, “Distributed BESS in Retail Electricity Market”
4.2 Proposed Product Solutions
This study focuses on distributed small-scale storage, due to character of con-
sumer load data, grid architecture unavailability and general limitations of the
project, like time-frame. Hence, it is important to propose suitable product so-
lutions, which may be implemented into mathematical model and reflect current
pricing situation. Final solution has been defined to be the community energy stor-
age (CES), where BESS operate within a number of households. A demonstrative
figure of CES with storage units installed on the secondary side of transformer,
may be observed in Figure 27.
Figure 27: Example of CES
Battery storage systems are usually composed of several elements. Previously,
it has been discussed that there is a range of chemistries for design of the bat-
tery. From practical point of view, battery is just a single part of what is named
BESS. Safe operation requires installation of communication and control, power
conversion and temperature control systems. Explained architecture is visualised
in Figure 28.
Monitor and control systems are often referred to as battery management sys-

M. Sisovs, “Distributed BESS in Retail Electricity Market” 50
Figure 28: Simplified visualisation of BESS [5]
tem (BMS) and its role is to ensure desired performance and safety. Power elec-
tronics (PCS) are required to adjust voltage from grid to battery level and to com-
municate with utility. Temperature control is essential for heat-sensitive units, like
Li-ion [5, 20]. Mentioned extensions add-up to BESS capital investment and thus
have to be considered.
Overall, the market has shifted towards lithium-ion solutions, since its deep
discharge rate, long life-cycle and plummeting cost have proved being preferable
to other technologies [5, 14, 47].
Relying on that, and dealing with complications of product technical and price
information availability, a number of BESS products has been collected into Tab.
3. Figures reflect deployed project costs or available prices, if so. Energy and
discharge capacity rates are selected according to defined focus in CES.
In Tab. 3 corresponding battery product names are labelled with numbers,
which identify: 1 - Saft SMUD CES c©, 2 - SAFT LVGB c© (Low Voltage Grid
Batteries), 3 - PureWave CES c©, 4 - BYD MSD c©, 5 - Powerpack c©. Lack of data
reflects confidentiality politics of storage manufacturers. Also, complete technical
and economic components are highly dependent on desired project, and often are
negotiated directly between customer and manufacturer. In Tab. 3, in some cases
of such data being available, the cost is divided between storage unit (SU) itself
and the power conversion system (PCS).

51 M. Sisovs, “Distributed BESS in Retail Electricity Market”
Table 3: Comparison of different BESS products
Producer SAFT S&C BYD Tesla Green- GreenBattery 1 2 3 4 5 smith Charge
Type Li-ionE, kWh 34 82,5 50 60 100 82 160dmax, kW 30 33 25 50 50 50 100
RTE 0,9 - 0,88 0,9 0,8736 0,85 -Cycle life 6000 - 7300 6000 5000 - -tmin, ◦C - - -20 - -25 - -tmax,
◦C - - 45 - 50 - -Information
Year 2012 2014 2010 2010 2016 2011 2013Source [48] [49] [18, 50] [51, 52] [23] [53] [54]
Cost, eSU - - 44 694 89 394 41 768 - -
PCS - - 37 906 92 789 59 623 - -Total 243 724 132 139 82 600 182 183 101 391 100 273 219 896e/kW 8 124 4 004 3 304 3 644 2 028 2 005 2 199e/kWh 7 168 1 602 1 652 3 036 1 014 1 223 1 374
4.3 Economics of Energy Storage
Implementation of energy storage highly depends on existing types of niches
in electrical grid and market operation. Storage may be operated in a range of
applications that under certain conditions become feasible or not.
Current market situation along with cost reduction, subsidies and increased
knowledge of battery functionality allows these technologies to become highly com-
petitive on global level [5].
Development of electrical storage projects must surpass several stages of ver-
ification and estimation of potential revenues for each application. Based on the
conclusions of such studies, a design of battery is suggested. Such design intends
maximizing profits under defined configurations of the grid.
However, this becomes questionable, because any cost-benefit assessment must
reflect local conditions as well as up-to-date storage system characteristics. Even
in that case, complete analysis additionally requires detailed models of power sys-
tem and stochastic market price prediction models. This tends to lead to a wide

M. Sisovs, “Distributed BESS in Retail Electricity Market” 52
dispersion of results and conclusions, hence, adding to the complexity of developed
study.
An overview of storage services is presented, separately mentioning potential
applicability in electricity markets.
Figure 29: Overview of storage applications and their potential [6]
4.3.1 Energy Arbitrage
Almost all energy markets follow similar pricing pattern: overnight prices are
significantly lower than afternoon/evening figures [55], though the value of this
difference to a large extend depends on the available generation and system load
in local conditions (weather, industry, etc.) [56].
The economics of energy arbitrage are quite straightforward, however the key
factors that play determining role in economic feasibility are often difficult to
identify and, frequently, depend on the case. Nevertheless, it is important to give
an overview of the impact of the operational features of batteries.
The process of charging and discharging a battery always accounts with some-
what losses. A term which describes that, is called round-trip efficiency (RTE).
From technological point of view, multi-hour storage remains quite difficult with
high values of round-trip efficiency, whereas studies in [44, 57] claim adjusting RTE
may sufficiently affect revenues of arbitrage, pointing out that relative increase is

53 M. Sisovs, “Distributed BESS in Retail Electricity Market”
higher for longer-discharge time units.
Batteries, by their chemical nature, have limited lifetime, usually measured in
number of cycles, when one cycle corresponds to one complete charge and dis-
charge. Hence, the moment its end of life (EOL) is reached, the battery has to be
replaced. The operation period continues for several years, lasting until 20 years
for some technologies [21].
Nevertheless, the replacement cost must be considered as an up-front capital
investment, meaning that each operation cycle of given battery wears a cost, which
by the EOL would allow purchasing new battery. According to that, cycle cost of
battery may be expressed as in Eq. (4).
Ccycle = δrep ∗ Ccapex
cycmax(4)
where:
Ccapex - CAPEX of the battery, e;
cycmax - battery’s cycle life, cycles;
δrep - replacement cost fraction of CAPEX;
Peak-off-peak electricity market price ratio and storage cycle cost, in most
occasions, determine the feasibility of storage. Hence, number obtained in Eq. (4)
must be compared to potential arbitrage benefit of 1 cycle of given storage product.
Generally, this income is quite complex when many features and full range of
battery’s characteristics are considered. Nevertheless, simplified computation may
look as follows:
Inccycle =
Emax/dmax∑i=1
[Ai ∗ γrte −Bi
](5)
where:
Ai - i-th maximum value of λdamt among t ∈ T ;
Bi - i-th minimum value of λdamt among t ∈ T .
Here, t belongs to desired set of time intervals T - for this expression those are
24 hourly periods per day. Ratio Emax/dmax is a discharge duration in hours. It

M. Sisovs, “Distributed BESS in Retail Electricity Market” 54
is worth noting that Eq. (5) is only valid for integer values of discharge duration.
In such manner, Eq. (5) defines one cycle income as the summation of differences
between 1..i-th maximum and 1..i-th minimum DAM prices, considering the round-
trip efficiency. Discharge duration in hours i is defined by the relation Emax/dmax.
Technological specification of batteries utilised for energy storage should to
a large extend be compatible with service requirements. In other words, since
arbitrage requires multi-hour storage, the energy capacity and discharge rating
should be selected accordingly.
However, limitations of available storage product data obliges to use a num-
ber of market products with given technical parameters for arbitrage feasibility
evaluation.
Several studies report different results on arbitrage profit sensitivity to key
battery characteristics. For example, a literature review in [20] claims conducted
studies lead to major controversies in their conclusion, thus, keeping the sensitivity
question open.
Generally, energy systems providers claim retail energy time-shift do not pro-
duce sufficient value streams for business, hence, do not push the development of
projects in most regions, except those with large variance in peak and off-peak
prices (for instance, Hawaii) [58]. At the same time, [17] concluded that prof-
its from energy arbitrage were insufficient to reimburse the investment, propos-
ing simultaneous utilisation of storage for services, such as, load following, T&D
cost deferral, grid stability, etc. The study, conducted in [19], had assessed the
generation-coupled storage at a wind power plant, resulting in promising ROI
thanks to its reserve capacity in secondary market.
Figure 30 demonstrates the values of potential daily earnings of one particular
battery. Necessary expressions have been computed, according to Eqs. (4) and
(5).
Since the red line expresses cycle cost (computed with δrep = 0.33, and making
one full cycle per day), it is straightforward, that only during three days out of
181, energy arbitrage would remain profitable.

55 M. Sisovs, “Distributed BESS in Retail Electricity Market”
Figure 30: Potential earnings and cycle cost of S&C “PureWave” battery
4.3.2 Support of Renewables
Support of renewable generation is one of the promising applications of storage
systems with a tremendous growth of penetration of wind and solar [10]. Highly-
intermittent production is less accurate in forecasting, requires additional grid
stability measures from operators and is hardly controllable or manageable.
Fast-response battery storage may provide frequency control at higher level
than wind or solar power plant solely. Moreover, oscillating production profiles may
be smoothed with assistance of BESS. Energy, stored in curtailment hours, may
be served at peak hours, reducing market prices, system congestion and avoiding
the need to run expensive CO2-emitting power plants [58].
While currently the grid itself supports renewable generation, with the develop-
ment of DES and distributed storage, the latter might out-take that role, becoming
a significant player in grid support [58].
Study, conducted in [19] has optimized operation of a wind power plant with
6 MWh BESS and resulted in 10 year investment payback period.
Talking about small-scale, in Germany, the profitability of investment in resi-
dential storage with solar photovoltaic (PV) plant is higher than that of PVs on
their own. Even though such result is dependent on regulatory environment, de-

M. Sisovs, “Distributed BESS in Retail Electricity Market” 56
creasing costs for solar panel and battery manufacturing are pushing the limits.
Several studies showed Li-ion batteries with PVs maintain positive net-present
value in Germany nowadays [47].
4.3.3 Frequency Regulation
As already mentioned, frequency regulation is a grid stability service provided
by generation units installed in the system. Energy storage possesses a great
technical and economic potential in providing this service and benefiting the power
system in many ways.
Along with mentioned intermittency of wind and solar, conventional power
plants that use fossil fuels are limited in adjusting their generation when required
by the system. This arises from established ramp rates, i.e. the maximum available
deviation from current production at time instant; large response time to the
signals, which is much longer than current storage technologies. Batteries often
respond to the control signal in the range between tens of milliseconds to one
second [20].
A paper in [44] investigated simultaneous utilisation of energy storage for arbi-
trage and secondary regulation in New York, which resulted largest share of profits
arise from frequency control service.
Similar conclusion has been achieved in [19], showing high annual revenues in
secondary reserve market.
Literature review, conducted by [20], made a survey of energy storage revenues
for frequency regulation. A range of participants described annual benefit ranging
from 253 e/kW for 70 % RTE batteries up to 1775 e/kW for high-power and fast
discharge (15 mins) units.
Report in [6] emphasises the importance of combining multiple benefits with
frequency regulation, claiming it is a key for proposing high-value in business case
of energy storage.
However, since adequate application in frequency regulation requires large
MWh-scale fast-discharging storage units, completing large amount of cycles annu-
ally, the service combination remain questionable for distribution level and subject
to additional computations.

57 M. Sisovs, “Distributed BESS in Retail Electricity Market”
4.3.4 Capacity Upgrade Deferral
Growing electricity demand repeatedly requires manufacturing transmission
and distribution networks for operating with increased capacities and maintaining
system stability. Network reinforcement procedures are conducted by correspond-
ing unities - by TSO in case of transmission network and by DSO for distribution
grids. The range of mentioned applications of storage provides certain benefits for
grid thus allowing postponing next maintenance investment, prolonging the life of
existing elements, like transmission lines or power transformers.
When the equipment is upgraded, its capacity accounts for several years and
in the beginning is not utilised. These large up-front costs by system operators
may be deferred, as mentioned, by storage. Clearly, such depends on cost of T&D
upgrade, which usually is expressed in e/kW.
Complete cost-benefit analysis of distribution deferral, though, requires ex-
tended knowledge of particular grid topology and configuration. In this study,
however, such information in unavailable, thus, the approach is heavily facilitated.
Report in [18] evaluated several scenarios of implementing community energy
storage and obtained results, saying 53 % of storage project investment was re-
turned from distribution upgrade deferral.
4.3.5 Other Services
Table 4: Current and expected utility-scale battery storage application marketshare [7]
Application 2014 2023Renewable Support 29 % 40 %
Peak-shaving 20 % 15 %Arbitrage 18 % 37 %Ancillary 17 % 3 %
Other 16 % 5 %Capacity 360 MW 14 GW
Undoubtedly, there is a wider range of battery storage applications in electrical
grid, each having certain economic potential based on particular market, electrical

M. Sisovs, “Distributed BESS in Retail Electricity Market” 58
system and regulatory conditions. Those applications include extended list of
power quality services, system ancillary, T&D support, etc. (Figure 29)
However, these services are considered out of the scope of this thesis project,
since they barely interfere with the definition of distributed battery systems. That
being said, some services are impractical in selected project scale or had been
decided not to implement due to their complexity.
In conclusion, Tab. 4 shows 2023 forecast for utility-scale battery storage
applications, indicating that expected capacity would increase till 14 GW from
360 MW in 2014 [7].

59 M. Sisovs, “Distributed BESS in Retail Electricity Market”
5 Mathematical Model
Mathematical model is an equation-based definition of a problem. Within
optimization problem it is required to describe parameters, variables, constraints
and objective function (or functions, if several). This process itself has to be
optimized by minimizing the number of total variables and constraints for least
computational time. Large problems tend to run of out memory or be unable
to reach optimality on most common-user machines, hence, each script had been
defined/adjusted to avoid mentioned problems.
5.1 Overview
First of all, the mathematical model development, key ideas and related pro-
gramming, to a large extent, has been adopted from paper in [19]. This publication
served as a basis for implementation of the problems studied in this thesis. Initial
design of the model had survived some changes, though, specifically:
• Load-pattern import from outer environment
• A shift from generation to distribution part of the power system
• Addition of locational distinction
• Implementation of EV problem
Secondly, the model interprets the problem as a set of locations (or neighbour-
hoods), that are to a large extent independent on each other. Despite location
points are distributed along the same city and some of them may be adjacent,
direct energy trading between neighbourhoods is neglected. However, some re-
strictions refer to an aggregation of locations. This shall be described thoroughly
throughout this chapter.
Practically, in order to build a model of interconnected communities for elec-
tricity trading, corresponding electrical schemas of circuits are required, which
involve bunch of parameters, such as, line length, resistance, inductance, nodal
power flow conditions, etc. Apart from that, according to the assumptions made,
BESS are installed on the secondary side of LV transformer, thus, such system

M. Sisovs, “Distributed BESS in Retail Electricity Market” 60
Figure 31: Model visualization of day-ahead and secondary reserve markets trading
would likely be not permitted to operate within distribution grid by technical
operator (similarly, selling energy to DAM is forbidden).
Figure 31 demonstrates the trading of energy within DAM and SRM of one
location with parameters and variables described in Subsection 5.2. Black arrows
are related to the operations in DAM and basically, are used for energy arbitrage,
whereas dashed lines visualise secondary reserve market bids. Blue and green lines
stand for secondary energy trading. The desire is to store cheap power purchased
in time periods with low price (at night) and to discharge it to the load when
electricity prices reach their peaks.
5.2 Optimization Model
5.2.1 Sets
T : Set of hourly time periods per half-year period t ∈ T = {1, 2, ..., 4344}
L : Set of geographic locations l ∈ L = {L1, L2...L106}
C : Set of clusters cl ∈ C = {1, 2..., 8}

61 M. Sisovs, “Distributed BESS in Retail Electricity Market”
5.2.2 Parameters
∆t : Duration of the time period [h]
λdamt : DAM market prices [e/kWh]
Lcl,t : Load of given customer profile [kWh/h]
LNl,t : Load of a neighbourhood [kWh/h]
Pmaxl : Maximum transformer power in a neighbourhood [kW]
SOCmin : Minimum SOC
SOCmax : Maximum SOC
SOCini : Initial SOC
SOC0 : SOC level at the end of the day
NSUl : Number of storage units
γrte : Round-trip efficiency
Emax : Maximum storage capacity of storage unit [kWh]
dmax : Maximum discharge capacity of storage unit [kW]
cycmax : Storage unit’s cycle life [cycles]
Ccapexl : CAPEX - Capital cost of storage unit [e]
δrep : Ratio of replacement cost to CAPEX
λsrmt : SRM market prices [e/kWh]
λisret : ISRE market prices [e/kWh]
λdsret : DSRE market prices [e/kWh]
∆tsr : Time response of secondary reserve [h]
αsr : Ration between up and down reserve
βUt : Fraction of up-reserve energy allocated
βDt : Fraction of down-reserve energy allocated
γrteEV : Round-trip efficiency of EV battery
EmaxEV : Maximum storage capacity of EV battery [kWh]

M. Sisovs, “Distributed BESS in Retail Electricity Market” 62
dmaxEV : Maximum discharge capacity of EV battery [kW]
cycmaxEV : EV battery’s cycle life [cycles]
Ccapex,evl : CAPEX - Capital cost of electric vehicle battery4 [e]
NEVl : Number of EVs in a neighbourhood
tonEV : Hour of the day, when EV battery gets connected to the grid [h]
toffEV : Hour of the day, when EV battery gets disconnected from the grid [h]
idEVt : Binary parameter for EV battery grid commitment
SOConEV : State-of-charge at the moment of connection to the grid
SOCoffEV : State-of-charge at the moment of disconnection from the grid
P contrl : Total contracted power in a neighbourhood [kW]
∆P : Annual load increase for T&D problem
λoutl,t : Per-hour of unexpected outage compensation price [e/h]
5.2.3 Variables
cl,t : Charging rate in location l ∈ L at time period t ∈ T [kW]
dl,t : Discharging rate in location l ∈ L at time period t ∈ T [kW]
idl,t : Binary variable, establishing charge (idt = 1) or discharge (idt = 0) inlocation l ∈ L at time period t ∈ T
socl,t : SOC in location l ∈ L at time period t ∈ T⋃{0}
Ml,t : DAM energy bid in location l ∈ L at time period t ∈ T [kWh]
rUl,t : “Up” secondary reserve in location l ∈ L at time period t ∈ T [kW]
rDl,t : “Down” secondary reserve in location l ∈ L at time period t ∈ T [kW]
eUl,t : “Up” secondary reserve energy, allocated to location l ∈ L at time periodt ∈ T [kWh]
eDl,t : “Down” secondary reserve energy, allocated to location l ∈ L at timeperiod t ∈ T [kWh]
Ol,t : Energy not-supplied in location l ∈ L at time period t ∈ T [kWh]
4Only used to estimate the price of battery replacement and therefore may not be consideredas a fair cost of whole electric vehicle.

63 M. Sisovs, “Distributed BESS in Retail Electricity Market”
5.2.4 Constraints
At any instant of time, the balance between generation and production should
be maintained. In given conditions, instead of producing energy, it is bought from
the pool, thus, this balance may be referred to as market equilibrium:
∆t ∗ (dl,t − cl,t) +Ml,t +Ol,t = LNl,t l ∈ L, t ∈ T (6)
In Eq. (6) non-served energy Ol,t is greater than zero only when outage sub-
problem is selected. Additionally, variable Ol,t could serve as an interesting input
for extended intra-day market (IDM) trading. Particular problems’ conditions are
described in following chapters of this work.
Since the BESS are meant to be installed on the secondary side of LV trans-
former, its power capacity may not be exceeded. Therefore, both traded energy
and SRM bids are limited by the value Pmaxl :
Ml,t + eUl,t − eDl,t ≤ Pmaxl ∗∆t l ∈ L, t ∈ T (7)
rUl,t, rDl,t ≤ Pmax
l l ∈ L, t ∈ T (8)
There were two separated variables defined for battery being charging cl,t and
discharging dl,t. An obvious relation must be introduced in order to restrict men-
tioned processes happening simultaneously. Binary variable idl,t assures that con-
dition. Apart from that, locational value of charge and discharge is bounded by
battery’s maximum discharge multiplied by number of storage units. Eqs. (9)-(10)
combine mentioned restrictions.
0 ≤ dl,t ≤ dmax ∗NSUl ∗ idl,t l ∈ L, t ∈ T (9)
0 ≤ cl,t ≤ dmax ∗NSUl ∗ (1− idl,t) l ∈ L, t ∈ T (10)
Some problems of developed model involve electric vehicle battery V2G oper-
ations. The specification of such operation is that it may be available only during
certain hours, most often in the night hours (decided before running the optimiza-
tion), while during the day they remain utilised by users (disconnected).
In the case of EV battery, when disconnected, it may not be charged nor dis-
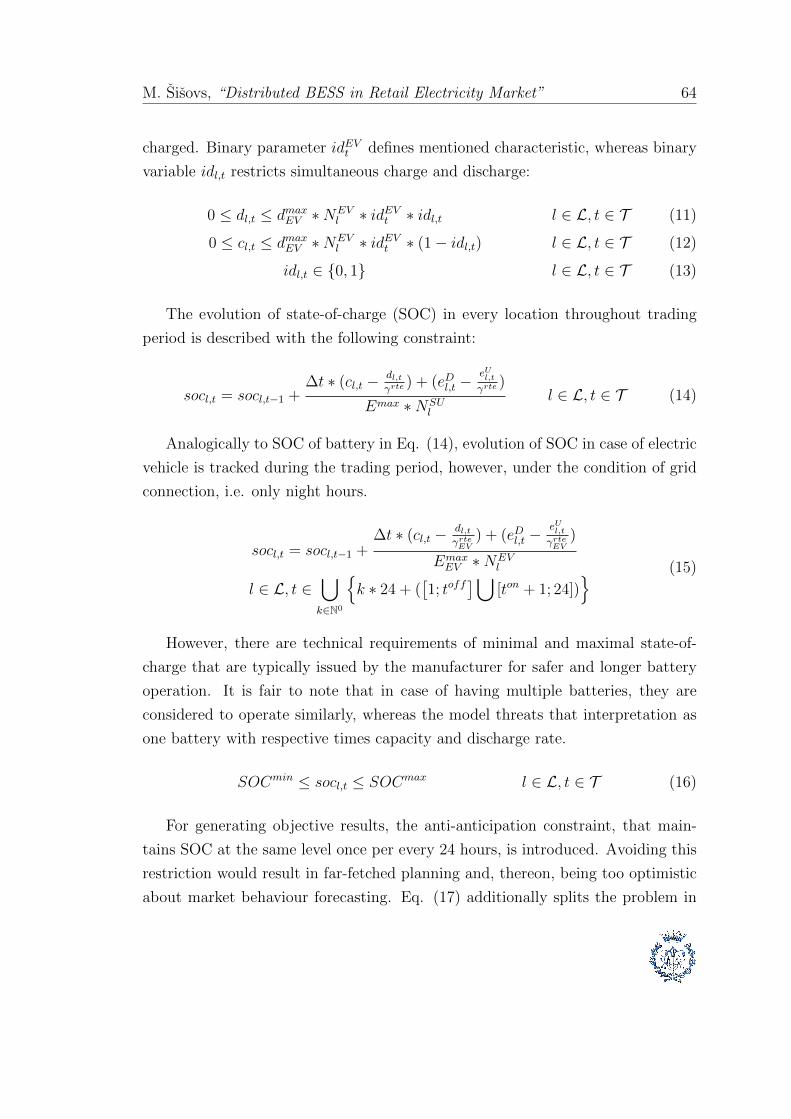
M. Sisovs, “Distributed BESS in Retail Electricity Market” 64
charged. Binary parameter idEVt defines mentioned characteristic, whereas binary
variable idl,t restricts simultaneous charge and discharge:
0 ≤ dl,t ≤ dmaxEV ∗NEVl ∗ idEVt ∗ idl,t l ∈ L, t ∈ T (11)
0 ≤ cl,t ≤ dmaxEV ∗NEVl ∗ idEVt ∗ (1− idl,t) l ∈ L, t ∈ T (12)
idl,t ∈ {0, 1} l ∈ L, t ∈ T (13)
The evolution of state-of-charge (SOC) in every location throughout trading
period is described with the following constraint:
socl,t = socl,t−1 +∆t ∗ (cl,t − dl,t
γrte) + (eDl,t −
eUl,tγrte
)
Emax ∗NSUl
l ∈ L, t ∈ T (14)
Analogically to SOC of battery in Eq. (14), evolution of SOC in case of electric
vehicle is tracked during the trading period, however, under the condition of grid
connection, i.e. only night hours.
socl,t = socl,t−1 +∆t ∗ (cl,t − dl,t
γrteEV) + (eDl,t −
eUl,tγrteEV
)
EmaxEV ∗NEV
l
l ∈ L, t ∈⋃k∈N0
{k ∗ 24 + (
[1; toff
]⋃[ton + 1; 24])
} (15)
However, there are technical requirements of minimal and maximal state-of-
charge that are typically issued by the manufacturer for safer and longer battery
operation. It is fair to note that in case of having multiple batteries, they are
considered to operate similarly, whereas the model threats that interpretation as
one battery with respective times capacity and discharge rate.
SOCmin ≤ socl,t ≤ SOCmax l ∈ L, t ∈ T (16)
For generating objective results, the anti-anticipation constraint, that main-
tains SOC at the same level once per every 24 hours, is introduced. Avoiding this
restriction would result in far-fetched planning and, thereon, being too optimistic
about market behaviour forecasting. Eq. (17) additionally splits the problem in

65 M. Sisovs, “Distributed BESS in Retail Electricity Market”
terms of its time-frame T into a number of independent ones, each consisting of
24 hours.
socl,t = SOC0 l ∈ L, t = 24 ∗ k, k ∈ N0 (17)
EV battery must maintain a high SOC at morning hour of disconnection for
daily utilisation and is connected to the grid in evening hours with low charge
level.
socl,t = SOCoffEV l ∈ L, t = toffEV ∗ k, k ∈ N0 (18)
socl,t = SOConEV l ∈ L, t = tonEV ∗ k, k ∈ N0 (19)
If decided by the problem definition to participate in SRM, BESS will submit
corresponding power bid, equal to available “up” and “down” reserve of each
location, taking into account the transformer limitations in Eq. (8). In addition,
power bids are defined by the difference between maximum and current locational
discharge, explained in Eqs. (20) and (21) for BESS and in (22) and (23) for EV.
0 ≤rUl,t ≤ dmax ∗NSUl − dl,t + cl,t l ∈ L, t ∈ T (20)
0 ≤rDl,t ≤ dmax ∗NSUl + dl,t − cl,t l ∈ L, t ∈ T (21)
0 ≤rUl,t ≤ dmaxEV ∗NEVl ∗ idEVt − dl,t + cl,t l ∈ L, t ∈ T (22)
0 ≤rDl,t ≤ dmaxEV ∗NEVl ∗ idEVt + dl,t − cl,t l ∈ L, t ∈ T (23)
The following limitations forbid submitting such power bid, that could po-
tentially, together with current charge and discharge, make the storage SOC go
beyond its limits. As it was observed from Figure 31, rUl,t stands for the bid of
opportunity of corresponding discharge, whereas rDl,t - same, but of charge.
SOCmin ≤ socl,t−1 +∆t ∗ (cl,t − dl,t
γrte)
Emax ∗NSUl
−∆tsr ∗ rUl,t
γrte ∗ Emax ∗NSUl
l ∈ L, t ∈ T (24)
SOCmax ≥ socl,t−1 +∆t ∗ (cl,t − dl,t
γrte) + ∆tsr ∗ rDl,t
Emax ∗NSUl
l ∈ L, t ∈ T (25)
Supplemental constraints are required when SRM bids are submitted by EV
M. Sisovs, “Distributed BESS in Retail Electricity Market” 66
battery. Its SOC should comply to similar limitations of correct price accepting
bids.
SOCmin ≤ socl,t−1 +∆t ∗ (cl,t − dl,t
γrteEV)
EmaxEV ∗NEV
l
−∆tsr ∗ rUl,t
γrteEV ∗ EmaxEV ∗NEV
l
l ∈ L, t ∈⋃k∈N0
{k ∗ 24 + (
[1; toff
]⋃[ton + 1; 24])
} (26)
SOCmax ≥ socl,t−1 +∆t ∗ (cl,t − dl,t
γrteEV) + ∆tsr ∗ rDl,t
EmaxEV ∗NEV
l
l ∈ L, t ∈⋃k∈N0
{k ∗ 24 + (
[1; toff
]⋃[ton + 1; 24])
} (27)
According to the regulations of the secondary reserve in Spain, transmission system
operator (TSO) declares the ratio of secondary reserve bids, which reflects whole
regulation area, rather than independent units [59]:∑l∈L
rUl,t = αsr ∗∑l∈L
rDl,t t ∈ T (28)
For given model, αsr = 1.5.
Parameters βUt and βDt regulate the amount of secondary regulation energy to
be traded, depending on the bids rUl,t and rDl,t. Fractions are determined by assuming
only 70% of time periods secondary energy will actually be traded and, apart from
that, “up” and “down” kWh values of eUl,t and eDl,t may not simultaneously be non-
zero. In other words, charging and discharging within the same market at the
same instant is not possible.
Additionally, the maximum time response of secondary reserve energy is up to
15 minutes [60], hence, ∆tsr in following equations is equal to 0.25:
eUl,t = ∆tsr ∗ βUt ∗ rUl,t l ∈ L, t ∈ T (29)
eDl,t = ∆tsr ∗ βDt ∗ rDl,t l ∈ L, t ∈ T (30)
The value of secondary energy fraction remains in the range between 0 and 1,

67 M. Sisovs, “Distributed BESS in Retail Electricity Market”
with certain probabilities, which are described in the table as follows:
p(βUt , βDt ) =
0.3 βUt = 0, βDt = 0
0.35 βUt = 0, βDt ∈ [0.7; 1]
0.35 βUt ∈ [0.7; 1], βDt = 0
5.2.5 Objective Function
Objective function is expressed as a sum of components, which are positive
numbers for incomes and negative numbers for costs. In Eq. (31) the revenues
are secondary reserve market flows, whereas expenditures arise from day-ahead
market purchasing and storage wear costs.
Optimization objective covers a certain time frame, or trading period, which
in the case of this study is half of year (4344 hours).
In real conditions a market player submitting a bid to day-ahead or reserve
market is not aware of the actual clearing price, since such is only determined once
all bids are admitted and processed. Based on that, computation of the objective
with actual price λsrmt ∗ (rUl,t + rDl,t)− λdamt ∗Ml,t would assume anticipating perfect
trading conditions by knowing that price before it has been decided. In order to
avoid such overestimated prediction precision, it has been assumed that a decision
maker submits a bid according to one-week-ago clearing price: λsrmt−168 for SRM and
λdamt−168 for DAM, as shown in Eq. (31).
max∑l∈L
∑t∈T
[λsrmt−168(rUl,t + rDl,t)− λdamt−168Ml,t
]−
−∑l∈L
[Ccapexl δrep
cycmax∗∑
t∈T (cl,t∆t+ eDl,t)
NSUl Emax
] (31)
The termCcapex
l δrep
cycmax is equal to Ccyclel and is referred to the operation cycle cost
for pro-visionary unit replacement, introduced inherently from Eq. (4), varying in
different neighbourhoods due to variable number of storage units and non-linear
CAPEX for some BESS units (for instance, Tesla) [23].
Relation∑
t∈T (cl,t∆t+eDl,t)
NSUl Emax (slightly altered for EV) performs as a cycle counter in

M. Sisovs, “Distributed BESS in Retail Electricity Market” 68
single neighbourhood throughout the trading period. In such way, multiplication
of this number by Ccyclel results in total pro-visionary storage expenses in location
l.
While in the case of energy arbitrage sub-problem, secondary reserve market
remains disregarded (i.e. rUl,t = rDl,t = 0 and eUl,t = eDl,t = 0), the objective function
may be reformulated to minimization of costs - as in Eq. (32).
min∑l∈L
∑t∈T
[λdamt−168 ∗Ml,t
]+∑l∈L
Ccyclel
∑t∈T cl,t∆t
NSUl Emax
(32)
When electric vehicle V2G operation is considered, objective function is slightly
modified to the one shown in Eq. (33). No BESS are operated in this particular
example.
max∑l∈L
∑t∈T
[λsrmt−168(rUl,t + rDl,t)− λdamt−168Ml,t
]−
−∑l∈L
[Ccapex,evl δrepEV
cycmaxEV
∗∑
t∈T (cl,t∆t+ eDl,t)
NEVl Emax
EV
] (33)
5.2.6 Trading Period Profit Estimation
A solution to the optimization problem may be expressed in a vector of de-
cision variables x. Such vector dimensions are limited, in accordance with x ∈Rn × {0, 1}k, where n is the number of continuous variables and k - number of
binary variables. Under the conditions of optimality, vector x possesses values
that complete objective function from Eq. (31), (32) or (33), in other words, the
solution is:
x∗i ≡ arg max{problemi} (34)
Obtained solution allows computing trading period (half-year) profit (TPP)
for the problem i, as in Eq. (35), decomposable to two main components, thus
measuring the profit increase. For that, economic results of storage operation Bloadl
is compared to conventional case without installed storage C loadl in every location
l.

69 M. Sisovs, “Distributed BESS in Retail Electricity Market”
TPPl (x∗) = Bload
l (x∗)− C loadl (35)
Furthermore, storage profit Bloadl is decomposed to five main components, ex-
pressing different streams of expenses and incomes in Eq. (36).
Bloadl (x∗) =
∑t∈T
λsrmt (rU∗l,t + rD∗l,t )︸ ︷︷ ︸Rsrm
l (rU∗l,t , rD∗l,t )
−∑t∈T
λdamt M∗l,t︸ ︷︷ ︸
Rdaml (M∗l,t)
+
+∑t∈T
λisret eU∗l,t︸ ︷︷ ︸Risre
l (eU∗l,t )
−∑t∈T
λdsret eD∗l,t︸ ︷︷ ︸Rdsre
l (eD∗l,t )
− Ccapexl δrep
NSUl Emaxcycmax
∗∑t∈T
(c∗l,t∆t+ eD∗l,t )︸ ︷︷ ︸Rwear
l (c∗l,t, eD∗l,t )
(36)
Storage unit wear costs may be used optionally when computing TPP, based
on the structure and purposes of economic analysis. Eq. (36) includes that com-
ponent, but in other cases TPP may solely consist of benefits from bidding to
SRM, DAM expenses, incremental secondary energy incomes and costs of that
decremental analogue.
Practically, every problem optimization and profit computation at its final
step must be compared to the situation in which the electricity company would
operate without any BESS installations. In that case, trading period would be
only characterised with serving load costs. That is expressed in Eq. (37). Value
C loadl is computed for every location l.
C loadl =
∑t∈T
λdamt ∗ LNl,t (37)
Investment payback period (IPP) is an important measure of project feasibility,
thus, it has to be included in the analysis. It may be computed according to Eq.
(38).
IPPl =Ccapexl
2 ∗ TPPl(x∗)(38)
Project investment verification accounts for a defined time-frame, or horizon.
Potential investor may be interested in estimated return of investment (ROI) af-

M. Sisovs, “Distributed BESS in Retail Electricity Market” 70
ter j years of project deployment. Neglecting discount rate, locational ROI is
computable as in Eq. (39), and usually expressed in percentage values.
ROIl,j =2 ∗ j ∗ TPPl(x∗)
CAPEXl
× 100% (39)
5.3 Problem Definition
Analysing market trading performance with distributed BESS may be of a
higher efficiency when defining several sub-problems for optimization. While liter-
ature review showed a wide range of different results and whilst potential benefits
are easily affect-able by minor variations, conclusions in a broader scope of sce-
narios are preferable. Sub-problems reflect and imply certain specifications of
mathematical model.
Initially, it had been desired to define problems, describing different operation
conditions for a set of all 106 locations. Unfortunately, such implementation had
led to the exceptional complexity, that was unable to be solved by given solvers.
Initially defined problems’ dimensions are expressed numerically in Tab. 5.
Table 5: Dimensions of 106 location problems
Problem Continuous Variables (n) Binary Variables (k) ConstraintsEAP 2 743 704 460 570 3 683 712SRM 4 598 486 460 570 7 393 700EV 4 521 561 460 570 6 703 004
OUT 3 203 872 460 570 4 144 176
Such outcome requires a stronger large-scale optimization algorithms in order
to converge. However, application of optimization techniques on power system
problems very often deals with extended complexity due to complicated structure
of electric system and small decision making time-frames.
Somewhat heuristic decomposition is required for correct interpretation. Find-
ing the exact algorithm for optimal locational clustering in given project conditions
and with the data available results problematic. Geographic proximity would be
a heuristic approach that could be proposed for finding the optimal aggrupation.
Further work attention should be paid to mentioned issue. Nevertheless, lack of

71 M. Sisovs, “Distributed BESS in Retail Electricity Market”
required data does not allow doing so in this study with a sufficient degree of
certainty.
Hence, a decomposition strategy has been applied, dividing the set of locations
L to a number of subsets m, 26 of them consisting of 4 locations and 1 - of
2 locations. In such way, every subset optimization solution is subject to the
constraint in Eq. (28). Grouping in subsets has been performed in the sequence of
neighbourhood names. For instance, first subset of locations consists of elements
l1-l4 of L.
5.3.1 Energy Arbitrage Problem
Under the conditions, given by this sub-problem, BESS operation is determined
solely by energy arbitrage. In this case, BESS buys electricity from day-ahead
market and when the power price is low and supplies the load during hours with
high cost.
Described scenario is characterised by minimizing day-ahead market costs and
storage wear costs by supplying electrical load of every consumer. Energy arbitrage
related trading is visualised in Figure 31 with black arrows. Any other market
operations, for instance, secondary reserve, are not permitted in this sub-problem.
In the end, m problems of EAP are defined as follows:
EAPm∈{1,2..,27} =
min (32)
s.t. : (6),(7),(9),(10),(13),(14),(16),(17)
5.3.2 Secondary Reserve Market Problem
Further problem of secondary reserve market performs as an extension of the
arbitrage problem, explained previously, because it inherits existing parameters,
variables and constraints, introducing new ones on the top of that.
This sub-problem allows retailing units, equipped with BESS, to submit price-
accepting bids to both day-ahead and secondary reserve markets. In such manner,
the optimization objective is extended by maximizing profits from submitted bids
to SRM.

M. Sisovs, “Distributed BESS in Retail Electricity Market” 72
SRMm∈{1,2..,27} =
max (32)
s.t. : (6)-(10),(13),(14),(16),(17),
(20),(21),(24),(25),(28)-(30)
5.3.3 Electric Vehicle Problem
The intention of incorporating battery energy storage in a sense of electric
vehicle has arisen due to the interest in potential revenues from vehicle-to-grid
(V2G) operations. In studied case, electric vehicles are used for energy arbitrage
and secondary regulation. These problems have been already defined in previous
sections, although certain conditions must be adapted.
Given sub-problem implies a number of EV’s in a neighbourhood, each charac-
terised with a battery of energy capacity EmaxEV and maximum discharge capacity
of dmaxEV . Additionally, the model assumes EV batteries operate repeatedly within
the time gap between the hour of connection tonEV and the hour of disconnection
toffEV . Those may be altered by the user.
At disconnection hour the battery must have high SOC, because EV users
intent to use their vehicles throughout the period between disconnection and con-
nection. Therefore, mentioned SOC value SOCoffEV should be defined in advance.
Similarly, when EVs are connected, the state-of-charge is usually low or close to
zero. Such is determined by parameter SOConEV .
EVm∈{1,2..,27} =
max (33)
s.t. : (6)-(8),(11)-(13),(15)-(19),(22),(23),(26)-(30)
5.3.4 Outage Problem
One of the grid reliability characteristics is the number of hours of expected
and unexpected outages, i.e. when customers are disconnected from electric supply
without their own will. Though European reliability indices remain relatively high
[61], outages is an inevitable part of operation with the risk being always above
zero.

73 M. Sisovs, “Distributed BESS in Retail Electricity Market”
Relative indexes represent described value, particularly, System Average Inter-
ruption Duration Index (SAIDI), which is demonstrated in Eq. (40). It explains
the relation of average interruption duration per customer in a conjunction of
supply points.
SAIDI =
∑i(Ui ∗Ni)∑
iNi
(40)
where:
Ui - annual failure rate [mins/year];
Ni - number of customers in the point of supply i.
Hence, this sub-problem tries to study the possibility of BESS to cover the
outage completely or partially with stored energy, taking into account the sudden
nature of such disconnections, i.e. one may not predict at which hour it may occur
and, therefore, may not charge the batteries up-front.
Distribution system operator may benefit from increasing grid stability, as well
as from avoiding outage compensation, defined in [62], and expressed in Eq. (41).
D = 5 ∗ P contr ∗ (Nhint −Nh
fix) ∗ λtrf (41)
where:
D - customer outage compensation [e];
P contr - customer contracted power [kW];
Nhint - number of hours of interrupted supply [h/year];
Nhfix - maximum permitted and fixed by law number of hours of interrupted
supply [h/year];
λtrf - contracted tariff energy price [e/kWh].
Due to limitations of the study we assume every neighbourhood suffers a com-
plete outage for a number of hours, derived from SAIDI index; and is compensated
in accordance with neighbourhoods contracted power P contrl , fixed number of out-
ages Nhfix = 5 from [62], and with 2.0A tariff price λtrf from year 2014, which is
available in the database of Spanish TSO [2] or market operator [1].
It is fair to note that implementation of this sub-problem should extend the
problem of energy arbitrage or secondary reserve market, as desired by the user.

M. Sisovs, “Distributed BESS in Retail Electricity Market” 74
OUTm∈{1,2..,27} =
min (32)
s.t. : (6)-(7),(9),(10),(13),(14),(16),(17)
Practical idea behind this problem is randomly5 deciding hours of outage and
identifying the proportion of power that BESS may supply at this hour. Since the
random decision regards whether the system suffers an outage or not, it shall be
implemented with binary number (for example: 1 - stable, 0 - outage). Random-
ization of this binary number is dictated by certain probability, which is defined
by the index of SAIDI. Average SAIDI in Spain within the period from 1999 to
2011 is estimated to be 133,9 minutes [63]. To avoid anticipation, batteries must
operate in conditions of energy arbitrage ot secondary reserve market problems.
5.3.5 Transmission and Distribution Costs Deferral Problem
European electrical system demand is suffering annual increases over last decades
[10], which requires system operators to deal with issues of extending the capacities
of electrical networks, or transmission and distribution systems.
This problem investigates the financial benefit from BESS on postponing T&D
(transmission and distribution) maintenance investment.
Spanish TSO Red Electrica de Espana has studied the evolution of national
electrical demand in [8], that showed in years 2011-2014 the national demand has
been decreasing, followed by a 1,9 % increase in 2015. Mentioned evolution may
be observed in Tab. 6.
Table 6: The Spanish electrical system demand evolution [8]
Year Demand, GWh Increase, %2011 255 597 -1,92012 252 014 -1,42013 246 368 -2,22014 243 544 -1,12015 248 181 1,9
5Actually, reproducible random number streams are used to repeat same results after runningthe code several times.

75 M. Sisovs, “Distributed BESS in Retail Electricity Market”
For a case study of a set of neighbourhoods, distribution transformer capac-
ity extension may be required if maximum transmitted power will be exceeded.
Thus, formulating this sub-problem implies supposing a value of annual electricity
demand increase, applying that to the peak power consumption in a neighbour-
hood P peakl and, consequently, identifying those zones, where during the period of
project accumulation the maintenance will be required.
However, no optimization is needed to solve given problem, but rather a sim-
ple calculation, estimating demand growth in every location and, consequently,
deciding on necessity of maintenance that can be deferred thanks to existence of
storage.

M. Sisovs, “Distributed BESS in Retail Electricity Market” 76
6 Case Study
This chapter covers the study case, which has been developed in previous sec-
tions. As determined, this process was composed of four main steps:
• Smart meter data mining and analysis for electrical consumption estimation,
depending on seasonal, locational and consumer type characteristics;
• Overview of electricity market functionality principles, emphasizing particu-
lar mechanisms of that in Spain and evaluating its tolerance towards BESS;
• Technological overlook of battery energy storage market products, its limi-
tation and benchmarking
• Creation of mathematical model, that would allow evaluating performance
of BESS under certain conditions with fairly adjustable inputs.
Once having done mentioned steps, the aim of the projects is to obtain results
of economic viability of BESS for defined sub-problems.
6.1 Parameter Value Assignation
A range of numerical values for parameters from the model (listed in Section
5.2.2) has to be assigned before launching the optimization. This section explains
the nature of assumed values and limitations made throughout this process.
6.1.1 Data Obtained From Previous Chapters
Previous sections of this thesis had described a spectrum of procedures for ob-
taining customer load data, electricity market prices and battery storage technical
and economic characteristics.
As it has been concluded in those chapters, corresponding parameter inputs
are created from made assumptions and available resources. It has been decided
to implement the design of Tesla Powerpack c© battery, that showed lowest cost
per unit of energy and most actual cost figures (Tab. 3). Defined parameters are
visualised in Tab. 7. Actual electricity market prices of first six months had been
implemented for parameters λdamt , λsrmt , λdsret and λdsret . Those prices are available

77 M. Sisovs, “Distributed BESS in Retail Electricity Market”
in [1, 2]. Apart from that, parameter βUt and βDt definitions are explained in
Section 5.2.4. Annual demand for T&D problem has been assumed being 1,9 %,
according to Tab. 6 most recent value.
Table 7: Parameter values obtained throughout the study
Parameter Value Parameter Valueλdamt Array SOCini 0.5λsrmt Array SOC0 0.5λisret Array γrte 0.8763λdsret Array Emax 100λoutl,t Array dmax 50LNl,t Array cycmax 5000P contrl Array Ccapex
l 59623+41768*NSUl
∆t 1 SOCmin 0∆tsr 0.25 SOCmax 1αsr 1.5 ∆P 1,9 %
6.1.2 Case Study Assumed Values
Remaining parameter values have been assumed or defined for particular case
study, thus, are requiring further comments to be made. Primarily, those param-
eters and their respective values are listed in Tab. 8.
Table 8: Parameter values assumed
Parameter Value Parameter ValuePmaxl Array NSU
l ∈ [1, 2, 3, 4, 5]δrep 0.216 NEV
l 0.1*N custl
tonEV 20 toffEV 8
SOConEV 0.1 SOCoff
EV 0.9EmaxEV 25 dmaxEV 15γrteEV 0.8763 cycmaxEV 5000
Ccapex,evl 10675*NEV
l
Power transformer maximum capacity Pmaxl is a technical limitation of hourly
transmitted energy, thus, when installed, it must be able to serve secondary-side
load’s peak power with finite gap for emergency situations.
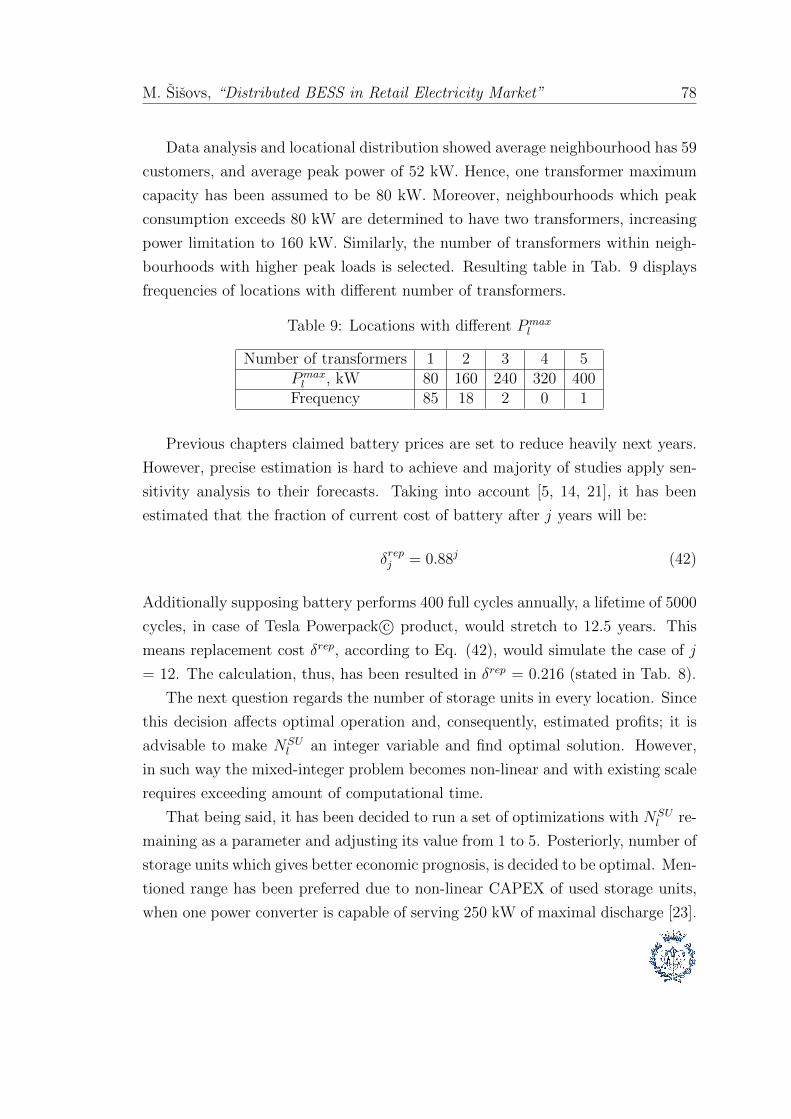
M. Sisovs, “Distributed BESS in Retail Electricity Market” 78
Data analysis and locational distribution showed average neighbourhood has 59
customers, and average peak power of 52 kW. Hence, one transformer maximum
capacity has been assumed to be 80 kW. Moreover, neighbourhoods which peak
consumption exceeds 80 kW are determined to have two transformers, increasing
power limitation to 160 kW. Similarly, the number of transformers within neigh-
bourhoods with higher peak loads is selected. Resulting table in Tab. 9 displays
frequencies of locations with different number of transformers.
Table 9: Locations with different Pmaxl
Number of transformers 1 2 3 4 5Pmaxl , kW 80 160 240 320 400
Frequency 85 18 2 0 1
Previous chapters claimed battery prices are set to reduce heavily next years.
However, precise estimation is hard to achieve and majority of studies apply sen-
sitivity analysis to their forecasts. Taking into account [5, 14, 21], it has been
estimated that the fraction of current cost of battery after j years will be:
δrepj = 0.88j (42)
Additionally supposing battery performs 400 full cycles annually, a lifetime of 5000
cycles, in case of Tesla Powerpack c© product, would stretch to 12.5 years. This
means replacement cost δrep, according to Eq. (42), would simulate the case of j
= 12. The calculation, thus, has been resulted in δrep = 0.216 (stated in Tab. 8).
The next question regards the number of storage units in every location. Since
this decision affects optimal operation and, consequently, estimated profits; it is
advisable to make NSUl an integer variable and find optimal solution. However,
in such way the mixed-integer problem becomes non-linear and with existing scale
requires exceeding amount of computational time.
That being said, it has been decided to run a set of optimizations with NSUl re-
maining as a parameter and adjusting its value from 1 to 5. Posteriorly, number of
storage units which gives better economic prognosis, is decided to be optimal. Men-
tioned range has been preferred due to non-linear CAPEX of used storage units,
when one power converter is capable of serving 250 kW of maximal discharge [23].

79 M. Sisovs, “Distributed BESS in Retail Electricity Market”
In that occasion, per kWh storage unit price will remain lowest when purchasing 5
units, since they provide exactly 250 kW of maximum charge/discharge capacity.
In order to perform an optimization on electric vehicle problem, one must
define a number of electric vehicles in every location NEVl . Implementing actual
EV-ownership percentage would result less demonstrative, since only 10 000 EVs
are in operation currently in Spain [64]. For that reason, the study assumes at
every location 10% of contracted consumers possess an EV.
Supplemental parameters are required for defining EV operational conditions.
Those are the hours of the day when the devices are connected and disconnected
from the grid, hence, stating a period of time of connection and disconnection.
Additionally, state-of-charge at these instants of time must be fixed for obvious
reasons of EV utilization routine.
Figure 32: Visualization of EV operation implementation
Illustratively discussed parameters describing EV operation in case study are
demonstrated in Figure 32 specifying assumptions made in Tab. 8.
Characteristics of electric vehicle for specific problem had been sourced from
several references regarding existing EV batteries, combined in [65]. Based on
that, and after several approximations, it has been decided that energy capacity
of EV battery EmaxEV should be equal to 25 kWh, whereas discharge capacity dmaxEV
yields 15 kW.
Apart from that, [66] claims battery costs for electric vehicles ranges between
350 up to 440 e/kWh. Therefore, final price of 427 e/kWh has been imple-
mented. This, however, is only required for calculation cycle cost prior to battery
replacement (as in Eq. (4)).

M. Sisovs, “Distributed BESS in Retail Electricity Market” 80
6.2 Problem Complexity
SAS/OR 9.3 c© software [67] was used for implementing optimization problems
in algebraic modelling language OPTMODEL. Described implementation has
been based on the code, developed in [19]. Mixed-integer linear programming
(MILP) solver has been called on a transportable PC with brief characteristics
being i7 CPU @ 2.40 GHz and 8 GB of RAM. Mathematical programming reference
used throughout the development of model is available in [68].
Selected sub-problem with applied constraints and declared objective function
defines a large-scale mixed-integer linear optimization problem with a number of
variables and constraints, depending on the problem. Numerical figures, charac-
terizing computational complexity, are observable from Tab. 10.
Table 10: Different optimization problem vastness
Problem n k Cons. Time, sEAP1 104 264 17 380 139 008 17,07SRM1 186 800 17 380 304 084 52,21EV1 186 800 17 376 232 408 16,12
OUT1 121 640 17 380 156 384 31,87
Numbers in Tab. 10 represent the amount of continuous variables n, binary
variables k and constraints when running the optimization for a subset of locations
m. In this example, m = 1, which consists of four locations: l1-l4.
6.3 Optimization and Results
Since every problem reflects a set of locations, complete results have been
moved to Appendices of this thesis project. Hence, this subsection will address
more generalised and relevant numbers.
Optimization program had been run several times varying number of storage
units NSUl in corresponding problems from 1 to 5 at every location. Further on,
the number that resulted in lowest IPP per location, has been decided the optimal.
It is important to remind to the reader that presented figures represent the time
period of six months, according to the load data available. Any longer period (year

81 M. Sisovs, “Distributed BESS in Retail Electricity Market”
or years) estimation is subject to multiplication of obtained results to required
amount of times.
Table 11: Energy arbitrage problem results (5 locations)
Location l23 l8 l94 l50 l66NSUl 5 4 5 4 5
N cycl 250,45 214,42 161,52 209,01 161,88
C loadl , e -19 987,39 -10 429,20 -11 480,93 -9 040,03 -10 402,82
Rdaml , e -18 856,85 -9 605,80 -10 595,71 -8 240,75 -9 524,99
Rwearl , e -329,47 -238,18 -212,48 -232,17 -212,95Bloadl , e -19 186,32 -9 843,98 -10 808,19 -8 472,92 -9 739,94
TPPl, e 801,07 585,22 672,74 567,11 664,87IPPl, yrs 16,76 19,37 19,95 19,99 20,19EOL, yrs 9,98 11,66 15,48 11,96 15,44ROIl,10, % 59,68 51,63 50,11 50,03 49,53
Short table of energy arbitrage problem results is presented in Tab. 11. It
displays figures of 5 locations that demonstrated lowest IPP. Initially, the problem
had been initialised with actual CAPEX of batteries. However, such solution had
extremely impractical values of IPP and low values of TPP. Due to high cycle cost
(function of CAPEX in Eq. (4)), BESS were barely operated.
It was decided then to investigate whether an assumption of reduced CAPEX
would affect the results. Such small sensitivity analysis had concluded that even
applying a CAPEX coefficient of 0,1 did not justify the investment in majority of
locations. Five most suitable locations, though, could reimburse the investment
in 16,76 - 20,19 years. Average TPP of all 106 locations is 333,65 e and average
IPP is 71,22 years.
Tbls. 11, 12 and 13 use a range of symbols for streams of expenses and incomes.
For simplicity, expenses in mentioned tables are written in negative numbers. C loadl
expresses total expenditures of electricity company serving load without any stor-
age installations. Bloadl explains profits of the battery operation. It is composed of:
Rdam - day-ahead market expenses; Rwearl - storage wear cost; Rdsre
l - decremental
secondary reserve energy expenses; Risrel - incremental secondary reserve energy
incomes; Rsrml - secondary reserve market incomes.
Similar presentation of results of secondary reserve market problem is found in

M. Sisovs, “Distributed BESS in Retail Electricity Market” 82
Table 12: Secondary reserve market problem results (5 locations)
Location l8 l7 l23 l5 l50NSUl 5 3 5 3 5
N cycl 131,36 113,10 331,11 197,41 119,18
C loadl , e -10 429,20 -7 754,92 -19 987,39 -7 179,58 -9 040,03
Rdaml , e -11 039,61 -7 957,50 -23 608,32 -7 663,50 -9 591,87
Rwearl , e -1 727,98 -1 024,88 -4 355,75 -1 788,85 -1 567,76
Rdsrel , e -402,47 -297,47 -95,67 -462,02 -313,50
Risrel , e 1 927,29 958,81 4 409,32 1 626,16 1 612,54
Rsrml , e 42 334,88 27 045,69 41 691,76 26 841,61 38 101,71
Bloadl , e 31 092,10 18 724,65 18 041,35 18 553,41 28 241,12
TPPl, e 41 521,31 26 479,57 38 028,74 25 732,99 37 281,16IPPl, yrs 3,23 3,49 3,53 3,59 3,60EOL, yrs 19,03 22,10 7,55 12,66 20,98ROIl,10, % 309,32 286,86 283,3 278,3 277,74
Tab. 12. This time, actual CAPEX has been used from collected manufacturer
data in Tab. 3. Five most promising locations require 3,23 - 3,60 years to recover
battery cost. Regional average TPP yields 14 042,15 e with average IPP being
equal to 5,75 years. In resulted operation conditions average BESS installation
will operate 19,48 years.
Table 13: EV problem results (5 locations)
Location l69 l75 l10 l23 l101NEVl 10 10 9 23 5
N cycl 182,86 276,67 210,70 296,60 159,03
C loadl , e -6 741,69 -7 030,77 -7 326,13 -19 987,39 -2 800,96
Rdaml , e -7 690,28 -8 301,01 -8 661,07 -24 078,20 -3 208,26
Rwearl , e -390,40 -590,69 -449,83 -633,25 -339,53
Rdsrel , e -97,53 -304,32 -14,38 -331,68 -37,62
Risrel , e 447,87 1 098,38 547,30 2 729,95 74,83
Rsrml , e 14 466,62 14 323,91 13 088,65 32 525,55 7 264,49
Bloadl , e 6 736,27 6 226,27 4 510,68 10 212,38 3 753,91
TPPl, e 13 477,96 13 257,04 11 836,80 30 199,77 6 554,87TPPl
NEVl
, e 1 347,80 1 325,70 1 315,20 1 313,03 1 310,97
EV problem does not involve any investment, since it has been assumed that

83 M. Sisovs, “Distributed BESS in Retail Electricity Market”
there is already a particular amount of electric vehicles per location, supplied by
direct EV buyers. This number is proportional to the amount of actual consumers.
Thus, TPP has been calculated per EV and then the Tab. 13 has been sorted
descending on that. No stationary BESS are considered installed in this problem,
only EVs. In perspective, simultaneous implementation of both solutions may lead
to interesting results, that are worth to study. However, this thesis addresses these
problems separately due to defined goals and limited time-frame.
It is worth mentioning, that despite neglecting CAPEX, battery wear cost still
remains included, though, it is optional to consider that. This usually depends
on the structure of desired economic analysis. The wear cost has been computed,
basing on assumed cost of EVs in a neighbourhood Ccapex,evl .
Total results account for average number of 6,3 EVs per location, 5 955,64 e
average TPP, thus reaching a demonstrative profit figure of 928,86 e/EV.
Table 14: T&D and outage problem results (5 locations)
Location l1 l2 l3 l4 l5N custl 76 1 69 113 123N trl 1 1 2 2 2
P contrl , kW 334,65 3,45 318,1 529,2 570,8
P peakl , kW 55,32 1,72 88,81 150,71 88,11
P peakl − P tr ×N tr
l , kW -14,47 -77,96 -54,79 18,52 -55,62Nhint 3 6 3 1 3
Dl, e 0 6,23 0 0 0
Results of outage and T&D deferral problems had been grouped to same ta-
ble due to most computations had been performed outside SAS/OR environment.
Tab. 14 demonstrates number of customers N custl in five locations, number of 80
kW power transformers N trl , total contracted power of consumers in a neighbour-
hood P contrl and their peak consumption P peak
l .
Term P peakl −P tr×N tr
l measures kWs, by which the peak consumption will be
exceeded at year 10. This allows concluding on necessity of transformer capacity
increase. In total, it resulted that during the period of 10 years, in 15 locations out
of 106, transformer extension is required. With assumed price of one transformer,
total cost shall be 25 682,10 e.

M. Sisovs, “Distributed BESS in Retail Electricity Market” 84
Regarding outage, whenever the number of interruptions hours exceeds 3 (max-
imum allowed number of hours of unpredicted shortage), consumer gets somewhat
compensation. A part of that compensation that has been avoided thanks to BESS
is expressed as Dl and is calculated from Eq. (41).
In total, avoided outage compensation cost resulted to be 8 641,58 e.
Tab. 15 compares the results of different problems, showing the calculations for
whole spectrum of locations l in L, avoiding average values, but rather summarizing
total expenses and incomes. ROI values account for a 10-year period and HP - for
horizon profit (similarly, 10 years).
Table 15: Comparison of results
Problem NSU/EV CAPEX TPP , e IPP , yrs HP , e ROI, %EAP 339/0 2 047 956 35 367 28,95 707 340 34,53SRM 225/0 15 717 948 1 448 468 5,28 29 769 362 189,4EV 0/667 - 631 298 - 12 625 955 -
T&D - - - - 25 682 -OUT - - - - 8 642 -OPT 132/377 9 031 198 1 259 721 3,58 25 194 415 278,97
It has been claimed previously that EV problem does not account for any
CAPEX cost and remains profitable throughout the horizon of 10 years. Therefore,
it is worth to compare each neighbourhood on the subject of the most profitable
investment. That means, one may want to determine whether buying storage or
providing solely V2G services result in maximum profits for system operators.
The computation has been done in a quite straightforward way - by comparing
two terms for every location: horizon profit of batteries operating in secondary
reserve market HP SRMl − CAPEXl and horizon profit of operating EV in the
same market, but with limited hours of commitment HPEVl .
Mentioned comparison resulted in 47 locations reaching higher 10-year profits
with 10% of population having EV, whereas 59 locations would achieve larger
monetary benefit with installed storage units. Economic indicators are shown in
the last row of Tab. 15 under the name of “OPT” problem.
85 M. Sisovs, “Distributed BESS in Retail Electricity Market”
6.4 Cost-Benefit Analysis
This chapter converts obtained results of optimization into a brief cost-benefit
analysis for the purpose of project financial investigation under more realistic con-
ditions and determine the best investment strategy.
In this cost-benefit analysis the goal is to compare several investment perspec-
tives, evaluating those on a defined project horizon (10 years), calculating cash
flows for different annual discount rates. Discount rate stands for the interest rate
and measures the present value of future cash flows.
As a computational basis, 5 specific locations and their optimization results
have been studied: ones with most promising figures, when solving secondary re-
serve market problem, as demonstrated in Tab. 12. Moreover, those solutions have
been compared to the option of implementing EV V2G service solutions. In other
words, it has been determined whether V2G operation with 10% of population
driving EVs or investing in BESS would result in higher net-present value (NPV).
This term is calculated according to the following formula:
NPV =J∑j=0
Qj
(1 + i)j(43)
where:
J - is the horizon of the project in years,
Qj - cash flow during period j in e,
i - discount rate.
This computation requires prepared cash flow for the horizon period. For
brief analysis, 10-year time interval is assumed. Additionally, cash flow requires
dividing fixed and variable costs. Even though the results of the optimization are
quite straightforward, several alterations have been made when transmitting the
number from Tab. 12 to cash flow tables.
Primarily, battery wear cost has been excluded. Instead, an investment at its
EOL has been implemented, yielding Ccapexl × δrepj , where j is the year of EOL and
δrepj expression is inherited from Eq. (42). That implementation refers to battery
owner purchasing new storage unit, when the old has reached its EOL. The pur-

M. Sisovs, “Distributed BESS in Retail Electricity Market” 86
chase price is reduced due to large-scale technology development and deployment
[14].
Secondarily, a small operation and maintenance cost has been implemented.
This cost is measured in e/kW/year and, as mentioned in [18, 50], may be esti-
mated at around 14 e/kW/year.
Taking into account mentioned above, the annual cash flow Qj for certain loca-
tion may be computed, using the indices from previous chapters and the operation
cost, which shall be marked with Ropl . Eq. (44) demonstrates the computation.
Qj = 2 ∗ (Rsrml +Risre
l + C loadl −Rdam
l −
−Rdsrel )− dmax ∗NSU
l ∗Ropl − C
capexl,j
(44)
The term Ccapexl,j is non-zero at year 0, when the first investment is made; and
also at EOL, when the investment yields Ccapexl × δrepj , as mentioned previously.
Other terms are withdrawn from optimization results and are assumed to repeat
every further year of the project horizon. Deepened implementation of variable
market prices and load might be valuable, but, unfortunately, will remain out of
the scope of this project.
An example of cash flow computation is presented in Appendix B, where cash
flow components are demonstrated for every year j. Mentioned example regards
the investment of BESS implementation in neighbourhood l23 with secondary
reserve market operations. Investment is made at year 0 and at year 7, because
the battery reaches its EOL after 7,55 years (shown in Tab. 12).
Once the annual cash flow Qj is obtained, it may be proceeded to the NPV
computation from Eq. (43). A range of discount rates i is assumed, varying from
7% to 12%.
The cost-benefit analysis is extended to evaluate NPVs in all locations from
Tab. 12. The results in terms of NPV justify the business case perspective of BESS
installation. Those results are posteriorly compared to the NPVs of EV problems’
solutions in same locations. Figure 33 visualises the results of that comparison.
From the graph, one may conclude that the business of adapting V2G opera-
tions in Location-23 (l23) provides the largest NPV, followed by BESS investment
in Location-8 (l8). Moreover, it is noticeable that with higher values of the dis-
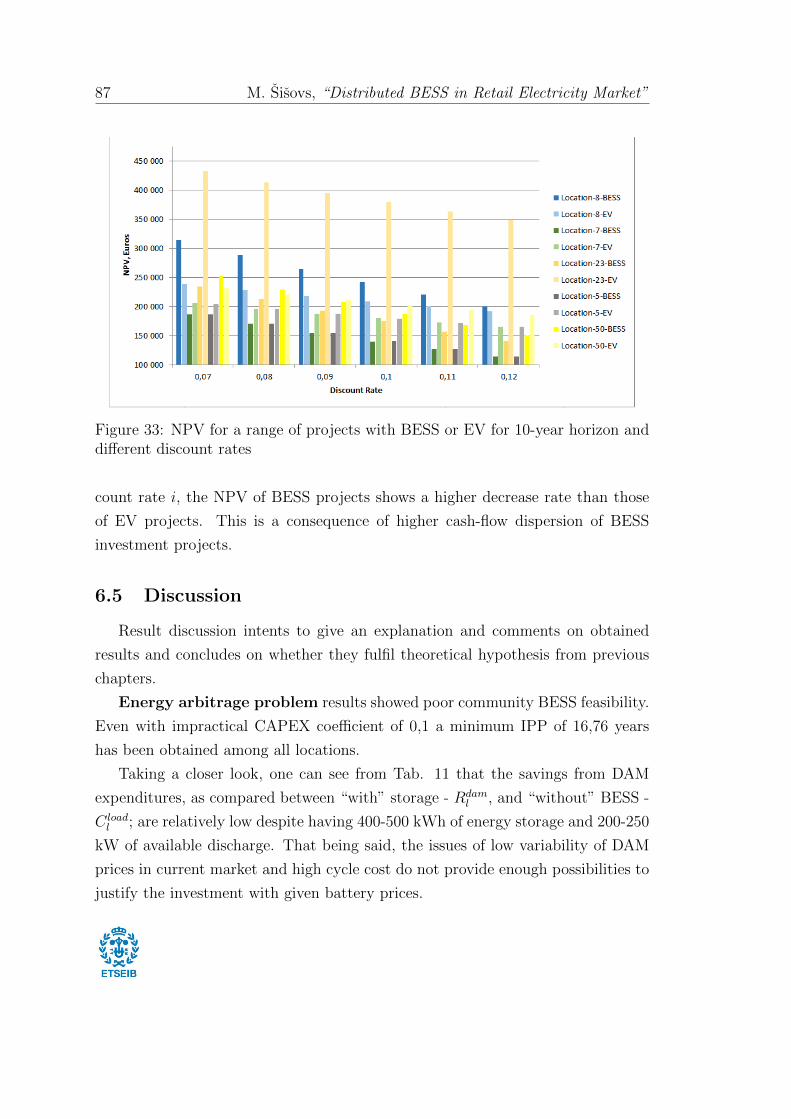
87 M. Sisovs, “Distributed BESS in Retail Electricity Market”
Figure 33: NPV for a range of projects with BESS or EV for 10-year horizon anddifferent discount rates
count rate i, the NPV of BESS projects shows a higher decrease rate than those
of EV projects. This is a consequence of higher cash-flow dispersion of BESS
investment projects.
6.5 Discussion
Result discussion intents to give an explanation and comments on obtained
results and concludes on whether they fulfil theoretical hypothesis from previous
chapters.
Energy arbitrage problem results showed poor community BESS feasibility.
Even with impractical CAPEX coefficient of 0,1 a minimum IPP of 16,76 years
has been obtained among all locations.
Taking a closer look, one can see from Tab. 11 that the savings from DAM
expenditures, as compared between “with” storage - Rdaml , and “without” BESS -
C loadl ; are relatively low despite having 400-500 kWh of energy storage and 200-250
kW of available discharge. That being said, the issues of low variability of DAM
prices in current market and high cycle cost do not provide enough possibilities to
justify the investment with given battery prices.

M. Sisovs, “Distributed BESS in Retail Electricity Market” 88
There has been a reference to mentioned problem in previous chapters, specifi-
cally, Figure 30 showed high cycle cost together with low price variance had made
BESS operation for arbitrage purposes highly unreasonable.
Factors, like transformer limitations, anti-anticipation constraints or unavail-
ability to sell energy to the pool barely affected result, when sensitivity optimiza-
tion had been run. Thus, for increased profitability, severe battery cost decrease
yet is required, along with suitable electricity market conditions, like price vari-
ability.
Such conclusion on energy arbitrage solution confirmed the hypothesis from
references [16, 17, 18] that stated the benefits from arbitrage are insufficient to
justify the investment.
BESS participation in secondary reserve markets showed feasible results
and quite promising IPP figures, with average per location of 5,75 years. 10-year
period ROI for a set of 106 locations has remained in the range between 109,27 %
and 309,32 %.
Solutions demonstrated that the large share of profit is received from submit-
ting price-accepting bids for secondary reserve - Rsrml . This means the battery
owner gets paid for opportunity to supply at any time a certain amount of power
for ancillary services. With values of discharge reaching 250 kW for 5-unit BESS,
daily profits are noticeably higher than those of energy arbitrage.
Despite having promising feasibility figures, distributed storage utilisation for
secondary regulation is not permitted by several electrical system juridical articles.
Firstly, this service initially is intended only for power generation units. Secondly,
participants of this market must comply to a range of requirements regarding
communication to AGC and minimum bid size (5 MW). It is extremely doubtable
that a conjunction of neighbourhood may be identified as one generation unit.
This concludes on implementation of secondary reserve market operation being
unacceptable due to local regulations, but quite promising in its financial perspec-
tive.
Some countries in Europe are more actively deploying renewable energy, non-
carbon power systems and electric vehicles. For instance, in Germany, a wide
range of participants may bid in regulation market, including wind and solar power
plants. This enlarges the potential market of generation-coupled batteries and big-

89 M. Sisovs, “Distributed BESS in Retail Electricity Market”
scale storage facilities. Thanks to fast response time, batteries are an exceptional
provider of primary control, which is unavailable for renewables.
Domestic storage, on the other hand, is expected to play a significant role
in reducing pressure on transmission systems with peak-shaving and time-shift
operations, though currently not being found economically feasible [69].
EV problem is of a particular interest, since Spanish government is working
towards promotion of electric vehicles by incentives and subsidies for EV buyers
[70]. Additionally, it is said that 1 million EVs may be adopted by electric system
without further grid investment [70].
Grid-connected vehicles may provide additional services, but their technical ca-
pabilities remain questionable. Apart from that, the impact to the load profiling
of high amount of EVs is hard to estimate. Despite that, electricity companies
would benefit from acquisition of EVs by their customers. Taking into account
“zero” investment, an increase of profits from reserve market or solely arbitrage
is indisputable. Higher EV penetration will transform EV into an important grid
stability and renewable energy integration player. This promises the evolution of
additional storage-related markets, where storage-owning companies and particu-
lars might obtain a range of economic benefits.
High technical and economic potential of V2G regulatory strategies in Ger-
many is mentioned in [71]. The paper demonstrates profitability in primary and,
especially, negative6 secondary control ancillary. During the night, the demand
for such reserves is high due to low electricity consumption, which offers a high
potential for “free charging”. From the system point of view, such utilization is
preferable to generation unit production decrease. Clearly, with higher penetration
of renewables, the requirements for mentioned services will increase.
A study, conducted in [72] had arrived to the same conclusions. Moreover, it
had pointed out that German system operators require certain reserve availability
time of EV-connected mode; and that detailed and accurate analysis requires the
study of individual driving patterns.
T&D deferral and outage reduction, according to possible estimations,
may save somewhat investment in project horizon, thanks to BESS, but a total of
34 323,68 e over 10 year period seem of a little significance. Clearly, transmission
6Means providing the opportunity to withdraw the energy from the grid.

M. Sisovs, “Distributed BESS in Retail Electricity Market” 90
maintenance cost and additional reliability issues that may be solved by BESS are
not considered in this study. Ultimately, these costs are highly case-dependent
and require wider system perspective.

91 M. Sisovs, “Distributed BESS in Retail Electricity Market”
7 Conclusions
This thesis project assessed the problem of feasibility of distributed BESS. A
theoretical discussion went along with development of optimization model, followed
by combining obtained knowledge in creating an optimization tool. The tool is
meant to schedule energy trading between market, consumer and BESS throughout
given period of time under specified conditions.
Performed investigation consisted of three main points: working on smart meter
data to define possible load profiles of electricity consumption; study the function-
ality principles of electricity markets and regulations regarding energy storage; and
perform a brief benchmark of technological battery solutions.
The practical part combined obtained data into a equation-defined optimization
model, with a range of parameters, variables, constraints and objective functions.
The model has been implemented in SAS/OR c© [67] software with specifications
subject to different problems.
Results demonstrated low feasibility of energy arbitrage problem, but rather
promising numbers of secondary reserve problem. Electric vehicle V2G opera-
tion alternative allows benefiting to electricity companies due to absence of direct
CAPEX (except for costs of advanced metering and communication technologies).
T&D deferral and outage reduction may act as additional values for BESS owners,
postponing and saving unnecessary expenditures.
It has been discussed that practical implementation is highly subject to local
policies and regulation, which remain quite restrictive in terms of battery storage in
distribution grids in Spain. However, country’s governments is realising incentives
towards EV acquisition, thus, boosting the development of charging systems and
engaging big energy players to adapt innovative Smart Grid solutions.
Implementation of such solutions is of high importance on the way towards
Smart Grids and non-carbon future. Batteries with their decreasing costs and
growing market penetration are expected reach parity and be used on a wide-
scale, reshaping current standards of power systems and electricity markets.

M. Sisovs, “Distributed BESS in Retail Electricity Market” 92
References
[1] Operador del Mercado Iberico Espanola. Available: http://www.omie.es/
inicio.
[2] Red Electrica de Espana (REE) and Sistema de Informacion del Operador del
Sistema (ESIOS). La Informacion Resultante de los Procesos de Operacion
del Sistema Electrico. Available: https://www.esios.ree.es/es.
[3] D. R. Biggar and M. R. Hesamzadeh. The Economics of Electricity Markets.
IEEE Press and John Wiley & Sons Ltd., 2014.
[4] Energy Storage: Technology Roadmap. Technical report, International Energy
Agency, 9 rue de la Federation 75739 Paris Cedex 15, France, 2014.
[5] Battery Storage for Renewables: Market Status and Technology Out-
look. Technical report, International Renewable Energy Agency (IRENA),
January 2015. Available: http://www.irena.org/documentdownloads/
publications/irena_battery_storage_report_2015.pdf.
[6] D. Rastler. Electricity Energy Storage Technology Options. Technical report,
Electric Power Research Institute (EPRI), December 2010.
[7] Market Data: Advanced Batteries for Utility-Scale Energy Storage. Technical
report, Navigant Research, 2015.
[8] The Spanish Electricity System Preliminary Report 2015. Technical report,
Red Electrica de Espana, P. del Conde de los Gaitanes, 177, 28109 Alcoben-
das, Madrid, Spain, 2015. Available: www.ree.es.
[9] The Potential Benefits of Distributed Generation and the Rate-Related Issues
That May Impede Its Expansion. Technical report, The United States De-
partment of Energy (DOE), 2007.
[10] O. L. d’Ortigue, A. Whiteman, and S. Elsayed. Renewable Energy Capacity
Statistics 2015. Technical report, International Renewable Energy Agency
(IRENA), 2015.

93 M. Sisovs, “Distributed BESS in Retail Electricity Market”
[11] Electrical Energy Storage: White Paper. Technical report, International Elec-
trotechnical Comission (IEC), 3 Rue de Varembe, Geneva, Switzerland, 2011.
Available: http://www.iec.ch.
[12] R. Kempener and G. de Vivero. Renewables and Electricity Stor-
age: A Technology Roadmap for REmap 2030. Technical re-
port, International Renewable Energy Agency (IRENA), 2015. Avail-
able: https://www.irena.org/DocumentDownloads/Publications/IRENA_
REmap_Electricity_Storage_2015.pdf.
[13] Energy Policies of IEA Countries: Spain 2015 Review. International Energy
Agency (IEA) Publications, 9, rue de la Federation, 75739 Paris cedex 15,
July 2015.
[14] Lazard. Lazard’s Levelized Cost of Storage Analysis - Version 1.0. Technical
report, Lazard, November 2015.
[15] Red Electrica de Espana (REE) and Wiley Publishing Inc. La Operacion del
Sistema Electrico. Avda. Diagonal 662-664 08034, Barcelona, Spain, April
2014.
[16] R. Arghandeh, J. Woyak, A. Onen, J. Jung, and R. Broadwater. Economic
Optimal Operation of Community Energy Storage Systems in Competitive En-
ergy Markets, 2014.
[17] M. Kintner-Meyer, P. Balducci, W. Colella, M. Elizondo, C. Jin, T. Nguyen,
V. Viswanathan, and Y. Zhang. National Assessment of Energy Storage for
Grid Balancing and Arbitrage. Technical Report Phase 1, WECC, Pacific
NorthWest National Laboratory, Richland, Washington 99352, USA, June
2012. for the United States Department of Energy.
[18] H. Asgeirsson. DTE Energy Advanced Implementation of Energy Storage
Technologies. Technology performance, DTE Energy, Detroit, MI 48226, USA,
2015.
[19] J. Heredia, J. Riera, M. Mata, J. Escuer, and J. Romeu. Economic Analysis
of Battery Electric Storage Systems Operating in Electricity Markets. Lisbon:

M. Sisovs, “Distributed BESS in Retail Electricity Market” 94
Institute of Electrical and Electronics Engineers (IEEE), pages 1–5, 2015.
2015 12th International Conference on the European Energy Market (EEM).
[20] T. D. Hardy. Economic Applications for Energy Storage. Submitted to the
Department of Electrical Engineering and Computer Science and the faculty
of the Graduate School of Wichota State University, July 2014.
[21] A. Akhil, G. Huff, A. Currier, and et al. DOE/EPRI 2013 Electricity Storage
Handbook in Collaboration with NRECA. Unlimited Release. Sandia Na-
tional Laboratories, Albuquerque, New Mexico and Livermore, Canada, July
2013.
[22] SAFT. Energy Storage Solutions. SAFT Batteries. A Market Brochure of
Technological Overview.
[23] Tesla. Overview of the “Powerpack” Technology. Available: https://www.
tesla.com/powerpack.
[24] C. Flath, D. Nicolay, T. Conte, C. van Dinther, and L. Filipova-Neumann.
Cluster Analysis of Smart Metering Data: An Implementation in Practice.
Business & Information Systems Engineering, pages 31–39, January 2012.
[25] I. Dent, T. Graig, U. Aickelin, and T. Rodden. Variability of Behaviour in
Electricity Load Profile Clustering; Who Does Things at the Same Time Each
Day?, 2013.
[26] M. Hayn, V. Bertsch, and W. Fichtner. Electricity Load Profiles in Europe:
The Importance of Household Segmentation. Energy Research & Social Sci-
ence, 3:30–45, July 2014.
[27] I. Dent, U. Aickelin, and T. Rodden. The Application of a Data Mining
Framework to Energy Usage Profiling in Domestic Residences Using UK Data.
In ”Buildings Don’t Use Energy, People Do?” - Domestic Energy Use and CO2
Emissions in Existing Dwellings. University of Nottingham, June 2011.
[28] RStudio. R-Studio c© software, 2016. 250 Northern Ave, Boston, MA 02210,
Available: https://www.rstudio.com/about/.

95 M. Sisovs, “Distributed BESS in Retail Electricity Market”
[29] J. A. Hartigan and M. A. Wong. Algorithm AS 136: A K-Means Clustering
Algorithm. Journal of Royal Statistical Society. Series C (Applied Statistics),
28(1):100–108, 1979. Available: http://www.jstor.org/stable/2346830.
[30] X. Liu, L. Golab, W. Golab, and I. F. Ilyas. Benchmarking Smart Meter Data
Analytics. In Advances in Database Technology - EDBT 2015, pages 385–396,
Canada, March 2015. University of Waterloo, OpenProceedings.org, ISBN:
978-3-89318-067-7. Available: OpenProceedings.org.
[31] The Soft Grid 2013-2020: Big Data and Utility Analytics for Smart Grid.
Technical report, Greentech Media Research, 2013. Available: http://www.
greentechmedia.com/research/report/the-soft-grid-2013.
[32] Infomre de Supervision del Mercado Peninsular Mayorista al Contado de Elec-
tricidad. Technical report, Comision Nacional de los Mercados y la Compe-
tencia, April 2014. Available: http://www.cnmc.es.
[33] European Parliament and the Council of the European Union. Directive Con-
cerning Common Rules for the Internal Market in Electricity and Repealing.
Official Journal of European Union, 1(211):55–92, July 2009.
[34] Energy Storage: Which Market Designs and Regulatory Incentives are
Needed? Technical report, European Parliament and Directorate-general
for Internal Policies, 2015. Study for the ITRE Committee.
[35] Framework Guidelines on Electricity Balancing. Agency for the Cooperation
of Energy Regulators, Trg Republike 3, 1000 Ljubljana, Slovenia, September
2012.
[36] ENTSO-E Network Code on Electricity Balancing. Technical Report 3, The
European Network of Transmission System Operators in Electricity, Avenue
Cortenbergh 100, 1000 Brussels, Belgium, August 2014.
[37] Annual Report to the Agency for the Cooperation of Energy Regulators and
to the European Commission on Regulatory Activities and the Fulfillment of
Duties of the Italian Regulatory Authority for Electricity and Gas. Technical

M. Sisovs, “Distributed BESS in Retail Electricity Market” 96
report, The Italian Regulatory Authority for Electricity and Gas (AEEG),
July 2012.
[38] M. Stone. Is Irelands Energy Storage Market Awakening? by Greentech
Media, April 2015. Available: http://www.greentechmedia.com/articles/
read/irelands-energy-storage-awakening.
[39] stoRE Project. Analisis del marco regulatorio y de Mercado en Espana. in
Facilitating Energy Storage to Allow High Penetration of Intermittent Re-
newable Energy.
[40] Boletın Oficial del Estado. Medidas relativas a los sectores energeticos, April
2010. Suplemento del BOE num. 89, Capıtulo V.
[41] Boletın Oficial del Estado. El que se Regula la Conexion a Red de Instalaciones
de Produccion de Energıa Electrica de Pequena Potencia, December 2011.
Suplemento del BOE num. 295.
[42] J. Deign. Spains New Self-Consumption Law Makes Batter-
ies Impractical for Homeowners. by Greentech Media, October
2015. Available: http://www.greentechmedia.com/articles/read/
spanish-self-consumption-law-allows-batteries-at-a-cost.
[43] A. W. Thompson. For the Permittance of Renewables in the Spanish Sec-
ondary Reserves Market. Master’s thesis, Universidad Pontificia Comillas,
January 2015.
[44] R. Walawalkar, J. Apt, and R. Mancini. Economics of Electric Storage for
Energy Arbitrage and Regulation in New York. Energy Policy, 35:2558–2568,
November 2006.
[45] X. Luo, J. Wang, M. Dooner, and J. Clarke. Overview of current development
in electrical energy storage technologies and the application potential in power
system operation. Applied Energy, 1(137):511–536, October 2014.
[46] S. Jaffe and K. A. Adamson. Advanced Batteries for Utility-
Scale Energy Storage. Navigant Consulting, 2014. Boulder, CO,

97 M. Sisovs, “Distributed BESS in Retail Electricity Market”
USA, Available: http://www.navigantresearch.com/research/
advanced-batteries-for-utility-scale-energy-storage.
[47] A. Malhotra, B. Battke, M. Beuse, A. Stephan, and T. S. and Schmidt. Use
cases for stationary battery technologies: A review of the literature and exist-
ing projects. Renewable and Sustainable Energy Reviews, 56:705–721, 2016.
[48] M. Rawson. SMUD Storage Strategy and R&D Program, January
2012. Available: http://www1.eere.energy.gov/solar/pdfs/hpsp_smud_
storage_program.pdf.
[49] Enedis. NICE GRID project in Carros (Southern France): Low Volt-
age Grid Batteries (LVGB), September 2014. Available: http://www.
energystorageexchange.org/projects/1598.
[50] S&C. S&c electric company, 2016. Available: http://www.sandc.com/
products/energy-storage/ces.asp.
[51] BYD Company. BYD Modular System Design, 2013. Available: http://www.
byd.com/energy/ess.html.
[52] 50 kW / 60 kWh Energy Storage System - BYD Project, December 2012.
Available: http://www.energystorageexchange.org/projects/178.
[53] SDG&E Century Park DESS Project, January 2011. Available: http://www.
energystorageexchange.org/projects/130.
[54] New York Power Authority (NYPA). La Guardia Airport Avis Car Rental
- Green Charge Networks Project, January 2013. Available: http://www.
energystorageexchange.org/projects/143.
[55] Y. Li and P. C. Flynn. Deregulated Power Prices: Comparison of Diurnal
Patterns. Energy Policy, 32(5):657–672, March 2004.
[56] Deregulated Power Prices: Comparison of Volatility. energy Policies,
32(14):1591–1601, September 2004.
M. Sisovs, “Distributed BESS in Retail Electricity Market” 98
[57] M. B. C. Salles, M. J. Aziz, and W. W. Hogan. Potential Arbitrage Revenue of
Energy Storage Systems in PJM During 2014. Harvard University, Cambridge,
USA, 2015.
[58] J. Remillard, M. Rovito, A. J. Hill, and C. Mastro. The Potential Role of Dis-
tributed Facility-Scale Energy Storage Technologies in Managing Utility-Scale
Power Demands. ACEEE Summer Study on Energy Efficiency in Buildings,
3:233–244, 2014.
[59] Boletın Oficial del Estado. Servicio Complementario de Regulacion Secun-
daria, May 2006. Suplemento del BOE num. 128.
[60] A. Carbajo. Los Mercados Electricos y los Servicios de Ajuste del Sistema.
Revista Economia Industrial, 1(364):55–62, 2007.
[61] Benchmarking Report 5.2 on the Continuity of Electricity Supply, Data Up-
date. Technical report, Council of European Energy Regulators (CEER),
February 2015.
[62] Boletın Oficial del Estado. Normativas sobre contratacion, lectura y fac-
turacion, obligaciones y derechos, acceso, calidad y suspension del suministro.
Suplemento del BOE num. 133.
[63] D. C. Cervero. Valoracion de la Fiabilidad de una Red Electrica de Dis-
tribucion. Master’s thesis, Escuela Tecnica Superior de Ingenieros de Minas,
September 2012.
[64] Gobierno de Espana and Ministerio de Industria Energıa y Turismo. Estrategia
de Impulso del vehıculo con energıas alternativas (VEA) en Espana (2014-
2020), 2015.
[65] Multiple EV manufacturers. Most popular full-electric vehicle battery capac-
ities, 2010-2016. Available: https://en.wikipedia.org/wiki/Electric_
vehicle_battery#Battery_capacity.
[66] P. Stenquist. Tesla Model S Offers a Lesson in Electric-
Vehicle Economics. New York Times, June 2012. Avail-
able: http://wheels.blogs.nytimes.com/2012/06/25/

99 M. Sisovs, “Distributed BESS in Retail Electricity Market”
tesla-model-s-offers-a-lesson-in-electric-vehicle-economics/
?ref=automobiles&_r=0.
[67] SAS Institute Inc. Sas/or c©, 2010. Available: http://www.sas.com/en_us/
software/analytics/sas-or.
[68] SAS Institute Inc. SAS/OR c© 9.3 Users Guide: Mathematical Programming.,
2011. Cary, NC: SAS Institute Inc.
[69] J. Deign. Germany’s power market reforms provide plat-
form for storage growth. Energy Storage Update, September
2015. Available: http://analysis.energystorageupdate.com/
germanys-power-market-reforms-provide-platform-storage-growth.
[70] J. P. Laguna Gomez. Spanish Policy with Regard to Electric Vehicles: Direct
Granting of Subsidies for Electric Vehicle Purchase in 2011. Workshop on
Electric Vehicles, June 2011. Available: http://www.theicct.org/sites/
default/files/Spain.pdf.
[71] D. Dallinger, D. Krampe, and M. Wietschel. Vehicle-to-Grid Regulation Re-
serves Based on a Dynamic Simulation of Mobility Behavior. IEEE Transac-
tions on Smart Grid, 2(2):302–313, June 2011.
[72] A. Schuller and F. Rieger. Assessing the Economic Potential of Electric Ve-
hicles to Provide Ancillary Services: The Case of Germany. Workingpaper
Preprint submitted to ZfE, June 2013.

M. Sisovs, “Distributed BESS in Retail Electricity Market” 100
A Appendix: Complete Optimization Results
A.1 Energy Arbitrage Problem
Table 16: Energy arbitrage problem results (sorted ascending by IPP)
Location Ncycl Rdam
l Rwearl Cload
l Ccapexl EOL TPPl IPPl NSU
l
Location-23 250,45 18 856,85 329,47 19 987,39 26 846,55 9,98 801,07 16,76 5
Location-8 214,42 9 605,80 238,18 10 429,20 22 669,70 11,66 585,22 19,37 4
Location-94 161,52 10 595,71 212,48 11 480,93 26 846,55 15,48 672,74 19,95 5
Location-50 209,01 8 240,75 232,17 9 040,03 22 669,70 11,96 567,11 19,99 4
Location-66 161,88 9 524,99 212,95 10 402,82 26 846,55 15,44 664,87 20,19 5
Location-100 158,60 7 848,91 208,63 8 701,95 26 846,55 15,76 644,41 20,83 5
Location-48 157,98 7 694,04 207,82 8 542,49 26 846,55 15,83 640,63 20,95 5
Location-4 181,29 8 333,95 201,38 9 066,08 22 669,70 13,79 530,76 21,36 4
Location-7 174,03 7 031,39 193,32 7 754,92 22 669,70 14,37 530,22 21,38 4
Location-5 170,94 6 460,44 189,88 7 179,58 22 669,70 14,62 529,25 21,42 4
Location-61 176,17 7 682,36 195,69 8 406,47 22 669,70 14,19 528,42 21,45 4
Location-11 154,50 6 802,12 203,24 7 626,35 26 846,55 16,18 620,99 21,62 5
Location-60 181,07 7 828,47 201,14 8 552,65 22 669,70 13,81 523,05 21,67 4
Location-68 172,93 6 937,33 192,09 7 650,13 22 669,70 14,46 520,71 21,77 4
Location-67 168,34 6 208,79 187,00 6 912,42 22 669,70 14,85 516,63 21,94 4
Location-10 175,52 6 620,45 194,97 7 326,13 22 669,70 14,24 510,71 22,19 4
Location-75 148,61 6 231,10 195,50 7 030,77 26 846,55 16,82 604,17 22,22 5
Location-69 169,67 6 043,18 188,47 6 741,69 22 669,70 14,73 510,04 22,22 4
Location-104 164,85 5 166,99 183,12 5 833,14 22 669,70 15,17 483,03 23,47 4
Location-63 172,52 5 914,17 191,63 6 586,37 22 669,70 14,49 480,56 23,59 4
Location-43 118,29 5 543,51 131,40 6 153,59 22 669,70 21,13 478,69 23,68 4
Location-44 118,47 5 631,64 131,60 6 239,47 22 669,70 21,10 476,24 23,80 4
Location-76 118,37 5 602,28 131,48 6 209,86 22 669,70 21,12 476,10 23,81 4
Location-49 117,39 5 968,44 130,39 6 573,80 22 669,70 21,30 474,97 23,86 4
Location-64 119,45 5 056,94 132,68 5 660,59 22 669,70 20,93 470,96 24,07 4
Location-18 118,82 5 646,22 131,98 6 248,16 22 669,70 21,04 469,96 24,12 4
Location-35 119,64 4 951,55 132,90 5 553,31 22 669,70 20,90 468,86 24,18 4
Location-55 119,14 4 931,62 132,34 5 531,77 22 669,70 20,98 467,80 24,23 4
Location-62 119,35 4 829,41 132,57 5 429,73 22 669,70 20,95 467,74 24,23 4
Location-24 119,07 5 370,64 132,26 5 970,60 22 669,70 21,00 467,71 24,23 4
Location-82 118,61 4 473,62 131,76 5 064,40 22 669,70 21,08 459,02 24,69 4
Location-103 117,99 4 269,78 131,06 4 859,43 22 669,70 21,19 458,58 24,72 4
Location-81 113,85 5 266,30 126,46 5 846,46 22 669,70 21,96 453,69 24,98 4
Location-1 118,33 4 257,66 131,44 4 841,27 22 669,70 21,13 452,17 25,07 4
Location-39 120,33 4 889,13 133,66 5 474,88 22 669,70 20,78 452,09 25,07 4
Location-3 160,46 4 647,26 178,24 5 274,60 22 669,70 15,58 449,09 25,24 4
Location-54 117,97 4 134,85 131,05 4 713,39 22 669,70 21,19 447,49 25,33 4
Location-21 117,27 4 072,76 130,27 4 649,69 22 669,70 21,32 446,66 25,38 4
Location-41 117,39 3 981,16 130,40 4 556,19 22 669,70 21,30 444,63 25,49 4
Location-102 117,82 4 127,41 130,88 4 702,69 22 669,70 21,22 444,40 25,51 4
Location-16 116,77 3 893,03 129,71 4 465,69 22 669,70 21,41 442,94 25,59 4
Location-6 117,59 4 054,74 130,62 4 627,87 22 669,70 21,26 442,51 25,62 4

101 M. Sisovs, “Distributed BESS in Retail Electricity Market”
Location Ncycl Rdam
l Rwearl Cload
l Ccapexl EOL TPPl IPPl NSU
l
Location-40 117,45 3 976,21 130,47 4 548,68 22 669,70 21,28 442,00 25,64 4
Location-17 115,83 3 757,89 128,66 4 326,71 22 669,70 21,58 440,16 25,75 4
Location-65 114,72 5 214,99 127,43 5 781,40 22 669,70 21,79 438,98 25,82 4
Location-105 117,15 3 907,42 130,13 4 473,93 22 669,70 21,34 436,39 25,97 4
Location-47 115,14 3 573,63 127,90 4 137,52 22 669,70 21,71 436,00 26,00 4
Location-84 116,39 3 777,31 129,29 4 342,05 22 669,70 21,48 435,46 26,03 4
Location-79 116,04 4 801,80 128,90 5 361,56 22 669,70 21,54 430,86 26,31 4
Location-96 142,23 5 310,36 128,89 5 789,73 18 492,85 17,58 350,49 26,38 3
Location-42 112,74 3 295,29 125,24 3 837,50 22 669,70 22,17 416,97 27,18 4
Location-37 113,06 3 272,24 125,59 3 811,73 22 669,70 22,11 413,91 27,39 4
Location-56 111,27 3 074,24 123,60 3 611,23 22 669,70 22,47 413,39 27,42 4
Location-46 109,53 2 845,59 121,67 3 367,14 22 669,70 22,82 399,88 28,35 4
Location-59 107,37 2 721,01 119,26 3 235,45 22 669,70 23,28 395,17 28,68 4
Location-15 132,93 3 195,14 120,46 3 636,21 18 492,85 18,81 320,61 28,84 3
Location-45 104,54 2 495,15 116,12 2 994,70 22 669,70 23,91 383,42 29,56 4
Location-73 104,47 2 469,53 116,05 2 968,83 22 669,70 23,93 383,24 29,58 4
Location-86 102,54 2 337,62 113,90 2 827,95 22 669,70 24,38 376,43 30,11 4
Location-101 117,94 2 387,98 106,87 2 800,96 18 492,85 21,20 306,10 30,21 3
Location-83 117,84 2 379,06 106,78 2 789,57 18 492,85 21,22 303,74 30,44 3
Location-38 113,00 2 113,42 102,40 2 511,49 18 492,85 22,12 295,66 31,27 3
Location-93 114,50 2 250,01 103,75 2 646,50 18 492,85 21,83 292,73 31,59 3
Location-98 123,60 2 480,58 112,00 2 883,72 18 492,85 20,23 291,15 31,76 3
Location-74 112,43 2 104,13 101,88 2 494,82 18 492,85 22,24 288,80 32,02 3
Location-97 110,48 2 027,70 100,11 2 416,59 18 492,85 22,63 288,78 32,02 3
Location-51 109,42 1 852,08 99,15 2 235,08 18 492,85 22,85 283,85 32,57 3
Location-99 109,27 1 951,52 99,01 2 331,96 18 492,85 22,88 281,43 32,86 3
Location-53 103,16 1 643,24 93,48 2 000,63 18 492,85 24,23 263,91 35,04 3
Location-77 102,10 1 607,60 92,52 1 963,45 18 492,85 24,49 263,33 35,11 3
Location-36 100,27 1 507,61 90,86 1 856,14 18 492,85 24,93 257,66 35,89 3
Location-91 97,32 1 401,34 88,19 1 744,87 18 492,85 25,69 255,34 36,21 3
Location-85 80,52 1 222,54 89,44 1 605,35 22 669,70 31,05 293,37 38,64 4
Location-80 82,05 1 285,42 91,15 1 666,95 22 669,70 30,47 290,38 39,03 4
Location-89 88,77 1 173,80 80,44 1 484,55 18 492,85 28,16 230,31 40,15 3
Location-12 87,47 1 111,49 79,26 1 414,81 18 492,85 28,58 224,07 41,27 3
Location-57 85,08 1 081,02 77,09 1 377,25 18 492,85 29,38 219,14 42,19 3
Location-13 81,77 955,35 74,09 1 241,81 18 492,85 30,58 212,37 43,54 3
Location-78 82,09 967,91 74,38 1 253,45 18 492,85 30,46 211,16 43,79 3
Location-90 81,58 946,01 73,92 1 227,00 18 492,85 30,65 207,08 44,65 3
Location-52 73,25 748,42 66,37 1 005,60 18 492,85 34,13 190,81 48,46 3
Location-27 80,96 627,60 56,79 818,95 14 316,00 30,88 134,55 53,20 2
Location-9 80,65 634,71 56,57 823,80 14 316,00 31,00 132,51 54,02 2
Location-88 77,83 584,02 54,60 762,69 14 316,00 32,12 124,07 57,69 2
Location-87 50,77 271,86 35,61 406,43 14 316,00 49,24 98,96 72,33 2
Location-32 74,99 329,36 37,26 423,28 10 139,15 33,34 56,67 89,46 1
Location-22 50,21 321,39 35,22 433,98 14 316,00 49,79 77,37 92,52 2
Location-29 69,39 281,20 34,47 366,50 10 139,15 36,03 50,83 99,74 1
Location-26 64,58 246,64 32,09 327,04 10 139,15 38,71 48,31 104,93 1
Location-58 61,16 229,21 30,39 301,39 10 139,15 40,87 41,79 121,30 1
Location-30 57,06 213,61 28,35 283,04 10 139,15 43,81 41,07 123,43 1

M. Sisovs, “Distributed BESS in Retail Electricity Market” 102
Location Ncycl Rdam
l Rwearl Cload
l Ccapexl EOL TPPl IPPl NSU
l
Location-31 55,39 205,72 27,52 274,13 10 139,15 45,13 40,88 124,00 1
Location-14 43,95 159,52 21,83 215,05 10 139,15 56,88 33,70 150,45 1
Location-33 47,31 161,54 23,51 218,57 10 139,15 52,84 33,53 151,20 1
Location-20 37,10 130,70 18,43 178,37 10 139,15 67,39 29,24 173,40 1
Location-70 29,68 86,48 14,75 130,30 10 139,15 84,23 29,08 174,35 1
Location-106 28,79 100,59 14,30 136,76 10 139,15 86,84 21,87 231,78 1
Location-34 27,78 96,36 13,80 131,76 10 139,15 90,01 21,60 234,68 1
Location-2 22,81 79,11 11,33 107,90 10 139,15 109,61 17,46 290,40 1
Location-95 18,99 61,66 9,43 88,38 10 139,15 131,66 17,28 293,38 1
Location-72 15,86 45,03 7,88 68,50 10 139,15 157,67 15,60 324,99 1
Location-25 20,87 75,64 10,37 101,20 10 139,15 119,77 15,19 333,74 1
Location-28 19,29 69,07 9,58 93,30 10 139,15 129,59 14,65 346,12 1
Location-92 14,44 52,82 7,17 71,06 10 139,15 173,13 11,07 457,94 1
Location-19 14,44 52,92 7,17 71,06 10 139,15 173,13 10,97 462,02 1
Location-71 9,00 30,69 4,47 42,51 10 139,15 277,71 7,34 690,80 1
A.2 Secondary Reserve Market Problem
Table 17: Secondary reserve market problem results (sorted ascending by IPP)
Location Ncycl
Rdaml Rwear
l Rdsrel Risre
l Rsrml Cload
l TPPl IPPl NSUl
Location-8 131,36 11 039,61 1 727,98 402,47 1 927,29 42 334,88 10 429,20 41 521,31 3,23 5
Location-7 113,10 7 957,50 1 024,88 297,47 958,81 27 045,69 7 754,92 26 479,57 3,49 3
Location-23 331,11 23 608,32 4 355,75 95,67 4 409,32 41 691,76 19 987,39 38 028,74 3,53 5
Location-5 197,41 7 663,50 1 788,85 462,02 1 626,16 26 841,61 7 179,58 25 732,99 3,59 3
Location-50 119,18 9 591,87 1 567,76 313,50 1 612,54 38 101,71 9 040,03 37 281,16 3,60 5
Location-10 167,82 8 001,96 1 520,68 294,96 1 471,72 26 483,32 7 326,13 25 463,57 3,63 3
Location-60 162,98 9 428,95 1 476,84 197,29 1 479,34 26 486,51 8 552,65 25 415,41 3,64 3
Location-67 160,52 7 759,35 1 454,53 218,22 1 441,97 25 548,19 6 912,42 24 470,49 3,78 3
Location-48 173,91 9 500,96 1 575,84 210,68 1 533,30 25 463,84 8 542,49 24 252,15 3,81 3
Location-66 170,37 11 256,35 1 543,80 260,75 1 534,50 25 155,34 10 402,82 24 031,76 3,85 3
Location-61 164,20 9 251,26 1 487,87 155,47 1 421,09 24 885,05 8 406,47 23 818,01 3,88 3
Location-3 200,37 5 769,14 1 815,65 486,55 1 691,72 24 348,99 5 274,60 23 243,97 3,98 3
Location-104 174,38 6 983,95 1 580,12 90,87 1 577,06 24 445,84 5 833,14 23 201,08 3,99 3
Location-68 175,87 8 522,96 1 593,66 236,76 1 554,90 24 301,38 7 650,13 23 153,02 3,99 3
Location-11 172,18 8 350,25 1 560,21 241,11 1 476,13 24 052,14 7 626,35 23 003,04 4,02 3
Location-75 172,05 8 080,24 1 559,05 86,17 1 493,24 23 842,19 7 030,77 22 640,74 4,08 3
Location-69 172,32 7 612,48 1 561,44 191,02 1 485,35 23 704,16 6 741,69 22 566,27 4,10 3
Location-4 212,50 9 170,38 1 490,63 349,39 1 010,80 17 462,89 9 066,08 16 529,37 4,33 2
Location-94 181,15 12 515,63 1 641,45 98,94 1 532,62 20 536,28 11 480,93 19 293,82 4,79 3
Location-47 114,31 3 808,07 801,84 293,46 460,27 14 131,95 4 137,52 13 826,39 5,18 2
Location-52 97,37 844,49 683,06 250,78 470,61 14 066,88 1 005,60 13 764,75 5,20 2
Location-31 131,02 449,76 919,06 229,38 787,87 14 105,37 274,13 13 569,16 5,28 2
Location-35 142,31 5 572,14 998,29 271,77 780,22 14 042,42 5 553,31 13 533,75 5,29 2
Location-27 137,64 929,88 965,50 257,17 785,42 14 075,67 818,95 13 527,49 5,29 2
Location-15 138,40 3 732,55 970,87 251,69 802,52 14 032,46 3 636,21 13 516,08 5,30 2
Location-24 126,82 5 539,03 889,59 358,10 442,59 13 883,30 5 970,60 13 509,78 5,30 2
Location-46 112,05 3 041,93 786,04 306,95 413,85 13 849,76 3 367,14 13 495,82 5,30 2
Location-55 139,90 5 655,38 981,36 237,98 820,47 14 016,80 5 531,77 13 494,32 5,30 2
Location-39 140,71 5 605,99 987,03 238,21 829,48 13 991,05 5 474,88 13 464,19 5,32 2
Location-43 137,73 6 282,72 966,17 237,07 803,37 13 960,45 6 153,59 13 431,45 5,33 2
Location-63 243,32 7 534,21 1 706,87 95,82 1 303,26 14 848,84 6 586,37 13 401,58 5,34 2
Location-9 135,87 568,65 953,09 373,35 620,32 13 828,56 823,80 13 377,59 5,35 2
Location-19 140,61 335,56 986,36 205,77 888,20 13 921,14 71,06 13 352,72 5,36 2
Location-12 147,10 972,04 1 031,86 401,62 503,41 13 741,70 1 414,81 13 254,40 5,40 2
Location-22 88,45 375,59 620,49 237,06 497,85 13 520,62 433,98 13 219,30 5,41 2
Location-59 103,59 2 935,03 726,67 271,94 373,84 13 536,82 3 235,45 13 212,48 5,42 2
Location-51 114,16 1 869,93 800,79 299,22 403,06 13 495,80 2 235,08 13 164,00 5,44 2

103 M. Sisovs, “Distributed BESS in Retail Electricity Market”
Location Ncycl
Rdaml Rwear
l Rdsrel Risre
l Rsrml Cload
l TPPl IPPl NSUl
Location-6 209,01 3 792,95 1 466,20 587,01 497,52 13 538,20 4 627,87 12 817,42 5,58 2
Location-21 127,20 4 212,13 892,28 348,59 428,48 13 175,02 4 649,69 12 800,19 5,59 2
Location-62 111,95 5 082,67 785,29 272,52 372,99 13 112,57 5 429,73 12 774,80 5,60 2
Location-28 133,22 334,40 934,55 247,06 820,23 13 331,68 93,30 12 729,20 5,62 2
Location-16 138,10 4 565,12 968,73 263,43 762,65 13 293,74 4 465,69 12 724,80 5,63 2
Location-32 136,71 631,00 959,00 246,40 817,02 13 318,08 423,28 12 721,98 5,63 2
Location-36 142,00 2 019,31 996,13 243,66 814,80 13 242,23 1 856,14 12 654,08 5,66 2
Location-44 141,47 6 377,96 992,37 267,94 836,75 13 212,88 6 239,47 12 650,84 5,66 2
Location-45 115,17 2 677,95 807,87 331,28 445,70 13 022,84 2 994,70 12 646,14 5,66 2
Location-58 82,20 291,93 576,62 200,33 488,37 12 871,79 301,39 12 592,66 5,68 2
Location-56 141,96 3 795,10 995,79 250,50 841,51 13 163,31 3 611,23 12 574,65 5,69 2
Location-40 142,92 4 712,40 1 002,54 262,12 826,81 13 176,05 4 548,68 12 574,48 5,69 2
Location-20 139,69 466,05 979,89 221,52 863,28 13 195,96 178,37 12 570,15 5,69 2
Location-73 91,02 2 914,03 638,50 198,42 421,75 12 911,53 2 968,83 12 551,15 5,70 2
Location-57 91,79 1 230,20 643,87 237,45 435,05 12 840,23 1 377,25 12 541,01 5,71 2
Location-49 132,97 6 127,28 932,78 394,77 479,79 12 902,36 6 573,80 12 501,11 5,73 2
Location-74 95,61 2 456,28 670,70 195,92 466,28 12 837,40 2 494,82 12 475,60 5,74 2
Location-72 82,01 179,58 575,30 131,46 500,92 12 658,79 68,50 12 341,87 5,80 2
Location-76 94,24 6 104,69 661,09 198,74 435,67 12 620,76 6 209,86 12 301,78 5,82 2
Location-65 147,89 5 375,29 1 037,42 339,70 446,63 12 794,36 5 781,40 12 269,98 5,83 2
Location-80 132,43 2 017,00 929,00 146,02 799,65 12 870,49 1 666,95 12 245,08 5,85 2
Location-18 140,94 6 311,54 988,65 263,87 757,09 12 801,08 6 248,16 12 242,26 5,85 2
Location-26 137,50 536,02 964,51 232,22 829,01 12 760,77 327,04 12 184,08 5,87 2
Location-30 140,42 494,49 985,05 245,60 852,91 12 759,69 283,04 12 170,50 5,88 2
Location-54 146,11 4 864,59 1 024,91 252,71 796,85 12 763,88 4 713,39 12 131,90 5,90 2
Location-81 129,49 6 097,51 908,38 161,33 765,08 12 686,89 5 846,46 12 131,20 5,90 2
Location-38 146,11 2 713,75 1 024,90 230,33 828,69 12 732,98 2 511,49 12 104,17 5,91 2
Location-34 140,76 396,76 987,37 230,85 849,23 12 730,93 131,76 12 096,95 5,92 2
Location-64 143,76 5 251,44 1 008,48 337,09 423,13 12 595,03 5 660,59 12 081,74 5,92 2
Location-103 71,89 4 722,95 504,32 138,83 267,94 12 311,56 4 859,43 12 072,82 5,93 2
Location-42 148,02 4 053,52 1 038,37 227,61 820,89 12 732,62 3 837,50 12 071,52 5,93 2
Location-105 73,35 4 341,55 514,52 142,33 271,66 12 317,62 4 473,93 12 064,81 5,93 2
Location-14 145,24 496,59 1 018,81 234,64 878,96 12 720,75 215,05 12 064,72 5,93 2
Location-98 84,51 2 974,48 592,85 104,13 444,16 12 329,51 2 883,72 11 985,93 5,97 2
Location-97 92,51 2 522,74 648,97 116,07 480,75 12 358,88 2 416,59 11 968,46 5,98 2
Location-100 193,55 9 876,37 1 753,85 117,47 1 699,36 16 615,92 8 701,95 15 269,55 6,06 3
Location-2 139,73 333,65 980,15 247,35 854,96 12 410,47 107,90 11 812,17 6,06 2
Location-102 77,27 4 562,58 542,05 159,35 326,47 11 909,56 4 702,69 11 674,75 6,13 2
Location-88 131,74 1 182,36 924,15 87,60 810,74 12 290,66 762,69 11 669,99 6,13 2
Location-87 128,66 826,29 902,54 118,83 797,96 12 271,51 406,43 11 628,24 6,16 2
Location-99 91,29 2 451,44 640,36 138,53 488,19 11 973,06 2 331,96 11 562,88 6,19 2
Location-1 75,69 4 708,12 530,95 165,05 285,28 11 806,64 4 841,27 11 529,07 6,21 2
Location-83 126,95 3 106,67 890,55 144,26 751,20 11 994,80 2 789,57 11 394,10 6,28 2
Location-106 62,05 208,23 435,24 117,94 381,09 11 625,57 136,76 11 382,02 6,29 2
Location-82 124,09 5 354,98 870,46 150,71 716,07 11 913,03 5 064,40 11 317,35 6,32 2
Location-101 77,00 2 699,25 540,18 145,12 327,32 11 564,69 2 800,96 11 308,42 6,33 2
Location-92 96,33 290,96 675,75 123,05 611,63 11 532,64 71,06 11 125,57 6,43 2
Location-89 129,14 1 874,73 905,88 107,29 783,06 11 715,19 1 484,55 11 094,90 6,45 2
Location-71 90,41 202,28 634,18 155,36 539,39 11 429,51 42,51 11 019,59 6,50 2
Location-79 134,11 5 635,11 940,77 161,31 815,30 11 517,31 5 361,56 10 956,98 6,53 2
Location-91 127,81 2 128,89 896,56 125,20 766,27 11 450,41 1 744,87 10 810,89 6,62 2
Location-90 126,43 1 632,62 886,91 97,25 770,12 11 290,16 1 227,00 10 670,50 6,71 2
Location-96 90,45 5 840,80 634,51 150,04 474,42 10 971,20 5 789,73 10 610,01 6,75 2
Location-95 96,89 341,53 679,65 108,93 596,56 10 541,95 88,38 10 096,77 7,09 2
Location-29 173,54 541,93 862,18 129,32 503,92 7 772,43 366,50 7 109,42 7,13 1
Location-33 190,51 496,75 946,49 113,53 595,90 7 831,25 218,57 7 088,96 7,15 1
Location-13 188,75 1 466,09 937,75 115,40 561,91 7 785,27 1 241,81 7 069,77 7,17 1
Location-25 177,94 320,17 884,05 121,80 537,56 7 739,09 101,20 7 051,83 7,19 1
Location-37 192,34 4 016,99 955,56 121,20 544,37 7 754,42 3 811,73 7 016,77 7,22 1
Location-17 217,33 4 505,61 1 079,72 134,18 549,10 7 799,58 4 326,71 6 955,87 7,29 1
Location-53 201,13 2 214,05 999,23 115,51 556,74 7 720,90 2 000,63 6 949,48 7,29 1
Location-41 212,31 4 800,26 1 054,80 113,76 588,00 7 744,74 4 556,19 6 920,11 7,33 1
Location-86 136,83 3 191,16 959,84 100,16 794,37 9 620,99 2 827,95 8 992,15 7,96 2
Location-70 96,02 273,25 673,59 170,82 619,06 9 343,60 130,30 8 975,29 7,98 2
Location-93 113,51 2 787,99 796,28 154,60 616,85 9 194,03 2 646,50 8 718,51 8,21 2
Location-78 184,69 1 669,62 917,59 46,67 559,02 6 726,33 1 253,45 5 904,93 8,59 1
Location-77 179,75 2 310,99 893,04 34,75 493,53 6 665,06 1 963,45 5 883,26 8,62 1

M. Sisovs, “Distributed BESS in Retail Electricity Market” 104
Location Ncycl
Rdaml Rwear
l Rdsrel Risre
l Rsrml Cload
l TPPl IPPl NSUl
Location-85 177,73 1 939,86 883,01 28,00 471,44 6 460,87 1 605,35 5 686,79 8,91 1
Location-84 181,05 4 673,35 899,49 36,06 469,80 6 336,55 4 342,05 5 539,50 9,15 1
A.3 Electric Vehicle Problem
Table 18: Electric vehicle problem results (sorted descending by TPP per EV)
Location Ncycl
Rdaml R
wear,evl
Rdsrel Risre
l Rsrml Cload
l TPPl NEVl
TPPlNEV
l
Location-69 182,86 7690,28 390,40 97,53 447,87 14466,62 6741,69 13 477,96 10 1 347,80
Location-75 276,67 8301,01 590,69 304,32 1098,38 14323,91 7030,77 13 257,04 10 1 325,70
Location-10 210,70 8661,07 449,83 14,38 547,30 13088,65 7326,13 11 836,80 9 1 315,20
Location-23 296,60 24078,20 633,25 331,68 2729,95 32525,55 19987,39 30 199,77 23 1 313,03
Location-101 159,03 3208,26 339,53 37,62 74,83 7264,49 2800,96 6 554,87 5 1 310,97
Location-50 345,84 11784,97 738,37 95,02 1839,15 17449,89 9040,03 15 710,71 12 1 309,23
Location-63 216,27 7876,48 461,74 21,47 640,52 14037,42 6586,37 12 904,63 10 1 290,46
Location-73 159,30 3334,41 340,11 65,23 90,81 7110,63 2968,83 6 430,52 5 1 286,10
Location-45 164,42 3501,23 351,04 0,11 105,63 7173,50 2994,70 6 421,45 5 1 284,29
Location-38 169,53 3018,56 361,94 13,86 105,52 7178,84 2511,49 6 401,47 5 1 280,29
Location-15 169,95 4165,83 362,85 1,80 122,40 7145,08 3636,21 6 373,21 5 1 274,64
Location-83 165,89 3305,85 354,18 0,64 80,23 7100,04 2789,57 6 309,17 5 1 261,83
Location-8 320,81 13243,96 684,92 104,20 1737,60 18212,57 10429,20 16 346,29 13 1 257,41
Location-86 350,02 3382,06 747,30 291,91 796,85 7040,11 2827,95 6 243,64 5 1 248,73
Location-104 356,57 7833,43 761,28 12,42 1278,06 11223,31 5833,14 9 727,38 8 1 215,92
Location-60 319,81 10147,05 682,80 320,82 1538,04 14319,20 8552,65 13 259,22 11 1 205,38
Location-36 308,18 2719,37 657,96 0,00 533,47 5803,66 1856,14 4 815,94 4 1 203,98
Location-53 259,31 2685,42 553,63 0,00 352,07 5631,46 2000,63 4 745,11 4 1 186,28
Location-89 263,79 1977,81 563,20 11,08 294,43 4325,02 1484,55 3 551,92 3 1 183,97
Location-51 259,00 2915,19 552,97 0,00 347,11 5596,93 2235,08 4 710,95 4 1 177,74
Location-85 269,61 2109,32 575,62 7,27 275,90 4340,78 1605,35 3 529,82 3 1 176,61
Location-88 151,25 972,44 322,91 6,16 25,45 2831,27 762,69 2 317,90 2 1 158,95
Location-59 162,96 3585,13 347,93 64,12 109,58 7485,64 3235,45 6 833,50 6 1 138,92
Location-4 178,14 9846,34 380,32 146,94 306,19 14663,40 9066,08 13 662,07 12 1 138,51
Location-11 226,84 8207,74 484,30 453,22 741,02 15550,56 7626,35 14 772,68 13 1 136,36
Location-74 291,15 3303,91 621,59 0,00 480,22 5489,10 2494,82 4 538,63 4 1 134,66
Location-56 162,20 3959,59 346,29 73,92 58,58 7499,84 3611,23 6 789,85 6 1 131,64
Location-99 287,16 3120,35 613,08 0,00 434,43 5460,31 2331,96 4 493,27 4 1 123,32
Location-97 286,41 3202,64 611,48 0,00 452,23 5434,58 2416,59 4 489,27 4 1 122,32
Location-93 292,20 3450,55 623,85 0,00 483,06 5433,58 2646,50 4 488,74 4 1 122,18
Location-52 168,91 1215,80 360,63 0,00 29,75 2779,61 1005,60 2 238,53 2 1 119,26
Location-98 285,48 3669,56 609,50 0,00 447,74 5419,87 2883,72 4 472,28 4 1 118,07
Location-42 163,91 4331,30 349,96 12,46 91,33 7471,74 3837,50 6 706,84 6 1 117,81
Location-90 151,08 1431,02 322,55 6,11 21,87 2732,93 1227,00 2 222,13 2 1 111,06
Location-3 441,49 7483,72 942,57 0,44 1521,37 9299,81 5274,60 7 669,04 7 1 095,58
Location-7 231,76 8391,72 494,81 427,60 658,41 15044,15 7754,92 14 143,36 13 1 087,95
Location-68 375,73 9486,78 802,18 461,77 2004,56 14124,63 7650,13 13 028,59 12 1 085,72
Location-5 296,53 8524,10 633,09 412,61 1430,98 14908,50 7179,58 13 949,26 13 1 073,02
Location-46 160,78 3874,08 343,27 2,14 75,87 6982,81 3367,14 6 206,33 6 1 034,39
Location-25 148,26 170,23 316,53 16,19 11,12 1421,16 101,20 1 030,53 1 1 030,53
Location-26 148,39 392,60 316,81 17,20 13,53 1413,83 327,04 1 027,79 1 1 027,79
Location-67 185,72 7858,44 396,50 94,96 375,56 12301,60 6912,42 11 239,68 11 1 021,79
Location-28 147,80 153,25 315,54 17,19 8,20 1398,63 93,30 1 014,14 1 1 014,14
Location-31 154,92 365,93 330,75 0,00 16,98 1383,81 274,13 978,24 1 978,24
Location-30 149,38 364,42 318,94 6,86 9,40 1363,56 283,04 965,78 1 965,78
Location-29 148,62 447,11 317,30 9,93 8,80 1363,80 366,50 964,76 1 964,76
Location-87 145,10 517,38 309,79 8,96 3,14 1376,55 406,43 949,99 1 949,99
Location-77 408,14 2776,29 871,38 0,00 559,77 3922,76 1963,45 2 798,32 3 932,77
Location-32 154,37 517,27 329,58 0,00 19,39 1321,45 423,28 917,27 1 917,27
Location-91 414,70 2554,47 885,39 0,00 579,95 3859,22 1744,87 2 744,18 3 914,73
Location-17 177,36 4932,36 378,67 31,94 199,36 7199,27 4326,71 6 382,37 7 911,77
Location-78 261,82 1559,13 558,98 0,00 138,50 2545,19 1253,45 1 819,02 2 909,51
Location-54 183,03 4932,72 390,77 234,30 205,98 7887,30 4713,39 7 248,88 8 906,11
Location-33 154,46 314,82 329,77 0,00 11,05 1310,17 218,57 895,21 1 895,21
Location-105 199,71 4819,11 426,38 202,49 273,86 7850,95 4473,93 7 150,76 8 893,84

105 M. Sisovs, “Distributed BESS in Retail Electricity Market”
Location Ncycl
Rdaml R
wear,evl
Rdsrel Risre
l Rsrml Cload
l TPPl NEVl
TPPlNEV
l
Location-102 174,35 5088,32 372,24 158,37 182,28 7872,67 4702,69 7 138,71 8 892,34
Location-48 344,26 10799,24 735,00 390,62 2126,72 14619,08 8542,49 13 363,44 15 890,90
Location-76 209,23 6497,01 446,70 237,86 264,59 7738,91 6209,86 7 031,79 8 878,97
Location-66 343,57 12371,98 733,53 587,73 2194,45 15076,37 10402,82 13 980,40 16 873,78
Location-6 172,55 5044,13 368,39 127,10 97,85 7778,99 4627,87 6 965,09 8 870,64
Location-21 181,62 4908,72 387,75 183,17 162,59 6760,30 4649,69 6 092,94 7 870,42
Location-94 237,09 12750,35 506,19 349,02 918,12 15093,00 11480,93 13 886,48 16 867,91
Location-100 287,18 10019,06 613,13 472,78 1353,36 13961,93 8701,95 12 912,28 15 860,82
Location-82 177,34 5731,52 378,61 40,70 255,77 7654,03 5064,40 6 823,38 8 852,92
Location-34 159,34 227,24 340,19 0,00 13,78 1272,76 131,76 850,87 1 850,87
Location-47 175,27 4794,54 374,20 41,15 223,22 7644,13 4137,52 6 794,98 8 849,37
Location-103 197,59 5222,17 421,85 191,99 232,74 7485,23 4859,43 6 741,40 8 842,68
Location-84 179,56 5049,80 383,37 27,40 225,78 7626,43 4342,05 6 733,69 8 841,71
Location-40 221,23 5395,10 472,33 42,56 475,76 7598,63 4548,68 6 713,08 8 839,13
Location-41 222,30 5367,43 474,60 76,05 446,02 7627,03 4556,19 6 711,17 8 838,90
Location-12 395,96 2189,40 845,38 0,00 532,49 3599,79 1414,81 2 512,32 3 837,44
Location-27 486,48 1324,82 1038,64 77,75 518,94 2777,12 818,95 1 673,80 2 836,90
Location-57 433,68 2255,84 925,90 0,00 619,51 3643,16 1377,25 2 458,18 3 819,39
Location-9 301,42 1180,21 643,53 0,00 206,16 2394,58 823,80 1 600,79 2 800,39
Location-24 218,16 6280,04 465,76 229,93 323,03 7785,80 5970,60 7 103,69 9 789,30
Location-80 442,01 2555,71 943,69 0,00 635,21 3553,63 1666,95 2 356,39 3 785,46
Location-65 172,01 6321,79 367,25 108,46 135,77 7888,70 5781,40 7 008,37 9 778,71
Location-64 172,99 6268,74 369,32 71,81 150,98 7848,07 5660,59 6 949,77 9 772,20
Location-81 194,48 6530,14 415,22 104,19 302,75 7595,99 5846,46 6 695,65 9 743,96
Location-61 218,40 9753,96 466,27 29,50 725,19 9127,32 8406,47 8 009,25 11 728,11
Location-49 216,74 6758,95 462,74 363,16 287,82 7840,75 6573,80 7 117,52 10 711,75
Location-18 288,10 7117,01 615,10 364,12 1002,56 7851,94 6248,16 7 006,42 10 700,64
Location-70 184,98 240,88 394,93 0,00 23,99 1181,90 130,30 700,38 1 700,38
Location-71 184,84 153,25 394,63 0,00 24,00 1180,79 42,51 699,42 1 699,42
Location-96 175,31 6332,71 374,28 158,17 207,52 7841,71 5789,73 6 973,79 10 697,38
Location-72 184,93 179,00 394,83 0,00 23,99 1163,08 68,50 681,74 1 681,74
Location-19 183,56 179,56 391,89 0,00 27,37 1150,37 71,06 677,35 1 677,35
Location-35 240,65 6251,54 513,78 277,17 592,67 7622,27 5553,31 6 725,76 10 672,58
Location-13 355,08 1672,33 758,10 0,00 274,27 2256,69 1241,81 1 342,34 2 671,17
Location-92 167,61 172,38 357,84 0,00 15,11 1104,38 71,06 660,34 1 660,34
Location-20 184,72 287,32 394,37 0,00 27,28 1130,93 178,37 654,89 1 654,89
Location-55 194,76 6023,02 415,80 132,58 257,15 6002,01 5531,77 5 219,53 8 652,44
Location-22 184,57 543,14 394,07 0,00 26,06 1123,96 433,98 646,78 1 646,78
Location-16 211,04 5250,01 450,58 66,05 412,57 6014,34 4465,69 5 125,95 8 640,74
Location-58 188,12 411,82 401,64 0,00 26,78 1115,14 301,39 629,85 1 629,85
Location-95 171,84 192,39 366,88 0,00 18,21 1079,71 88,38 627,03 1 627,03
Location-1 173,68 5285,93 370,80 99,78 149,23 5768,13 4841,27 5 002,11 8 625,26
Location-2 186,59 217,25 398,38 0,00 27,80 1093,49 107,90 613,55 1 613,55
Location-106 181,18 243,54 386,82 0,00 21,12 1070,62 136,76 598,14 1 598,14
Location-62 173,17 6039,00 369,71 64,82 124,06 5987,69 5429,73 5 067,93 9 563,10
Location-14 192,02 326,24 409,97 0,00 28,82 1045,43 215,05 553,09 1 553,09
Location-37 179,78 4464,11 383,82 18,00 211,87 4626,16 3811,73 3 783,84 7 540,55
Location-39 346,75 6411,13 740,31 426,27 1296,95 5442,12 5474,88 4 636,23 9 515,14
Location-43 178,42 6828,85 380,92 113,03 234,48 5091,02 6153,59 4 156,29 10 415,63
Location-44 191,67 6971,78 409,23 140,39 323,88 5138,64 6239,47 4 180,60 11 380,05
Location-79 284,50 6252,50 607,41 395,92 1023,25 5022,97 5361,56 4 151,95 11 377,45
A.4 T&D Deferral and Outage Problem
Binary parameter idupgl is equal to 1 if an investment for transformer capacity
increase is needed in location l during 10-year period. Otherwise, idupgl = 0.

M. Sisovs, “Distributed BESS in Retail Electricity Market” 106
Table 19: T&D deferral and outage problem results
Location Ncust P contrl P peak
l Ntrl P peak
l − P tr ×Ntrl idupgl Nh
int Dl
Location-1 76 334650 55 316,93 1 -14 472,18 0 3 0,00
Location-2 1 3450 1 723,29 1 -77 958,61 0 6 6,23
Location-3 69 318100 88 811,55 2 -54 794,83 0 3 0,00
Location-4 113 529200 150 705,77 2 18 524,38 1 1 0,00
Location-5 123 570800 88 113,08 2 -55 622,22 0 3 0,00
Location-6 75 369650 58 436,05 1 -10 777,30 0 0 0,00
Location-7 125 603500 95 277,99 2 -47 134,75 0 2 0,00
Location-8 130 644800 191 844,68 3 -12 742,93 0 3 0,00
Location-9 14 64400 10 225,22 1 -67 887,32 0 2 0,00
Location-10 90 457746 119 809,64 2 -18 074,83 0 4 275,60
Location-11 122 596200 93 598,40 2 -49 124,37 0 3 0,00
Location-12 26 119400 18 336,17 1 -58 279,18 0 1 0,00
Location-13 18 62400 14 984,58 1 -62 249,44 0 1 0,00
Location-14 4 16100 2 621,40 1 -76 894,71 0 2 0,00
Location-15 44 196978 44 110,20 1 -27 747,54 0 3 0,00
Location-16 78 293300 56 056,73 1 -13 595,82 0 5 353,19
Location-17 69 306700 56 841,28 1 -12 666,45 0 1 0,00
Location-18 100 492396 74 923,16 1 8 753,14 1 1 0,00
Location-19 1 5750 609,95 1 -79 277,47 0 1 0,00
Location-20 3 11600 2 011,46 1 -77 617,25 0 2 0,00
Location-21 67 323500 58 065,40 1 -11 216,37 0 2 0,00
Location-22 7 42550 5 822,27 1 -73 103,00 0 2 0,00
Location-23 226 1167050 343 405,32 5 6 794,13 1 2 0,00
Location-24 89 439478 70 661,06 1 3 704,31 1 2 0,00
Location-25 2 9200 1 401,51 1 -78 339,78 0 3 0,00
Location-26 6 26450 4 204,54 1 -75 019,35 0 3 0,00
Location-27 15 72450 11 016,79 1 -66 949,64 0 0 0,00
Location-28 2 8050 1 219,89 1 -78 554,93 0 3 0,00
Location-29 7 31050 4 632,86 1 -74 511,96 0 3 0,00
Location-30 5 21850 3 711,10 1 -75 603,88 0 2 0,00
Location-31 4 18400 3 101,15 1 -76 326,41 0 2 0,00
Location-32 8 37950 5 540,93 1 -73 436,27 0 1 0,00
Location-33 3 13800 3 801,08 1 -75 497,28 0 3 0,00
Location-34 3 14950 2 011,46 1 -77 617,25 0 3 0,00
Location-35 97 439650 66 751,32 1 -927,13 0 4 264,71
Location-36 32 133500 24 459,70 1 -51 025,31 0 3 0,00
Location-37 63 272800 44 966,26 1 -26 733,46 0 0 0,00
Location-38 41 174000 32 357,51 1 -41 669,65 0 2 0,00
Location-39 90 406028 66 358,27 1 -1 392,73 0 2 0,00
Location-40 79 371440 57 971,17 1 -11 328,00 0 3 0,00
Location-41 76 357400 57 170,46 1 -12 276,50 0 1 0,00
Location-42 60 295700 48 161,43 1 -22 948,50 0 5 356,08
Location-43 94 393200 76 845,58 1 11 030,42 1 0 0,00
Location-44 105 453350 78 320,45 1 12 777,54 1 4 272,96
Location-45 50 236800 37 213,43 1 -35 917,38 0 3 0,00
Location-46 52 229950 43 198,94 1 -28 827,01 0 7 553,80
Location-47 71 329850 53 729,72 1 -16 352,37 0 1 0,00

107 M. Sisovs, “Distributed BESS in Retail Electricity Market”
Location Ncust P contrl P peak
l Ntrl P peak
l − P tr ×Ntrl idupgl Nh
int Dl
Location-48 145 562800 102 320,67 2 -38 792,08 0 2 0,00
Location-49 99 497900 79 405,67 1 14 063,08 1 4 299,78
Location-50 120 590850 167 464,71 3 -41 623,17 0 2 0,00
Location-51 38 173650 27 688,16 1 -47 200,91 0 3 0,00
Location-52 15 80450 11 832,00 1 -65 983,94 0 5 96,88
Location-53 35 159050 25 213,54 1 -50 132,33 0 0 0,00
Location-54 79 378200 56 279,82 1 -13 331,55 0 4 227,71
Location-55 78 387700 67 426,40 1 -127,44 0 2 0,00
Location-56 59 279550 44 244,64 1 -27 588,29 0 2 0,00
Location-57 23 113700 16 582,54 1 -60 356,51 0 2 0,00
Location-58 5 20300 4 526,31 1 -74 638,18 0 3 0,00
Location-59 53 255900 40 193,95 1 -32 386,70 0 1 0,00
Location-60 103 489250 133 007,41 2 -2 440,90 0 7 1 178,29
Location-61 107 511450 142 926,22 2 9 308,82 1 2 0,00
Location-62 87 396550 66 320,11 1 -1 437,94 0 3 0,00
Location-63 92 393200 89 611,59 2 -53 847,11 0 5 473,48
Location-64 90 432150 67 758,93 1 266,47 1 2 0,00
Location-65 89 349550 71 337,30 1 4 505,37 1 3 0,00
Location-66 158 819650 130 147,82 2 -5 828,34 0 3 0,00
Location-67 110 509950 84 638,49 2 -59 738,18 0 1 0,00
Location-68 112 576350 97 263,43 2 -44 782,82 0 4 347,01
Location-69 99 401100 87 527,38 2 -56 316,04 0 2 0,00
Location-70 1 9900 828,34 1 -79 018,76 0 2 0,00
Location-71 1 6928 609,95 1 -79 277,47 0 0 0,00
Location-72 1 5500 609,95 1 -79 277,47 0 8 16,56
Location-73 46 203050 37 425,23 1 -35 666,49 0 4 122,25
Location-74 40 183250 31 570,11 1 -42 602,40 0 5 220,67
Location-75 100 515578 87 932,52 2 -55 836,11 0 3 0,00
Location-76 79 415240 74 651,27 1 8 431,06 1 1 0,00
Location-77 30 151850 23 603,05 1 -52 040,09 0 2 0,00
Location-78 20 96700 15 543,10 1 -61 587,82 0 3 0,00
Location-79 108 529700 74 462,08 1 8 206,96 1 2 0,00
Location-80 27 124900 20 152,35 1 -56 127,75 0 4 75,20
Location-81 89 467940 77 189,89 1 11 438,28 1 3 0,00
Location-82 79 364650 65 193,56 1 -2 772,43 0 2 0,00
Location-83 50 224600 34 362,72 1 -39 294,30 0 2 0,00
Location-84 71 298050 53 315,09 1 -16 843,54 0 3 0,00
Location-85 27 124950 19 398,09 1 -57 021,24 0 5 150,46
Location-86 47 198100 36 720,06 1 -36 501,83 0 4 119,27
Location-87 8 38000 6 678,93 1 -72 088,21 0 3 0,00
Location-88 14 73600 9 265,72 1 -69 023,93 0 3 0,00
Location-89 24 125350 16 753,04 1 -60 154,54 0 0 0,00
Location-90 20 97400 14 833,00 1 -62 429,00 0 4 58,64
Location-91 30 138050 22 694,94 1 -53 115,82 0 3 0,00
Location-92 1 5750 609,95 1 -79 277,47 0 8 17,31
Location-93 40 169750 31 570,11 1 -42 602,40 0 4 102,20
Location-94 153 645600 135 701,61 2 750,62 1 6 1 166,13
Location-95 1 6928 743,34 1 -79 119,45 0 2 0,00
Location-96 97 461474 71 629,99 1 4 852,10 1 4 277,85

M. Sisovs, “Distributed BESS in Retail Electricity Market” 108
Location Ncust P contrl P peak
l Ntrl P peak
l − P tr ×Ntrl idupgl Nh
int Dl
Location-97 38 182942 28 664,24 1 -46 044,66 0 6 330,44
Location-98 36 160900 48 374,82 1 -22 695,72 0 1 0,00
Location-99 40 158800 27 303,77 1 -47 656,26 0 2 0,00
Location-100 141 572050 101 970,10 2 -39 207,35 0 1 0,00
Location-101 46 205850 35 202,01 1 -38 300,09 0 4 123,94
Location-102 74 357300 59 213,96 1 -9 855,80 0 1 0,00
Location-103 76 388600 56 978,96 1 -12 503,36 0 3 0,00
Location-104 76 348300 82 473,33 2 -62 303,01 0 5 419,42
Location-105 75 407200 55 940,65 1 -13 733,32 0 6 735,51
Location-106 3 14950 2 011,46 1 -77 617,25 0 2 0,00
B Appendix: Cash Flow Example for Cost-benefit
Analysis
In Tab. 20, ACF stands for accumulated cash flow.
Table 20: Cash flow demonstration of “Location-23” investment problem
Expenses IncomesQj ACF
j Ccapex Rdam Rop Rdsre Total Rsrm Risre Cload Total0 268463 0 0 0 268463 0 0 0 0 -268463 -2684631 0 47217 3500 191 50908 83384 8819 39975 132177 81269 -1871942 0 47217 3500 191 50908 83384 8819 39975 132177 81267 -1059253 0 47217 3500 191 50908 83384 8819 39975 132177 81269 -246564 0 47217 3500 191 50908 83384 8819 39975 132177 81269 566135 0 47217 3500 191 50908 83384 8819 39975 132177 81269 1378826 0 47217 3500 191 50908 83384 8819 39975 132177 81269 2191517 109714 47217 3500 191 160622 83384 8819 39975 132177 -28445 1907068 0 47217 3500 191 50908 83384 8819 39975 132177 81269 2719759 0 47217 3500 191 50908 83384 8819 39975 132177 81269 35324410 0 47217 3500 191 50908 83384 8819 39975 132177 81269 434513