Embed Size (px)
Citation preview

INTERNATIONAL JOURNAL OF CLIMATOLOGY
Int. J. Climatol. 24: 341–360 (2004)
Published online 11 February 2004 in Wiley InterScience (www.interscience.wiley.com). DOI: 10.1002/joc.1005
A STUDY ON DYNAMIC AND THERMODYNAMIC ASPECTS OF BREAKSIN THE SUMMER MONSOON OVER INDIA
R. BHATLA, U. C. MOHANTY,* P. V. S. RAJU and O. P. MADAN
Centre for Atmospheric Sciences, Indian Institute of Technology, Hauz Khas, New Delhi 110 016, India
Received 2 June 2003Revised 28 November 2003
Accepted 28 November 2003
ABSTRACT
The rainfall associated with the Indian summer monsoon shows large intraseasonal and interannual variability. Break-monsoon conditions are one of the important epochs of the monsoon, and they contribute significantly to the intraseasonalvariability of the monsoon. The National Centers for Environmental Prediction–National Center for Atmospheric Researchreanalysis data sets are used to investigate the significant energy budget terms during the pre-break (5 days prior to thecommencement of the break), break and post-break (5 days after the cessation of the break) periods. In the present study,certain dynamic and thermodynamic characteristics of the monsoon circulation during break-monsoon conditions areinvestigated. The important terms in the various energy budget equations are analysed between the surface and 100 hPafor the break and its departures from pre- and post-break for the period 1968–96. The statistical significance of thesedepartures is also examined by Student’s t-test at the 95% confidence level. The volume integral of the budget terms isalso examined in four sectors, i.e. the Arabian Sea, Bay of Bengal, northern India and central India.
Significant changes in the wind field and vorticity at 850 hPa take place in the monsoon trough zone, coastal regionsof the western coast of India and the southwestern Bay of Bengal off the southern Indian coast. The vertically upwardrising arm of the Hadley cell weakens during the break phase. The strong flux convergence of kinetic energy in thecentral Arabian Sea and flux divergence in the northeastern Bay of Bengal weakens during pre- and post-break periods.Significant changes in the diabatic heating horizontal flux of heat and moisture are observed in the monsoon troughzone, central and northwestern Bay of Bengal. The Bay of Bengal and central India sectors show higher magnitudesand changes in respect of dynamic and thermodynamic parameters compared with the Arabian Sea and northern India.Copyright 2004 Royal Meteorological Society.
KEY WORDS: summer monsoon; break-monsoon; reanalysis; energetics; Student’s t-test
1. INTRODUCTION
The Indian summer monsoon has brought welcome rain to India with almost unremitting regularity forthousands of years. The onset of the Indian summer monsoon, its activity during the season and its withdrawalshow large variations from year to year. The southwest summer monsoon over India undergoes periods ofenhanced and reduced rainfall activity, and these intraseasonal variations are termed as ‘active’ and ‘weak’monsoon phases respectively. Sometimes, during a ‘weak’ phase of the monsoon, the monsoon trough isfound to shift northward from its normal position to the foothills of the Himalayas (Ramamurthy, 1969; Rao,1976) and the precipitation activity over the country becomes considerably subdued, except over some partsof the country such as the foothills of the Himalayas, northeastern Indian states and Tamil Nadu where rainfallactivity increases. Such a situation is known as a ‘break’ in the southwest summer monsoon over India. Aprolonged break situation in the monsoon is associated with extreme heat stress for agricultural crops, reducedwater supply to reservoirs and a reduction in the generation of hydroelectricity, which affects the country’seconomy.
* Correspondence to: U. C. Mohanty, Centre for Atmospheric Sciences, IIT-Delhi, Hauz Khas, New Delhi 110 016, India;e-mail: [email protected]
Copyright 2004 Royal Meteorological Society

342 R. BHATLA ET AL.
Ramamurthy (1969) studied 80 years (1888–1967) of rainfall data and suggested that most of the breakshad durations of 3–5 days. Some very long-duration break periods lasted for 17–20 days, and the few suchtypes of prolonged break occurred mainly during August. Ramaswamy (1962) noticed that break periodsare influenced by the intrusion of the mid-latitude trough into the Indo-Pakistan region in the middle andupper troposphere. The atmospheric general circulation in both hemispheres was locked in a low-indexRossby regime during intensely weak phases of the Indian summer monsoon (Ramaswamy and Pareek 1978).Unninayar and Murakami (1978) showed that a bifurcation of the Tibetan high under the influence of amid-latitude trough near the Indo-Pakistan region resulted in weak monsoon periods. Raman and Rao (1981)noted that changes associated with a weak monsoon included the occurrence of a stagnant blocking ridge inthe upper troposphere from 90 to 115 °E over East Asia. Ramamurthy (1969) catalogued the breaks in Julyand August during 1888 to 1967 based on a persistent synoptic pattern (of at least 2 days length) in whichthe monsoon trough was absent in the sea-level chart, as well as up to 850 hPa. Krishnamurti and Ardanuy(1980) found that break-monsoon spells were associated with westward-propagating trough–ridge systemsthat had a periodicity of about 10–20 days using 40 years (1933–72) of surface pressure data.
Rodwell (1997) illustrated that breaks in the Indian summer monsoon could be triggered by extratropicalweather systems in Southern Hemisphere. The effect of the large-scale heat and moisture budget on theonset and activities of the summer monsoon was investigated by Mohanty et al. (1982a,b). In a recentstudy, Krishnan et al. (2000) presented results on the diagnostic analysis of observation and complementaryexperiments with a simple numerical model that enabled them to synthesize the morphology and dynamics ofbreaks in the Indian summer monsoon. Through modelling experiments, it was demonstrated that low-latitudeRossby wave dynamics in the presence of a monsoon basic flow, which is driven by a steady north–southdifferential heating, is the primary physical mechanism that controls the so-called monsoon breaks (Krishnanet al., 2000).
Earlier studies about the break condition have revealed the shifting of the monsoon trough line to theHimalayan foothills, the absence of easterlies over the northern parts of the country up to 1.5 km a.s.l., andthe presence of a trough in mid- and upper-tropospheric westerlies over northern parts of the country asbeing some of the important features. In addition to this, the movement of the cyclonic circulation over lowlatitudes, e.g. over the southwest Bay of Bengal or over southern Tamil Nadu (Koteswaram, 1950; Mukherjeeand Natarajan, 1968), the presence of a trough in mid- and upper-tropospheric westerlies over northern parts ofthe country (Pisharoty and Desai, 1956), a weak pressure gradient over the west coast, and sometimes isobarsrunning parallel to the west coast (Malurkar, 1950), strong westerly winds in the northern parts of the countrycompared with the westerlies over the peninsula are some of the important features during most of the breaksituations. During the break-monsoon, considerable reductions in precipitation and cloudiness, coupled withwind changes, suggest the need for examination of the changes over the Indian seas, which are consideredto be the source of moisture and hence diabatic energy for the maintenance of the monsoon system over theIndian subcontinent. Therefore, the aim of this paper is to examine the changes in circulation characteristics,dynamics and thermodynamics over India and the adjoining seas that lead to break-situation aspects in thesummer monsoon. The availability of reliable and homogeneous global National Centers for EnvironmentalPrediction–National Center for Atmospheric Research (NCEP–NCAR) reanalysis data facilitates the carryingout of a composite study of break cases (1968–96) in the context of changes in circulation, diagnostics andenergetics associated with the pre-break situation to the break and from the break situation to the revivalphase of the monsoon.
2. DATA AND METHODOLOGY
Information concerning the break-monsoon situation (Table I) was obtained from scientific reports of theIndia Meteorological Department (De et al., 1998) for the period 1968–96. Short breaks, lasting for only 1or 2 days, are not taken into account. In the present study, break-monsoon situations that lasted for 3 days ormore are considered. Thus, a total of 33 breaks form the basis of the present study (Table I).
In order to study the dynamic and thermodynamic characteristics of break-monsoon conditions with changesin circulation and energetics, a reliable, consistent and quality-controlled data set is needed over the Indian
Copyright 2004 Royal Meteorological Society Int. J. Climatol. 24: 341–360 (2004)

INDIAN SUMMER MONSOON BREAKS 343
Table I. Pre-break, break and post-break periods from 1968 to 1996
Year Pre-break period Break period Post-break period
1968 20–24 August 25–29 August 30 August–3 September1969 12–16 August 17–20 August 21–25 August
20–24 August 25–27 August 28 August–1 September1970 7–11 July 12–25 July 26–30 July1971 12–16 August 17–20 August 21–25 August1972 12–16 July 17 July–3 August 4–8 August
27–31 August 1–6 September 7–11 September1973 18–22 July 23 July–1 August 2–6 August1974 25–29 August 30 August–3 September 4–8 September1975 19–23 July 24–28 July 29 July–2 August1977 10–14 August 15–18 August 19–23 August1978 11–15 July 16–21 July 22–26 July1979 12–16 July 17–23 July 24–28 July
10–14 August 15 August–3 September 4–8 September1980 12–16 July 17–20 July 21–25 July1981 21–25 July 26–30 July 31 July–4 August
18–22 August 23–27 August 28 August–1 September1983 17–21 August 22–25 August 26–30 August1984 15–19 July 20–24 July 25–29 July1985 17–21 August 22–25 August 26–30 August1986 18–22 August 23–26 August 27–31 August
24–28 August 29 August–3 September 4–8 September1987 23–27 July 28 July–1 August 2–6 August1988 30 June–4 July 5–8 July 9–13 July
8–12 August 13–15 August 16–20 August1989 5–9 July 10–12 July 13–17 July
24–28 July 29–31 July 1–5 August1990 3–7 July 8–10 July 11–15 July
22–26 July 27–31 July 1–5 August1991 29 August–2 September 3–9 September 10–14 September1993 14–18 July 19–21 July 22–26 July1995 7–11 August 12–15 August 16–20 August1996 26 June–30 June 1–5 July 6–10 July
region. One such reliable and homogeneous global meteorological data set, which recently became available, isthe NCEP–NCAR reanalysis (Kalnay et al., 1996). The data set is the result of a cooperative effort by NCEPand NCAR to produce 50 years (1948–97) of consistent and reliable global reanalysis of the atmospheric fieldsto support the needs of the research and climate monitoring community. The effort involves the recovery ofland surface, ship, rawinsonde, aircraft, satellite and delayed mode Global Telecommunications System data,quality control and assimilation with a four-dimensional data assimilation system that is kept unchanged overthe entire period (Kalnay et al., 1996). From this global data set, data for the duration of all break situations,as well as for 5 days prior to the commencement of a break in the monsoon (i.e. pre-break) and 5 days afterthe cessation of break/revival of normal monsoon (i.e. post-break) are extracted for the period 1968 to 1996.The region covered is 15 °S–45 °N, 30–120 °E. Based on 00 UTC and 12 UTC daily analysis, daily averageswere computed in respect of zonal wind u, meridional wind v, geopotential height z, temperature T andspecific humidity q at 12 mandatory pressure levels (1000, 925, 850, 700, 600, 500, 400, 300, 250, 200, 150and 100 hPa). Further, the composite of basic fields and energetic terms of all 33 cases of break situations arecomputed for the pre-break, break and post-break periods. The vertical velocity fields in this study have beencomputed from horizontal wind components (u and v) by using the kinematics method suggested by O’Brien
Copyright 2004 Royal Meteorological Society Int. J. Climatol. 24: 341–360 (2004)

344 R. BHATLA ET AL.
(1970). In this technique, the divergence is adjusted to its vertically integrated value over the entire columnof the atmosphere, i.e. to zero. To avoid problems with the divergent wind and estimation of budget termswith consistency, the vertical velocity field is estimated using the kinematics method, in which the divergenceis adjusted in the vertical column of the atmosphere to be zero. Further, it is found that the vertical velocityobtained from the kinematics method delineates a more realistic Hadley circulation over the monsoon domainthan do the archived fields. Hence, we resorted to that process. The following equations are used to calculatesome of the energy budget terms.
The kinetic energy (KE) budget equation in the flux form may be written as
∂K
∂t+ ∇ · VK + ∂(ωK)
∂p= −V · ∇φ + V · F (1)
where K is the KE, V is a two-dimensional wind vector, ω is vertical velocity, φ is geopotential and F isthe frictional force. The first term on the left-hand side in Equation (1) denotes the local rate of change ofthe KE. The second term describes the horizontal flux divergence of the KE, and the third term indicates thevertical flux divergence of the KE. Similarly, the first term on the right-hand side of Equation (1) denotes theconversion of potential energy into KE through the action of pressure forces (adiabatic generation of KE).The last term signifies the dissipation of KE by turbulent frictional processes and is usually estimated as aresidual. In fact, it is a sink or disappearance of KE from the observed scales of motion, which could beinterpreted as the net loss of KE that has been input into the various scales of motion.
The vorticity budget equation is expressed as
∂ζ
∂t+ ∇ · Vζ + βV + ∂
∂p(ζω) = −(ζ + f )D − k ·
(∇ω × ∂V
∂p
)+ z (2)
where f is the Coriolis parameter, k is the unit vector, and
β = ∂f
∂y
ζ = ∂v
∂x− ∂u
∂y
is the relative vorticity and
D = ∂u
∂x+ ∂v
∂y
is the divergence.The first term on the left-hand side in Equation (2) is the time rate of change of vorticity. The second and
third terms represent the horizontal fluxes of the relative and planetary vorticities. The fourth term describesthe vertical flux of vorticity. Similarly, the first term on the right-hand side indicates the vorticity generationdue to stretching. The second term indicates the vorticity generation due to tilting. The final term designatesthe residue of vorticity (i.e. generation or dissipation from sub-grid-scale processes).
The heat budget equation in the flux form can be written as
∂(CpT )
∂t+ ∇ · (VCpT ) + ∂
∂p(ωCpT ) − ωα = QH (3)
where the first term on the left-hand side denotes the time rate of change of enthalpy. The second and thirdterms designate the horizontal and vertical fluxes of heat. The fourth term indicates adiabatic conversion ofavailable potential energy (APE) to KE. The right-hand term describes the diabatic heating due to radiation,condensation and evaporation of falling raindrops and turbulent transfer of sensible heat and estimated as aresidual.
Copyright 2004 Royal Meteorological Society Int. J. Climatol. 24: 341–360 (2004)

INDIAN SUMMER MONSOON BREAKS 345
The moisture budget equation in the flux form can be written as
∂
∂t(Lq) + ∇ · (LqV) + ∂
∂p(Lqω) = QL (4)
The first term on the left-hand side of Equation (4) indicates the time rate of change of moisture. The secondand third terms designate the horizontal and vertical moisture fluxes respectively. The right-hand term denotesthe diabatic heating due to latent heat released or absorbed from evaporation and condensation, as well asturbulent transfer of latent heat.
All budget terms at each regular latitude/longitude grid point are computed and averaged, both in thezonal and meridional directions, over various sectors/zones and integrated vertically from the 1000 hPa tothe 100 hPa tropospheric layers. Thus, the volume integral of any variable F(λ, ϕ, P ) for the limited regionbounded by meridians λ1 and λ2, latitude circles ϕ1 and ϕ2 and isobaric surfaces P1 and P2 may be written as
F = 1
g
∫ λ2
λ1
∫ ϕ2
ϕ1
∫ P2
P1
Fa2 cos ϕdλdϕdP
where a is the average radius of the Earth and g is the acceleration due to gravity.The vertical integration of all the budget equations with the boundary condition that vertical motion (ω = 0)
vanishes at the bottom and the top of the atmosphere leads to the elimination of all the terms representingvertical flux divergences of various quantities.
3. RESULTS AND DISCUSSIONS
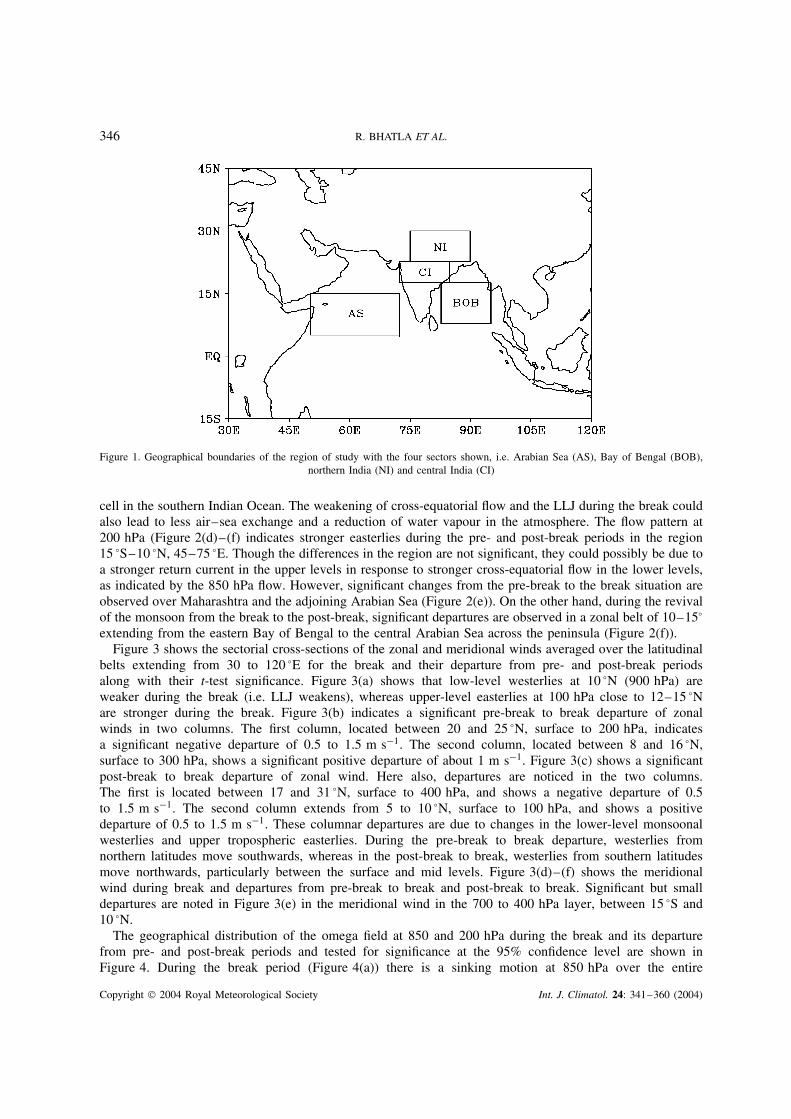
In the present study, circulation features and all terms in various budget equations are evaluated betweenthe surface and 100 hPa for the break period and its departure from pre-break (5 days before the break) andpost-break (5 days after the break) periods. These departures have been tested for their significance usingStudent’s t-test at the 95% level of confidence and are shaded in all results (Figures 2 to 11). Further, thevolume integrals of the budget terms are examined in four significant sectors/regions, namely the Arabian Sea(AS; 50–72.5 °E, 5–15 °N), Bay of Bengal (BOB; 82.5–95 °E, 7.5–17.5 °N), northern India (NI; 75–90 °E,22.5–30.0 °N) and central India (CI; 72.5–85 °E, 17.5–22.5 °N) as shown in Figure 1. The boxes were chosento include areas where some of the controlling components of the monsoon (such as low-level jet (LLJ) inthe Arabian Sea, the monsoon trough over the Indo Gangetic plain, monsoonal disturbances in the Bay ofBengal and their subsequent tracks of movement, etc.) are prominent and regions where significant changesoccur from pre-break to break to post-break monsoon situations. Though we have examined all the budgetterms, only the results pertaining to important terms are presented.
3.1. Circulation characteristics
Figure 2 depicts the geographical distribution of the vector wind at 850 and 200 hPa during the break andits departures from pre- and post-break phases of the summer monsoon, along with their t-test significanceat the 95% confidence level (shaded region). Figure 2 (b) and (c) shows that, at the 850 hPa level in themonsoon trough zone, significantly stronger easterlies prevail during pre- and post-break periods and theeasterlies extend well to the south of 30 °N. The easterlies in the post-break period are comparatively strongerand more extensive than in the pre-break period, particularly towards the eastern end. This may be due tothe shifting of the monsoon trough to the foothills of the Himalayas. The cross-equatorial flow and the LLJreaching the west coast of India from the Somali coast weakens during the break (Figure 2(a)). The significantlow-level westerlies in the southern Bay of Bengal are found to be stronger in the post-break period than inthe pre-break at 850 hPa. The weakening in the cross-equatorial flow and LLJ during the break period couldbe due to shifting and weakening of the seasonal low northwards, as indicated by the absence of low-leveleasterlies in the monsoon trough zone and by the weakening or displacement of the Mascarane high-pressure
Copyright 2004 Royal Meteorological Society Int. J. Climatol. 24: 341–360 (2004)
346 R. BHATLA ET AL.
Figure 1. Geographical boundaries of the region of study with the four sectors shown, i.e. Arabian Sea (AS), Bay of Bengal (BOB),northern India (NI) and central India (CI)
cell in the southern Indian Ocean. The weakening of cross-equatorial flow and the LLJ during the break couldalso lead to less air–sea exchange and a reduction of water vapour in the atmosphere. The flow pattern at200 hPa (Figure 2(d)–(f) indicates stronger easterlies during the pre- and post-break periods in the region15 °S–10 °N, 45–75 °E. Though the differences in the region are not significant, they could possibly be due toa stronger return current in the upper levels in response to stronger cross-equatorial flow in the lower levels,as indicated by the 850 hPa flow. However, significant changes from the pre-break to the break situation areobserved over Maharashtra and the adjoining Arabian Sea (Figure 2(e)). On the other hand, during the revivalof the monsoon from the break to the post-break, significant departures are observed in a zonal belt of 10–15°
extending from the eastern Bay of Bengal to the central Arabian Sea across the peninsula (Figure 2(f)).Figure 3 shows the sectorial cross-sections of the zonal and meridional winds averaged over the latitudinal
belts extending from 30 to 120 °E for the break and their departure from pre- and post-break periodsalong with their t-test significance. Figure 3(a) shows that low-level westerlies at 10 °N (900 hPa) areweaker during the break (i.e. LLJ weakens), whereas upper-level easterlies at 100 hPa close to 12–15 °Nare stronger during the break. Figure 3(b) indicates a significant pre-break to break departure of zonalwinds in two columns. The first column, located between 20 and 25 °N, surface to 200 hPa, indicatesa significant negative departure of 0.5 to 1.5 m s−1. The second column, located between 8 and 16 °N,surface to 300 hPa, shows a significant positive departure of about 1 m s−1. Figure 3(c) shows a significantpost-break to break departure of zonal wind. Here also, departures are noticed in the two columns.The first is located between 17 and 31 °N, surface to 400 hPa, and shows a negative departure of 0.5to 1.5 m s−1. The second column extends from 5 to 10 °N, surface to 100 hPa, and shows a positivedeparture of 0.5 to 1.5 m s−1. These columnar departures are due to changes in the lower-level monsoonalwesterlies and upper tropospheric easterlies. During the pre-break to break departure, westerlies fromnorthern latitudes move southwards, whereas in the post-break to break, westerlies from southern latitudesmove northwards, particularly between the surface and mid levels. Figure 3(d)–(f) shows the meridionalwind during break and departures from pre-break to break and post-break to break. Significant but smalldepartures are noted in Figure 3(e) in the meridional wind in the 700 to 400 hPa layer, between 15 °S and10 °N.
The geographical distribution of the omega field at 850 and 200 hPa during the break and its departurefrom pre- and post-break periods and tested for significance at the 95% confidence level are shown inFigure 4. During the break period (Figure 4(a)) there is a sinking motion at 850 hPa over the entire
Copyright 2004 Royal Meteorological Society Int. J. Climatol. 24: 341–360 (2004)

INDIAN SUMMER MONSOON BREAKS 347
Figure 2. Geographical distributions of vector wind field (m s−1) at 850 hPa for (a) break, (b) pre-break–break, (c) post-break–break.(d), (e) and (f) Same as (a), (b) and (c) respectively, but for 200 hPa with confidence limits above 95% (shaded)
country, except for a smaller area in the Arabian Sea off the Maharashtra coast and the eastern Bay ofBengal off the Mayanmar coast, where a rising motion is noticed. Departures from pre- and post-breakperiods (Figure 4(b) and (c)) indicate a significant strong upward motion of (20–30) × 10−3 Pa s−1 inthe entire monsoon trough zone, as well as over most parts of the country. This could be due to thelocation of the monsoon trough south of the foothills of the Himalayas during the pre- and post-breakperiods, resulting in convergence and hence a higher vertical upward velocity. At 200 hPa (Figure 4(d)),the major portion of the country continues to be a region of sinking motion during the break phase, exceptfor the Bay of Bengal and the northern Indian Ocean. During pre- and post-break departures (Fig. 4(e)
Copyright 2004 Royal Meteorological Society Int. J. Climatol. 24: 341–360 (2004)

348 R. BHATLA ET AL.
Figure 3. Sectorial mean (30–120 °E) vertical cross-sections of zonal wind (m s−1) for (a) break (b) pre-break–break, (c) post-break–break. (d), (e) and (f) Same as (a), (b) and (c) respectively, but for meridional wind (m s−1) with confidence limits above 95% (shaded)
and (f)), significant upward motion is indicated in the monsoon trough zone, and more so in the Bayof Bengal. Thus, at 200 hPa, upward motion continues to be shown in the Bay of Bengal in pre-break,break and post-break periods, though the magnitudes in the pre- and post-break are higher. This possiblyexplains why the Bay of Bengal remains convectively active even during break-monsoon situations. Further,this could also be due to the entrance region of the tropical easterly jet being located over the easternBay of Bengal, leading to persistent divergence, as indicated by Figure 2(d)–(f) during pre- to post-breakperiods.
Copyright 2004 Royal Meteorological Society Int. J. Climatol. 24: 341–360 (2004)

INDIAN SUMMER MONSOON BREAKS 349
Figure 4. Geographical distributions of vertical velocity (10−3 Pa s−1) at 850 hPa for (a) break, (b) pre-break–break, (c) post-break–break. (d), (e) and (f) Same as (a), (b) and (c) respectively, but for 200 hPa with confidence limits above 95% (shaded)
The sectorial mean cross-section of the omega field is depicted in Figure 5, which shows that omegaweakens during the break monsoon between 15 and 20 °N, indicating a weakening of the Hadley cell.Figure 5(b) indicates that, with the approach of a break, rising upward motion increases significantly inthe 5–10 °N belt and sinking motion increases in the 10–25 °N belt. Proceeding from break to post-break,the upward motion increases in the 10–25 °N belt (Figure 5(c)).
The distributions of vorticity at 850 and 200 hPa during the break phase and their departures during pre-and post-break phases, and with their t-test results, are shown in Figure 6. It is clear from Figure 6(a)–(c) thatthe anticyclonic vorticity at 850 hPa in the southern and southeastern Arabian Sea is less during a break thanduring pre- or post-break periods. This may be due to the weakening of the anticyclonic circulation associatedwith the southern Indian Ocean anticyclone. Significantly strong cyclonic vorticity is observed in the monsoontrough zone extending from northwest India to the head of the Bay of Bengal during both pre- and post-break
Copyright 2004 Royal Meteorological Society Int. J. Climatol. 24: 341–360 (2004)

350 R. BHATLA ET AL.
Figure 5. Sectorial mean (30–120 °E) vertical cross-sections of vertical velocity (10−3 Pa s−1) for (a) break, (b) pre-break–break,(c) post-break–break with confidence limits above 95% (shaded)
departures (Figure 6(b) and (c)). It is also supported by the omega field at 850 hPa shown in Figure 4(a)–(c).In the equatorial region, particularly in the southwestern Arabian Sea, the reduction in the anticyclonic vorticityis due to weaker cross-equatorial flow during the break period. At 200 hPa (Figure 6(d)–(f)), significant butcomparatively weaker anticyclonic vorticity prevails over the monsoon trough during the pre- and post-break periods. This could be due to the weakening of easterlies associated with the weakening of Tibetananticyclones, as is indicated by the departures.
Copyright 2004 Royal Meteorological Society Int. J. Climatol. 24: 341–360 (2004)

INDIAN SUMMER MONSOON BREAKS 351
Figure 6. Geographical distributions of vorticity (10−7 s−1) at 850 hPa for (a) break, (b) pre-break–break, (c) post-break–break. (d),(e) and (f) Same as (a), (b) and (c) respectively, but for 200 hPa) with confidence limits above 95% (shaded)
3.2. KE budget
The distribution of vertically integrated (1000–100 hPa) horizontal flux divergence of KE during the breakperiod and its departure during pre- and post-break periods, along with the t-test results, are shown inFigure 7(a)–(c). During the break period, the central and northeastern Bay of Bengal is the region of fluxdivergence of KE, but during the pre- and post-break departures the significant flux divergence region is inthe southwestern Bay of Bengal and flux convergence occurs in the northeastern Bay of Bengal, as indicatedby Figure 7(b) and (c). The northern and central Arabian Sea is the region of flux convergence of KE duringthe break period, and this weakens considerably during the pre- and post-break periods. The stronger fluxconvergence of KE in the Arabian Sea and flux divergence in the Bay of Bengal during the break period isdue to the combined effect of the LLJ and the tropical upper tropospheric easterly jet, caused as a result ofchanges in the location of entrance/exit regions during different phases of the monsoon.
Copyright 2004 Royal Meteorological Society Int. J. Climatol. 24: 341–360 (2004)

352 R. BHATLA ET AL.
Figure 7. Geographical distributions of vertically integrated horizontal flux divergence of kinetic energy (10−1 W m−2) for (a) break,(b) pre-break–break, (c) post-break–break. (d), (e) and (f) Same as (a), (b) and (c) respectively, but for adiabatic generation of kinetic
energy (10−1 W m−2) with confidence limits above 95% (shaded)
Figure 7(d)–(f) shows the distribution of vertically integrated adiabatic generation of KE during the breakperiod and its departure during pre- and post-break periods, together with the t-test significance. Positivemagnitudes denote the generation of KE through the conversion of APE, and negative magnitudes denotethe destruction of KE, i.e. transformation of KE back to APE. The maximum noticed off East Africa isdue to the presence of strong ageostrophic flow in that region. The generation maximum observed in thesouthwestern Bay of Bengal, off the Tamil Nadu and Sri Lanka, is also due to ageostrophic motion. Thepre-break to break departures (Figure 7(e)) indicate that a significantly higher magnitude of generation takesplace off the Konkan–Goa coasts and the southwestern Bay of Bengal, off Tamil Nadu and Sri Lankancoasts. In the post-break to break departure, significant generation of KE takes place over the northeasternBay of Bengal and adjoining Mayanmar, northwestern India and less generation over the southeastern ArabianSea and the Arabian Peninsula (Figure 7(f)). This is borne out through sea-level pressure and contour chart
Copyright 2004 Royal Meteorological Society Int. J. Climatol. 24: 341–360 (2004)

INDIAN SUMMER MONSOON BREAKS 353
analysis, particularly in the lower levels, where strong pressure gradients in the regions are observed withcross-isobaric flow. However, during the pre-break, in the equatorial zone, negative generation or very littlepositive generation is observed. In other words, this is a weak zone of generation of KE. In fact, the equatoror the region south of it in the Indian Ocean is a region of weak generation of KE.
In order to understand the characteristic features of KE generation over the area of study, the twocomponents of adiabatic generation of KE, namely the zonal adiabatic generation of KE and the meridionaladiabatic generation of KE, are presented in Figure 8. Studies by Kung (1966a,b) indicated that the zonalcomponent contributes to destruction of KE in the tropics and generation of KE in the extratropics. On theother hand, the meridional component contributes towards generation in the tropics and destruction in theextratropics. The zonal generation during the break (Figure 8(a)) indicates destruction over and off Arabia andthe northeastern Bay of Bengal and its neighbourhood, but strong generation is indicated over the Indian landmass, particularly the southern peninsula. However, in the monsoon domain, the zonal component leads togeneration and destruction of KE. Moreover, significantly higher destruction is observed over the northeasternBay of Bengal during pre- and post-break departures (Figure 8(b) and (c)).
Figure 8(d)–(f) indicates generation of KE due to meridional motion during the break monsoon and itsdepartures from pre- and post-break periods. During the break phase, the meridional component leads to thegeneration of KE over and off the East African coast and the northeastern Bay of Bengal and adjoiningMayanmar. Significantly higher generation of KE due to the meridional component is observed in theArabian Sea over and off the Somali coast and the Bay of Bengal during the pre-break phase (Figure 8(e)).Negative generation is also observed in the equatorial zone between 45 and 120 °E. This negative generationis absent during the post-break periods. Significant negative generation is observed over Bangladesh andthe adjoining region and the southern Bay of Bengal during pre- and post-break departures (Figure 8(e)and (f)).
3.3. Vorticity budget
Figure 9 shows the distribution of vertically integrated horizontal advection of planetary and relativevorticity during the break and its departures during pre- and post-break periods tested for their significance atthe 95% confidence level. Figure 9(a)–(c) indicates that significantly larger cyclonic vorticity due to planetarymotion is advected over the head of the Bay of Bengal region, and the monsoon trough zone during the pre-and post-break periods could be due to advection of air coming from higher latitudes, and this probablyhappens in the upper troposphere. The advection of relative vorticity is significant during pre- and post-breakdepartures over the Indian land mass and the Bay of Bengal (Figure 9(e) and (f)). The advection is cyclonicin the Arabian Sea and there is anticyclonic vorticity in the Bay of Bengal. The probable reason appears to bethe strong low-level westerlies associated with the LLJ that are associated with marked changes in the signof curvature when crossing over to the Bay of Bengal from the Arabian Sea across the southern peninsula.
3.4. Heat and moisture budget
The geographical distribution of vertically integrated horizontal flux of heat between 1000 and 100 hPaduring the break and its departures during pre- and post-break periods are shown in Figure 10(a)–(c).Horizontal flux convergence of heat of 400 to 600 W m−2 is observed over the Bay of Bengal and itextends into the South China Sea–western Pacific Ocean during the break period. During pre- and post-breakdepartures (Figure 10(b) and (c)), significantly higher flux convergence of heat is observed in the monsoontrough compared with the break phase (Figure 10(a)). This possibly could be due to higher convergence ofthe moist air over the head of the Bay of Bengal and monsoon trough zone, leading to cloud formation andrelease of latent heat. The Pacific Ocean region shows less flux of heat. It appears as if, during the breakphase, the region of heat flux convergence shifts eastwards from the Indian land mass.
The vertically integrated diabatic heating between 1000 and 100 hPa during the break and the departuresfrom it during the pre- and post-break periods are shown in Figure 10(d)–(f). During the break phase, thenortheastern Bay of Bengal and further northeastwards, extending into the South China Sea–Pacific Ocean,show diabatic heating of 200–300 W m−2. During pre-break or post-break departures (Figure 10(e) and (f)),
Copyright 2004 Royal Meteorological Society Int. J. Climatol. 24: 341–360 (2004)

354 R. BHATLA ET AL.
Figure 8. Geographical distributions of vertically integrated zonal adiabatic generation of kinetic energy (10−1 W m−2) for (a) break,(b) pre-break–break, (c) post-break–break. (d), (e) and (f) Same as (a), (b) and (c) respectively, but for meridional adiabatic generation
of kinetic energy (10−1 W m−2) with confidence limits above 95% (shaded)
significantly higher diabatic heating is observed in the monsoon trough zone. The diabatic heating over theSouth China Sea–Pacific Ocean decreases. The diabatic heating is related to cloud formation and precipitation.During the pre- and post-break periods, a greater amount of cloud formation and associated precipitation inthe monsoon trough zone would lead to higher diabatic heating.
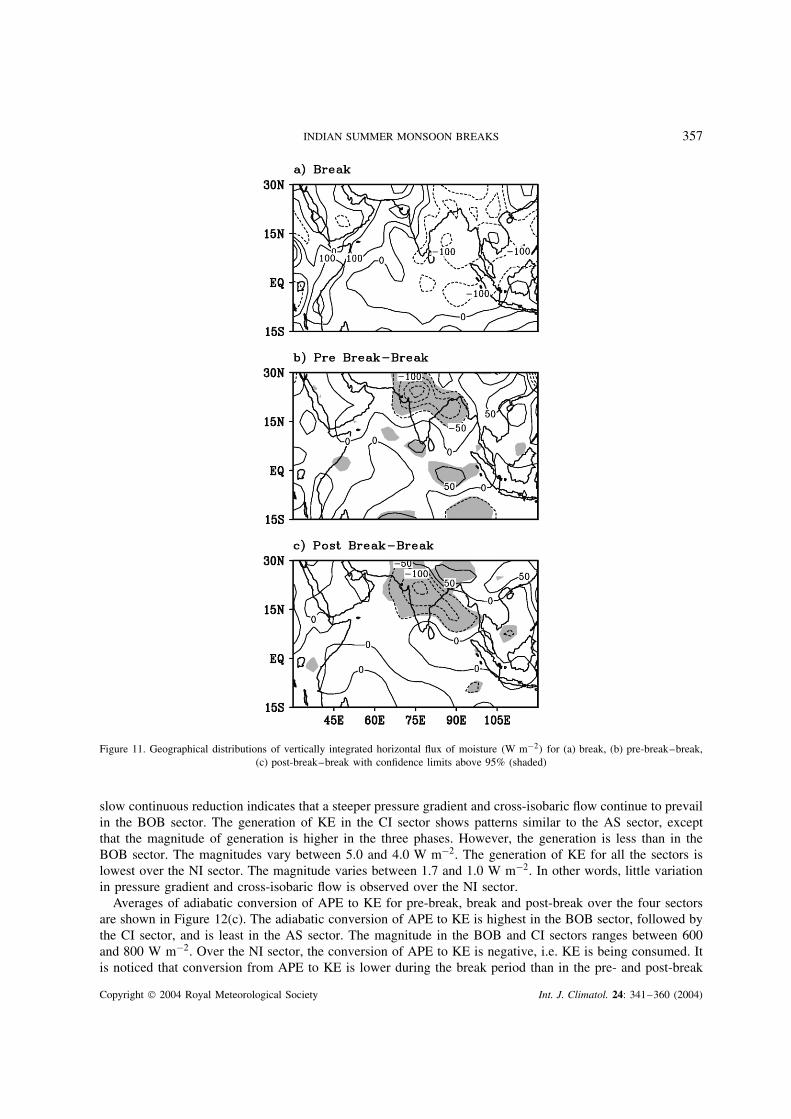
The vertically integrated horizontal moisture flux during the break and departures from it during the pre- andpost-break periods are shown in Figure 11(a)–(c). During the break phase, the northeastern Bay of Bengal andthe region extending into the South China Sea–Pacific Ocean shows horizontal convergence of moisture fluxof 100–200 W m−2. During pre-break or post-break departures, significantly higher horizontal convergenceof moisture flux is noticed in the monsoon trough zone over the Indian land mass (Figure 11(b) and (c)).Convergence of horizontal flux of moisture decreases over the Pacific Ocean–South China Sea during thepre- and post-break periods.
Copyright 2004 Royal Meteorological Society Int. J. Climatol. 24: 341–360 (2004)

INDIAN SUMMER MONSOON BREAKS 355
Figure 9. Geographical distributions of vertically integrated planetary vorticity advection (10−8 W m−2) for (a) break, (b) pre-break–break, (c) post-break–break. (d), (e) and (f) Same as (a), (b) and (c) respectively, but for relative vorticity advection (10−8 W m−2)
with confidence limits above 95% (shaded)
3.5. Sectorial studies of some aspects of energetics
In Section 3.2, the energetic aspects of break-monsoon conditions were examined over the entire domain ofthe study at the grid points of analysis. In order to see the collective response for a specific region, integratedvolume averages in respect of some of the budget terms are examined over four important sectors: ArabianSea (AS), Bay of Bengal (BOB), central India (CI) and northern India (NI); see Figure 1.
Averages of horizontal flux of KE for the pre-break, break and post-break over the four significant sectorsare shown in Figure 12(a). The horizontal flux of KE in the AS sector is convergent. However, during thebreak phase the convergence flux is higher than during the pre- and post-break epochs. The horizontal flux ofKE is highly divergent in the BOB sector. The magnitude is of the order of 4.2 W m−2. However, the fluxgradually decreases from pre-break to post-break in the BOB sector. The horizontal flux of KE over the CI
Copyright 2004 Royal Meteorological Society Int. J. Climatol. 24: 341–360 (2004)

356 R. BHATLA ET AL.
Figure 10. Geographical distributions of vertically integrated horizontal flux of heat (W m−2) for (a) break, (b) pre-break–break,(c) post-break–break. (d), (e) and (f) Same as (a), (b) and (c) respectively, but for diabatic heating (W m−2) with confidence limits
above 95% (shaded)
sector is considerably less divergent than in the BOB sector and decreases from the pre- break to the breakphase, but does not show any change subsequently. The horizontal flux of KE is weakly convergent and isat a minimum during the break period for the NI sector.
Figure 12(b) shows the average of the adiabatic generation of KE over the four sectors during the pre-break,break and break periods. The magnitude of the average of the generation of KE over the AS sector duringthe pre-break is 3 W m−2; during the break this reduces to 1.5 W m−2, and after the cessation of the break itincreases to 2.3 W m−2. Since the generation is due to cross-isobaric flow, it is evident that during the breakthe pressure gradient becomes slack in the AS sector. The generation of KE over the BOB sector during allthree periods, i.e. before, during and after the break, is very high compared with the AS sector and showsa gradual continuous decrease. The magnitude varies between 7.0 and 6.0 W m−2. The high magnitude and
Copyright 2004 Royal Meteorological Society Int. J. Climatol. 24: 341–360 (2004)
INDIAN SUMMER MONSOON BREAKS 357
Figure 11. Geographical distributions of vertically integrated horizontal flux of moisture (W m−2) for (a) break, (b) pre-break–break,(c) post-break–break with confidence limits above 95% (shaded)
slow continuous reduction indicates that a steeper pressure gradient and cross-isobaric flow continue to prevailin the BOB sector. The generation of KE in the CI sector shows patterns similar to the AS sector, exceptthat the magnitude of generation is higher in the three phases. However, the generation is less than in theBOB sector. The magnitudes vary between 5.0 and 4.0 W m−2. The generation of KE for all the sectors islowest over the NI sector. The magnitude varies between 1.7 and 1.0 W m−2. In other words, little variationin pressure gradient and cross-isobaric flow is observed over the NI sector.
Averages of adiabatic conversion of APE to KE for pre-break, break and post-break over the four sectorsare shown in Figure 12(c). The adiabatic conversion of APE to KE is highest in the BOB sector, followed bythe CI sector, and is least in the AS sector. The magnitude in the BOB and CI sectors ranges between 600and 800 W m−2. Over the NI sector, the conversion of APE to KE is negative, i.e. KE is being consumed. Itis noticed that conversion from APE to KE is lower during the break period than in the pre- and post-break
Copyright 2004 Royal Meteorological Society Int. J. Climatol. 24: 341–360 (2004)

358 R. BHATLA ET AL.
Figure 12. Variations (W m−2) of vertically integrated (a) adiabatic generation of KE, (b) horizontal flux of KE, (c) horizontal flux ofheat, (d) adiabatic conversion of APE to KE, (e) diabatic heating, (f) horizontal flux of moisture over the sectors AS, BOB, CI and NI
for pre-break, break and post-break periods
periods. The probable reason appears to be that, convectively, the BOB and CI sectors are the most activeregions. During the break, the convective activity decreases, causing a reduction in APE. The AS sector isnot convectively active, except close to the west coast of India. The opposite behaviour of the NI sector,compared with the other sector, is due to the fact that this sector consists generally of an area north of themonsoon trough line, where sinking motion prevails.
Figure 12(d) shows the average of the horizontal flux of heat over the four sectors during the pre-break,break and post-break periods. The horizontal flux of heat is weakly convergent in the AS sector duringthe break period, as well as during pre- and post-break periods. Its magnitude is 50 W m−2 during the
Copyright 2004 Royal Meteorological Society Int. J. Climatol. 24: 341–360 (2004)

INDIAN SUMMER MONSOON BREAKS 359
break period. It is strongly convergent in the BOB sector in the pre- and post-break periods. Its magnitude(475 W m−2) is less during the break period. The pattern followed in the CI sector is similar to that in theBOB sector and is less during the break phase. The horizontal heat flux pattern in NI sector is opposite tothat of the AS, BOB and CI sectors, i.e. it is divergent in the pre-break, break and post-break periods. It ismore during the break period, at 300 W m−2.
Figure 12(e) shows the average of diabatic heat over the four sectors during the pre-break, break andpost-break periods. The diabatic heating in the BOB and CI sectors is highest and varies between 200 and300 W m−2. It is a minimum over the NI sector and negative in the AS sector. As stated earlier, the convectionis responsible for intense diabatic heating in the BOB and CI sectors. Over the NI sector, the convectionis not large enough to cause intense heating. Over the AS sector, there is weak diabatic cooling, possiblydue to evaporative cooling. The decrease in diabatic heating during the break period is due to a reduction inconvection.
The averages of the horizontal flux of divergence of moisture for the pre-break, break and post-breakperiods over the four significant sectors are shown in Figure 12(f). The BOB and CI sectors are the regionsof horizontal flux of convergence of moisture. The magnitude varies between 100 and 200 W m−2. The NIsector is a very significant region of flux divergence of moisture, and the magnitude varies between 200 and300 W m−2. The AS sector is a very weak region of flux divergence of moisture. During the break period,the moisture flux convergence decreases over the BOB and CI sectors, whereas moisture flux divergenceincreases over the NI sector.
From examination of Figure 12, one may state that the BOB and CI sectors are the most active, where themagnitudes of generation of KE, horizontal flux of KE, horizontal flux of heat, conversion of APE to KE,diabatic heat and horizontal flux of divergence of moisture are highest. Further, the changes from pre-breakto break and post-break are also most significant in these two regions. The changes in the CI sector are farsharper than in the BOB sector.
4. CONCLUSIONS
The results of this study clearly demonstrate a close consistency between dynamic and thermodynamic featuresduring commencement/cessation of break situations along the monsoon trough. The broad conclusions are asfollows.
Significant changes in the easterlies are observed at 850 hPa in the monsoon trough zone in the pre- andpost-break departures. The easterlies to the north of the monsoon trough line during the post-break period arecomparatively stronger and more extensive than in the pre-break period. Similarly, significant changes in theomega field and vorticity at 850 hPa are noticed in the monsoon trough zone, the coastal regions of westernIndia and the southwestern Bay of Bengal, off the Tamil Nadu coast, during the pre-break to break and breakto post-break periods.
At 200 hPa, significant upward motion and weaker anticyclonic vorticity are observed in the monsoontrough zone during the pre- and post-break periods, which is due to weakening of easterlies associated withthe weakening of Tibetan anticyclones, as is indicated by the departures.
The zonal averaged wind field in the domain 30 to 120 °E indicates two belts, at 0–10 °N and 15–25 °N,where significant changes in zonal wind take place over the whole pre- to post-break period. Similar changesare also observed in the vertical velocity proceeding from the pre-break to break phase: the northern beltweakens and the southern belt strengthens. During the break to post-break period the process is reversed.
A stronger flux convergence of KE in the central Arabian Sea and flux divergence in the northeastern Bayof Bengal are observed during the break period, and this weakens considerably during the pre- and post-breakperiods. In order to understand the characteristic features of KE generation, the zonal component leads to asignificantly higher destruction over the northeastern Bay of Bengal, whereas the meridional component leadsto the generation of KE over the Bay of Bengal during the pre- and post-break departures.
Significant changes in the diabatic heating and in the horizontal flux of heat and moisture are observed inthe monsoon trough zone, the central and northwestern Bay of Bengal from pre-break to break and its revival.
Copyright 2004 Royal Meteorological Society Int. J. Climatol. 24: 341–360 (2004)

360 R. BHATLA ET AL.
The reduction in the flux of moisture, horizontal flux of heat and diabatic heating are noticed in the monsoontrough zone from the pre-break to break periods. The moist easterlies to the north of the monsoon troughline are replaced by drier westerlies or northwesterlies in the monsoon trough zone in the lower and middletroposphere, and this leads to drying of the atmosphere and hence to a reduced flux of moisture, sensible heatand latent heat in the monsoon trough zone during the break period.
The energetics over the four different sectors examined indicate that the BOB and CI sectors are areas ofhigher magnitudes and changes from pre-break to break and break to post-break (in respect of generation ofKE, horizontal flux of KE, horizontal flux of heat, conversion of APE to KE, diabatic heating and horizontalflux divergence of moisture) than the AS and NI sectors.
ACKNOWLEDGEMENTS
We wish to express our sincere thanks to NCEP–NCAR, USA, for providing the necessary data sets. Wealso gratefully acknowledge the Department of Science and Technology for financial support to complete thework.
REFERENCES
De US, Lele RR, Natu JC. 1998. Breaks in southwest monsoon. Pre-published Scientific Report No. 1998/3.Kalnay E, Kanamitsu M, Kistler R, Collins W, Deaven D, Gandin L, Iredell M, Saha S, White G, Woollen J, Zhu Y, Chelliah M,
Ebisuzaki W, Higgins W, Janowiak J, Mo KC, Ropelewski C, Wang J, Leetmaa A, Reynolds R, Jenne R, Joseph D. 1996. TheNCEP/NCAR 40years reanalysis project. Bulletin of the American Meteorological Society 77: 437–471.
Krishnamurti TN, Ardanuy P. 1980. The 10 to 20-day westward propagating mode and ‘breaks in the monsoons’. Tellus 32: 15–26.Krishnan B, Zhang C, Sugi M. 2000. Dynamics of breaks in the Indian summer monsoon. Journal of the Atmospheric Sciences 37:
1354–1372.Koteswaram P. 1950. Upper levels lows in low latitudes in the Indian area during southwest monsoon season and breaks in monsoon.
Indian Journal of Meteorology and Geophysics 1: 162–164.Kung EC. 1966a. Kinetic energy generation and dissipation in the large-scale atmospheric circulation. Monthly Weather Review 94:
67–82.Kung EC. 1966b. Large scale balance of kinetic energy in the atmosphere. Monthly Weather Review 94: 627–640.Malurkar SL. 1950. Notes on analysis of weather of India and neighborhood. Memoirs of Indian Meteorological Department, XXVLL,
Part IV; 139–215.Mukherjee AK, Natarajan G. 1968. Westward moving sea level low pressure systems in the south Bay of Bengal during southwest
monsoon. Indian Journal of Meteorology and Geophysics 19(3): 284–288.Mohanty UC, Dube SK, Sinha PC. 1982a. On the large scale energetics in the onset and maintenance of summer monsoon — I: heat
budget. Mausam 33: 139–152.Mohanty UC, Dube SK, Sinha PC. 1982b. On the large scale energetics in the onset and maintenance of summer monsoon — II:
moisture budget. Mausam 33: 285–294.O’Brein JJ. 1970. Alternative solutions to classical vertical velocity problems. Journal of Applied Meteorology 9: 197–203.Pisharoty PR, Desai BN. 1956. Western disturbances and Indian weather. Indian Journal of Meteorology and Geophysics 7: 333–338.Ramamurthy K. 1969. Some aspects of ‘break’ in the Indian southwest monsoon during July and August. Forecasting manual. Indian
Meteorological Department Publication, FMU, Rep. 4, 18.3.Raman CRV, Rao YP. 1981. Blocking highs over Asia and monsoon droughts over India. Nature 289: 221–223.Ramaswamy C. 1962. Breaks in the India summer monsoon as a phenomenon of interaction between easterly and the subtropical
westerly jet streams. Tellus 14: 337–349.Ramaswamy C, Pareek RS. 1978. The south-west monsoon over India and its teleconnections with the middle and upper tropospheric
flow patterns over the Southern Hemisphere. Tellus 30: 126–135.Rao YP. 1976. Southwest Monsoon. Meteorology Monograph No. 1. India Meteorological Department: 1–367.Rodwell MJ. 1997. Breaks in the Asian monsoon: the influence of Southern Hemisphere weather systems. Journal of the Atmospheric
Sciences 54: 2597–2611.Unninayar MS, Murakami T. 1978. Temporal variations in the northern hemispheric summer monsoon circulations. Indian Journal of
Meteorology, Hydrology and Geophysics 29: 170–186.
Copyright 2004 Royal Meteorological Society Int. J. Climatol. 24: 341–360 (2004)