Embed Size (px)
Citation preview

A study into the effects of different ligation
techniques on mandibular incisor alignment
By
Rachel Ann Little
BDS, MFDS RCS (Edin), MOrth RCS (Edin)
A thesis submitted to the University of Birmingham
for the degree of Master of Philosophy
School of Dentistry
St. Chad’s Queensway
Birmingham
B4 6NN
February 2016
University of Birmingham Research Archive
e-theses repository This unpublished thesis/dissertation is copyright of the author and/or third parties. The intellectual property rights of the author or third parties in respect of this work are as defined by The Copyright Designs and Patents Act 1988 or as modified by any successor legislation. Any use made of information contained in this thesis/dissertation must be in accordance with that legislation and must be properly acknowledged. Further distribution or reproduction in any format is prohibited without the permission of the copyright holder.

Abstract
Aims
To determine whether ligation with figure of eight modules affects the rate of
lower incisor alignment compared with conventionally tied modules and to
establish whether there are any differences in the number of bracket failures
between the two groups.
Methods
Ethical approval was obtained. Participants were randomly allocated to
conventional module or figure of eight module groups, stratified for extraction or
non extraction treatment. Lower labial segment alignment was measured on study
models using Little’s Irregularity Index at the start (T0) of treatment, at 6 weeks
(T1) and 12 weeks (T2). Case records were analysed to assess the number of
bracket failures per patient.
Results
100 subjects participated. In both groups the fastest rate of alignment was
between T0 and T1; 3.20mm/month and 3.54mm/month in the conventional and
figure of eight module groups respectively. The difference between the groups
was not statistically significant. The bracket failure rate was also similar in both
test groups; 4.4% for conventional and 3.6% for figure of eight ligation.

Conclusions
Ligation with the tighter figure of eight module configuration has no clinically
significant effect on the rate of lower incisor alignment. Therefore it seems that
figure of eight ligation does not hinder the alignment of the teeth. There were no
differences in the average number of bracket failures per person.

Acknowledgements
I would like to express my heartfelt thanks to Mr D Spary, for the initial idea of the
study, for his assistance in recruitment of patients and carrying out the orthodontic
treatment, and his continuous support and encouragement.
I would like to thank Dr A Dhopatkar for his support and guidance during the
course of this research and in the preparation of this thesis.
I am grateful to Professor T Dietrich and Mr A Cutts for their assistance with
statistical analysis.
I wish to express my gratitude to Dr J Harrison for all her support and guidance.
I would like to thank all of the operators who undertook the orthodontic treatment
for the clinical trial and the laboratory staff who produced all of the study models.

CONTENTS
Chapter Page
1 Literature review 1
2 Materials and methods 42
3 Results 52
4 Discussion 69
5 Conclusions 79
6 Appendices 83
7 List of references 100

CHAPTER 1: LITERATURE REVIEW
Page
1.1 Introduction 4
1.2 Elastomeric modules: composition and form 5
1.2.1 In vivo effects on polyurethanes 7
1.2.2 Dimensions of an elastomeric module 13
1.2.3 The effect of colour on an elastomeric module 14
1.2.4 Addition of lubricants to elastomeric modules 15
1.3 Friction 16
1.3.1 Background 16
1.3.2 Bracket material 20
1.3.3 Archwire material 21
1.3.4 Archwire cross-sectional shape 24
1.3.5 Method of ligation 25
1.3.5.1 Bracket failures in relation to ligation
method
29
1.3.6 Saliva 31
1.3.7 Masticatory function 33
1.3.8 Sliding velocity 34
1.4 Rate of tooth movement and force magnitude 35
1.5 Rate of alignment 37

1.6 Little’s Irregularity Index 39
1.7 Aims 41
1.8 Null hypothesis 41
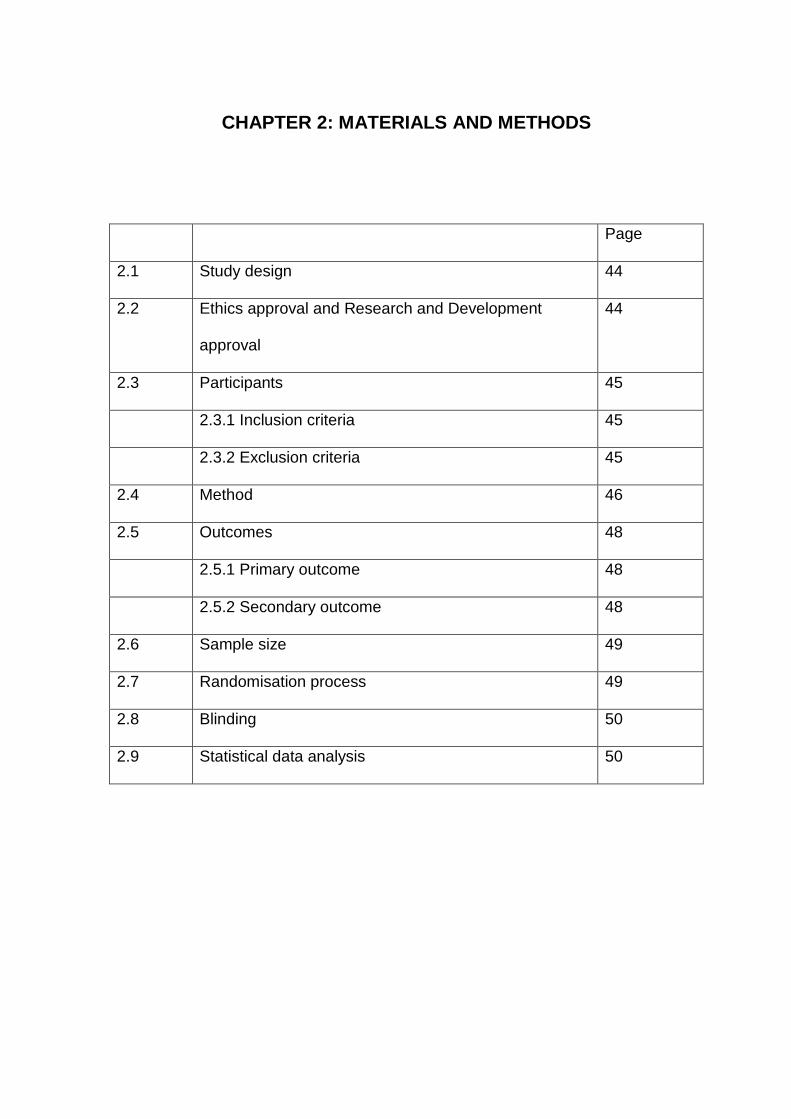
CHAPTER 2: MATERIALS AND METHODS
Page
2.1 Study design 44
2.2 Ethics approval and Research and Development
approval
44
2.3 Participants 45
2.3.1 Inclusion criteria 45
2.3.2 Exclusion criteria 45
2.4 Method 46
2.5 Outcomes 48
2.5.1 Primary outcome 48
2.5.2 Secondary outcome 48
2.6 Sample size 49
2.7 Randomisation process 49
2.8 Blinding 50
2.9 Statistical data analysis 50

CHAPTER 3: RESULTS
Page
3.1 Baseline results 54
3.2 Results 55
3.2.1 Alignment 55
3.2.2 Rate of lower incisor alignment 57
3.2.3 Number of bracket failures 59
3.2.4 Distribution of bracket failures 61
3.3 Analysis of results 62
3.3.1 Independent samples t-tests 62
3.3.2 Mann-Whitney U tests 66
3.4 Intra-examiner reliability 67
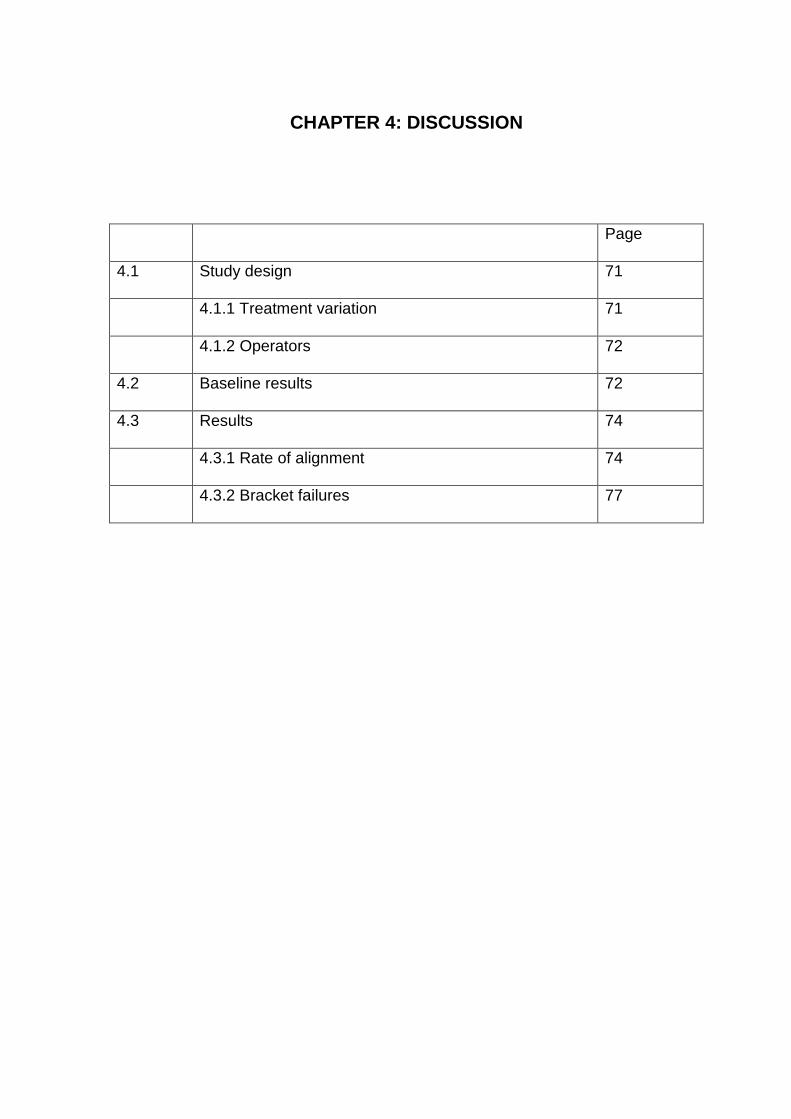
CHAPTER 4: DISCUSSION
Page
4.1 Study design 71
4.1.1 Treatment variation 71
4.1.2 Operators 72
4.2 Baseline results 72
4.3 Results 74
4.3.1 Rate of alignment 74
4.3.2 Bracket failures 77
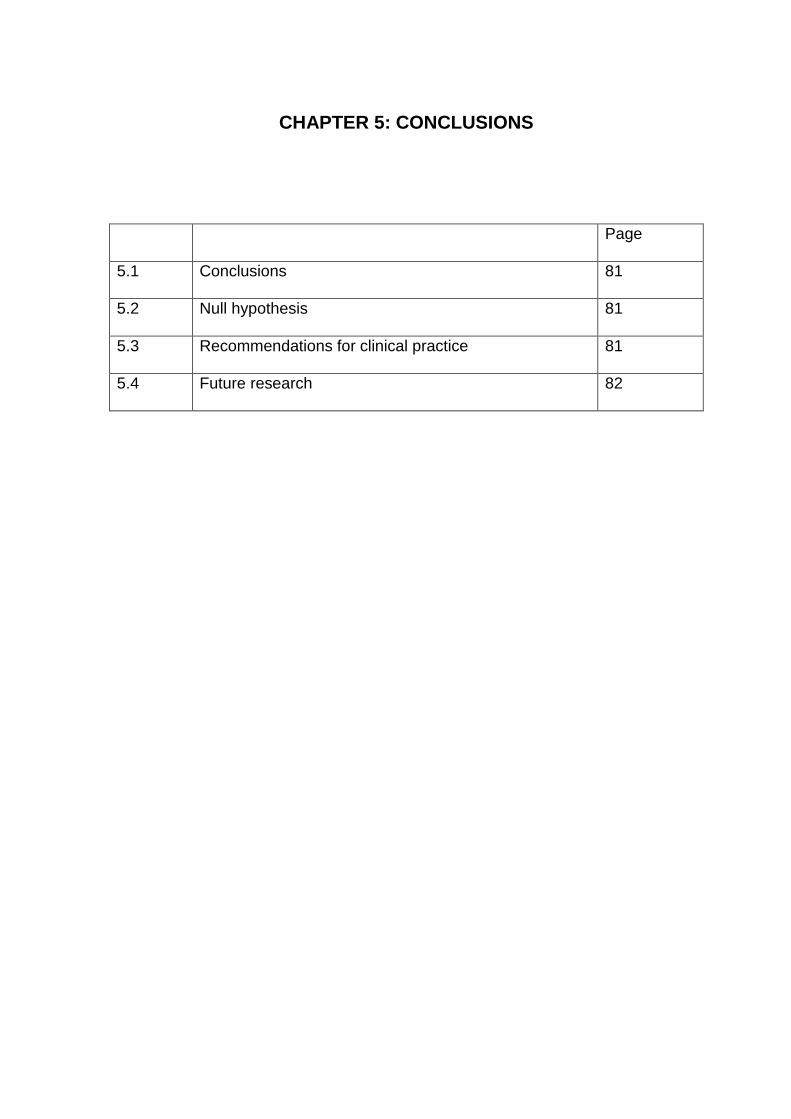
CHAPTER 5: CONCLUSIONS
Page
5.1 Conclusions 81
5.2 Null hypothesis 81
5.3 Recommendations for clinical practice 81
5.4 Future research 82
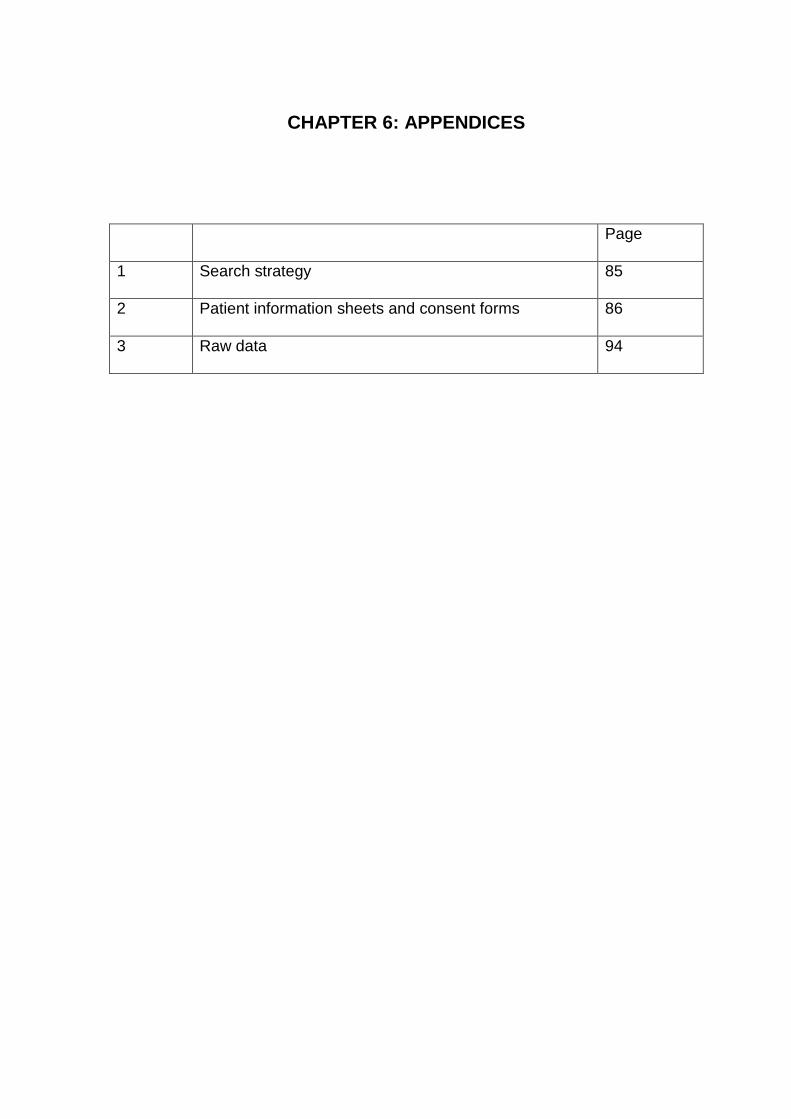
CHAPTER 6: APPENDICES
Page
1 Search strategy 85
2 Patient information sheets and consent forms 86
3 Raw data 94
LIST OF FIGURES
Page
1.1 Dimensions of an elastomeric module 13
3.1 CONSORT flow diagram for patients through the trial 54
3.2 Bland and Altman plot for intra-examiner reliability 68
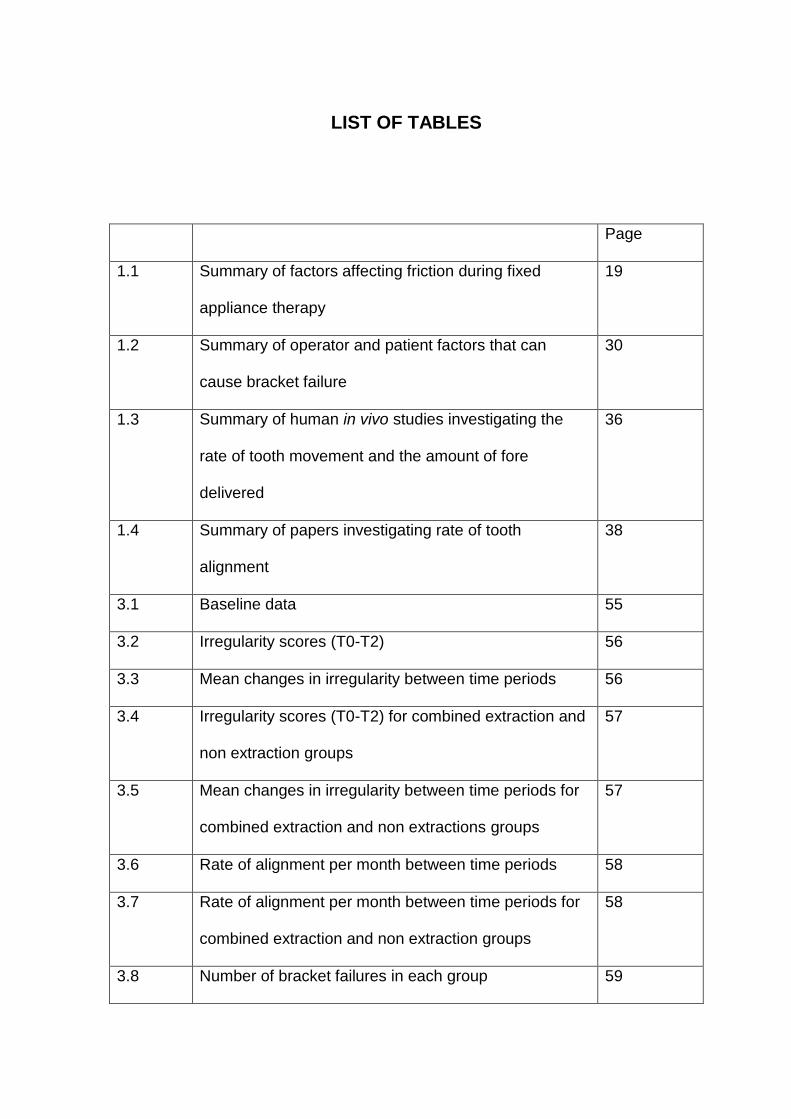
LIST OF TABLES
Page
1.1 Summary of factors affecting friction during fixed
appliance therapy
19
1.2 Summary of operator and patient factors that can
cause bracket failure
30
1.3 Summary of human in vivo studies investigating the
rate of tooth movement and the amount of fore
delivered
36
1.4 Summary of papers investigating rate of tooth
alignment
38
3.1 Baseline data 55
3.2 Irregularity scores (T0-T2) 56
3.3 Mean changes in irregularity between time periods 56
3.4 Irregularity scores (T0-T2) for combined extraction and
non extraction groups
57
3.5 Mean changes in irregularity between time periods for
combined extraction and non extractions groups
57
3.6 Rate of alignment per month between time periods 58
3.7 Rate of alignment per month between time periods for
combined extraction and non extraction groups
58
3.8 Number of bracket failures in each group 59

3.9 Number of bracket failures and average number of
bracket failures per person
60
3.10 Number of bracket failures and average number of
bracket failures per person for combined extraction and
non extraction groups
60
3.11 Distribution of bracket failures 61
3.12 Time period when bracket failures occurred 61
3.13 Distribution of bracket failures according to bracket
type and side
62
3.14 Independent samples t-tests to compare the effect of
extraction and non extraction treatment for the
conventional module groups between each time period
63
3.15 Independent samples t-tests to compare the effect of
extraction and non extraction treatment for the figure of
eight module groups between each time period
63
3.16 Independent samples t-tests to compare the effect of
conventional module and figure of eight module ligation
for the extraction treatment group between each time
period
64
3.17 Independent samples t-tests to compare the effect of
conventional module and figure of eight module ligation
for the non extraction treatment group between each
time period
65
3.18 Independent samples t-tests to compare the effect of 65

conventional module and figure of eight module ligation
for the combined extraction and non extraction data
between each time period
3.19 Mann-Whitney U tests to compare the effect of
extraction and non extraction treatment, for the
conventional module and figure of eight module
groups, on the bracket failure rate
66
3.20 Mann-Whitney U tests to compare the effect of
conventional modules and figure of eight modules, for
the extraction and non extraction treatment groups, on
the bracket failure rate
67
1
Chapter 1
LITERATURE REVIEW

2
CHAPTER 1: LITERATURE REVIEW
Page
1.1 Introduction 4
1.2 Elastomeric modules: composition and form 5
1.2.1 In vivo effects on polyurethanes 7
1.2.2 Dimensions of an elastomeric module 13
1.2.3 The effect of colour on an elastomeric module 14
1.2.4 Addition of lubricants to elastomeric modules 15
1.3 Friction 16
1.3.1 Background 16
1.3.2 Bracket material 20
1.3.3 Archwire material 21
1.3.4 Archwire cross-sectional shape 24
1.3.5 Method of ligation 25
1.3.5.1 Bracket failures in relation to ligation
method
29
1.3.6 Saliva 31
1.3.7 Masticatory function 33
1.3.8 Sliding velocity 34
1.4 Rate of tooth movement and force magnitude 35
1.5 Rate of alignment 37
1.6 Little’s Irregularity Index 39

3
1.7 Aims 41
1.8 Null hypothesis 41
4
1.1 Introduction
The edgewise appliance (Angle, 1928) and its modern day derivative, the
ubiquitous pre-adjusted edgewise appliance rely on secure ligation of the
archwires into the brackets. Stainless steel ligatures, pins, elastomeric modules
and self ligating spring clips or slides have been used successfully for many
years. Since their introduction in the 1960s elastomeric modules have become
the most popular choice with clinicians due to their ease of use, quick application
and removal. Patients can also find them attractive by virtue of the many colours
available.
Friction in orthodontics has long been a topic for debate. It is generally believed
that frictional resistance must be minimised during sliding mechanics so that tooth
movement can be generated through light optimal forces. Sliding mechanics is
impossible when using standard edgewise appliances as numerous bends are
required to finalise tooth positioning. In pre-adjusted edgewise appliances, first,
second and third order movements are incorporated within the bracket system so
that the archwire is flat and straight following tooth alignment. This facilitates
space closure by allowing the teeth to slide along the archwire. Sliding mechanics
reduce the need for wire bending, ensure lower forces are required and provide
good labial torque control. If frictional forces are high, the efficiency of the system
is affected and the treatment time may be extended or the outcome compromised
(Drescher et al., 1989).

5
The nature of ligation is an important contributor to frictional force. Ideal
requirements of a ligating system are that it must be robust, ensure full bracket
engagement, exhibit low friction between the archwire and bracket, be quick and
easy to use, permit high friction when required, assist good oral hygiene and be
comfortable for the patient (Harradine, 2003). Although elastomeric modules are
the most commonly used ligation method, they have been found to produce
higher frictional forces than other methods (Ireland et al., 1991; Shivapuja et al.,
1994; Griffiths et al., 2005). Elastomeric modules may also encourage plaque
accumulation around the bracket archwire interface, predisposing to
decalcification or periodontal disease (Taloumis et al., 1997). Stainless steel
ligatures are more time consuming to apply, produce variable ligation forces and
pose the risk of soft tissue laceration to the patient and the orthodontist
(Shivapuja and Berger 1994; Hain et al., 2006; Maijer and Smith, 1990). Studies
on self-ligating bracket systems have shown considerable reductions in friction
(Berger, 1990; Maijer and Smith, 1990), but they are more costly and conflicting
evidence has been published on whether this bracket system clinically quickens
treatment time.
1.2 Elastomeric modules: composition and form
Elastomeric orthodontic modules are polyurethanes, which are thermosetting
polymer products of a step-reaction polymerisation process (Eliades et al., 1999).
Even though it is know that elastomeric modules are polyurethane-based, their
exact composition is patent-protected. They can be fabricated either by injection
6
moulding or by cutting from elastomeric tubing (Chimenti et al., 2005). An ex vivo
study found that stretched die-cut stamped elastomeric chains maintained a
higher level of remaining force than the injection moulded chains (Hershey and
Reynolds, 1975). A more recent in vivo study comparing the force decay between
the two types of elastomers has shown that there is no clinical difference
(Bousquet et al., 2006).
Elastomeric modules are composed of either poly(ether)urethanes or
poly(ester)urethanes. Polyurethane elastomers are a product of the
rearrangement polymerisation of diisocyanates and polyols. The three principal
constituents that react are (1) a diisocyanate (Ar-NCO); (2) a long chain hydroxy-
terminated polyol, either as a polyether or a polyester (R-OH); and (3) a chain
extender which is either a short chain or a diamine. These polymers contain short
rigid portions (aromatic rings and ureas) joined by short flexible ‘hinges’ (diamine
linker and CH2 group between the aromatic ring) and long very flexible portions
(polyether) whose length can be adjusted. The elastomeric polymer can be easily
stretched and largely regains its shape on relaxation (Eliades et al., 2005). At rest
polymer chains are randomly coiled and upon extension the chains are elongated
into an ordered structure. When the elongation stress is removed, the chains
exhibit elastic behaviour and tend to revert back to their original disorganised
state (Wong, 1976).
7
Polyurethane elastomers possess a reasonable degree of stability in aqueous
environments; however the presence of ester or ether backbone linkages
increases the susceptibility to hydrolytic attack (Huget et al., 1990). Despite most
orthodontic elastomeric modules sharing a similar manufacturing process,
significant variations in their force decay characteristics and force relaxation
patterns have been reported (De Genova et al., 1985; Kuster et al., 1986). These
difference may be attributed to (a) processing techniques (injection moulding or
cutting); (b) additives included into the final product; (c) different dimensional
(presence or absence of inter-modular link) or morphological (ellipsoid or circular
modules) characteristics of the chains (Eliades et al., 1999).
1.2.1 In vivo effects on polyurethanes
Polyurethane elastomeric modules do not exhibit perfect elastic behaviour as their
mechanical properties are affected by temperature and time (De Genova et al.,
1985). The major limitation of ex vivo experiments is the inability to accurately
replicate the dynamic conditions of the oral cavity. The main distinguishing factor
is the presence of complex oral flora and their by-products, as well as the
accumulation of plaque (Eliades and Bourauel, 2005). Other factors to consider in
vivo that may alter the elastic properties of elastomers are chemicals from the
saliva, food or oral hygiene products, thermal effects due to the ingestion of hot
and cold foods, and mechanical effects, due to mastication and oral hygiene
techniques (Ash and Nikolai, 1978; Kuster et al., 1986; De Genova et al., 1985).
8
The majority of studies undertaken on polyurethanes have used ex vivo testing.
Experiments are standardised in an attempt to replicate the oral environment but
it is impossible to control all of the factors that may have an impact in a clinical
situation (Rock et al., 1986). It is important not to overlook the effects of an in vivo
environment on the clinical properties of a material (Ash and Nikolai, 1978; Kuster
et al., 1986; De Genova et al., 1985; Ferriter et al., 1990; Taloumis et al., 1997).
Elastic polymers are relatively unaffected by short exposures to water but under
prolonged contact with water, dilute acids or moist heat, decomposition occurs
along with swelling of the material and slow hydrolysis. The staining of these
polymers in the oral cavity can be attributed to filling of the voids in the rubber
matrix by fluids and bacterial debris (Wong, 1976). They are also degraded by
ozone through an autocatalytic process, which decreases their tensile strength
and flexibility (Young and Sandrik, 1979). The absorption of lipids has been
shown to cause structural alterations to the polyurethanes; these complexes act
as a nuclei for calcification, lower the glass transitional temperature of the
polymer and induce a plasticising effect (Eliades and Bourauel, 2005). Molecular
chain stretching, slippage between adjacent molecular chains and molecular
chain breakage can all cause permanent deformation of polymeric materials
(Eliades et al., 2004). If polymer chains slip past one another, viscous behaviour
can occur that is slow and irreversible; if the chains stretch and uncoil, elastic
behaviour is demonstrated that is quick and reversible (De Genova et al., 1985).
9
The force delivered by polyurethane materials is related to their molecular
structure; the glass transition temperature indicates the rigidity of a material. The
higher the temperature range, the more rigid the polymer is. Higher glass
transition temperatures are found with polyurethanes that contain more covalent
bonds or cross-linking than those with a greater proportion of secondary
interatomic bonds, such as hydrogen bonds, ionic bonds or van der Waals bonds.
A study was conducted to compare glass transition temperatures for different
brands and colours of orthodontic elastomeric chains before and after clinical use.
Rocky Mountain Orthodontics (Denver, Colorado) chains had considerably higher
glass transition temperatures than those of Ormco (Glendora, California) and
G&H (Greenwood, Indiana) before use, indicating that the latter products should
have greater flexibility. After four weeks of clinical use the glass transition
temperatures decreased for the Ormco and RMO products but unusually
increased for the G&H purple chains. Pigment had no significant effect on glass
transition temperatures on products by RMO or Ormco (Renwick et al., 2004).
The majority of research on elastomeric polymers has focused on chains or
threads. Elastomeric ligatures are composed of the same material but the clinical
applications are different, therefore the response may also be altered. This must
be borne in mind when interpreting the results of studies (Taloumis et al., 1997).
A potential source of variation between in vivo studies with elastomeric chains is
the span of the chain and the presence or absence of spacing between adjacent
teeth.

10
During the initial aligning and levelling phase elastomeric ligatures are useful
(Taloumis et al., 1997). Mechanics that require complete engagement of the
bracket slot, such as correction of rotations or torque expression, elastomeric
ligatures may not be as effective due to rapid force loss and deformation. A bench
study conducted showed that elastomeric ligatures were not effective in holding
arch wires into the bracket when rotational moments were applied (Bednar and
Gruendeman, 1993). The preadjusted edgewise appliance compromises on the
expression of prescribed torque and this may be further reduced by elastomeric
modules, that undergo stress relaxation (Gioka and Eliades, 2004). It may be
preferable to shorten the time between appointments or use alternative ligation
methods such as steel ligatures (Eliades and Bourauel, 2005).
Plastic deformation is the inability of a material to return its original shape after it
has been stretched (Bishara and Andreasen, 1970). It begins at the original
stretch and increases with time; also the smaller the original stretch, the smaller
the deformity (Andreasen and Bishara, 1970).
Elastomeric chains submerged in a 37˚C water bath for 6 weeks showed that the
most force decay occurred during the first hour and that the greater the initial
force, the greater the decay (Chau Lu et al., 1993). However De Genova et al.
(1985) found that the opposite; the higher the initial force, the smaller the force
decay. An ex vivo study investigating the force loss of elastomeric ligatures found
that the mean percentage loss was 53% to 68% in the first 24 hours (Taloumis et

11
al., 1997). It is recommended that elastomeric modules are replaced at each
routine appointment due to the reduction in failure load strengths between visits
(Dowling et al., 1998).
A study by Ash and Nikolai (1978) found that the degradation rate of elastics was
substantial immediately after activation but decreased gradually during a three
week period. The decay in the oral cavity was significantly greater than in the
water after one day for the elastic chain and for the module, after approximately
ten days. A subsequent in vivo study showed a force reduction of 50% for
elastomeric chains over a four week period (Rock et al., 1986).
A unique study of parallel laboratory and intraoral experiments was conducted to
determine whether the testing environments affected friction, using elastomeric
ligation. Intraoral friction values were significantly higher than ex vivo values and
the authors attributed this to possible lower ligation forces due to compositional
changes of the elastomeric modules intraorally from water sorption (Iwasaki et al.,
2003). This is in variance with previous work concluding that pre-stretching
elastomeric modules reduces friction by means of lower ligation forces. A pre-
stretched elastomeric module reduces friction by 40% for 0.018 inch round wires
(Taylor et al., 1996).

12
The opinions in the literature on the effect of pre-stretching elastomeric modules
on their force loss are markedly varied. Young and Sandrik (1979) reported that
pre-stretching elastomeric chain in air significantly increased the remaining force
by 17% to 25% after 24 hours. Brantley (1979) reported a 4.5% force loss in
modules pre-stretched for 3 weeks in water compared to 65% in the control
group. Baty et al. (1994) concluded any benefits from pre-stretching were minimal
and probably of no clinical benefit. A more recent study found that the effects of
pre-stretching elastomeric modules on force decay were noted mainly in the first
hour, and thus questioned the clinical value of it (Kim et al., 2005). Modules
placed in a figure of eight configuration will undoubtedly be stretched to a greater
extent than modules placed in the conventional manner.
The effects of water absorption on elastomeric modules include slippage of
molecules or polymer chains past one another, thus accelerating the force decay
of these materials. Unstretched modules placed in a synthetic saliva bath at 37˚C,
pH 6.84 for 28 days absorbed moisture in the range of 0.06% to 3.15% (Taloumis
et al., 1997). The pH of the oral cavity affects orthodontic elastomerics; the pH of
saliva ranges from 5.6 to 7.6, with a mean of 6.75. An acidic test solution (pH
4.95) induced a significantly smaller rate of decay in orthodontic polyurethane
chain elastics when compared with a neutral solution (pH 7.26) (Ferriter et al.,
1990).

13
A wide range of orthodontic modules are available on the market, differing by
dimension, colour, and the addition of fluoride or lubricants.
1.2.2 Dimensions of an elastomeric module
Elastomeric modules are marketed according to dimensions of wall thickness
(WT), outside diameter (OD) and inside diameter (ID) (Figure 1.1).
Figure 1.1 Dimensions of an elastomeric module (Taloumis et al., 1997)
Each manufacturer produces modules of differing dimensions. Moisture and heat
decrease the force levels and dimensional stability of elastomeric materials. The
greater the wall thickness and the smaller the inside diameter, the greater the
force the elastomeric ligature produces. However the outside diameter is poorly
linked with the forces generated. It would be helpful if the modules were all
marketed according to the inside diameter as this is most clinically useful

14
(Taloumis et al., 1997). These findings concur with a more current study; the
smaller the inside diameter of an elastomeric module, the greater the resistance
to sliding (Griffiths et al., 2005).
It had been proposed that small and medium elastomeric ligatures produce a
significant decrease (13 to 17%) in frictional forces when compared with large
ligatures, and this can be ascribed mainly to the wall thickness (Chimenti et al.,
2005). A more recent study contradicts this finding; they found no statistically
significant difference in the friction generated by ligatures of different sizes (Arun
and Vaz, 2011).
Elastomeric ligatures have varying degrees of excess material (flash) at their
inner and outer edges. Taloumis et al. (1997) commented that the manufacturer
Ormco consistently had the least amount of flash, along with the most consistent
force measurements. No studies have been undertaken to assess if the amount
of flash has any effects clinically.
1.2.3 The effect of colour on an elastomeric module
The addition of colouring additives to elastomeric ligatures may have a significant
effect on their tensile strength properties. Tensile strength is the maximum stress
(N) a material can withstand before fracturing or alternatively it can be measured
as the extension to tensile strength (mm); this provides an indirect measure of the

15
toughness of the ligatures. The extension to tensile strength of all the coloured
Ormco ligatures was higher than that of the clear modules from the same
manufacturer. However there was no significant difference between clear and
coloured modules from Unitek in this ex vivo study. The mean tensile strength of
all the ligatures tested decreased by 7 to 22% at four weeks, but their extension
to tensile strength had almost increased by the same percentage, therefore it is
suggested that the toughness remained roughly the same (Lam et al., 2002). The
addition of colour to modules can affect the friction; clear modules exhibited
significantly lower friction than the other modules from the same proprietary group
and they also demonstrated the lowest failure forces (Dowling et al., 1998).
It has been postulated that the force delivery of elastomeric chains is affected by
the filler material used in tinting the chains. Baty et al. (1994) found that coloured
chains of a certain manufacturer behaved similarly to the grey chain from the
same company, with the exception of purple and green chains from Ormco that
required more extension to deliver the same force as the grey chain.
1.2.4 Addition of lubricants to elastomeric modules
Super Slick modules were introduced by TP Orthodontics (LaPorte, Ind) in 2000.
They have a covalently bonded Metafix coating, which the company claim
decreases friction by more than 70%. This claim was confirmed by findings of
Hain et al. (2003;2006), who found that coated modules reduced friction by 60%

16
and 50% respectively, and also by Chimenti et al. (2005) and Arun and Vaz
(2011). Other studies have found contradictory results (Khambay et al., 2004;
Griffiths et al., 2005; Edwards et al., 2012). Furthermore one study found no
difference in the frictional forces between Super Slick modules and uncoated
modules (Crawford et al., 2010).
Hain et al. (2006) found that frictional resistance increases by approximately 80%
if the coated modules are not pre-soaked in saliva. The presence or absence of
saliva has a proportionally bigger effect on coated modules than on uncoated
modules (Hain et al., 2003).
1.3 Friction
1.3.1 Background
The first recorded experiments on friction were undertaken by Leonardo da Vinci
approximately 475 years ago (Garner et al., 1986). Friction in the orthodontic
literature was been recognised for some time; Stoner (1960) identified that
appliance inefficiency was due to dissipation of forces by friction or improper
application. Frictional forces are encountered in an opposite direction to the
moving body, therefore it is important that these forces are eliminated or at least
minimised when orthodontic tooth movement is planned (Drescher et al., 1989),
otherwise tooth movement may be entirely inhibited or anchorage jeopardised
(Edwards et al., 1995). In the fixed appliance system, 12-60% of applied force

17
may be lost due to friction (Kusy and Whitley, 1997). Low friction is particularly
advantageous in extraction cases where sliding mechanics are required to
achieve translatory movements (Cacciafesta et al., 2003).
Friction is defined as “the force tangential to the common boundary of two bodies
in contact that resists the motion of one relative to the other; it is proportional to
the force with which the two surfaces are pressed together and dependent on the
nature of the surfaces in contact” (Drescher et al., 1989). It is independent of the
area of contact and sliding velocity (O’Reilly et al., 1999). The friction between
two or more materials can be represented as FF = μΣN, where ΣN is the sum of
the contacting (or normal) forces in all planes of space, and μ is the coefficient of
friction between materials (De Franco et al., 1995). The coefficient of friction is a
constant for a given material and is dependent upon surface roughness, texture
or hardness (Loftus and Årtun, 2001). The classic laws of friction are applicable to
metals under normal conditions, but for other materials or extreme conditions,
such as the intraoral environment, these laws are less reliable (O’Reilly et al.,
1999).
Friction reduces the efficiency of the fixed appliance system, resulting in an
increased force required to achieve the desired result (Articolo and Kusy, 1999),
however low forces are preferable to prevent anchorage loss (Quinn and
Yoshikawa, 1985) and facilitate sliding mechanics. Additionally, low forces may

18
increase patient comfort (Kusy and Whitley, 1997) and reduce the risk of root
resorption (Harry and Sims, 1982).
During orthodontic tooth movement, the friction encountered can be divided into
two separate entities:
1) Static friction – The resistance that prevents initial tooth movement (or force
required to initiate tooth movement);
2) Kinetic friction – The force that resists tooth movement.
The coefficients of static and kinetic friction depend upon the relative roughness
of the contacting surfaces and are determined in lab based experiments. The
static coefficient is always larger than its kinetic counterpart (Frank and Nikolai,
1980). A stainless steel couple (brackets and archwires) produces the lowest
coefficients of friction (Kusy and Whitley, 1989).
Clinically tooth movement occurs as a series of short steps rather than a smooth
continuous motion. To begin with static friction between the bracket and archwire
must be overcome to initiate tooth movement. Kinetic friction arises as the crown
of the tooth tips in the direction of the applied force. The crown inevitably tips
before the root does, creating a couple between the bracket and the archwire; this
stops crown movement and acts to upright the root. Bony and periodontal
remodelling ensues along the root surface and then the cycle continues (Frank

19
and Nikolai, 1980). Drescher et al. (1989) reported that the retarding force or
biologic resistance is the most important factor affecting friction in tooth-guided
archwire mechanics. Even though the importance of biological variables has been
recognised, few studies have investigated them (O’Reilly et al., 1999).
Although the present literature review has focused on the factors most relevant to
this study a plethora of factors can influence the forces exerted by an orthodontic
fixed appliance (Table 1.1). The friction in the system may not always be
predictable.
Bracket Archwire Archwire/bracket
interaction
Intra-oral
factors
Material Material Archwire/slot
dimensions
Saliva
Type Cross-sectional
shape and size
Angulation of archwire
relative to bracket slot
Masticatory
function
Width Stiffness - First order bends Sliding velocity
Inter-bracket
distance
- Second order bends
Prescription - Third order torque
Method of ligation
Table 1.1 Summary of factors affecting friction during fixed appliance
therapy

20
1.3.2 Bracket material
Friction at the interface between two objects causes resistance to the direction of
movement. As previously mentioned the frictional force is proportional to the force
with which the surfaces are pressed together and the by the nature of the surface
at the interface. Friction however is independent of the area of contact and this is
due to surface irregularities known as asperities. Real contact only occurs at a
limited number of small spots at the peaks of these asperities (Proffit et al. 2007).
Surfaces with a greater number of asperities have a greater surface roughness
and thus more force is needed to overcome the interlocking of these irregularities.
Surface roughness is determined by the type of material the bracket (or wire) is
produced from, the manufacturing process (e.g. heat treatment, polishing), and
shelf life properties (e.g. corrosion, creep) (Frank and Nikolai, 1980).
Vaughan et al. (1995) demonstrated that sintered stainless steel brackets
generated 40% less friction than cast stainless steel brackets. Sintering allows
compression of stainless steel particles into a smooth contoured shape, unlike the
casting process which requires milling, creating sharp angular brackets. These
findings were echoed by Ogata et al. (1996).
Ceramic brackets have become increasingly popular over recent years due to
their superior aesthetics over metal brackets. Tanne et al. (1991) concluded that
the amount of tooth movement with three ceramic brackets was significantly less
than with the metal bracket. They discovered that the slot surfaces and edges of
21
ceramic brackets were rougher and more porous than those of a metal bracket
and thus the wire surfaces were scratched by the ceramic brackets, whereas only
minor scratches were observed with the metal bracket. Tooth movement was less
efficient with the ceramic brackets and this was attributed to increased frictional
resistance. Keith et al. (1993), in an ex vivo experiment, similarly found that
ceramic brackets produced greater frictional resistance than stainless steel
brackets. Abrasive wear of the archwires caused by the ceramic brackets and the
subsequent wear debris may have contributed to the differences in frictional
resistance. Clinically this has important implications when utilising sliding
mechanics; increased force or decreased ligation force would be required to
overcome both the static and kinetic coefficients of friction.
In general, polycarbonate brackets show higher frictional values than stainless
steel brackets. An ex vivo experiment under dry conditions using a stainless steel
archwire and bracket to archwire angulation of 0˚, ranked stainless steel brackets
as having the least friction, followed by polycarbonate, sapphire, or porcelain
(Tselepis et al., 1994). This supported the work of Riley et al. (1979), Popli et al.
(1989), Berger (1990), and Angolkar et al. (1990).
1.3.3 Archwire material
The pre-adjusted edgewise appliance relies on the ability of orthodontic wires to
slide through brackets and tubes. Friction at this interface resists tooth movement

22
and the higher the friction, the greater the force that is needed to overcome this
and a greater anchorage need exists.
There is a general consensus that stainless steel wires demonstrate the least
resistance to sliding, followed by nickel-titanium and then β-titanium (Frank and
Nikolai, 1980; Garner et al., 1986; Drescher, 1989; Tidy, 1989; Angolkar et al.,
1990; Kusy and Whitley, 1990; Pratten et al., 1990; Ireland et al., 1991). Kusy et
al. (1988) used specular reflectance to analyse the surface roughness of
orthodontic archwires and ranked stainless steel as the smoothest, followed by
cobalt-chrome, β-titanium, and nickel-titanium. Higher frictional forces were also
observed with nickel-titanium and β-titanium wires in a study by Kapila et al.
(1990). They implied that this is due to the greater surface roughness of these
alloys than the smoother stainless steel and cobalt-chrome wires, which
demonstrated lower frictional forces.
On the contrary, Prososki et al. (1991) showed that stainless steel and β-titanium
alloy wires had the highest frictional resistance, despite stainless steel being the
smoothest, and that cobalt-chromium and nickel-titanium alloy wires exhibited the
lowest frictional resistance, despite nickel-titanium being the roughest. No
significant correlation could be established between average roughness and
frictional force values. It has been postulated that the interlocking of asperities
could result in a positive correlation with increased frictional resistance, but this
effect was not seen in this study. Interestingly the opposite argument was not

23
demonstrated either i.e. a very smooth surface would result in greater surface
area in contact, thus a greater force would be required to overcome the friction.
They proposed that there is an intermediate range of surface roughness that has
no effect on the frictional properties. This theory was in agreement with Kusy and
Whitley (1988) who suggested that low surface roughness did not necessarily
result in low frictional coefficients. It was proposed that surface chemistry and
chemical affinity played the most significant role.
Surface coated archwires have been developed to improve aesthetics and/or
performance but the coating is frequently stripped away from the wire leading to
greater binding and hence more friction (Dickson et al., 1994). Zufall and Kusy
(2000) investigated the frictional properties of an aesthetic fibre reinforced
composite wire with a polymeric coating and found that the kinetic coefficient of
friction was much greater than stainless steel wires.
Ion implantation of orthodontic archwires can be used to alter the hardness,
friction, wear resistance, and surface colour (Burstone and Farzin-Nia, 1995).
Studies by Kusy et al. (1992) and Burstone and Farzin-Nia (1995) have both
shown that nitrogen ion implantation of beta titanium archwires significantly
reduces the frictional resistance to values comparable with equivalent sized
stainless steel wires. Ryan et al. (1997) reported that nitrogen ion implantation
into nickel titanium and beta titanium wires produced significantly more tooth
movement than their untreated counterparts.
24
1.3.4 Archwire cross-sectional shape and size
It is generally agreed that as wire sizes increases, so does the frictional force
between bracket and wire (Riley et al., 1979; Frank and Nikolai, 1980; Garner et
al., 1986; Tanne at al. 1991; Sims et al., 1993; Ogata et al., 1996; Thomas et al.,
1998). However Peterson et al. (1982) and Vaughan et al. (1995) felt that nickel-
titanium did not follow this rule. They both reported that an increase in the size of
nickel-titanium wire did not necessarily cause an increase in the frictional
resistance, possibly owing to the flexibility of nickel-titanium.
It has been established that frictional forces increase not only with larger diameter
wires, but with rectangular wires. Larger rectangular wires increase the bracket-
wire interface, affecting the frictional forces (Angolkar et al., 1990; Kapila et al.,
1990; Vaughan et al., 1995; Ogata et al., 1996; Taylor and Ison, 1996), especially
at small bracket-archwire angulations (Frank and Nikolai, 1980). On the contrary,
other studies have found that increasing archwire dimensions does not affect
friction (Peterson et al., 1982; Tidy, 1989); others have found that smaller
dimension archwires produce the highest friction (Ireland et al., 1991; Baker et al.,
1987). They postulated that this was due to greater tipping and thus increased
binding.
The effect of cross-sectional archwire shape may be related to the bracket system
used. In a study comparing various bracket-archwire combinations, it was shown
that Damon SL II self-ligating brackets generated significantly lower friction when
25
tested with round wires and significantly higher friction when tested with
rectangular wires, compared to another brand of self-ligating brackets and
conventional stainless steel brackets (Tecco et al., 2005).
In another comparative study by Cacciafesta et al. (2003) of stainless steel and
polycarbonate self-ligating brackets, the results revealed higher static and kinetic
frictional forces as the wire size increased, regardless of archwire material.
1.3.5 Method of ligation
Harradine (2003) formulated a list of the ideal properties of a ligation system:
Secure and robust;
Ability to ensure full bracket archwire engagement;
Low friction;
Quick and simple to use;
Allow maintenance of good oral hygiene;
Comfortable for the patient;
Permit easy attachment of elastic chain.
Friction of a ligature depends upon its coefficient of friction and the force that it
exerts upon the bracket and archwire (De Franco et al., 1995). The first law of
friction states that frictional force between two bodies is proportional to the normal

26
load between them. Thus the force of ligation directly influences the frictional
resistance between the bracket and archwire by altering the normal force (Keith et
al., 1993).
Reported ligation forces are highly variable and can range from 50g to 300g.
Comparisons between different studies can be difficult unless a consistent ligation
force and methodology have been stated and employed (Articolo and Kusy,
1999).
Echols (1975) suggested that elastomeric module ligation produced frictional
forces in the range of 39-133g. Much of the literature states that elastomeric
modules produce higher frictional forces than other types of ligation (Ireland et al.,
1991; Shivapuja et al., 1994; Griffiths et al., 2005). Ideally, elastomeric modules
should not be used in conjunction with flexible wires as too much of the active
force is needed to overcome friction; the ligature may act as a restraint limiting the
superelasticity of the nickel-titanium wire. A better alternative would be a loosely
tied stainless steel ligature (Meling et al., 1997; Kasuya et al., 2007).
The frictional forces that are produced by stainless steel ligatures are sensitive to
the method of application (Tidy, 1989). These differences can be attributed to the
force used to tie the ligature. There is a general consensus among most authors
that loosely tied stainless steel ligatures produce less friction than conventional
27
elastomeric ligatures (Bednar et al., 1991; Taylor and Ison, 1996; Hain et al.,
2003; Thorstenson and Kusy, 2003; Khambay et al., 2004; Khambay et al., 2005).
According to other studies, frictional forces created by elastomeric and stainless
steel ligatures are similar (Frank and Nikolai, 1980; Edwards et al., 1995;
Bazakidou et al., 1997), whereas others found that elastomeric ligatures produced
less friction than stainless steel ties (Riley et al., 1979; Schumacher et al., 1990).
Although more evidence has shown that stainless steel ligatures produce less
friction, the convenience and the speed of application of elastomeric modules will
ensure their continued popularity (Maijer and Smith, 1990; Shivapuja and Berger,
1994). Furthermore loosely tied stainless steels may impart insufficient force to
ensure complete engagement of the archwire in the bracket slot, thus torque
expression could be impaired (Hain et al., 2003).
Teflon-coated stainless steel ligatures were introduced to be used with ceramic
brackets. Teflon has a low coefficient of friction and it has been shown to produce
less friction than elastomeric modules and plain stainless steel ligatures (De
Franco et al., 1995; Edwards et al., 1995). McKamey and Kusy (1999) developed
a composite ligature which exhibited a tensile strength more than twice that of a
dead-soft stainless steel ligature and had significantly greater stress-relaxation
decay. It was proposed that this aesthetic composite ligature would be beneficial
when tooth movement with negligible friction was required.
28
Elastomeric modules tied in a ‘figure of eight’ pattern produce significantly more
friction than conventionally tied elastomerics or stainless steel ligatures (Edwards
et al., 1995; Voudouris, 1997; Hain et al., 2003). Sims et al. (1993) demonstrated
that ‘figure of eight’ elastomeric modules increased frictional resistance, when
compared with conventionally tied modules, by a factor of 70-220 percent
depending on the archwire size. A study comparing eight different types of ligation
concluded that frictional resistance to sliding was the lowest when stainless steel
ligatures were twisted in a figure of eight pattern until taut then untwisted one
quarter turn and the greatest when elastomeric modules were tied in a figure of
eight configuration (Sirisaowaluk et al., 2006). If sliding mechanics are to be
employed, elastomeric modules tied in a figure of eight pattern should be avoided
as this may jeopardise anchorage (Edwards et al., 1995).
In recent years an innovative ligature has been manufactured by Leone
Orthodontic Products. The “nonconventional” elastomeric ligature is applied to a
conventional bracket but the interaction forms a tube-like structure, which allows
the archwire to slide freely, similar to a passive self-ligating bracket. It is claimed
that these modules produce significantly lower levels of frictional forces than
conventional elastomeric ligatures (Baccetti and Franchi, 2006; Gandini et al.,
2008).
In an aqueous environment elastomeric modules can degrade and if left too long,
insufficient seating forces may result in poor tooth control and rotations occurring
29
(Harradine, 2003). Edwards et al. (1995) studied the degradation of elastomers in
an aqueous environment and the effects upon ligation force. Storage of modules
in artificial saliva increased the frictional resistance and the authors suggested
that the effects of saliva acting as an adhesive outweigh the influence of force
degradation of the elastomeric modules.
In an attempt to eliminate the effects of elastomeric and stainless steel ligatures,
self-ligating brackets were introduced, which have been shown to generate very
low frictional forces (Griffiths et al., 2005). Self-ligating brackets are more
expensive than conventional brackets but this is counterbalanced by advantages
such as reductions in chairside time, treatment duration and the absence of bio-
hostable elastic modules (Turnbull and Birnie, 2007).
1.3.5.1 Bracket failures in relation to ligation method
Very few studies have investigated the relationship between bracket failure rate
and the method of ligation. A recent randomised controlled trial compared self-
ligating and conventional brackets, both using a standardised etch and bond
procedure. It was reported that there was no significant difference between the
overall bond failure rates; 6.6% for SmartClip brackets and 7.2% for Victory
brackets (O’Dywer et al., 2015). Pandis et al. (2006) also found no difference in
the bracket failure rates between self-ligating and edgewise brackets when
bonded using both conventional acid etching and self-etching primer. A study

30
comparing bond failure rates of an active (In-Ovation R) and passive (SmartClip)
self-ligation system found that the bond failure rate was significantly lower with
SmartClip brackets, but overall both brackets had clinically acceptable bond
failure rates (Chapman, 2011).
Table 1.2 lists other potential causes of bracket failure, excluding ligation method.
Operator Factors Patient Factors
Concentration of etch Gender
Etching time Age
Isolation technique Presenting malocclusion
Bonding agent Diet
Bonding technique Care of appliance
Bracket type/base Masticatory force
Mechanical force Habits
Occlusal interference Trauma
Table 1.2 Summary of operator and patient factors that can cause bracket
failure
31
1.3.6 Saliva
The question as to whether saliva acts as a lubricant to reduce frictional
resistance or as an adhesive which binds the archwire and bracket, preventing
sliding mechanics, is contentious. Baker et al. (1987) reported that saliva
substitute acted as a lubricant and reduced frictional forces by 15% to 19% when
testing stainless steel wires and brackets.
Downing et al. (1994) examined the effects of frictional forces of stainless steel
and ceramic brackets, combined with stainless steel, nickel-titanium and beta-
titanium archwire materials. For all pairings, artificial saliva had the effect of
increasing the frictional force when compared with the dry state. These findings
were in agreement with Stannard et al. (1986), Pratten et al. (1990), and Kusy et
al. (1991) that artificial saliva did not appear to act as a lubricant.
Kusy et al. (1991) concluded that saliva may promote lubricous and adhesive
behaviour, depending on which archwire bracket couple is investigated. They
found that in the dry state, stainless steel couples exhibited the lowest coefficients
of friction and β–titanium couples the highest. Conversely in the wet state, saliva
behaves like a lubricant with β–titanium couples and as an adhesive with
stainless steel couples.

32
Pratten et al. (1990) explained that the discrepancies may be due to the loading
forces used between the arch wire and the brackets. At low levels saliva acts like
a lubricant but at high levels saliva may increase friction if it is forced out from
between the contacts. However, engineering literature states that it is impossible
to completely force out an oil film between two plane surfaces, no matter how
heavy the load (Tselepis et al., 1994).
Others have shown that saliva plays an insignificant role in lubrication and thus
has a negligible impact on friction (Andreasen and Quevedo, 1970; Rucker and
Kusy, 2002). The latter study explained that sliding occurs mainly in the dry state
for single stranded wires, even in the mouth, as saliva is squeezed out from
between the contacting smooth surfaces. With multi stranded wires, they suggest
that there is a combination of an adhesive film covering the sliding surfaces and
some surface contact.
Ireland et al. (1991) found that the influence of friction in a wet or dry environment
on stainless steel and ceramic brackets using larger dimensional wires was
minimal. A wet environment was created by pre-soaking elastomeric modules for
24 hours in a water bath at 37˚C then pouring the same water over the brackets
during testing. With the smaller wires, a significant reduction in frictional
resistance was seen with the ceramic brackets under a wet testing environment.

33
Tests performed to quantify friction using a saliva substitute should be treated
with caution; human saliva would be the gold standard (Kusy and Whitley, 1992).
The results from the literature are markedly varied, probably because no one
factor dictates entirely the friction within the system. Friction is dependent on a
wide range of factors, saliva being only one of them (Ireland et al., 1991).
1.3.7 Masticatory function
An in vivo experiment was performed to determine if vibration caused by
mastication reduced friction in an orthodontic appliance. Subjects were asked to
chew softened gum with a measuring device in situ. The results showed that
mastication did not significantly reduce frictional forces in an appliance consisting
of stainless steel brackets with a 0.022 x 0.028 inch slot ligated to a 0.019 x 0.025
inch stainless steel archwire with a 0.010 inch diameter stainless steel or
elastomeric ligature (Iwasaki et al., 2003).
O’Reilly et al. (1999) attempted to replicate masticatory function ex vivo by
repeated vertical displacement of a bracket under a constant load, testing multiple
archwires. It was discovered that there was a 10% decrease in resistance to
sliding for a 0.25mm displacement, 47% for 0.5mm, and 80% for 1mm of vertical
wire displacement. There was also a significant reduction in sliding resistance,
which differed depending on the archwire. There was an 85%, 80% and 16%
reduction associated with 0.021 x 0.025 inch, 0.019 x 0.025 inch and 0.016 inch

34
stainless wires respectively. For 0.019 x 0.025 inch β–titanium archwires, there
was a reduction of 27%. It was concluded that given the likelihood of bracket
and/or archwire displacements intra orally, the importance of true friction may be
lessened; this was echoed by Braun et al. (1999).
In a similar ex vivo study by Olson et al. (2012) it was reported that frictional
resistances were not significantly affected by the frequency of the archwire
vibrations, but were significantly reduced by a least 17% when medium (150mV)
and high (190mV) amplitude of vibration were used, compared with a low
(110mV) amplitude. They deduced that the stick-slip behaviour at the bracket
archwire interface is more influenced by vibration amplitude/amount of vertical
displacement of the archwire, than vibration frequency.
1.3.8 Sliding velocity
At a slow sliding speed the oxide layer on an archwire is removed at a rate less
than or equal to the rate at which it is formed. This is referred to as ‘corrosive
wear’ (Kusy and Whitley, 1989). Frictional forces increase with time and
immersion in water due to corrosion (Riley et al., 1979). At a faster sliding speed
adhesive wear from cold welding may occur as the time interval is too short for
the protective oxide layer to reform. There is very little published data on the
effects of sliding velocity but the third law of friction states that the coefficient is
independent of relative velocity. Whether this can be applied to orthodontic
35
archwires which are made of various alloys is uncertain. The coefficients of
friction of cobalt chromium archwires decreased with increasing sliding velocity;
however the coefficients of β–titanium archwires increased with sliding velocity
(Kusy and Whitley, 1989).
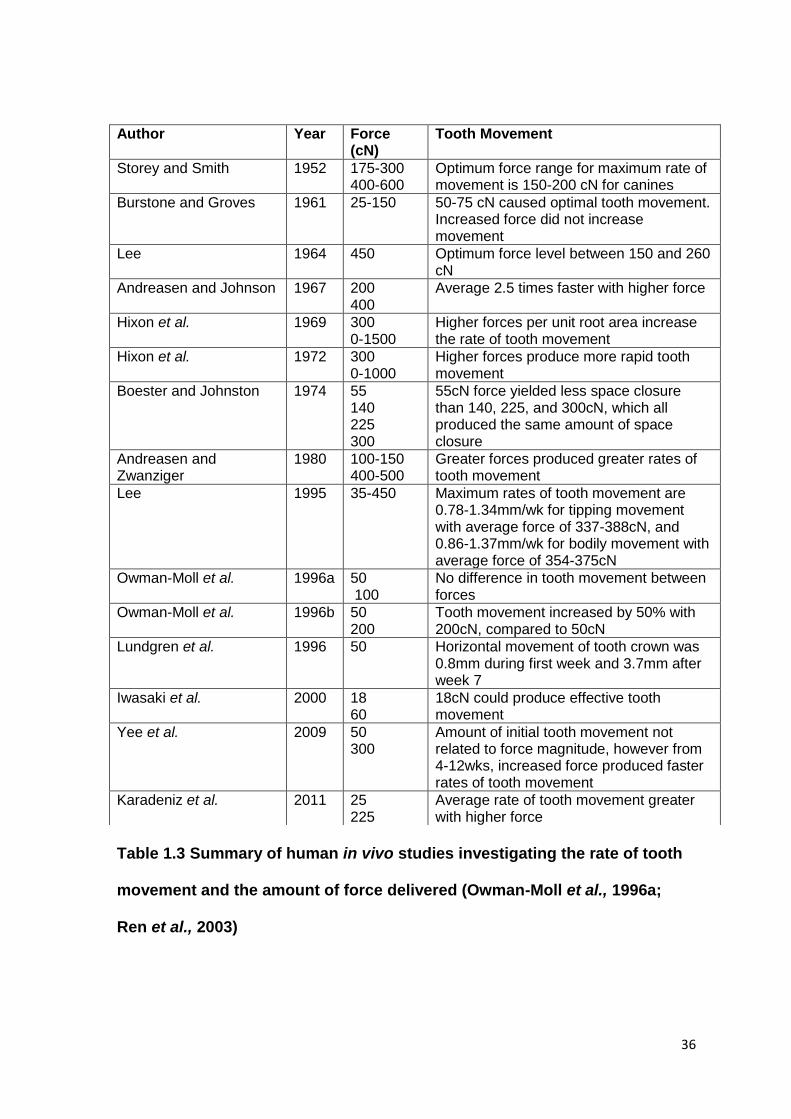
1.4 Rate of tooth movement and force magnitude
The rate of tooth movement is affected by varying the force magnitude applied.
There is an ideal force that will move a particular tooth, at the maximum rate
(Quinn and Yoshikawa, 1985). Numerous studies, both animal and human, have
presented conflicting results about the optimum force for orthodontic tooth
movement (Table 1.3).
36
Table 1.3 Summary of human in vivo studies investigating the rate of tooth
movement and the amount of force delivered (Owman-Moll et al., 1996a;
Ren et al., 2003)
Author Year Force (cN)
Tooth Movement
Storey and Smith 1952 175-300 400-600
Optimum force range for maximum rate of movement is 150-200 cN for canines
Burstone and Groves 1961 25-150 50-75 cN caused optimal tooth movement. Increased force did not increase movement
Lee 1964 450 Optimum force level between 150 and 260 cN
Andreasen and Johnson 1967 200 400
Average 2.5 times faster with higher force
Hixon et al. 1969 300 0-1500
Higher forces per unit root area increase the rate of tooth movement
Hixon et al. 1972 300 0-1000
Higher forces produce more rapid tooth movement
Boester and Johnston 1974 55 140 225 300
55cN force yielded less space closure than 140, 225, and 300cN, which all produced the same amount of space closure
Andreasen and Zwanziger
1980 100-150 400-500
Greater forces produced greater rates of tooth movement
Lee 1995 35-450 Maximum rates of tooth movement are 0.78-1.34mm/wk for tipping movement with average force of 337-388cN, and 0.86-1.37mm/wk for bodily movement with average force of 354-375cN
Owman-Moll et al. 1996a 50 100
No difference in tooth movement between forces
Owman-Moll et al. 1996b 50 200
Tooth movement increased by 50% with 200cN, compared to 50cN
Lundgren et al. 1996 50 Horizontal movement of tooth crown was 0.8mm during first week and 3.7mm after week 7
Iwasaki et al. 2000 18 60
18cN could produce effective tooth movement
Yee et al. 2009 50 300
Amount of initial tooth movement not related to force magnitude, however from 4-12wks, increased force produced faster rates of tooth movement
Karadeniz et al. 2011 25 225
Average rate of tooth movement greater with higher force

37
Earlier studies suggested that increased force did not increase tooth movement
(Burstone and Groves, 1961; Owman-Moll et al., 1996a), but the majority of
subsequent studies have shown the opposite (Andreasen and Johnson, 1967;
Hixon et al., 1972; Andreasen and Zwanziger, 1980; Karadeniz et al., 2011).
A broad range of orthodontic forces can be used to induce tooth movement but it
has been concluded that the rate is mainly based upon patient characteristics. A
number of factors including age, medications, diet, systemic conditions and
genetics, have all been shown to affect tooth movement (Ren et al., 2003;
Davidovitch and Krishnan, 2009).
1.5 Rate of alignment
Table 1.4 shows a summary of clinical trials investigating the rate of orthodontic
alignment. The initial average contact point displacement in the study by O’Brien
et al. (1990) was greater than in the other studies, but it was not stated whether
Little’s Irregularity Index was used, and the measurements were undertaken on
computerised digital models unlike the other papers which used plaster study
models.
From the available literature summarised in table 1.4, when lower arch extractions
were carried out, the rate of lower incisor alignment per month seemed to be

38
faster (Scott et al., 2008; Ong et al., 2010). Scott et al. (2008) concluded that the
initial rate of incisor alignment is significantly influenced by the degree of initial
irregularity; age, sex and bracket type were not statistically significant. Teeth
therefore seem to align faster when they are more displaced at the start.
Author (Year)
Upper or lower arch
Mean age (years)
Extraction or non extraction (2 premolars)
Pre-treatment irregularity (mm)
Rate of tooth alignment per 30 days (study time period)
Archwire Sequence
O’Brien et al. (1990)a
Upper 12.95 Non extraction
15.61 1.5mm (0-34 days) 0.016” super-elastic Titanol
Miles (2005)b
Lower 17.1 Non extraction
5.8 1.8mm (0-10wks) 0.09mm (10-20wks) 0.94 mm (0-20wks)
0.014” Damon CuNiTi, 0.016”x0.025” Damon CuNiTi
Scott et al. (2008)c
Lower 16.38 Extraction 12.44 4.05mm (not stated)
0.014” CuNiTi, 0.014”x0.025” CuNiTi
Ong et al. (2010)d
Lower 10-18 Extraction 12.52 3.6mm (0-10wks) 0.72mm (10-20wks) 2.16mm (0-20wks)
0.014” CuNiTi, 0.014”x0.025” CuNiTi
Wahab et al. (2012)e
Upper 19.5 Extraction 12.9 3.46mm (0-16wks) 0.014” NiTi
Table 1.4 Summary of papers investigating rate of tooth alignment
Method of determining irregularity: a – Superimpositions of digitised study models,
b-e – Little’s Irregularity Index on plaster casts

39
No studies could be identified in the orthodontic literature that investigated the
rate of incisor alignment using figure of eight module ligation, or which made a
comparison with the rate of alignment with conventional module ligation.
1.6 Little’s Irregularity Index
The irregularity index provides an objective measure of mandibular incisor
crowding by measuring the contact point displacements of the anterior teeth. The
index can sometimes provide higher values than the actual arch length deficiency
if the anterior teeth are markedly displaced. Conversely, the index score can be
lower than the actual arch length deficiency e.g. cases when the anatomic contact
points are touching interproximally but the pattern of malalignment could be a ‘zig-
zag’ type (Little, 1975).
In the literature, significant intra-class correlation coefficients (>0.9) have been
reported for inter-examiner variability of the Little’s Irregularity Index (Bernabé and
Flores-Mir, 2006; Almasoud and Bearn, 2009; Wahab et al., 2012). Sjögren et al.
(2010) warned that these high correlation coefficients are misleading for
assessing inter-examiner variability, as correlation coefficients are not a direct
measure of agreement between two measurements. They are a measure of linear
association between two measurements. Macauley et al. (2012) investigated the
inter-examiner reproducibility of individual contact point displacement
measurements in the maxillary arch, rather than the summed irregularity score.

40
They found poor reproducibility of the index, with 516 out of 600 measurements
differing by greater than 20% of the mean. The same team explored the use of
three dimensional intra-oral scanning machines to investigate if that improved the
accuracy and precision of individual contact point displacement measurements
between examiners. 348 of the 600 measurements differed by more than 20% of
the mean, and they concluded that neither method of using Little’s Irregularity
Index was appropriate for orthodontic research purposes, especially for small
contact point displacements (Burns et al., 2014).
However, Little’s Irregularity Index is still the most commonly used tool in the
orthodontic literature to simply and reliably quantify mandibular crowding (Little,
1975) and to measure resolution of mandibular incisor crowding (Miles et al.,
2006; Scott et al., 2008; Ong et al., 2010). It provides a measurement that can be
compared to data from other studies and to base sample size calculations. The
index has also been used as the methodological approach for the Cochrane
Collaboration review on retention procedures (Littlewood et al., 2006), as it is an
accepted and valid outcome measure.

41
1.7 Aims
The method of archwire ligation is thought to be an important factor that
influences the rate of orthodontic tooth movement.
The aims of this study were:
(i) To determine whether ligation with figure of eight modules affects the rate
of lower incisor alignment when compared with conventionally configured
modules.
(ii) To establish whether there are any differences in the number of bracket
failures between the conventional and figure of eight module groups.
1.8 Null hypothesis
There is no difference in the rate of mandibular incisor alignment between
brackets ligated with either conventional modules or figure of modules.

42
Chapter 2
MATERIALS AND METHODS

43
CHAPTER 2: MATERIALS AND METHODS
Page
2.1 Study design 44
2.2 Ethics approval and Research and Development
approval
44
2.3 Participants 45
2.3.1 Inclusion criteria 45
2.3.2 Exclusion criteria 45
2.4 Method 46
2.5 Outcomes 48
2.5.1 Primary outcome 48
2.5.2 Secondary outcome 48
2.6 Sample size 49
2.7 Randomisation process 49
2.8 Blinding 50
2.9 Statistical data analysis 50

44
2.1 Study design
The study was designed as a prospective randomised controlled clinical trial
undertaken from May 2013 to January 2015. Patients requiring treatment with
fixed orthodontic appliances in the orthodontic department at Queen’s Hospital,
Burton upon Trent were invited to take part in the study.
Subjects were randomly assigned to either conventional or figure of eight module
groups. It was felt that extractions in the lower arch would be a confounding
variable; therefore patients were randomly allocated to either group based on
whether extraction or non extraction treatment was undertaken. The subjects
were included in the trial for 12 weeks and seen every 6 weeks after bonding the
fixed appliances. At each visit impressions of the lower arch were taken to allow
measurements of irregularity to be made on study models.
2.2 Ethical approval and Research and Development approval
Ethical approval was obtained from the West Midlands Research Ethics
Committee. Reference number: 12/WM/0368. Approval was also obtained from
the Burton Hospitals Research and Development department.
The trial was registered on clinicaltrials.gov. Reference number: NCT01771692.
45
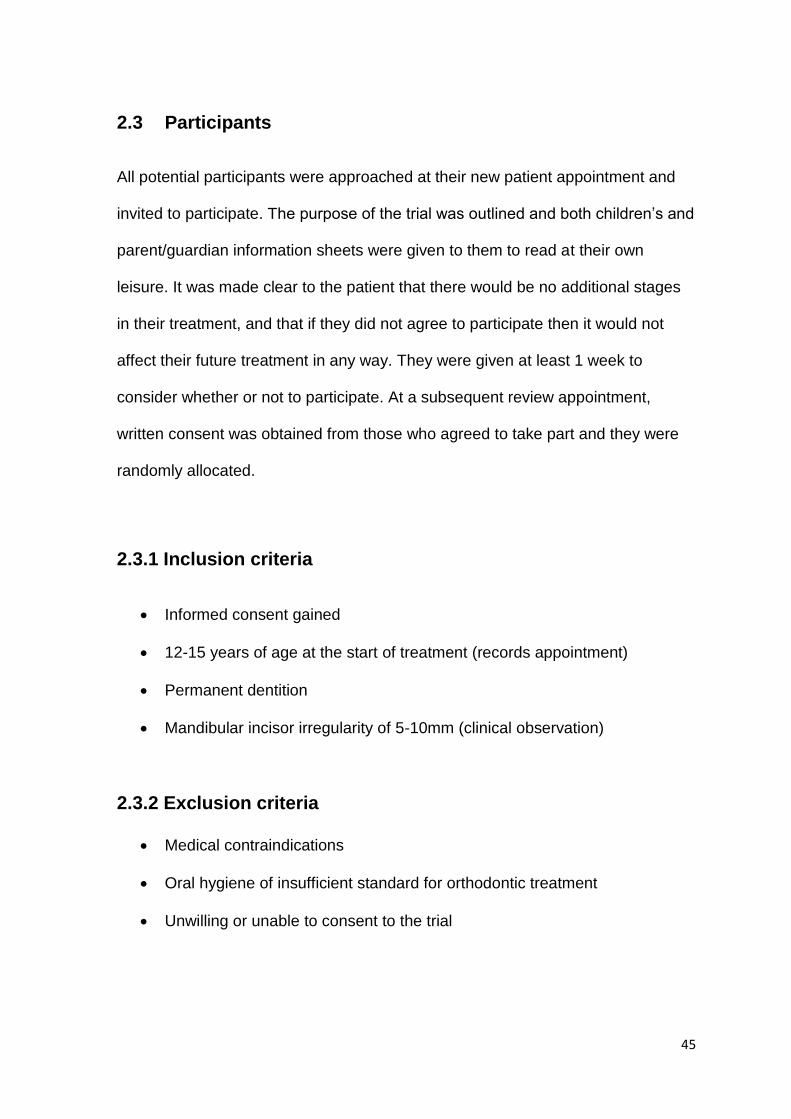
2.3 Participants
All potential participants were approached at their new patient appointment and
invited to participate. The purpose of the trial was outlined and both children’s and
parent/guardian information sheets were given to them to read at their own
leisure. It was made clear to the patient that there would be no additional stages
in their treatment, and that if they did not agree to participate then it would not
affect their future treatment in any way. They were given at least 1 week to
consider whether or not to participate. At a subsequent review appointment,
written consent was obtained from those who agreed to take part and they were
randomly allocated.
2.3.1 Inclusion criteria
Informed consent gained
12-15 years of age at the start of treatment (records appointment)
Permanent dentition
Mandibular incisor irregularity of 5-10mm (clinical observation)
2.3.2 Exclusion criteria
Medical contraindications
Oral hygiene of insufficient standard for orthodontic treatment
Unwilling or unable to consent to the trial

46
2.4 Method
Informed consent was obtained and the subjects were randomly allocated to one
of two groups, conventional module ligation or figure of eight module ligation,
stratified for whether the treatment involved extractions or not in the lower arch.
At the bond up appointment the same MBT brackets (VictoryTM Twin series, 3M
Unitek) and standardised bonding procedure were used. Cheek retractors and a
saliva ejector were placed to isolate the teeth. The teeth were etched for 15
seconds with 37% phosphoric acid (Bossklein) and washed and dried for 15
seconds with oil-free compressed air from a 3:1 syringe. A microbrush was used
to apply a thin, uniform layer of bonding agent (light bond sealant, Reliance
Orthodontics) to the teeth and light cure adhesive (light bond paste, Reliance
Orthodontics) was placed on the bracket bases. Excess composite was removed
after positioning the brackets and the adhesive was polymerised with a light
curing unit according to the manufacturer’s guidelines. The starting archwire was
0.014” NiTi and after 6 weeks this was changed to the largest NiTi wire than could
be used to fully engage the bracket slots, frequently a 0.016” or 0.018” NiTi wire
(Orthodontic Supplies Ltd). Unstretched Super Slick grey elastomeric modules
(TP Orthodontics, LaPorte, Ind) were applied in either a conventional pattern or
figure of eight pattern. A small amount of zinc polycarboxylate cement was placed
on the lower first molars if there was occlusal interference.

47
The subjects were given two subsequent appointments at six weekly intervals.
This time frame was chosen as this was the routine interval between orthodontic
appointments and it would not cause any additional burden to the patients and
parents/guardians. Impressions were undertaken for study casts pre-treatment
(T0), 6 weeks (T1), and 12 weeks after starting fixed appliance treatment (T2).
Only superficial impressions were taken of the teeth, not including the full sulcus
depth, to increase patient comfort and acceptability. All impressions were taken
after the archwires were removed and they were cast immediately in the on-site
laboratory. The white stone study models were stored separately.
The patients were treated by a mixture of operator grades; consultant, specialty
registrar, FTTA and clinical assistants.
All the study models were evaluated using the standardised Little’s Irregularity
Index (Little, 1975) to quantify the degree of crowding of the lower anterior teeth.
The study models were measured with digital callipers with sharpened tips that
were accurate to 0.01mm. All measurements were undertaken by the author (RL),
who was blinded to the intervention groups. To ensure reproducibility of the
measurements, 30 measurements were repeated three months apart and
assessed using the intraclass correlation coefficient and the Bland and Altman
plot (Bland and Altman, 1986).
48
At a departmental meeting the trial was explained to all of the reception and
nursing staff. The importance of arranging three appointments at the start of fixed
appliance therapy at 6 weekly intervals was stressed. If patients missed an
appointment or needed to reschedule one of the two review appointments, it was
emphasised that this needed to be rearranged promptly to try to minimise
different duration intervals between appointments.
The nurses were advised to fill out the lab prescription cards instructing the lab
that the impression was for the trial so that they could be stored separately and
cast immediately to ensure dimensional stability.
2.5 Outcomes
2.5.1 Primary outcome
The primary outcome measure was the rate of lower incisor alignment,
specifically between three time periods; T0-T1 (0-6 weeks), T1-T2 (6-12 weeks),
and T0-T2 (0-12 weeks).
2.5.2 Secondary outcome
The secondary outcome measure was bracket failure rate. Data for the
participants were gathered from the clinical notes after all the irregularity
measurements had been undertaken and thus, the patient had finished in the trial.

49
2.6 Sample size
The sample size calculation was based on the data from Ong et al. (2010). The
sample size calculation for the number of patients necessary to achieve 80%
power with an alpha of 0.05 was based on a clinically meaningful difference in
Little's Irregularity Index of 1mm between the groups. The calculation showed that
it would be necessary to recruit 50 patients into each group and that any drop
outs would require further recruitment.
2.7 Randomisation process
www.randomization.com was used to perform the randomisation process. Block
randomisation was used, in block sizes of six, and patients were stratified for
extraction and non extraction treatment.
Sealed opaque, sequentially numbered envelopes were used to conceal the
group to which the participant had been assigned. The envelopes were kept in a
locked filing cabinet and opened by an independent individual when each
participant was recruited to the study and had signed the consent, prior to the
bond up process. The generator of the randomisation did not participate in patient
recruitment, treatment or measurements. Once the participant had been
randomised, based on the principles of an intention-to-treat analysis, any data
generated was included in the final results.
50
2.8 Blinding
It was not possible to blind the clinician or the patient to the ligation method,
however all the measurements were undertaken by the author (RL), who was
blinded to the intervention groups. When measuring the study models, it was not
possible to blind the measurer as to whether the treatment involved extractions or
not.
2.9 Statistical data analysis
Descriptive statistics (mean, standard deviation) were calculated for all variables
for the entire sample and each group separately using IBM SPSS Statistics for
Windows (v22, IBM Corp, Armonk, NY).
A Shapiro-Wilk test was used to determine the normality of distribution for the
irregularity and the bracket failure data. For the irregularity data, a third of the
data were deemed non-normal therefore logarithmic transformations were taken
to reduce the impact of outliers. Further Shapiro-Wilk tests were performed, which
confirmed the transformed data were normally distributed. The bracket failure
data were not normally distributed.
Independent samples t-tests were used to compare groups for the irregularity
data. Mann-Whitney U tests were used to compare groups for the bracket failure
51
data. All tests were two-sided at a significance level of alpha=0.05. The multiple
imputation procedure was used to account for missing data using SAS (v9.3, SAS
Institute, Cary, NC).
The intra-examiner reliability for the study model irregularity measurements was
calculated using intraclass correlation and a Bland and Altman plot, following re-
measurement of 30 study models, three months after the initial measurements
were undertaken. The study models were selected randomly by a member of staff
from the laboratory department, who was not involved in the study.

52
Chapter 3
RESULTS

53
CHAPTER 3: RESULTS
Page
3.1 Baseline results 54
3.2 Results 55
3.2.1 Alignment 55
3.2.2 Rate of lower incisor alignment 57
3.2.3 Number of bracket failures 59
3.2.4 Distribution of bracket failures 61
3.3 Analysis of results 62
3.3.1 Independent samples t-tests 62
3.3.2 Mann-Whitney U tests 66
3.4 Intra-examiner reliability 67
54
3.1 Baseline results
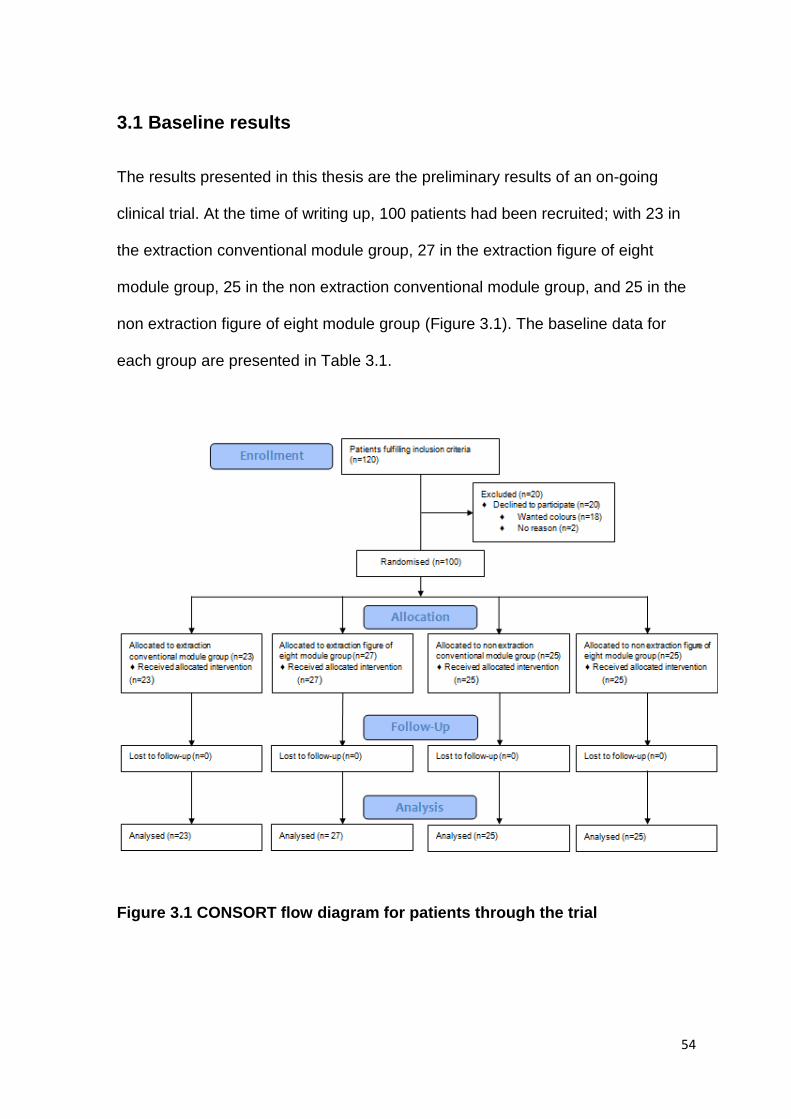
The results presented in this thesis are the preliminary results of an on-going
clinical trial. At the time of writing up, 100 patients had been recruited; with 23 in
the extraction conventional module group, 27 in the extraction figure of eight
module group, 25 in the non extraction conventional module group, and 25 in the
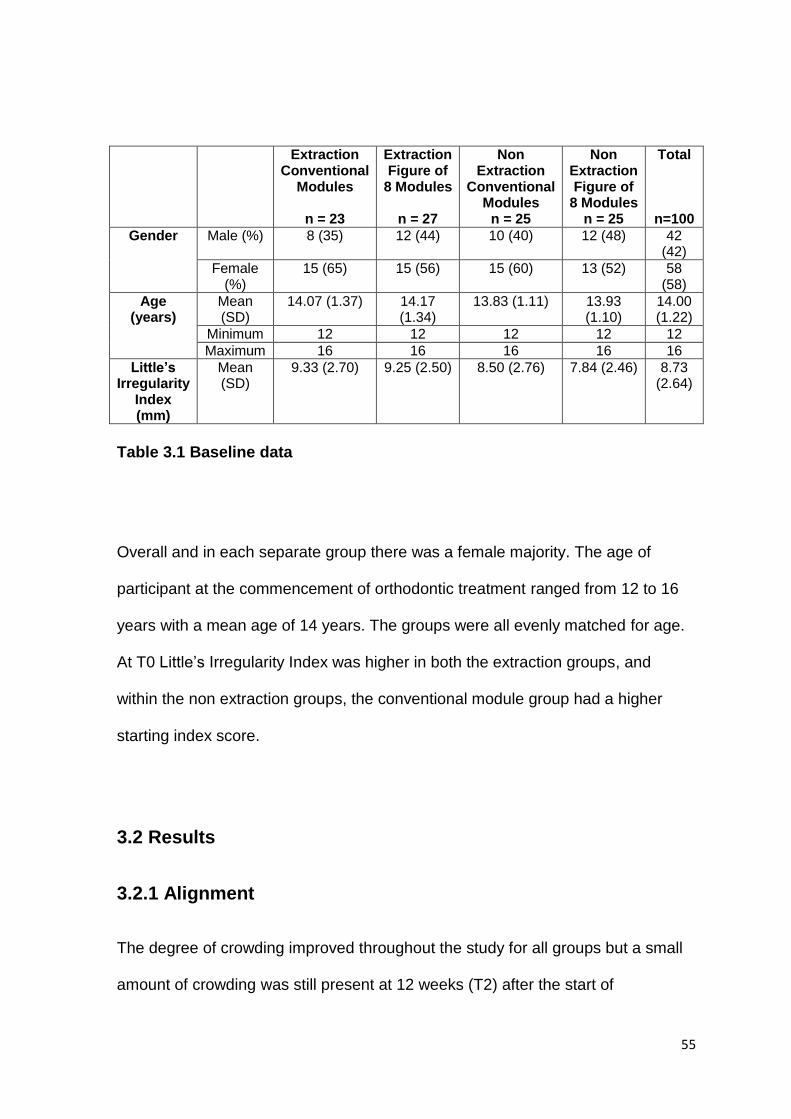
non extraction figure of eight module group (Figure 3.1). The baseline data for
each group are presented in Table 3.1.
Figure 3.1 CONSORT flow diagram for patients through the trial
55
Extraction Conventional
Modules
n = 23
Extraction Figure of
8 Modules
n = 27
Non Extraction
Conventional Modules
n = 25
Non Extraction Figure of
8 Modules n = 25
Total
n=100
Gender Male (%) 8 (35) 12 (44) 10 (40) 12 (48) 42 (42)
Female (%)
15 (65) 15 (56) 15 (60) 13 (52) 58 (58)
Age (years)
Mean (SD)
14.07 (1.37) 14.17 (1.34)
13.83 (1.11) 13.93 (1.10)
14.00 (1.22)
Minimum 12 12 12 12 12
Maximum 16 16 16 16 16
Little’s Irregularity
Index (mm)
Mean (SD)
9.33 (2.70) 9.25 (2.50) 8.50 (2.76) 7.84 (2.46) 8.73 (2.64)
Table 3.1 Baseline data
Overall and in each separate group there was a female majority. The age of
participant at the commencement of orthodontic treatment ranged from 12 to 16
years with a mean age of 14 years. The groups were all evenly matched for age.
At T0 Little’s Irregularity Index was higher in both the extraction groups, and
within the non extraction groups, the conventional module group had a higher
starting index score.
3.2 Results
3.2.1 Alignment
The degree of crowding improved throughout the study for all groups but a small
amount of crowding was still present at 12 weeks (T2) after the start of

56
orthodontic treatment. The irregularity scores at T2 were greatest in the non
extraction conventional module group and very similar for both figure of eight
module groups (Table 3.2).
Extraction Conventional
Modules
Extraction Figure of 8 Modules
Non Extraction
Conventional Modules
Non Extraction Figure of 8 Modules
Irregularity Index (mm) –
Mean (SD)
T0 9.33 (2.70) 9.25 (2.50) 8.50 (2.76) 7.84 (2.86)
T1 4.05 (3.30) 3.53 (2.94) 4.19 (3.19) 3.26 (2.53)
T2 2.18 (2.88) 1.78 (2.15) 2.47 (3.25) 1.73 (1.97)
Table 3.2 Irregularity scores (T0-T2)
The mean changes in irregularity were alike in the extraction and non extraction
groups respectively, but were both better in the figure of eight module groups
from T0-T1 and T0-T2 (Table 3.3).
Extraction Conventional
Modules
Extraction Figure of 8 Modules
Non Extraction
Conventional Modules
Non Extraction Figure of 8 Modules
Irregularity Index (mm) – Mean (SD)
T0-T1 5.28 (2.63) 5.72 (2.53) 4.31 (2.67) 4.57 (2.49)
T1-T2 1.87 (1.09) 1.75 (1.44) 1.72 (1.70) 1.53 (1.47)
T0-T2 7.15 (2.88) 7.47 (2.41) 6.03 (2.85) 6.11 (2.81)
Table 3.3 Mean changes in irregularity between time periods
Table 3.4 shows the irregularity scores (T0-T2) after combining the extraction and
non extraction data. The conventional modules group had a greater irregularity
index score at each time point.

57
Conventional Modules Figure of 8 Modules
Irregularity Index (mm) –
Mean (SD)
T0 8.90 (2.74) 8.57 (2.56)
T1 4.12 (3.21) 3.40 (2.73)
T2 2.33 (3.05) 1.75 (2.05)
Table 3.4 Irregularity scores (T0-T2) for combined extraction and non
extraction groups
The mean change in irregularity scores, for combined extraction and non
extraction data, shows that the figure of eight module group aligned better from
T0-T1 and T0-T2, but the conventional module group alignment was greater from
T1-T2 (Table 3.5).
Conventional Modules Figure of 8 Modules
Irregularity Index (mm) –
Mean (SD)
T0-T1 4.78 (2.66) 5.17 (2.55)
T1-T2 1.79 (1.42) 1.65 (1.45)
T0-T2 6.57 (2.89) 6.82 (2.67)
Table 3.5 Mean changes in irregularity between time periods for combined
extraction and non extraction groups
3.2.2 Rate of lower incisor alignment
The rate of lower incisor alignment was calculated for each patient based on the
exact number of days in between their scheduled six weekly visits, and the mean
values are shown in Table 3.6. The rate of alignment was faster in the extraction
groups, and within the extraction and non extraction groups, the figure of eight
modules aligned the lower teeth quicker compared to conventional modules, for
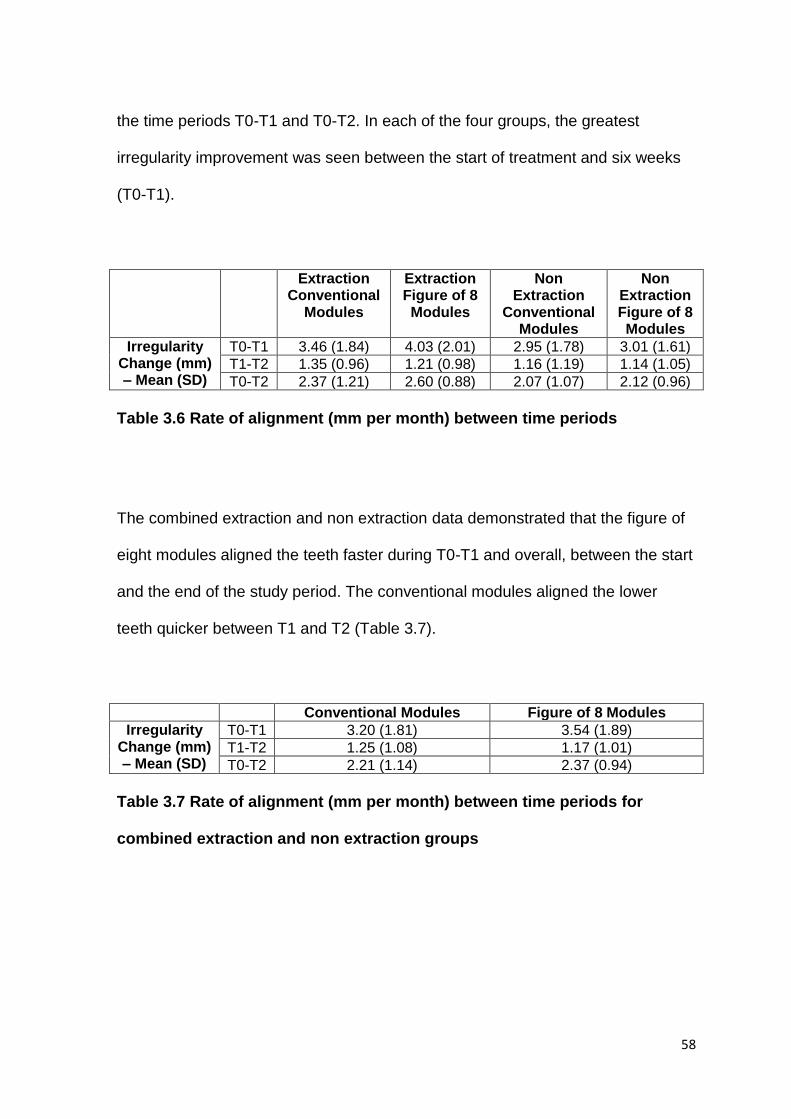
58
the time periods T0-T1 and T0-T2. In each of the four groups, the greatest
irregularity improvement was seen between the start of treatment and six weeks
(T0-T1).
Extraction Conventional
Modules
Extraction Figure of 8 Modules
Non Extraction
Conventional Modules
Non Extraction Figure of 8 Modules
Irregularity Change (mm) – Mean (SD)
T0-T1 3.46 (1.84) 4.03 (2.01) 2.95 (1.78) 3.01 (1.61)
T1-T2 1.35 (0.96) 1.21 (0.98) 1.16 (1.19) 1.14 (1.05)
T0-T2 2.37 (1.21) 2.60 (0.88) 2.07 (1.07) 2.12 (0.96)
Table 3.6 Rate of alignment (mm per month) between time periods
The combined extraction and non extraction data demonstrated that the figure of
eight modules aligned the teeth faster during T0-T1 and overall, between the start
and the end of the study period. The conventional modules aligned the lower
teeth quicker between T1 and T2 (Table 3.7).
Conventional Modules Figure of 8 Modules
Irregularity Change (mm) – Mean (SD)
T0-T1 3.20 (1.81) 3.54 (1.89)
T1-T2 1.25 (1.08) 1.17 (1.01)
T0-T2 2.21 (1.14) 2.37 (0.94)
Table 3.7 Rate of alignment (mm per month) between time periods for
combined extraction and non extraction groups
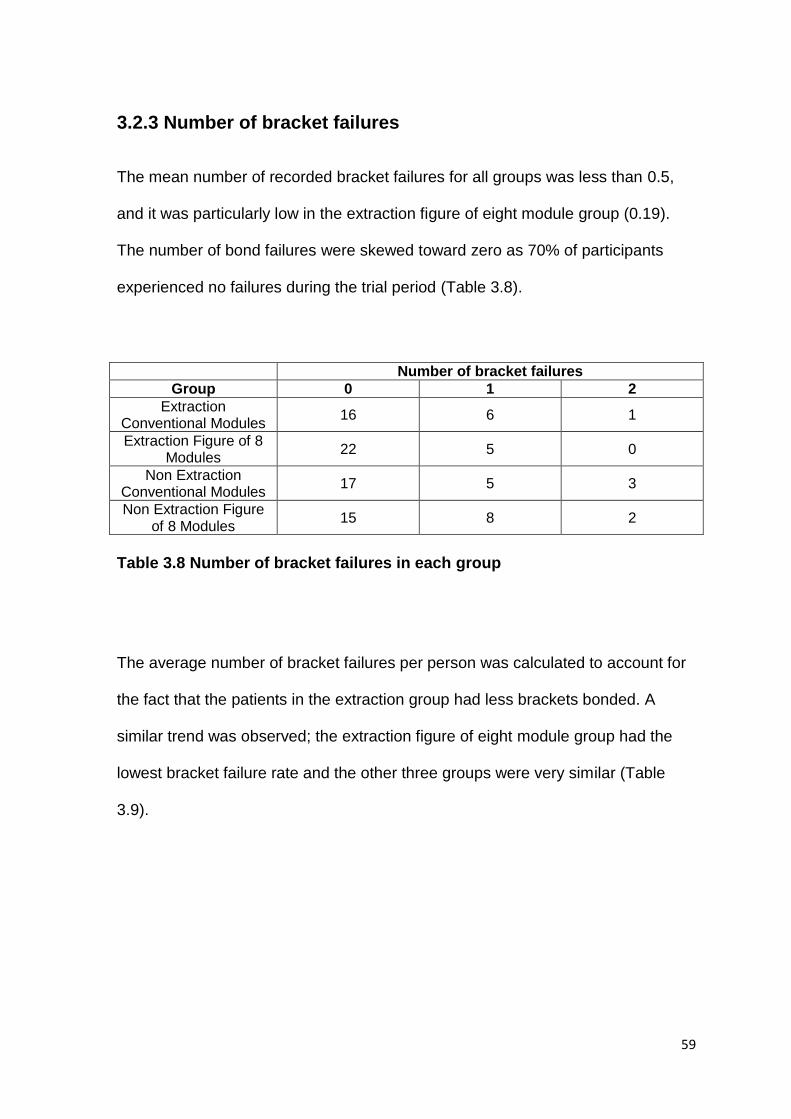
59
3.2.3 Number of bracket failures
The mean number of recorded bracket failures for all groups was less than 0.5,
and it was particularly low in the extraction figure of eight module group (0.19).
The number of bond failures were skewed toward zero as 70% of participants
experienced no failures during the trial period (Table 3.8).
Number of bracket failures
Group 0 1 2
Extraction Conventional Modules
16 6 1
Extraction Figure of 8 Modules
22 5 0
Non Extraction Conventional Modules
17 5 3
Non Extraction Figure of 8 Modules
15 8 2
Table 3.8 Number of bracket failures in each group
The average number of bracket failures per person was calculated to account for
the fact that the patients in the extraction group had less brackets bonded. A
similar trend was observed; the extraction figure of eight module group had the
lowest bracket failure rate and the other three groups were very similar (Table
3.9).

60
Extraction Conventional
Modules
Extraction Figure of 8 Modules
Non Extraction
Conventional Modules
Non Extraction Figure of 8 Modules
Number of Bracket Failures
Mean (SD)
0.35 (0.57) 0.19 (0.40) 0.44 (0.71) 0.48 (0.65)
Average Number of
Bracket Failures Per Person
Mean (SD)
0.04 (0.07) 0.02 (0.05) 0.04 (0.07) 0.05 (0.07)
Table 3.9 Number of bracket failures and average number of bracket failures
per person
Table 3.10 shows the bracket failure rate after combining the extraction and non
extraction data. The results of the conventional module and figure of eight module
groups are comparable.
Conventional Modules
Figure of 8 Modules
Number of Bracket Failures
Mean (SD)
0.40 (0.64) 0.33 (0.55)
Average Number of Bracket Failures Per
Person
Mean (SD)
0.04 (0.07) 0.04 (0.06)
Table 3.10 Number of bracket failures and average number of bracket
failures per person for combined extraction and non extraction groups
The overall bracket failure in the lower arch for the 900 brackets used in the trial
was 4%. The bond failure rate for the conventional module groups was 4.4% and
3.6% for the figure of eight module groups.
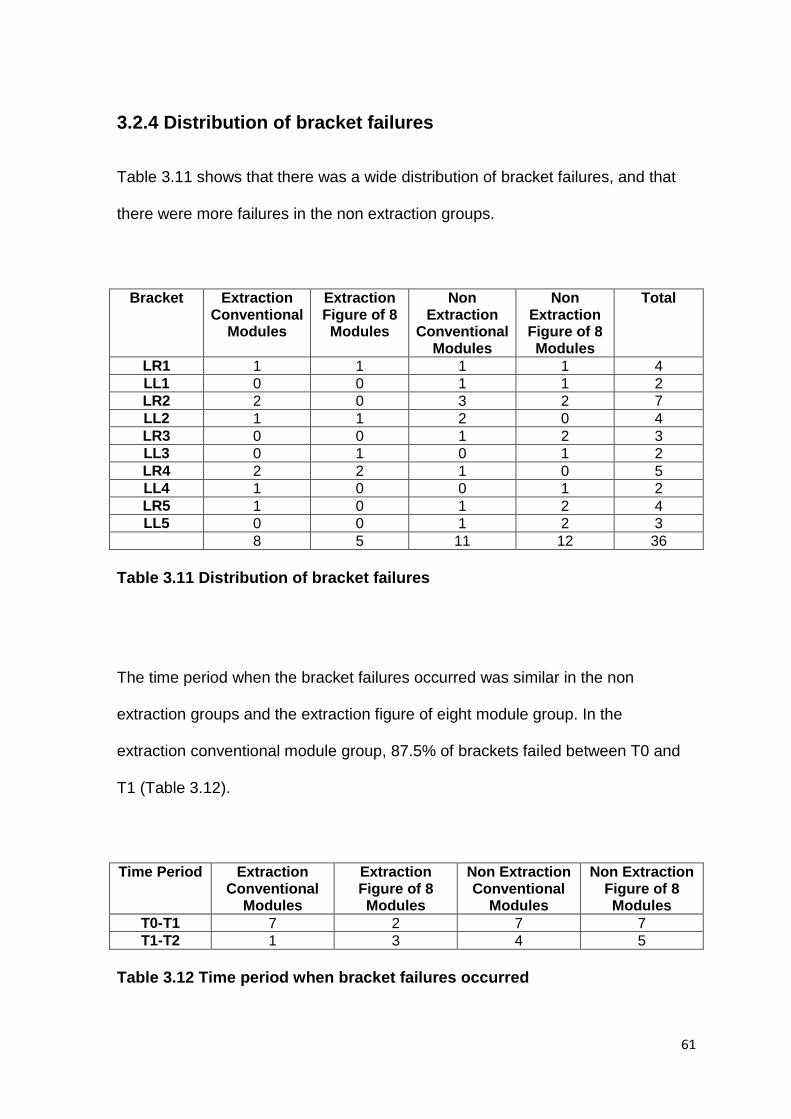
61
3.2.4 Distribution of bracket failures
Table 3.11 shows that there was a wide distribution of bracket failures, and that
there were more failures in the non extraction groups.
Bracket Extraction Conventional
Modules
Extraction Figure of 8 Modules
Non Extraction
Conventional Modules
Non Extraction Figure of 8 Modules
Total
LR1 1 1 1 1 4
LL1 0 0 1 1 2
LR2 2 0 3 2 7
LL2 1 1 2 0 4
LR3 0 0 1 2 3
LL3 0 1 0 1 2
LR4 2 2 1 0 5
LL4 1 0 0 1 2
LR5 1 0 1 2 4
LL5 0 0 1 2 3
8 5 11 12 36
Table 3.11 Distribution of bracket failures
The time period when the bracket failures occurred was similar in the non
extraction groups and the extraction figure of eight module group. In the
extraction conventional module group, 87.5% of brackets failed between T0 and
T1 (Table 3.12).
Time Period Extraction Conventional
Modules
Extraction Figure of 8 Modules
Non Extraction Conventional
Modules
Non Extraction Figure of 8 Modules
T0-T1 7 2 7 7
T1-T2 1 3 4 5
Table 3.12 Time period when bracket failures occurred

62
Bond failures were highest on the lateral incisors followed by the premolars,
central incisor, and canine. The most frequently debonded bracket was the lateral
incisor on the right hand side. For all bracket types there were more bracket
failures on the right hand side (Table 3.13).
Bracket Type Right Left Total
Central Incisor 4 2 6
Lateral Incisor 7 4 11
Canine 3 2 5
First Premolar 5 2 7
Second Premolar 4 3 7
Table 3.13 Distribution of bracket failures according to bracket type and
side
3.3 Analysis of results
Analysis was undertaken on an intention-to treat basis.
3.3.1 Independent samples t-tests
Independent samples t-tests were used on the parametric irregularity data. The
effect of extraction and non extraction treatment on the rate of alignment (per
month) was tested for the conventional module groups. There were no
statistically significant differences between all three time periods (Table 3.14).

63
t value df p value 95% Confidence
Interval
Statistical
significance?
T0-T1 1.622 45 0.112 -0.042, 0.390 No
T1-T2 0.713 44 0.480 -0.149, 0.312 No
T0-T2 0.775 46 0.442 -0.096, 0.217 No
Table 3.14 Independent samples t-tests to compare the effect of extraction
and non extraction treatment for the conventional module groups between
each time period
The effect of extraction and non extraction treatment on the rate of alignment (per
month) was tested for the figure of eight module groups. There were no
statistically significant differences between T1-T2 and T0-T2. However, the lower
teeth aligned significantly faster in the extraction group between the time period
T0-T1, p = 0.05 (Table 3.15).
t value Df p value 95% Confidence
Interval
Statistical
significance?
T0-T1 2.005 50 0.050 -0.000, 0.281 Yes
T1-T2 -0.413 48 0.682 -0.245, 0.161 No
T0-T2 1.597 49 0.117 -0.021, 0.182 No
Table 3.15 Independent samples t-tests to compare the effect of extraction
and non extraction treatment for the figure of eight module groups between
each time period
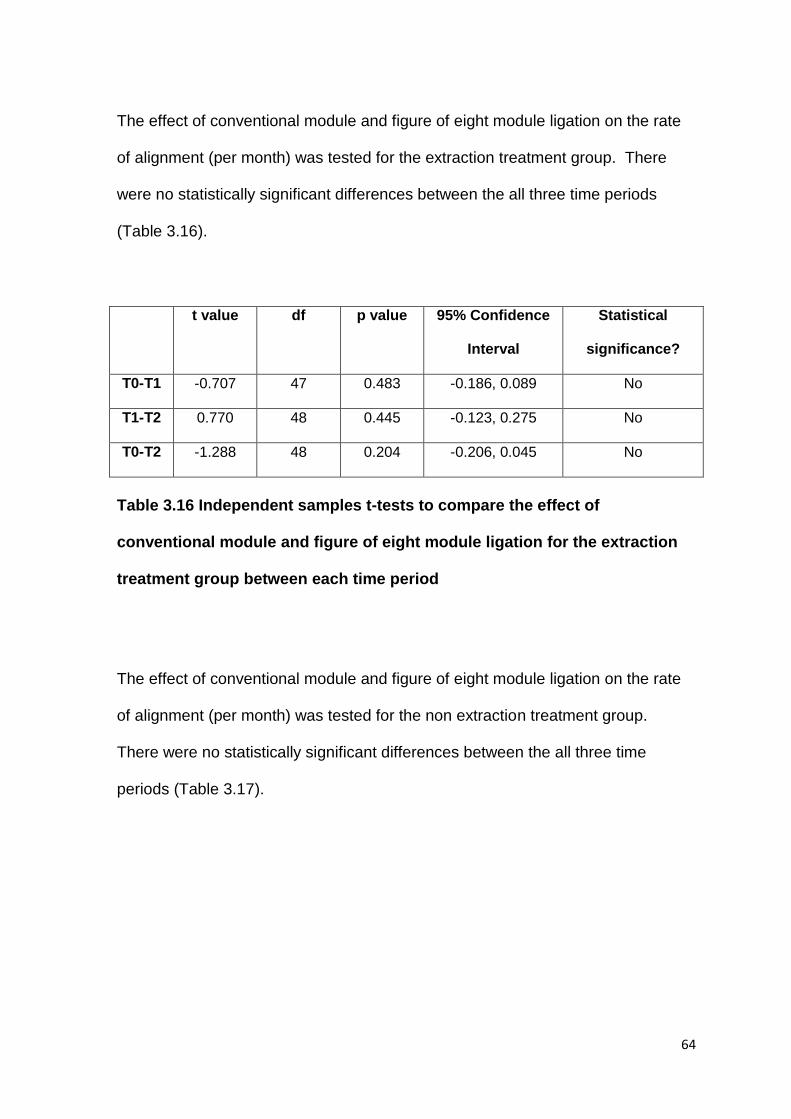
64
The effect of conventional module and figure of eight module ligation on the rate
of alignment (per month) was tested for the extraction treatment group. There
were no statistically significant differences between the all three time periods
(Table 3.16).
t value df p value 95% Confidence
Interval
Statistical
significance?
T0-T1 -0.707 47 0.483 -0.186, 0.089 No
T1-T2 0.770 48 0.445 -0.123, 0.275 No
T0-T2 -1.288 48 0.204 -0.206, 0.045 No
Table 3.16 Independent samples t-tests to compare the effect of
conventional module and figure of eight module ligation for the extraction
treatment group between each time period
The effect of conventional module and figure of eight module ligation on the rate
of alignment (per month) was tested for the non extraction treatment group.
There were no statistically significant differences between the all three time
periods (Table 3.17).

65
t value df p value 95% Confidence
Interval
Statistical
significance?
T0-T1 -0.779 48 0.440 -0.292, 0.129 No
T1-T2 -0.404 44 0.688 -0.282, 0.188 No
T0-T2 -0.899 47 0.373 -0.195, 0.075 No
Table 3.17 Independent samples t-tests to compare the effect of
conventional module and figure of eight module ligation for the non
extraction treatment group between each time period
The effect of conventional module and figure of eight module ligation on the rate
of alignment (per month) was tested for the combined extraction and non
extraction data. There were no statistically significant differences between the all
three time periods (Table 3.18).
t value Df p value 95% Confidence
Interval
Statistical
significance?
T0-T1 -1.142 97 0.256 -0.201, 0.054 No
T1-T2 0.215 94 0.831 -0.133, 0.166 No
T0-T2 -1.597 82.280 0.114 -0.166, 0.018 No
Table 3.18 Independent samples t-tests to compare the effect of
conventional module and figure of eight module ligation for the combined
extraction and non extraction data between each time period

66
3.3.2 Mann-Whitney U tests
Mann-Whitney U tests were used on the non-parametric bracket failure data. The
effect of extraction and non extraction treatment on the average number of
bracket failures per person was tested for the conventional module and figure of
eight module groups. There were no statistically significant differences (Table
3.19).
U statistic p value Statistical significance?
Conventional Modules
282 0.892 No
Figure of 8 Modules
280 0.186 No
Table 3.19 Mann-Whitney U tests to compare the effect of extraction and
non extraction treatment, for the conventional module and figure of eight
module groups, on the bracket failure rate
The effect of conventional module and figure of eight module ligation on the
average number of bracket failures per person was tested for the extraction and
non extraction groups. There were no statistically significant differences (Table
3.20).

67
U statistic p value Statistical significance?
Extraction
271 0.300 No
Non Extraction
294.5 0.681 No
Table 3.20 Mann-Whitney U tests to compare the effect of conventional
modules and figure of eight modules, for the extraction and non extraction
treatment groups, on the bracket failure rate
Furthermore, there was no statistically significant difference between conventional
module and figure of eight module ligation, for the combined extraction and non
extraction data, on the bracket failure rate (U = 1190.5, p = 0.624).
3.4 Intra-examiner reliability
Intra-examiner reliability was tested using a Bland and Altman plot (Figure 3.2)
and also the intraclass correlation coefficient, which produced a value of 0.999,
with 95% CI (0.998, 1.000). Both methods indicated excellent reliability for the
study model measurements.

68
Figure 3.2 Bland and Altman plot for intra-examiner reliability
-0.4
-0.3
-0.2
-0.1
0
0.1
0.2
0.3
0 2 4 6 8 10 12 14 16
Dif
fere
nce
Mean

69
Chapter 4
DISCUSSION

70
CHAPTER 4: DISCUSSION
Page
4.1 Study design 71
4.1.1 Treatment variation 71
4.1.2 Operators 72
4.2 Baseline results 72
4.3 Results 74
4.3.1 Rate of alignment 74
4.3.2 Bracket failures 77
71
4.1 Study design
4.1.1 Treatment variation
Attempts were made to ensure a standardised protocol of appointment intervals
at 6 weeks (T1) and 12 weeks (T2) after bonding the fixed appliances (T0).
Unfortunately it was not possible for all patients to attend every 42 days exactly.
Therefore the average daily irregularity change was calculated according to the
dates the patients attended their appointments. This was then multiplied by 30 to
achieve the standardised rate of irregularity change per month.
Patients in our unit attend routine orthodontic appointments at the standard
interval of 6-8 weeks, therefore 6 weeks was chosen as the interval, to increase
the external validity of the study. Shorter appointment intervals may have been
better to more accurately assess the rate of initial alignment and bracket failure
rate, but this would have caused an additional burden to participants and their
parents/guardians.
One participant included in this study had wrongly been allocated to the extraction
group, when extractions had only been carried out in the upper arch. As the
subject had been randomised, they were included in accordance with the
intention-to-treat analysis.
The force used to apply the elastomeric ligatures to the brackets in either a
conventional pattern or figure of eight pattern would have varied for each

72
operator. Reported ligation forces are highly variable and sensitive to the method
of application (Tidy, 1989). Unstretched modules were used to help minimise this
inconsistency.
4.1.2 Operators
The patients were treated by a mixture of operator grades; consultant, specialty
registrar, FTTA and clinical assistants. All grades were competent in bonding
fixed appliances and ligating the archwire with modules of either configuration.
Reducing the number of operators would have minimised inter-operator
variability, but this would have decreased the external validity of the study.
In this study, only one researcher (RL) measured the study casts, therefore the
limitations concerning the wide variation of inter-examiner reliability (Sjögren et
al., 2010) are not applicable.
4.2 Baseline results
One hundred patients were recruited into the study and within the sample there
were more females than males. This is a reflection of the female predilection in
the orthodontic population at Queen’s Hospital Burton upon Trent, at the time of
this trial. Fortunately gender has not been proven to be a factor related to
orthodontically induced tooth movement (Dudic et al., 2013).

73
The mean age of the participant in the study was 14 years, which reflects the
typical age of patients being treated at the hospital participating in the study.
Patients over the age of 16 years were excluded, to minimise any effect of age on
the results. Dudic et al. (2013) concluded that younger patients (<16 years)
showed greater tooth movement velocity than older ones, and Karadeniz et al.,
(2011) found that age was negatively correlated with the rate of orthodontic tooth
movement.
The ages presented were calculated using the bond up date. The inclusion
criteria stated that a patient must be 12-15 years old at the records appointment,
when the impressions for the pre-treatment study models and consent forms were
completed. Some patients were 16 years old at the time of bond up due to the
time interval from the records appointment. This was usually within a couple of
months but some patients had been referred to the oral surgery department for
extractions and/or exposures, which considerably increased the time frame to the
start of fixed appliance treatment.
At T0 the irregularity was higher in both the extraction groups. This would be
expected as patients who are more severely crowded, are more likely to have
extractions as part of their orthodontic treatment plan. In the non extraction
groups, the conventional module group had a higher starting index score
compared to the figure of eight module group (8.50mm cf. 7.84mm). No previous
studies have compared the interaction between the degree of crowding and the
74
configuration of the elastomeric module, on the rate of tooth alignment. The rate
of change in irregularity was calculated for all the participants, which should have
minimised any small differences between the groups.
4.3 Results
4.3.1 Rate of alignment
Traditionally the rate of tooth movement is thought to be approximately 1mm per
month. In this study the average rates of tooth movement per month ranged from
1.14mm (non extraction, figure of eight module group, T1-T2) to 4.03mm
(extraction, figure of eight module group, T0-T1).
Miles et al. (2005) found a rate of alignment of 1.8mm per month in the initial 10
week period, in non extraction cases. This was slower than that found in this
study, in the non extraction conventional module group; 2.95mm per month (T0-
T1) and 2.07mm per month (T0-T2). However the pre-treatment irregularity index
was lower in their study, 5.8mm versus 8.5mm.
The rate of lower incisor alignment was found to be faster when lower arch
extractions were carried out. Over a 10 week period Ong et al. (2010) found that
the rate of orthodontic tooth alignment was 3.3mm per month, compared to a
slower 2.37mm per month and 2.60mm per month for the conventional module

75
and figure of 8 module groups respectively. However the results from this study
were over a longer 12 week period and the pre-treatment irregularity index was
smaller (12.52mm versus 9.33mm). Teeth therefore seem to align quicker when
they are more displaced at the start of treatment.
The results of this study suggest that there is no difference in the rate of
mandibular incisor alignment between brackets ligated with conventional modules
or modules ligated in a figure of eight configuration. The figure of eight module
groups did align the lower teeth faster but this was not statistically significant. The
groups were stratified before randomisation for extraction or non extraction
treatment as this was thought to be a potential confounding variable. The results
demonstrate that when comparing the ligation method, there were no statistically
significant differences in the rate of alignment between treatment with or without
extractions. However in the figure of eight modules groups, there was a significant
difference between the extraction and non extraction groups for the time period
T0-T1 (p = 0.05), indicating that the rate of alignment is significantly quicker in the
extraction group.
Other potential confounding factors including malocclusion type, operator grade
and bone density were not investigated. The type of malocclusion would be
unlikely to affect the rate of lower incisor alignment as cement was placed onto
the occlusal surfaces of the lower first molars if any occlusal interference was
identified, thus freeing the occlusion. The patients in the trial were treated by a

76
range of operators but all had considerable experience in bonding fixed
appliances therefore this was not deemed to be a significant confounder. The
bone density of the mandible was not considered but this may have been a
confounding variable, which could possibly be investigated in future studies.
It is generally believed that frictional resistance must be minimised during
alignment so that tooth movement can be generated through light optimal forces.
The nature of ligation is an important contributor to frictional force. Elastomeric
modules tied in a figure of eight pattern produce significantly more friction than
conventionally tied elastomerics (Sims et al., 1993; Edwards et al., 1995;
Voudouris, 1997; Hain et al., 2003).
The results of this trial agree with the null hypothesis that figure of eight modules
have no effect on the speed of alignment of the lower anterior teeth. As figure of 8
ties might be expected to increase friction and active alignment force, this is not in
concordance with the majority of the literature that states that friction slows down
orthodontic tooth movement. Neither has it shown that teeth move quicker with
figure of eight modules, due to the increased force and more certain bracket slot
engagement. Perhaps the increased friction from figure of eight modules is
overcome intra orally by the masticatory forces, which are hundreds of times
greater than the forces derived from the archwires, lessening the importance of
true friction (O’Reilly et al., 1999).
77
4.3.2 Bracket failures
The bracket failure rate was very similar between the two different ligation
methods, and overall there was a bracket failure rate of 4% over the 12 week trial
period, which is in line with other studies. Pandis et al. (2006) found a lower
bracket failure rate of 3% over a 12 month observation period. Conversely
O’Dywer et al. (2015) reported a bond failure rate of 7.2% over the entire
orthodontic treatment period.
Ligation method is one factor that can affect the bracket failure rate, but there are
a multitude of other factors that are involved. These include bonding material,
bonding technique and procedure, diet, masticatory forces, mechanics and
occlusal interference.
In the present study, bond failures were highest on the lower incisors (47%),
followed by the lower premolars (39%). Previous studies have reported the
highest bond failure rates on the premolars (Kula et al., 2002; Sunna and Rock,
2008). A more recent study had an equal bracket failure rate between lower
incisors and lower premolars (O’Dywer et al., 2015). Lower incisors may be more
prone to debonding due to their greater initial displacement from the line of the
arch, and thus a greater ligation force is needed to engage the archwire into the
bracket slot (O’Dywer et al., 2015). This may be the reason why the majority of
bonds failed between T0 and T1. The high failure rates of premolar brackets may
78
be related to bonding problems, moisture control and greater masticatory forces
(Zachrisson, 1977).
Nearly two thirds of all lower bond failures occurred on the right hand side, in
concurrence with previous studies (Pandis et al., 2006; O’Dywer et al., 2015).
This difference may be attributed to masticatory habits (Pandis et al., 2006).

79
Chapter 5
CONCLUSIONS

80
CHAPTER 5: CONCLUSIONS
Page
5.1 Conclusions 81
5.2 Null hypothesis 81
5.3 Recommendations for clinical practice 81
5.4 Future research 82

81
5.1 Conclusions
Ligation with figure of eight modules has no effect on the rate of lower
incisor alignment. Therefore figure of eight ligation does not seem to hinder
the alignment of the teeth.
There were no differences in the average number of bracket failures per
person between conventional module and figure of eight module ligation.
5.2 Null hypothesis
There is no difference in the rate of mandibular incisor alignment between
brackets ligated with either conventional modules or figure of modules.
Accepted
5.3 Recommendations for clinical practice
In the initial alignment phase of fixed orthodontic treatment, clinicians should be
confident that the utilisation of figure eight module ligation will not slow down the
rate of lower incisor alignment, even though they do exert an increased frictional
force on the archwire. Figure of eight modules ensure a more secure engagement
of the archwire into the bracket slot compared to conventional modules but they
may cause increased discomfort for the patient. Ultimately the choice of ligation
rests with the individual clinician.

82
5.4 Further research
The fastest rate of lower incisor alignment was during the first six weeks after
bonding the fixed appliances. Further research could be undertaken to investigate
more accurately how the rate of alignment varies in this period of greatest tooth
movement, by conducting another clinical trial with more regular appointment
intervals.

83
Chapter 6
APPENDICES

84
CHAPTER 6: APPENDICES
Page
1 Search strategy 85
2 Patient information sheets and consent forms 86
3 Raw data 94

85
1. Search strategy
The PubMed and Cochrane databases were searched for literature published up
until January 2016. The Mesh term “orthodontic*” was crossed with a combination
of the following terms: “ligation”, “friction”, “brackets”, “elastomeric modules”, “rate
of alignment”, “rate of tooth movement”, “bracket failure”, and “Little’s irregularity
index”. The results were limited to English language. To complete the search,
reference lists of the included studies were manually checked.
86
2. Patient information sheets and consent forms
CHILDREN’S INFORMATION SHEET v2.0 21/11/12
Title: A study to look at the factors that affect how the lower teeth straighten
PART 1: The project
We are asking if you would take part in a research project to look at the factors associated with how quickly the lower teeth straighten with fixed braces. Before you decide if you want to join in it’s important to understand why the research is being done and what it will involve for you. So please consider this fact sheet carefully.
Why are we doing this research?
There has been a lot of research into the factors that can affect the speed of alignment of teeth but there has been very little research on how different techniques of wire attachment to the brace can affect this.
The ability of orthodontic wires to slide freely through the brackets determines to a great extent the success of the brace. The major disadvantage with the use of sliding mechanics is the friction that is generated between the bracket and the wire during orthodontic tooth movement.
Why have I been invited to take part?
You have been asked to take part as part of your normal brace treatment. Other children with will also be asked to take part.
Do I have to take part?
No. It is up to you. If you do I will ask you to sign a form saying you are happy to take part. You will be given a copy of this information sheet and your signed form to keep. You are free to stop taking part at any time during the research without giving a reason. If you decide to stop, this will not affect the treatment you are receiving.

87
What will happen to me if I take part?
You will be randomly allocated to one of two different methods of attaching the wire to the bracket; either a figure of 0 or a figure of 8 (see photograph).
If you agree to take part, the only differences to your normal treatment would be that you will not be able to choose a colour on your lower brace for the first twelve weeks and it would require two additional moulds/impressions of your lower teeth at the first two appointments after your brace has been stuck on. No extra appointments will be needed.
Contact details If you have any questions you can ask Mr Spary
Thank you for reading so far – if you are still interested, please go to Part 2:
PART 2: More information
What happens following completion of the study?
Your involvement in the study will be for the first twelve weeks that you have your fixed braces on, and then you will complete your orthodontic treatment as normal. So you will be able to choose a colour for your lower brace if you wish.
What if there is a problem or something goes wrong?
If you have any problems these will be seen to immediately. If you are worried about the way you have been treated then you may contact the study team. If you wish to complain then you can contact the people on the numbers below.
Confidentiality
You will not need to provide any personal details and you will not be identified in the report of the findings, but you may receive a copy of the results upon your request.

88
Who is organising this research?
This research is organised and supported by the University of Birmingham.
Who has reviewed the study?
Before any research goes ahead it has to be checked by a Research Ethics Committee. They make sure that the research is fair.
Questions & Complaints:
If you have any questions you can ask:
Rachel Little (Specialty Registrar)
Mr Spary (Consultant on the clinic)
If you want to seek impartial study advice or complain you can speak to:
Janet Cort (Complaints and PALS manager) Tel: extension
Thank you for reading this – please ask any questions that you want to
89
PARENT/GUARDIAN INFORMATION SHEET v2.0 21/11/12
We would like to invite you to take part in a research study. Before you decide you need to understand why the research is being done and what it would involve for you. Please take time to read the following information carefully. Talk to others about the study if you wish. (Part 1 tells you the purpose of this study and what will happen to you if you take part. Part 2 gives you more detailed information about the conduct of the study).
Title: A study to investigate the factors affecting the speed of alignment of the
lower front teeth
PART 1: The project
Why are we doing this research?
There has been a lot of research into the factors that can affect the speed of alignment of
teeth but there has been very little research on how different techniques of wire
attachment to the brace can affect this.
The ability of orthodontic wires to slide freely through the brackets determines to a great
extent the success of the brace. The major disadvantage with the use of sliding
mechanics is the friction that is generated between the bracket and the wire during
orthodontic tooth movement.
Why have we asked your child to participate?
We are inviting you and your child to take part in this study as they are shortly due to commence orthodontic treatment. Participation is entirely voluntary and your child's treatment will not be affected if you decide not to participate.
What is involved?
Once you have verbally agreed to participate we will obtain written consent from you and your child. Your child will be randomly allocated to one of two different methods of attaching the wire to the bracket; either a figure of 0 or a figure of 8 (see photograph).
90
If you agree to take part, the only differences from standard orthodontic treatment would be
that your child will not be able to choose a colour on their lower brace for the first twelve
weeks and it would require two additional moulds/impressions of their lower teeth at the first
two appointments after the brace has been fixed to the teeth.
No additional appointments are required.
At no point will any treatment be withheld. You may withdraw your child from the study at
any time without consequence to the quality of care your child will receive.
Contact Details:
For further information about the study or for any concerns please contact:
Miss Rachel Little Tel: extension
Mr David Spary Tel: extension
Part 2: Additional information
What happens following completion of the study?
Your child’s involvement in the study will be for the first twelve weeks that they have their
fixed braces on, and then they will complete your orthodontic treatment as normal. So
then they would be able to choose a colour for their lower brace if they wished.
What if there is a problem or something goes wrong?
If you have any problems these will be seen to immediately. If you are worried about the
treatment received or the way you have been treated then you may contact the study
team or speak to the consultant at any time.

91
Confidentiality
All of the information that is collected regarding the participants, during the course of the
research, will be kept strictly confidential. You will not be asked to provide any personal
details. Information that has been provided will be anonymised so you and your child
cannot be identified from it. Participants will not be identified in the report of the findings
and you may receive a copy of the results upon your request.
Who has reviewed the study?
All research in the NHS is looked at by independent group of people, called a Research
Ethics Committee to protect your safety, rights, wellbeing and dignity. This group has
approved this piece of research.
Organisation and funding
This study is being funded by the University of Birmingham.
Impartial advice and complaints
If you require further advice or have concerns, independent of the research team, then
you may contact the Patient Advice and Liaison Service in the first instance. They can
give advice, provide information on NHS services, listen to your concerns and help to sort
out problems on your behalf.
Your PALS representative is:
Janet Cort (Burton Hospital) Tel: extension
Thank you for reading this – please ask if you have any questions.

92
Patient identification number
CHILDREN’S ASSENT FORM v2.0 21/11/12
(For participant)
A study to investigate the factors that affect how quickly teeth straighten
Please answer the following: Please initial box
Have you read about this project?
Has somebody explained this project to you?
Do you understand what this project is about?
Have you asked all the questions you want?
Have you had your questions answered in a way you understand?
Do you understand it’s OK to stop taking part at any time?
If you are happy to take part, please write your name and today’s date
Your name ......................................................
Date ......................................................
Name of person/doctor who explained this project to you needs to sign too:
Print Name ___________________________
Sign ___________________________
Date ___________________________
Thank you for your help.
1 copy for patient; 1 for researcher site file; 1 (original) to be kept in hospital notes
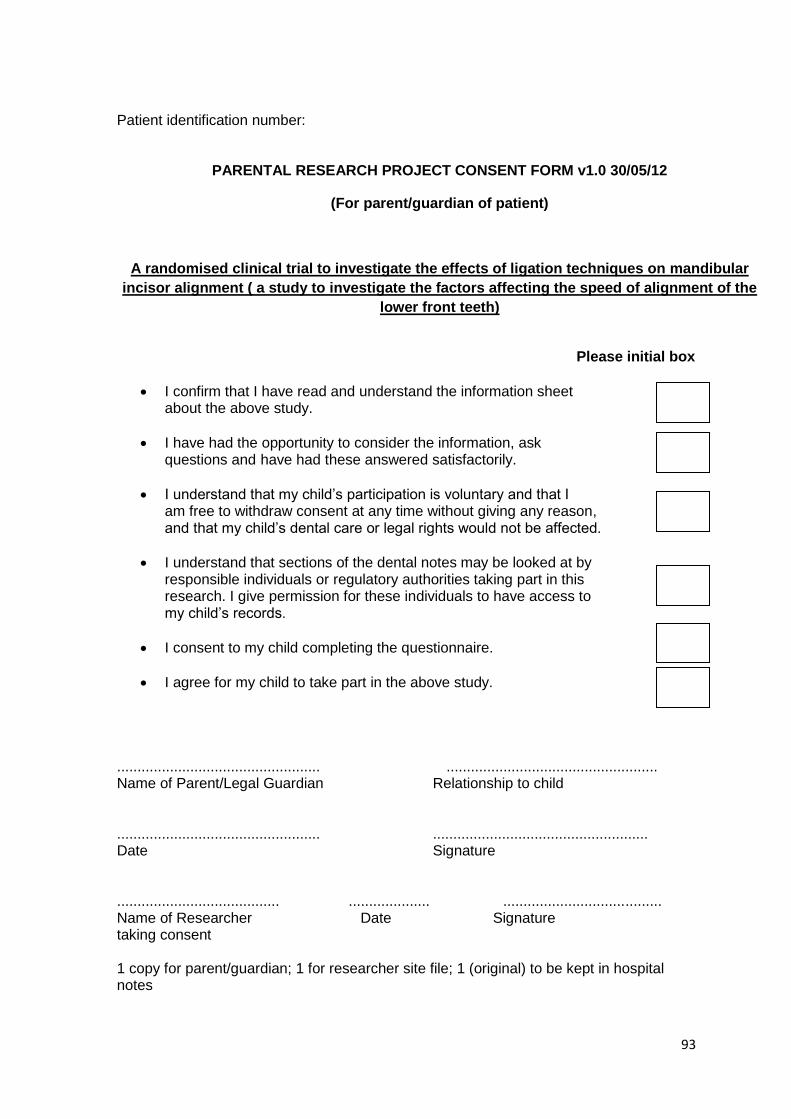
93
Patient identification number:
PARENTAL RESEARCH PROJECT CONSENT FORM v1.0 30/05/12
(For parent/guardian of patient)
A randomised clinical trial to investigate the effects of ligation techniques on mandibular
incisor alignment ( a study to investigate the factors affecting the speed of alignment of the
lower front teeth)
Please initial box
I confirm that I have read and understand the information sheet about the above study.
I have had the opportunity to consider the information, ask questions and have had these answered satisfactorily.
I understand that my child’s participation is voluntary and that I am free to withdraw consent at any time without giving any reason, and that my child’s dental care or legal rights would not be affected.
I understand that sections of the dental notes may be looked at by responsible individuals or regulatory authorities taking part in this research. I give permission for these individuals to have access to my child’s records.
I consent to my child completing the questionnaire.
I agree for my child to take part in the above study. .................................................. .................................................... Name of Parent/Legal Guardian Relationship to child .................................................. ..................................................... Date Signature ........................................ .................... ....................................... Name of Researcher Date Signature taking consent 1 copy for parent/guardian; 1 for researcher site file; 1 (original) to be kept in hospital notes
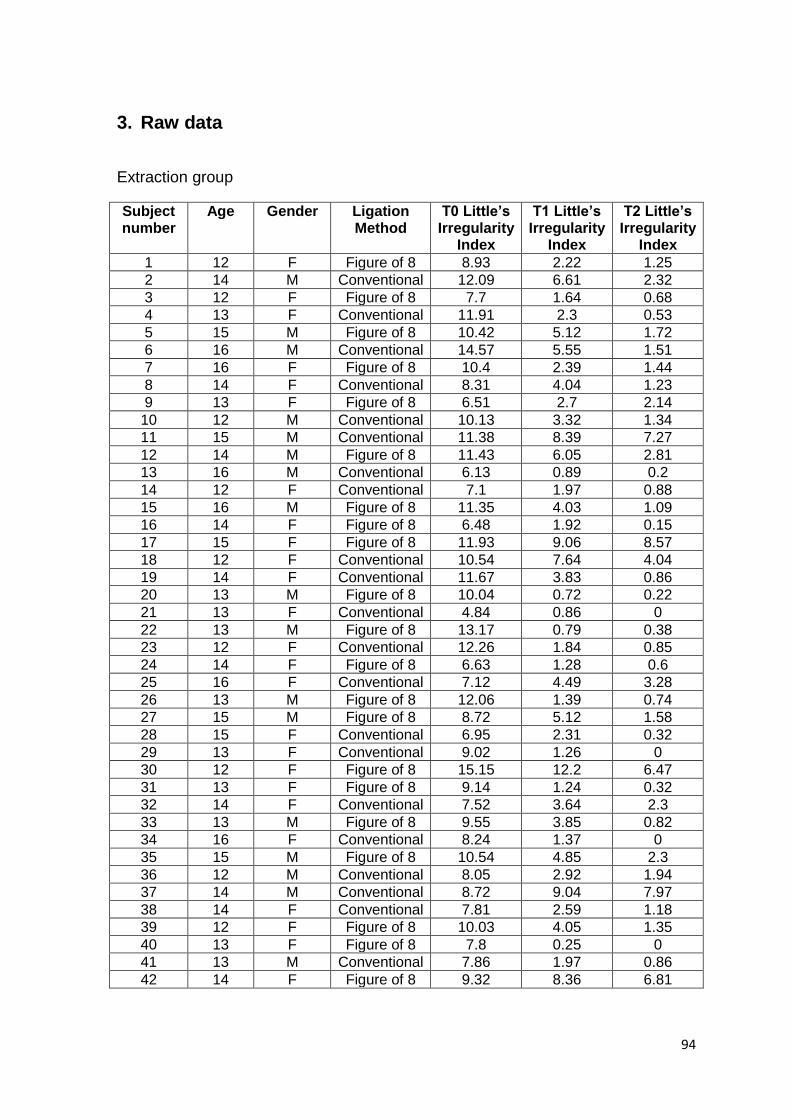
94
3. Raw data
Extraction group
Subject number
Age Gender Ligation Method
T0 Little’s Irregularity
Index
T1 Little’s Irregularity
Index
T2 Little’s Irregularity
Index
1 12 F Figure of 8 8.93 2.22 1.25
2 14 M Conventional 12.09 6.61 2.32
3 12 F Figure of 8 7.7 1.64 0.68
4 13 F Conventional 11.91 2.3 0.53
5 15 M Figure of 8 10.42 5.12 1.72
6 16 M Conventional 14.57 5.55 1.51
7 16 F Figure of 8 10.4 2.39 1.44
8 14 F Conventional 8.31 4.04 1.23
9 13 F Figure of 8 6.51 2.7 2.14
10 12 M Conventional 10.13 3.32 1.34
11 15 M Conventional 11.38 8.39 7.27
12 14 M Figure of 8 11.43 6.05 2.81
13 16 M Conventional 6.13 0.89 0.2
14 12 F Conventional 7.1 1.97 0.88
15 16 M Figure of 8 11.35 4.03 1.09
16 14 F Figure of 8 6.48 1.92 0.15
17 15 F Figure of 8 11.93 9.06 8.57
18 12 F Conventional 10.54 7.64 4.04
19 14 F Conventional 11.67 3.83 0.86
20 13 M Figure of 8 10.04 0.72 0.22
21 13 F Conventional 4.84 0.86 0
22 13 M Figure of 8 13.17 0.79 0.38
23 12 F Conventional 12.26 1.84 0.85
24 14 F Figure of 8 6.63 1.28 0.6
25 16 F Conventional 7.12 4.49 3.28
26 13 M Figure of 8 12.06 1.39 0.74
27 15 M Figure of 8 8.72 5.12 1.58
28 15 F Conventional 6.95 2.31 0.32
29 13 F Conventional 9.02 1.26 0
30 12 F Figure of 8 15.15 12.2 6.47
31 13 F Figure of 8 9.14 1.24 0.32
32 14 F Conventional 7.52 3.64 2.3
33 13 M Figure of 8 9.55 3.85 0.82
34 16 F Conventional 8.24 1.37 0
35 15 M Figure of 8 10.54 4.85 2.3
36 12 M Conventional 8.05 2.92 1.94
37 14 M Conventional 8.72 9.04 7.97
38 14 F Conventional 7.81 2.59 1.18
39 12 F Figure of 8 10.03 4.05 1.35
40 13 F Figure of 8 7.8 0.25 0
41 13 M Conventional 7.86 1.97 0.86
42 14 F Figure of 8 9.32 8.36 6.81

95
43 14 F Conventional 7.08 1.76 0.19
44 15 M Figure of 8 4.13 1.19 0
45 14 F Figure of 8 7.1 3.57 1.71
46 12 M Figure of 8 11.19 6.86 2.32
47 13 F Conventional 15.31 14.51 11.1
48 14 F Figure of 8 6.63 1.28 0.6
49 13 M Figure of 8 6.41 2.66 1.64
50 16 F Figure of 8 6.92 0.5 0.22
Subject number
Rate of change T0-T1/month
Rate of change T1-T2/month
Rate of change T0-T2/month
Number of bracket failures
Location and time period of bracket failure
1 3.59 0.69 2.25 1 LL3 T1-T2
2 3.91 3.48 3.71 0
3 2.89 0.69 2.01 0
4 5.15 1.52 3.75 1 LL4 T0-T1
5 4.54 2.49 3.43 0
6 6.57 3.39 5.09 0
7 4.9 0.68 2.95 1 LL2 T1-T2
8 3.05 2.01 2.53 0
9 2.47 0.45 1.56 1 LR1 T1-T2
10 4.86 1.21 2.9 1 LR4 T0-T1
11 1.60 0.8 1.26 0
12 4.61 1.59 2.69 0
13 2.35 0.24 1.15 0
14 3.58 0.25 1.06 0
15 6.46 1.66 3.54 0
16 3.18 1.21 2.18 0
17 2.05 0.35 1.2 0
18 2.12 2.51 2.32 1 LR2 T0-T1
19 5.22 2.79 4.21 0
20 7.36 0.35 3.64 0
21 2.84 0.44 1.43 1 LR5 T0-T1
22 10.32 0.26 4.57 0
23 7.44 0.71 4.08 0
24 3.82 0.49 2.15 0
25 1.88 0.86 1.37 1 LR2 T0-T1
26 5.93 0.63 4 0
27 3 2.47 2.71 0
28 3.31 1.22 2.19 1 LR4 T0-T1
29 5.54 1.08 3.51 0
30 2.06 4.09 3.06 0
31 4.64 0.84 3.15 0
32 1.79 0.82 1.37 0
33 4.89 2.16 3.4 0
34 4.91 0.53 2.08 0
35 4.06 1.82 2.94 0
36 2.85 1.18 2.32 2 LL2 T0-T1,LR1 T1-T2

96
37 -0.23 0.82 0.28 0
38 3.2 1.21 2.37 0
39 2.76 1.35 2.08 0
40 6.47 0.18 3.08 1 LR4 T0-T1
41 3.61 0.4 1.58 0
42 0.69 1.11 0.9 0
43 3.55 1.12 2.38 0
44 2.15 0.83 1.48 1 LR4 T0-T1
45 2.35 1.47 1.95 0
46 2.76 3.24 2.99 0
47 0.57 2.44 1.5 0
48 3.82 0.49 2.15 0
49 2.56 0.77 1.7 0
50 4.59 0.2 2.39 0
Non extraction group
Subject number
Age Gender Ligation Method
T0 Little’s Irregularity
Index
T1 Little’s Irregularity
Index
T2 Little’s Irregularity
Index
1 14 M Figure of 8 9.02 5.19 1.96
2 13 F Conventional 7.36 1.51 0.56
3 12 F Conventional 5.09 2.11 1.3
4 14 M Figure of 8 11.5 1.55 0
5 14 F Conventional 10.44 2.72 0.7
6 13 M Conventional 7.43 5.67 3.41
7 14 M Conventional 8.95 1.92 0.41
8 16 M Conventional 9.46 0.93 1.25
9 15 M Figure of 8 12.52 7.59 4.55
10 15 F Figure of 8 4.43 2.01 2.47
11 15 F Conventional 9.29 4.79 1.78
12 12 F Figure of 8 10.04 9.3 7.71
13 15 F Figure of 8 11.37 6.04 2.17
14 12 M Conventional 8.53 8.1 4.87
15 14 M Conventional 10.15 1.01 0
16 13 F Conventional 8.45 1.02 0.73
17 13 F Figure of 8 7.22 1.61 0
18 12 F Figure of 8 3.67 0.88 0.36
19 15 M Figure of 8 7.18 1.36 0.73
20 13 M Conventional 9.87 3.98 0
21 12 F Conventional 12.53 10.16 11.11
22 14 M Figure of 8 7.64 5.31 2.61
23 14 F Conventional 5 1.81 0.2
25 14 M Figure of 8 6.57 0.83 0
26 13 F Conventional 7.77 3.27 1.45
27 12 F Conventional 8.67 0.85 0.75
28 12 F Conventional 8.99 5.75 5.33
29 12 F Figure of 8 7.76 0.5 0
30 13 M Figure of 8 3.38 1.85 0.89
31 13 M Conventional 4.1 1.84 0.46

97
32 13 F Conventional 13.58 7.42 6.95
33 14 F Figure of 8 4.67 2.11 0.95
34 15 F Figure of 8 10.01 7.62 3.87
35 12 F Figure of 8 5.55 4.57 6.02
36 15 F Conventional 4.14 3.18 0.67
37 13 F Conventional 14.29 13.63 11.71
38 13 F Figure of 8 5.64 3.24 2.07
39 12 M Figure of 8 7.81 5.19 1.76
40 12 M Conventional 11.55 6.58 0
41 13 M Figure of 8 10.09 1.43 1.01
42 14 M Conventional 9.26 6.08 0.92
43 14 M Figure of 8 9.71 3.24 1.16
44 14 M Figure of 8 9.1 0.89 0.15
46 12 F Figure of 8 7.55 1.8 1.33
47 12 M Conventional 5.35 5.22 3.82
49 12 F Figure of 8 6.7 1.97 1.05
50 14 M Figure of 8 9.64 5.1 0.47
52 15 F Conventional 5.29 2.56 0.99
53 13 F Figure of 8 7.16 0.38 0
54 13 F Conventional 7.08 2.75 2.46
Subject number
Rate of change T0-T1/month
Rate of change T1-T2/month
Rate of change T0-T2/month
Number of bracket
failures
Location and time period of bracket failure
1 2.74 2.36 2.55 0
2 4.18 0.68 2.43 0
3 1.81 0.29 0.85 0
4 7.11 1.13 4.16 0
5 3.31 1.44 2.61 0
6 1.17 1.74 1.44 1 LR3 T0-T1
7 6.03 1.29 3.66 0
8 6.09 -0.23 2.93 0
9 2.64 2.68 2.66 0
10 1.77 -0.33 0.71 0
11 2.93 2.66 2.82 0
12 0.53 1.36 0.91 0
13 3.81 2.76 3.29 0
14 0.26 0.93 0.71 2 LL2, LR2 T1-T2
15 4.9 0.72 3.11 2 LR2, LR4 T0-T1
16 4.55 0.21 2.55 0
17 4.01 1.15 2.58 0
18 1.99 0.37 1.18 0
19 4.16 0.45 2.3 1 LL4 T0-T1
20 4.21 2.3 3.15 0
21 1.69 -0.58 0.47 1 LL2 T1-T2
22 1.66 1.93 1.8 1 LR5 T0-T1
23 2.28 0.69 1.29 0
25 3.51 0.59 2.17 1 LL5 T0-T1
26 3.21 0.98 1.93 0

98
27 5.59 0.07 2.83 0
28 2.31 0.3 1.31 0
29 5.19 0.36 2.77 0
30 1.09 0.82 0.97 1 LL5 T1-T2
31 1.74 1.09 1.42 1 LL1 T0-T1
32 4.4 0.4 2.58 1 LR5 T0-T1
33 1.83 0.83 1.33 0
34 1.79 2.56 2.19 2
LL1 T0-T1, LR1 T1-T2
35 0.7 -0.78 -0.14 1 LR3 T1-T2
36 0.78 1.34 1.12 0
37 0.47 1.48 0.96 0
38 1.64 0.88 1.28 1 LR5 T1-T2
39 1.87 2.45 2.16 0
40 4.26 4.7 4.5 2 LR1, LR2 T0-T1
41 5.3 0.33 3.13 0
42 2.73 3.69 3.25 0
43 3.88 1.49 2.79 0
44 4.4 0.53 2.74 1 LR2 T1-T2
46 2.46 0.37 1.73 1 LR2 T0-T1
47 0.09 1 0.55 0
49 3.38 0.66 2.02 2 LL3, LR3 T0-T1
50 2.96 3.31 3.13 0
52 1.64 1.57 1.61 0
53 4.84 0.28 2.59 0
54 3.09 0.21 1.65 1 LL5 T1-T2

99
Reliability
Subject number Little’s Irregularity Index measurement 1
Little’s Irregularity Index measurement 2
1 1.25 1.25
2 0.5 0.26
3 7.62 7.7
4 1.81 1.89
5 0.2 0.32
6 1.92 1.93
7 3.27 2.96
8 1.84 1.84
9 0.85 0.82
10 14.51 14.25
11 1.35 1.61
12 6.81 6.61
13 0.95 0.92
14 9.3 9.07
15 7.71 7.57
16 8.57 8.59
17 0.5 0.58
18 1.45 1.16
19 1.01 1.03
20 2.61 2.51
21 5.12 4.93
22 0.88 0.95
23 0 0.15
24 0.19 0.22
25 0.86 0.92
26 0.6 0.42
27 2.17 2
28 3.98 4.12
29 0 0.22
30 1.64 1.7

100
Chapter 7
LIST OF REFERENCES

101
CHAPTER 7: LIST OF REFERENCES
Almasoud, N. and Bearn, D. (2009) Little’s Irregularity Index: photographic assessment vs study model assessment. American Journal of Orthodontics and Dentofacial Orthopaedics, 138, 787-794. Andreasen, G.F. and Johnson, P. (1967) Experimental findings on tooth movement under two conditions of applied force. Angle Orthodontist, 37, 9-12. Andreasen, G.F. and Bishara, S.E. (1970) Comparison of alastik chains with elastics involved with intra-arch molar to molar forces. American Journal of Orthodontics, 40, 151-158. Andreasen, G.F. and Quevedo, F.R. (1970) Evaluation of friction forces in the 0.022” x 0.028” edgewise bracket in vitro. Journal of Biomechanics, 3, 151-160. Andreasen, G.F. and Zwanziger, D. (1980) A clinical evaluation of the differential force concept as applied to the edgewise bracket. American Journal of Orthodontics, 78, 25-40. Angle, E.H. (1907) Malocclusion of teeth. 7th ed. Philadelphia: The S.S. White Dental Manufacturing Company. Angle, E.H. (1916) Some new forms of orthodontic mechanism and the reason for their introduction. Dental Cosmos, 58, 969-994. Angle, E.H. (1928) The latest and best in orthodontic mechanism. Dental Cosmos, 70, 1143-1158. Angolkar, P.V., Kapila, S., Duncanson, M.G. and Nanda, R.S. (1990) Evaluation of friction between ceramic brackets and orthodontic wires of four alloys. American Journal of Orthodontics and Dentofacial Orthopaedics, 98, 499-506.

102
Articolo, L.C. and Kusy, R.P. (1999) Influence of angulation on the resistance to sliding in fixed appliances. American Journal of Orthodontics and Dentofacial Orthopaedics, 115, 39-51. Arun, A.V. and Vaz, A.C. (2011) Frictional characteristics of the newer orthodontic elastomeric ligatures. Indian Journal of Dental Research, 22, 95-99. Ash, J.L. and Nikolai, J. (1978) Relaxation of orthodontic elastomeric chains and modules in vitro and in vivo. Journal of Dental Research, 57, 685-690. Baccetti, T. and Franchi, L. (2006) Friction produced by types of elastomeric ligatures in treatment mechanics with the preadjusted appliance. Angle Orthodontist, 76, 211-216. Baker, K.L., Nieberg, L.G., Weimer, A.D. and Hanna, M. (1987) Frictional changes in force values caused by saliva substitution. American Journal of Orthodontics and Dentofacial Orthopaedics, 91, 316-320. Baty, D.L., Storie, D.J. and von Fraunhofer, J.A. (1994) Synthetic elastomeric chains: a literature review. American Journal of Orthodontics and Dentofacial Orthopaedics, 105, 536-542. Baty, D.L., Volz, J.E. and von Fraunhofer, J.A. (1994) Force delivery properties of coloured elastomeric modules. American Journal of Orthodontics and Dentofacial Orthopaedics, 106, 40-46. Bazakidou, E., Nanda, R., Duncanson, M.G. and Pramod, S. (1997) Evaluation of frictional resistance in aesthetic brackets. American Journal of Orthodontics and Dentofacial Orthopaedics, 112, 138-144. Bednar, J.R., Gruendeman, G.W. and Sandrik, J.L. (1991) A comparative study of frictional forces between orthodontic brackets and arch wires. American Journal of Orthodontics and Dentofacial Orthopaedics, 100, 513-522. Bednar, J.R. and Gruendeman, G.W. (1993) The influence of bracket design on moment production during axial rotation. American Journal of Orthodontics and Dentofacial Orthopaedics, 104, 254-261.

103
Berger, J.L. (1990) The influence of SPEED bracket’s self-ligating design on force levels in tooth movement: a comparative in vitro study. American Journal of Orthodontics and Dentofacial Orthopaedics, 97, 219-228. Bernabé, E. and Flores-Mir, C. (2006) Estimating arch length discrepancy through Little’s Irregularity Index for epidemiological use. European Journal of Orthodontics, 28, 269-273. Bishara, S.E. and Andreasen, G.F. (1970) A comparison of time related forces between plastic alastiks and latex elastics. American Journal of Orthodontics, 40, 319-328. Bland, J.M. and Altman, D.G. (1986) Statistical methods of clinical measurement. Lancet, i, 307-310. Boester, C.H. and Johnston, L.E. (1974) A clinical investigation of the concepts of differential and optimal force in canine retraction. Angle Orthodontist, 44, 113-119. Bousquet, J.A. (Jr), Tuesta, O. And Flores-Mir, C. (2006) In vivo comparison of force decay between injection moulded and die-cut stamped elastomers. American Journal of Orthodontics and Dentofacial Orthopaedics, 129, 384-389. Brantley, W.A., Salander, S., Myers, C.L. and Winders, R.V. (1979) Effects of prestretching on force degradation characteristics of plastic modules. Angle Orthodontist, 49, 37-43. Braun, S., Bluestein, M., Moore, B.K. and Benson, G. (1999) Friction in perspective. American Journal of Orthodontics and Dentofacial Orthopaedics, 115, 619-627. Burns, A., Dowling, A.H., Garvey, T.M. and Fleming, G.J.P. (2014) The reliability of Little’s Irregularity Index for the upper dental arch using three dimensional (3D) digital models. Journal of Dentistry, 42, 1320-1326. Burstone, C.J. and Farzin-Nia, F. (1995) Production of low friction and coloured TMA by ion implantation. Journal of Clinical Orthodontics, 29, 453-461.

104
Burstone, C.J. and Groves, M.H. (1961) Threshold and optimum force values for maxillary anterior tooth movement. Journal of Dental Research, 39, 695 (Abstract). Cacciafesta, V., Sfondrini, M.F., Ricciardi, A., Scribante, A., Kiersy, C. and Auricchio, F. (2003) Evaluation of friction of stainless steel and aesthetic self-ligating brackets in various bracket-archwire combinations. American Journal of Orthodontics and Dentofacial Orthopaedics, 124, 395-402. Chapman, J.L. (2011) Bond failure rates for two self-ligating brackets: a randomised clinical trial. Australian Orthodontic Journal, 27, 139-144. Chau Lu, T., Wang, W.N. and Tarng, T.H. (1993) Force decay of elastomeric chain – A serial study. Part II American Journal of Orthodontics and Dentofacial Orthopaedics, 104, 373-377. Chimenti, C., Franchi, L., Di Giuseppe, M.G. and Lucci, M. (2005) Friction of orthodontic elastomeric ligatures with different dimensions. Angle Orthodontist, 75, 421-425. Crawford, N.L., McCarthy, C., Murphy, T.C. and Benson, P.E. (2010) Physical properties of conventional and Super Slick elastomeric ligatures after intraoral use. Angle Orthodontist, 80, 175-181. Davidovitch, Z. And Krishnan, V. (2009) Biological mechanisms of tooth movement. 1st ed. Oxford: Wiley-Blackwell. De Franco, D.J., Spiller, R.E. and von Fraunhofer, J.A. (1995) Frictional resistances using Teflon-coated ligatures with various bracket-archwire combinations. Angle Orthodontist, 65, 63-74. De Genova, D.C., McIness-Ledoux, P., Weinberg, R. and Shaye, R. (1985) Force degradation of orthodontic elastomeric chains. A product comparison study. American Journal of Orthodontics, 87, 377-384. Dickson, J.A.S., Jones, S.P. and Davies, E.H. (1994) A comparison of the frictional characteristics of five initial alignment wires and stainless steel brackets at three bracket to wire angulations – an in vitro study. British Journal of Orthodontics, 21, 15-22.
105
Dowling, P.A., Jones, W.B., Lagerstrom, L. and Sandham, J.A. (1998) An investigation into the behavioural characteristics of orthodontic elastomeric modules. British Journal of Orthodontics, 25, 197-202. Downing, A., McCabe, J. and Gordon, P. (1994) A study of frictional forces between orthodontic brackets and arch wires. British Journal of Orthodontics, 21, 349-357. Drescher, D., Bourauel, D. and Schumacher, H.A. (1989) Frictional forces between bracket and arch wire. American Journal of Orthodontics and Dentofacial Orthopaedics, 96, 397-404. Dudic, A., Giannopoulou, C. and Kiliaridis, S. (2013) Factors related to the rate of orthodontically induced tooth movement. American Journal of Orthodontics and Dentofacial Orthopaedics, 143, 616-621. Edwards, G.D., Davies, E.H. and Jones, S.P. (1995) The ex vivo effect of ligation technique on the static frictional resistance of stainless steel brackets and archwires. British Journal of Orthodontics, 22, 145-153. Edwards, I.R., Spary, D.J. and Rock, W.P. (2012) The effect upon friction of the degradation of orthodontic elastomeric modules. European Journal of Orthodontics, 34, 618-624. Eliades, T., Eliades, G. and Watts, D.C. (1999) Structural conformation of in vitro and in vivo aged orthodontic elastomeric modules. European Journal of Orthodontics, 21, 649-658. Eliades, T., Eliades, G., Silikas, N. and Watts, D.C. (2004) Tensile properties of orthodontic elastomeric chains. European Journal of Orthodontics, 26, 157-162. Eliades, T. and Bourauel, C. (2005) Intraoral aging of orthodontic materials: the picture we miss and its clinical relevance. American Journal of Orthodontics and Dentofacial Orthopaedics, 127, 403-412. Eliades, T., Eliades, G., Silikas, N. and Watts, D.C. (2005) In vitro degradation of polyurethane orthodontic elastomeric modules. Journal of Oral Rehabilitation, 32, 72-77.

106
Ferriter, J.P., Meyers, C.E. and Lorton, L. (1990) The effect of hydrogen ion concentration on the force-degradation rate of orthodontic polyurethane chain elastics. American Journal of Orthodontics and Dentofacial Orthopaedics, 98, 404-410. Frank, C.A. and Nikolai, R.J. (1980) A comparative study of frictional resistances between orthodontic bracket and arch wire. American Journal of Orthodontics, 78, 593-609. Gandini, P., Orsi, L., Bertoncini, C., Massironi, S. and Franchi, L. (2008) In vitro frictional forces generated by three different ligation methods. Angle Orthodontist, 78, 917-921. Garner, L.D., Allai, W.W. and Moore, B.K. (1986) A comparison of frictional forces during simulated canine retraction of a continuous edgewise arch wire. American Journal of Orthodontics and Dentofacial Orthopaedics, 90, 199-203. Gioka, C. and Eliades, T. (2004) Materials-induced variation in the torque expression of preadjusted appliances. American Journal of Orthodontics and Dentofacial Orthopaedics, 125, 323-328. Griffiths, H.S., Sherriff, M. and Ireland, A.J. (2005) Resistance to sliding with 3 types of elastomeric modules. American Journal of Orthodontics and Dentofacial Orthopaedics, 127, 670-675. Hain, M., Dhopatkar, A. and Rock, P. (2003) The effect of ligation method on friction in sliding mechanics. American Journal of Orthodontics and Dentofacial Orthopaedics, 123, 416-422. Hain, M., Dhopatkar, A. and Rock P. (2006) A comparison of different ligation methods on friction. American Journal of Orthodontics and Dentofacial Orthopaedics, 130, 666-670. Harradine, N.W.T. (2003) Current products and practices. Self-ligating brackets: where are we now? Journal of Orthodontics, 30, 262-273. Harry, M.R. and Sims, M.R. (1982) Root resorption in bicuspid intrusion. A scanning electron microscope study. Angle Orthodontist, 52, 235-258.
107
Hersey, H.G. and Reynolds, W.G. (1975) The plastic module as an orthodontic tooth-moving mechanism. American Journal of Orthodontics, 67, 554-562. Hixon, E.H., Atikian, H., Callow, G.E., McDonald, H.W. and Tacy, R.J. (1969) Optimal force, differential force and anchorage. American Journal of Orthodontics, 55, 437-457. Hixon, E.H., Aasen, T.O., Arrango, J., Clark, R.A., Klosterman, R., Miller, S.S. and Odom, W.M. (1970) On force and tooth movement. American Journal of Orthodontics, 57, 476-489. Huget, E.F., Patrick, K.S. and Nunez, L.J. (1990) Observations on the elastic behaviour of a synthetic orthodontic elastomer. Journal of Dental Research, 69, 496-501. Ireland, A.J., Sherriff, M. and McDonald, F. (1991) Effect of bracket and wire composition on frictional forces. European Journal of Orthodontics, 13, 322-328. Iwasaki, L.R., Haack, J.E, Nickel, J.C. and Morton, J. (2000) Human tooth movement in response to continuous stress of low magnitude. American Journal of Orthodontics and Dentofacial Orthopaedics, 117, 175-183. Iwasaki, L.R., Beatty, M.W., Randall, C.J. and Nickel, J.C. (2003) Clinical ligation forces and intraoral friction during sliding on a stainless steel archwire. American Journal of Orthodontics and Dentofacial Orthopaedics, 123, 408-415. Kapila, S., Angolkar, P.V., Duncanson Jr, M.G. and Nanda, R.S. (1990) Evaluation of friction between edgewise stainless steel brackets and orthodontic wires of four alloys. American Journal of Orthodontics and Dentofacial Orthopaedics, 98, 117-126. Karadeniz, El., Gonzales, C., Elekdağ-Türk, S., Isci, D., Sahin-Saglam, A.M., Alkis, H., Türk, T. and Darendeliler, M.A. (2011) The effect of fluoride on orthodontic tooth movement in humans. A two- and three-dimensional evaluation. Australian Orthodontic Journal, 27, 94-101. Kasuya, S., Nagasaka, S., Hanyuda, A., Ishimura, S. and Hirashita, A. (2007) The effect of ligation on the load-deflection characteristics of nickel-titanium orthodontic archwire. European Journal of Orthodontics, 29, 578-582.

108
Keith, O., Jones, S.P. and Davies, E.H. (1993) The influence of bracket material, ligation force and wear on frictional resistance of orthodontic brackets. British Journal of Orthodontics, 20, 109-115. Khambay, B., Millett, D. and McHugh, S. (2004) Evaluation of methods of archwire ligation on frictional resistance. European Journal of Orthodontics, 26, 416-422. Khambay, B., Millett, D. and McHugh, S. (2005) Archwire seating forces produced by different ligation methods and their effect on frictional resistance. European Journal of Orthodontics, 27, 302-308. Kim, K.H., Chung, C.H., Choy, K., Lee, J.S. and Vanarsdall, R.L. (2005) Effects of prestretching on force degradation of synthetic elastomeric chains. American Journal of Orthodontics and Dentofacial Orthopaedics, 128, 477-482. Kula, K., Schreiner, R., Brown, J. and Glaros, A. (2002) Clinical bond failure of pre-coated and operator-coated orthodontic brackets. Orthodontics and Craniofacial Research, 5, 161-165. Kuster, R., Ingervall, B. and Bürgin, W. (1986) Laboratory and intra-oral test of the degradation of elastic chains. European Journal of Orthodontics, 8, 202-208. Kusy, R.P. and Whitley, J.Q. (1988) Effect of surface roughness on frictional coefficients of arch wires. Journal of Dental Research, 67, A1986. Kusy, R.P., Whitley, J.Q., Mayhew, M.J. and Buckthal, J.E. (1988) Surface roughness of orthodontic archwires via laser spectroscopy. Angle Orthodontist, 58, 33-45. Kusy, R.P. and Whitley, J.Q. (1989) Effects of sliding velocity on the coefficients of friction in a model orthodontic system. Dental Materials, 5, 235-240. Kusy, R.P. and Whitley, J.Q. (1990) Coefficients of friction for arch wires in stainless steel and polycrystalline alumina bracket slots: I. The dry state. American Journal of Orthodontics and Dentofacial Orthopaedics, 98, 300-312.
109
Kusy, R.P., Tobin, E.J., Whitley, J.Q. and Sioshansi, P. (1992) Frictional coefficients of ion-implanted alumina against ion-implanted beta-titanium in the low load, low velocity, single pass regime. Dental Materials, 8, 167-172. Kusy, R.P. and Whitley, J.Q. (1992) Influence of fluid media on the frictional coefficients in orthodontic sliding. Journal of Dental Research, 71, 168. Kusy, R.P. and Whitley, J.Q. (1997) Friction between different wire-bracket configurations and materials. Seminars in Orthodontics, 3, 166-177. Lam, T.V., Freer, T.J., Brockhurst, P.J. and Podlich, H.M. (2002) Strength decay of orthodontic elastomeric ligatures. Journal of Orthodontics, 29, 37-43. Lee, B.W. (1964) Relationship between tooth-movement rate and estimated pressure applied. Journal of Dental Research, 44, 1053. Lee, B.W. (1995) The force requirements for tooth movement part 1: tipping and bodily movement. Australian Orthodontic Journal, 13, 238-248. Little, R. (1975) The Irregularity Index: A quantitative score of mandibular anterior alignment. American Journal of Orthodontics, 68, 554-563. Littlewood, S.J., Millett, D.T., Doubleday, B., Bearn, D.R. and Worthington, H.V. (2006) Retention procedures for stabilising tooth position after treatment with orthodontic braces. Cochrane Database of Systematic Reviews, Issue 1. CD002283. Loftus, B.P. and Årtun, J. (2001) A model for evaluating friction during orthodontic tooth movement. European Journal of Orthodontics, 23, 253-261. Lundgren, D., Owman-Moll, P. and Kurol, J. (1996) Early tooth movement pattern after application of a controlled continuous orthodontic force. A human experimental model. American Journal of Orthodontics and Dentofacial Orthopaedics, 110, 287-295. Macauley, D., Garvey, T.M., Dowling, A.H. and Fleming, G.J.P. (2012) Using Little’s Irregularity Index in orthodontics: outdated and inaccurate? Journal of Dentistry, 40, 1127-1133.
110
Maijer, R. and Smith, D.C. (1990) Time savings with self-ligating brackets. Journal of Clinical Orthodontics, 24, 29-31. McKamey, R.P. and Kusy, R.P. (1999) Stress-relaxing composite ligature wires: formulations and characteristics. Angle Orthodontist, 69, 441-449. Meling, T.R., Ødegaard, J., Holthe, K. and Segner, D. (1997) The effect of friction on the bending stiffness of orthodontic beams: A theoretical and in vitro study. American Journal of Orthodontics and Dentofacial Orthopaedics, 112, 41-49. Miles, P.G. (2005) SmartClip versus conventional twin brackets for initial alignment: is there a difference? Australian Orthodontic Journal, 21, 123-127. Miles, P.G., Weyant, R.J. and Rustveld, L. (2006) A clinical trial of Damon 2 vs conventional twin brackets during initial alignment. Angle Orthodontist, 76, 480-485. O’Brien, K., Lewis, D., Shaw, W. And Combe, E. (1990) A clinical trial of aligning archwires. European Journal of Orthodontics, 12, 380-384. O’Dywer, L., Littlewood, S.J., Rahman, S., Spencer, R.J., Barber, S.K. and Russell, J.S. (2015) A multi-center randomized controlled trial to compare a self-ligating bracket with a conventional bracket in a UK population: Part 1: treatment efficacy. Angle Orthodontist, Apr 8. [Epub ahead of print] Ogata, R.H., Nanda, R.S., Duncanson Jr, M.G., Sinha, P.K. and Currier, G.F. (1996) Frictional resistances in stainless steel bracket-wire combinations with effects of vertical deflections. American Journal of Orthodontics and Dentofacial Orthopaedics, 109, 535-542. Olson, J.E., Liu, Y., Nickel, J.C., Walker, M.P. and Iwasaki, L.R. (2012) Archwire vibration and stick-slip behaviour at the bracket-archwire interface. American Journal of Orthodontics and Dentofacial Orthopaedics, 142, 314-322.

111
Ong, E., McCallum, H., Griffin, M.P. and Ho, C. (2010) Efficiency of self-ligating vs conventionally ligated brackets during initial alignment. American Journal of Orthodontics and Dentofacial Orthopaedics, 138, 138.e1-138.e7. O’Reilly, D., Dowling, P.A., Lagerstrom, L. and Swartz, M.L. (1999) An ex vivo investigation into the effect of bracket displacement on the resistance to sliding. British Journal of Orthodontics, 26, 219-227. Owman-Moll, P., Kurol, J. and Lundgren, D. (1996a) Effects of a doubled orthodontic force magnitude on tooth movement and root resorption. An inter-individual study in adolescents. European Journal of Orthodontics, 18, 141-150. Owman-Moll, P., Kurol, J. and Lundgren, D. (1996b) Effects of a four-fold orthodontic force magnitude on tooth movement and root resorption. An intra-individual study in adolescents. European Journal of Orthodontics, 18, 287-294. Pandis, N., Polychronopoulou, A. and Eliades, T. (2006) Failure rate of self-ligating and edgewise brackets bonded with conventional acid etching and a self-etching primer: A prospective in vivo study. Angle Orthodontist, 76, 119-122. Peterson, L., Spencer, R. and Andreasen, G. (1982) A comparison of friction resistance for nitinol and stainless steel wire in edgewise brackets. Quintessence International, 5, 563-571. Popli, K., Pratten, D., Germane, N. and Gunsolley, J. (1989) Frictional resistance of ceramic and stainless steel orthodontic brackets. Journal of Dental Research, 68, 275. Pratten, D.H., Popli, K., Germane, M. and Gunsolley, J.C. (1990) Frictional resistance of ceramic and stainless steel orthodontic brackets. American Journal of Orthodontics and Dentofacial Orthopaedics, 98, 398-403. Proffit, W.R., Fields, H.W. and Sarver, D.M. (2007) Contemporary Orthodontics. 4th ed. St Louis: Mosby. Prososki, R.R., Bagby, M.D. and Erickson, L.C. (1991) Static frictional force and surface roughness of nickel-titanium arch wires. American Journal of Orthodontics and Dentofacial Orthopaedics, 100, 341-348.

112
Quinn, R.S. and Yoshikawa, D.K. (1985) A reassessment of force magnitude in orthodontics. American Journal of Orthodontics, 85, 252-260. Ren, Y., Maltha, J.C. and Kuijpers-Jagtman, A.M. (2003) Optimum force magnitude for orthodontic tooth movement: A systematic literature review. Angle Orthodontist, 73, 86-92. Renwick, M.R., Brantley, W.A., Beck, F.M., Vig, K.W.L. and Webb, C.S (2004) Studies of orthodontic elastomeric modules. Part 1: Glass transition temperatures for representative pigmented products in the as-received condition and after orthodontic use. American Journal of Orthodontics and Dentofacial Orthopaedics, 126, 337-343. Riley, J.L., Garrett, S.G. and Moon, P.C. (1979) Frictional forces of ligated plastic and metal edgewise brackets. Journal of Dental Research, 58, 98. Rock, W.P., Wilson, H.J. and Fisher, S.E. (1986) Force reduction of orthodontic elastomeric chains after one month in the mouth. British Journal of Orthodontics, 13, 147-150. Rucker, B.K. and Kusy, R.P. (2002) Resistance to sliding of stainless steel multistranded archwires and comparison with single-stranded levelling wires. American Journal of Orthodontics and Dentofacial Orthopaedics, 122, 73-83. Ryan, R., Walker, G., Freeman, K. and Cisneros, G.J. (1997) The effects of ion implantation on rate of tooth movement: an in vitro model. American Journal of Orthodontics and Dentofacial Orthopaedics, 112, 64-68. Schumacher, H.A., Bourauel, C. and Drescher, D. (1990) The effect of the ligature on the friction between bracket and arch. Fortschr Kieferorthop, 51, 106-116. Scott, P., DiBiase, A.T., Sherriff, M. and Cobourne, M. (2008) Alignment efficiency of Dmaon3 self-ligating and conventional orthodontic bracket systems: a randomised clinical trial. American Journal of Orthodontics and Dentofacial Orthopaedics, 134, 471-478.

113
Shivapuja, P.K. and Berger, J. (1994) A comparative study of conventional ligation and self-ligation bracket systems. American Journal of Orthodontics and Dentofacial Orthopaedics, 106, 472-480. Sims, A.P., Waters, N.E., Birnie, D.J. and Pethybridge, R.J. (1993) A comparison of the forces required to produce tooth movement in vitro using two self-ligating brackets and a pre-adjusted bracket employing two types of ligation. European Journal of Orthodontics, 15, 377-385. Sirisaowaluk, N., Kravchuk, O. and Ho, C.T. (2006) The influence of ligation on frictional resistance to sliding during repeated displacement. Australian Orthodontic Journal, 22, 141-146. Sjögren, A.P.G., Lindgren, J.E. and Huggare, J.A.V. (2010) Orthodontic study cast analysis – reproducibility of recordings ad agreement between conventional and 3D virtual measurements. Journal of Dental Imaging, 23, 482-492. Stannard, J.G., Gau, J.M. and Hanna, M.A. (1986) Comparative friction of orthodontic wires under dry and wet conditions. American Journal of Orthodontics and Dentofacial Orthopaedics, 89, 485-491. Storey, E. and Smith, R. (1952) Force in orthodontics and its relation to tooth movement. Australian Dental Journal, 56, 11-18. Sunna, S. and Rock, W.P. (2008) Effect of sandblasting on the retention of orthodontic brackets: a controlled clinical trial. Journal of Orthodontics, 35, 43-48. Taloumis, L.D., Smith, T.M., Hondrum, S.O. and Lorton, L. (1997) Force decay and deformation of orthodontic elastomeric ligatures. American Journal of Orthodontics and Dentofacial Orthopaedics, 111, 1-11. Tanne, K., Matsubara, S., Shibaguchi, T. and Sakuda, M. (1991) Wire friction from ceramic brackets during simulated canine retraction. Angle Orthodontist, 61, 285-290. Taylor, N.G. and Ison, K. (1996) Frictional resistance between orthodontic brackets and archwires in the buccal segments. Angle Orthodontist, 66, 215-222.

114
Tecco, S., Festa, F., Caputi, S., Traini, T., Di lorio, D. and D’Attilio, M. (2005) Friction of conventional and self-ligating brackets using a 10 bracket model. Angle Orthodontist, 75, 1041-1045. Thomas, S., Sherriff, M. and Birnie, D. (1998) A comparative in vitro study of the frictional characteristics of two types of self-ligating brackets and two types of pre-adjusted edgewise brackets tied with elastomeric ligatures. European Journal of Orthodontics, 20, 589-596. Thorstenson, G.A. and Kusy, R.P. (2003) Effects of ligation type and method on the resistance to sliding of novel orthodontic brackets with second-order angulation in the dry and wet states. Angle Orthodontist, 73, 418-430. Tidy, D.C. (1989) Frictional forces in fixed appliances. American Journal of Orthodontics and Dentofacial Orthopaedics, 96, 249-254. Tselepis, M., Brockhurst, P. and West, V.C. (1994) The dynamic frictional resistance between orthodontic brackets and arch wires. American Journal of Orthodontics and Dentofacial Orthopaedics, 106, 131-138. Turnbull, N.R. and Birnie, D, J. (2007) Treatment efficiency of conventional vs self-ligating brackets: Effects of archwire size and material. American Journal of Orthodontics and Dentofacial Orthopaedics, 131, 395-399. Vaughan, J.L., Duncanson Jr, M.G., Nanda, R.S. and Currier, G.F. (1995) Relative kinetic frictional forces between sintered stainless steel brackets and orthodontic wire. American Journal of Orthodontics and Dentofacial Orthopaedics, 107, 20-27. Voudouris, J.C. (1997) Interactive edgewise mechanisms: form and function comparison with conventional edgewise brackets. American Journal of Orthodontics and Dentofacial Orthopaedics, 111, 119-140. Wahab, R.M.A., Idris, H., Yacob, H. and Ariffin, S.H.Z. (2012) Comparison of self- and conventional-ligating brackets in the alignment stage. European Journal of Orthodontics, 34, 171-178.
115
Wong, A.K. (1976) Orthodontic elastic materials. Angle Orthodontist, 46, 196-205. Yee, J.A., Türk, T., Elekdağ-Türk, S., Cheng, L.L. and Darendeliler, M.A. (2009) Rate of tooth movement under heavy and light continuous orthodontic forces. American Journal of Orthodontics and Dentofacial Orthopaedics, 136, 150.e1-150.e9. Young, J. and Sandrik, J.L. (1979) The influence of pre-loading on stress relaxation of orthodontic elastic polymers. Angle Orthodontist, 49, 104-109. Zachrisson, B.J. (1977) A post-treatment evaluation of direct bonding in orthodontics. American Journal of Orthodontics, 71, 173-189. Zufall, S.W. and Kusy, R.P. (2000) Sliding mechanics of coated composite wires and the development of an engineering model for binding. Angle Orthodontist, 70, 34-47.