Embed Size (px)
Citation preview

Empirical Investigations
A Stiffness Discrimination Experiment Including Analysis of PalpationForces and Velocities
Ernur Karadogan, MS;
Robert L. Williams II, PhD;
John N. Howell, PhD;
Robert R. Conatser, Jr., MS
Introduction: The incorporation of haptics, the sense of touch, into medical simula-tions increases their capabilities by enabling the users to “feel” the virtual environment.We are involved with haptics-augmented VR training for palpatory diagnosis. Wehave developed a stiffness discrimination program to train and test users in findingsubtle differences in human tissue stiffness for medical diagnoses. In this article, westudied the effect of surface stiffness on the stiffness discrimination task and analyzedthe palpation force and speed during haptic exploration.Methods: The ability to discriminate stiffness differences was studied by means of apsychophysical experiment with 13 second-year medical students (eight women andfive men). Subjects were asked to identify the stiffer of two virtual computer-generatedsurfaces (top surfaces of two cylinders) by means of a PHANToM Omni (SensAble Inc.)haptic device with a modified stylus to accommodate their fingers. The modification ofthe stylus provided the mechanical advantage to simulate surface stiffness values thatare beyond the original capability of the haptic device. An adaptive two-alternativeforced-choice procedure was used on each trial. Palpation velocity and force vectorswere recorded directly from the haptic device for further analyses. Weber fraction wasdetermined by using an automated mastery algorithm.Results: Four standard stiffness values (0.25, 0.50, 1.00, and 1.25 N/mm), typical ofthe stiffness range of human soft tissues, were used as references. The average experimen-tal Weber fractions observed were 0.20, 0.27, 0.26, and 0.30, respectively, with higherWeber fractions corresponding to lower stiffness discrimination ability. At 1.00 and 1.25N/mm standard stiffness, the correlation analysis for Weber fraction and the palpationspeed revealed significant differences (P � 0.05). These differences suggested that thesubjects with a higher palpation velocity tended to have a higher Weber fraction. Therewas no significant difference between male and female subjects. There was no significantdifference between subjects new to the haptic device and those who had used it previously.The average amount of force that was applied by the subjects to the standard stiffness sideand the comparison stiffness side within the sessions was not significantly different.However, the subjects increased the average force they applied with increasing standardstiffness value across the sessions (P � 0.05).Conclusions: For the four standard stiffness values investigated, 0.25, 0.50, 1.00,and 1.25 N/mm, the resulting average stiffness-discrimination Weber fractions were0.20, 0.27, 0.26, and 0.30, respectively. The average of the forces applied by thesubjects was constant within a single session (with a single standard stiffness value).This average force monotonically increased as the standard stiffness value increasedacross the sessions. We also found positive correlation between the Weber fractionand the palpation speed in the sessions tested with 1.00 and 1.25 N/mm standardstiffness. This correlation suggested that higher speed is related to lower sensitivity indiscrimination of stiffness differences for these two standard stiffness values. Our resultsare applicable to tasks involving stiffness discrimination between multiple objects.(Sim Healthcare 5:000–000, 2010)
Key Words: Stiffness discrimination, Compliance, Haptics, Weber fraction, Palpation, Pal-pation velocity, Palpation force.
The usage of simulation systems is proceeding toward be-coming an important part of medical education. These sim-ulators for training of medical professionals (doctors, nurses,
physical therapists, veterinarians, etc.) are beneficial for sev-eral different reasons, some of them are as follows:
• Patient safety is not a concern because the trainees donot deal with real patients, providing them an opportu-nity to safely learn from their mistakes.
• The simulated medical problems or cases are repeatable,ie, the same situation can be worked on several timesuntil the desired results are achieved.
• Speed and accuracy of any task may be enhanced byrepetition with feedback on performance (such as pal-pation, taking pulses, and insertion of tubes).
From the Interdisciplinary Institute for Neuromusculoskeletal Research,Ohio University, Athens, OH.
Supported by the Osteopathic Heritage Foundation of Columbus, OH.
Reprints: Robert L. Williams II, PhD, Department of MechanicalEngineering, 259 Stocker Center, Ohio University, Athens, OH 45701-2979 (e-mail: [email protected]).
Copyright © 2010 Society for Simulation in HealthcareDOI: 10.1097/SIH.0b013e3181e9e783
balt3/sih-sih/sih-sih/sih00410/sih0250-10z xppws S�1 6/18/10 8:08 4/Color Figure(s): F1,F3–11 Art: SIH200270 Input-us
Vol. 5, No. 4, Summer 2010 1
AQ: A
AQ: B
AQ: K
AQ: L
<article-id pub-id-type��doi�>10.1097/SIH.0b013e3181e9e783</article-id> ● <fpage></fpage> ● <lpage></lpage>
• Simulations may become powerful assessment tools be-cause every trainee may be exposed to the same situa-tion, and their performance may be measured qualita-tively and quantitatively to be evaluated later.
The simulation systems can be in virtual reality (computergenerated), augmented reality (virtual reality is reinforced bymeans of real accessories), or in the form of a mannequin thatcan imitate the symptoms of a real human. The addition ofhaptics (sense of touch) into virtual/augmented reality sim-ulators increases their capabilities beyond visual and audiofeedback alone by enabling the users to “feel” the virtualenvironment.
We are involved with development of haptic simulationsfor palpatory diagnosis. Palpation, an economical and effec-tive first line of medical diagnosis used in many fields ofhealthcare, plays an important role in osteopathic, allopathic,and veterinary medicine. It is fast and inexpensive, but lim-ited patient (human or animal) volume and uneven mix ofpathologies make training of professionals in these areas dif-ficult. For instance, training of osteopathic medical studentson palpation is usually performed in laboratories with stu-dents practicing on each other. These settings do not providethe typical population (age and physical condition) that thesestudents will diagnose and/or treat. Therefore, we developedthe virtual haptic back (VHB) as a training tool for medicalstudents.1–3 It is a simulation of contours and tissue texturesof a human back that is presented graphically and haptically.Students use haptic devices to “feel” the VHB and identify thedysfunctional region. The dysfunctional region is simulatedas increased stiffness compared with the background stiffnessof the palpable portion of the entire back.
The VHB is the only human back simulation that is ac-tively being used in palpation training of osteopathic medi-cine students. E-Pelvis is another example of a palpation sim-ulator.4,5 It is an electronic mannequin, which enables usersto see on a computer screen where in the pelvis they touchduring training and the pressure they apply to those touchpoints. The availability of objective performance data (theapplied pressure and number of times a critical point with asensor is touched) makes it a powerful assessment tool aswell. There are also examples of palpation simulators in vet-erinary medicine. The Bovine Rectal Palpation Simulator isused to teach veterinary medicine students to identify fertilityproblems and diagnose pregnancy.6 Another example is thesimulator developed for feline abdominal palpation train-ing.7
It is apparent that palpation simulators are becomingmore common and applicable as haptics technology is inte-grated into these simulations. The ability to discriminatestiffness differences is a very important and frequently usedpart of palpation. It is used to detect problems such as mus-cles in spasm, lumps in breasts, testes, and abdomens. Forinstance, the existence of a lump in breast tissue is initiallyidentified by palpation before any further investigation isperformed. Therefore, any simulation that is designed fordiagnosis through palpation would, directly or indirectly, in-volve training of individuals to increase their sensitivity forstiffness discrimination. However, as in any sensory modal-
ity, humans are subject to certain limits in terms of discrim-inating the minimum stiffness difference between two ormore objects. These limits, varying noticeably among indi-viduals, may be the results of limited amount of feedbackreceived from cutaneous and proprioceptive receptors andmethods (high/low force, high/low speed, etc.) used duringthe palpation process. Simulations can be useful tools to helpusers improve their sensitivity. Users can also be taught andcan practice the methods that will help them improve theirlimits (ie, higher sensitivity to discriminate subtle changes).
The Weber fraction is used to quantify the limits, ie, theminimum difference that a person can discriminate, for dif-ferent sensory modalities. The Weber fraction is defined to bethe ratio of this minimum difference to the standard intensityof the stimulus in a sensory modality. In the area of haptics,there have been a number of studies to find the limits ofhuman perception of stiffness (or compliance, the inverse ofstiffness) differences. DeGersem8 used a PHANToM 1.5 hap-tic interface and found Weber fractions between 0.08 and0.12. The support point of the arm for this study was theelbow. Jones and Hunter9 reported a Weber fraction of 0.23for stiffness discrimination by using a contralateral limbmatching procedure.7 With supported elbows, the subjectsmatched the stiffness of two motors (one matching and onereference) connected to their wrists. Tan et al10 reportedmean Weber fractions for stiffness of 0.08 for fixed and 0.22for roving displacement. In their study, the subjects squeezedtwo plates along a linear track by using the thumb and theindex finger. Howell et al1 reported a Weber fraction of 0.11for compliance detection after eight practice sessions (beforepractice, the Weber fraction was 0.40) with the VHB, a sim-ulation of the feel of a human back. In this study, subjectswere asked to identify randomly set regions with a higherstiffness value (representing altered tissue texture), using theshoulder as their support point. One of the differences amongthese previous studies is the varying support point of the armor finger during palpation.
The accuracy of the stiffness discrimination between twoobjects in virtual and real-life situations may be affected byvarious measures such as the existence of tactile and/or kin-esthetic feedback, visual feedback, stiffness value of the sur-faces, and the speed of exploration. It is important to identifythese effects to be able to develop better virtual environ-ments. Srinivasan and LaMotte11 analyzed the effect of thetactile and kinesthetic feedback and found that, for deform-able objects, kinesthetic feedback alone is not sufficient todiscriminate stiffness, whereas tactile feedback alone is suffi-cient. Srinivasan et al12 showed the importance of visualdominance in their related article by using two virtual springsand providing the subjects with independent visual and kin-esthetic clues. The authors asked the subjects to identify thestiffer spring and changed the relationship between the visualdeformation and actual deformation on each springthroughout the trials. Their results showed a complete dom-inance of the visual feedback over the kinesthetic feedback.
In this article, we study the effect of surface stiffness onstiffness discrimination. We also measure and analyze palpa-tion forces and speeds during haptic exploration. We hypoth-
balt3/sih-sih/sih-sih/sih00410/sih0250-10z xppws S�1 6/18/10 8:08 4/Color Figure(s): F1,F3–11 Art: SIH200270 Input-us
2 Stiffness Discrimination Experiment Simulation in Healthcare
esize that the forces applied to detect the stiffness of an objectin consideration increases as the stiffness increases.
The main objectives of this study were (1) to design andperform an experiment to test the ability of individuals todiscriminate stiffness differences; (2) to analyze the palpationforces during palpation; and (3) to analyze palpation speedduring haptic exploration. Our stiffness detection resultscompare well with previously published results, but our anal-ysis of palpation forces and speed is a new result. We alsodiscuss the possible contributions of this study to medicalsimulations.
METHODSExperimental Setup
The experiments were run on a 2.8 GHz dual Pentium PCwith 1 GB RAM and an NVIDIA Quadro 4XGL videoadapter. A PHANToM Omni haptic interface displayed thestiffnesses to the subjects. The graphical interface was writtenusing Microsoft Visual C�� and the OpenGL graphic li-brary. The haptic effects were implemented by using theSensAble OpenHaptics Toolkit.
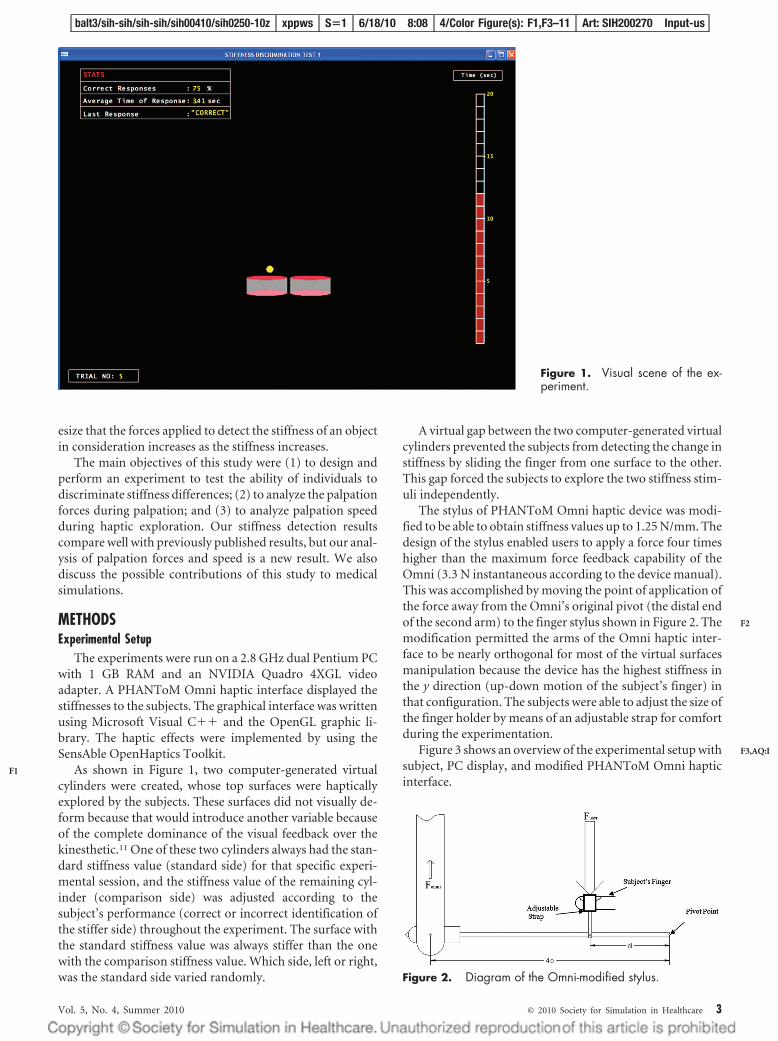
As shown in Figure 1, two computer-generated virtualcylinders were created, whose top surfaces were hapticallyexplored by the subjects. These surfaces did not visually de-form because that would introduce another variable becauseof the complete dominance of the visual feedback over thekinesthetic.11 One of these two cylinders always had the stan-dard stiffness value (standard side) for that specific experi-mental session, and the stiffness value of the remaining cyl-inder (comparison side) was adjusted according to thesubject’s performance (correct or incorrect identification ofthe stiffer side) throughout the experiment. The surface withthe standard stiffness value was always stiffer than the onewith the comparison stiffness value. Which side, left or right,was the standard side varied randomly.
A virtual gap between the two computer-generated virtualcylinders prevented the subjects from detecting the change instiffness by sliding the finger from one surface to the other.This gap forced the subjects to explore the two stiffness stim-uli independently.
The stylus of PHANToM Omni haptic device was modi-fied to be able to obtain stiffness values up to 1.25 N/mm. Thedesign of the stylus enabled users to apply a force four timeshigher than the maximum force feedback capability of theOmni (3.3 N instantaneous according to the device manual).This was accomplished by moving the point of application ofthe force away from the Omni’s original pivot (the distal endof the second arm) to the finger stylus shown in Figure 2. Themodification permitted the arms of the Omni haptic inter-face to be nearly orthogonal for most of the virtual surfacesmanipulation because the device has the highest stiffness inthe y direction (up-down motion of the subject’s finger) inthat configuration. The subjects were able to adjust the size ofthe finger holder by means of an adjustable strap for comfortduring the experimentation.
Figure 3 shows an overview of the experimental setup withsubject, PC display, and modified PHANToM Omni hapticinterface.
Figure 1. Visual scene of the ex-periment.
Figure 2. Diagram of the Omni-modified stylus.
balt3/sih-sih/sih-sih/sih00410/sih0250-10z xppws S�1 6/18/10 8:08 4/Color Figure(s): F1,F3–11 Art: SIH200270 Input-us
Vol. 5, No. 4, Summer 2010 © 2010 Society for Simulation in Healthcare 3
F1
F2
F3,AQ:I

SubjectsThirteen adult subjects (eight women and five men, all
osteopathic medical students) participated in the experi-ment. They had no known neuromuscular abnormalities.Eight of the subjects had prior experience with haptics (forceand touch feedback from virtual reality) by participating in atleast one of the studies conducted by the Virtual Haptic BackLaboratory of the Interdisciplinary Institute for Neuromus-culoskeletal Research.1–3,13 Ohio University IRB approval wasobtained for this experiment, and all participating subjectssigned an informed consent form.
ProcedureThe experiment consisted of four different sessions to ac-
commodate testing over four different standard stiffness val-ues (0.25, 0.50, 1.00, and 1.25 N/mm). Each session was com-posed of a number of trials. The exact number of trialsdepended on the subjects’ performance. The subjects com-pleted all four sessions in 2 weeks, and they were not allowedto perform more than one session per day. The subjects weregiven a $20 gift certificate and a letter of participation fortheir medical school files.
The subjects were presented with two spatially separatedstimuli that they probed actively (Fig. 1). The subjects puttheir index fingers in the custom-made stylus and were askedto identify the stiffer side of the two virtual surfaces. Theywere allowed to feel the stiffness of the surfaces as long as theywanted to until the 20-second time limit ended. Forces re-flected to the subject were calculated using Hooke law, mul-tiplying the depth of compression of the virtual object by thestiffness at that location. Of the two stimuli, one representedthe standard stiffness side, whereas the other was the compar-ison stiffness side. The standard stimulus, which was constantthroughout a session, was randomized to be either on the leftor on the right side.
A two-alternative forced-choice procedure was used oneach trial.14 The subjects had two alternatives to choose from(right or left cylinder), and they had to select either one to beable to proceed to the next trial. They received feedback in-dicating whether they correctly identified the stiffer side, therunning percentage of their correct responses, and the aver-age time of response. The average time of response was pro-
vided to encourage the subjects to remain within a certaintime limit (20 seconds for each trial), so that they could finishthe session without becoming bored or fatigued.
To determine the subjects’ stiffness discrimination thresh-old, we used an adaptive method. A threshold is defined to bethe stimulus (in this case stiffness) difference that can bediscriminated at a target level of performance. Adaptivemethods do not require the a priori determination of thesequence of stimulus levels, and the threshold is found bysystematically varying these stimulus levels during the exper-iment. There are four questions that need to be answeredduring the design of an adaptive method: (1) How should wedecide to end testing at the current stimulus level and shift toa new one?, (2) Once we decide to end testing at the currentstimulus level, what level should it be changed to?, (3) Howshould we end the experiment?, and (4) How do we calculatethe estimated threshold? We answer these questions in thefollowing paragraphs.
We used the Wald rule to decide when to shift to a newlevel of stimulus14 (see Appendix A for more information).Once the decision to change to the next stimulus level ismade, depending on whether the stimulus intensity (stiffnessdifference) was too high or too low, we need to decide thestimulus intensity of the next level. For that purpose, wechange (increase or decrease) the previous stimulus level byone step. The size of the step, namely the increment or dec-rement of the stiffness difference, is determined by usingparameter estimation by sequential testing (PEST,14 see Ap-pendix B for more information). PEST rules generally usedecreasing steps. They allow quick recovery from obviouslyincorrect decisions. If a fixed step size were used, the recoveryfrom these incorrect decisions would take more time makingit even more difficult for the participant to concentrate on thetask due to frustration and tiredness.
The experimental sessions started off with the smalleststandard stiffness (0.25 N/mm) and continued in ascendingorder. The experimental sessions ended when the subjectexperienced seven reversals. A reversal is a step in the oppo-site direction from the previous step, for example, a stiffnessdecrease after a stiffness increase or vice versa. The average ofthe final four reversals determined the threshold or the just-noticeable difference for each subject. These just-noticeabledifferences were used to calculate the individual Weber frac-tions (W) of each subject for the four standard stiffness values
using the equation: W �JND
standard stiffness.15
The palpation velocity vectors and forces were recordeddirectly from the haptic device by using the predefined func-tions of the manufacturer’s OpenHaptics Toolkit. Data weregathered when the sphere-shaped cursor (Fig. 1) and thesurface of the virtual cylinders were in contact. The cursorcontacted the surface at a single point, and this contact wasfrictionless. The recorded force and velocity values were mul-tiplied and divided by four, respectively, to account for thelever arm action of the modified stylus (Fig. 2). The palpationspeed is the magnitude of the velocity vectors. For each trial,the data were separated into standard side (surface with stan-dard stiffness value) and comparison side (surface with com-
Figure 3. Experimental setup.
balt3/sih-sih/sih-sih/sih00410/sih0250-10z xppws S�1 6/18/10 8:08 4/Color Figure(s): F1,F3–11 Art: SIH200270 Input-us
4 Stiffness Discrimination Experiment Simulation in Healthcare

parison stiffness value), and the average of the values wascalculated. Average palpation speed and forces in this contextare the grand average of these values for all the trials in a singlesession.
Statistical AnalysisThe gender and haptic experience differences in Weber
fraction values were analyzed using a multivariate analysis ofvariance. The four dependent variables used were the fourWeber fraction values corresponding to the 0.25, 0.50, 1.00,and 1.25 N/mm standard stiffness values. Preliminary as-sumption testing was conducted to check for normality, lin-earity, univariate and multivariate outliers, homogeneity ofvariance-covariance matrices, and multicolinearity, with noserious violations noted. For post hoc analysis, paired t testswith the Bonferroni correction for repeated test were used.
The correlation between the average palpation speed andWeber fraction, and total time spent by the subjects for eachsession and their corresponding Weber fraction values wereanalyzed using the Pearson product-moment correlation co-efficient.
RESULTSWeber Fraction
The average Weber fractions for the four standard stiffnessvalues are shown in Figure 4. Four standard stiffness values(0.25, 0.50, 1.00, and 1.25 N/mm) were tested in four differ-ent sessions, and the average Weber fractions results were0.20, 0.27, 0.26, and 0.30, respectively.
An inspection of the average Weber fraction values formale and female subjects indicated that men had slightlyhigher Weber fraction values than women, but the differ-ences were not statistically significant (P � 0.05 for all stiff-ness levels tested). There were five haptically experienced andeight haptically inexperienced participants. The experiencedusers had slightly smaller average Weber fractions than theinexperienced ones except at the 0.25 N/mm standard stiff-ness value. These differences, however, were not statisticallysignificant (P � 0.05 for all stiffness levels tested).
Palpation ForceThe average palpation forces applied by the subjects on the
comparison and the standard stiffness sides for all sessionsare shown in Figure 5. Even though the palpation forces areclose to each other within each session, they increase as the
standard stiffness value increases. Repeated-measures analy-sis of variance revealed that when the average force exerted onthe comparison side was compared with the average forcesexerted on the standard side, there was no significant differ-ence in any of the sessions. There were significant differencesin the average force applied to standard and comparison sidesbetween all sessions (P � 0.05) except between the sessionswith 1.00 N/mm and 1.25 N/mm standard stiffness. As it canbe seen from Figure 5, the subjects monotonically increasedtheir average palpation force across the sessions as they pro-ceeded from the smallest of the four standard stiffness values(0.25 N/mm) to the largest (1.25 N/mm).
The average forces applied to the standard side by individ-ual subjects is shown in Figure 6. It is seen that the subjects ingeneral tend to increase their average forces across the ses-sions with increasing standard stiffness.
We also looked at whether users varied their palpationforce during each session by breaking all trials into four quar-tiles (Fig. 7) based on the time sequence of the trial: ie, thefirst 25% of trials performed in a session were grouped in thefirst quartile; the second 25% were grouped in the secondquartile, etc. Repeated-measures analysis of variance revealedthat there was no significant difference between the averageforce applied on standard and comparison sides in any quar-tile of any session. It also revealed that there was no signifi-cant difference in the average forces applied on standard orcomparison sides across the quartiles of all trials in any ses-sion.
Palpation SpeedThe average palpation speed of the subjects while probing
the comparison and standard stiffness sides are shown inFigure 8. We found that there was no significant differencebetween the average palpation speed of the subjects whileprobing the standard side and the comparison side.
There were positive correlations between the average pal-pation speed and average Weber fraction in sessions with 1.00and 1.25 N/mm standard stiffness values. This correlationsuggested that high Weber fraction (Table 1) is associatedwith high average palpation speed at these two standard stiff-ness values.
Figure 9 shows the subjects’ Weber fractions versus aver-age palpation speed (average of the palpation speed for alltrials, for both standard and comparison sides). Again, fromFigure 9, the subjects who have higher palpation speed mostlyhave higher Weber fraction values (R2 � 0.6512).
Figure 4. Weber fractions vs. standard stiffness values forall 13 subjects (mean � standard error).
Figure 5. Average palpation forces applied by subjects onthe standard and comparison fitness sides across four ses-sions (mean � standard error).
balt3/sih-sih/sih-sih/sih00410/sih0250-10z xppws S�1 6/18/10 8:08 4/Color Figure(s): F1,F3–11 Art: SIH200270 Input-us
Vol. 5, No. 4, Summer 2010 © 2010 Society for Simulation in Healthcare 5
AQ: C
F4
F5
F6
F7
F8
T1
AQ: D
F9,AQ:J

DISCUSSIONWeber Fraction
In this study, we measured the stiffness-detection Weberfractions of 13 subjects and analyzed the associated appliedforces and the palpation speed. Our average experimentalWeber fractions were 0.20, 0.27, 0.26, and 0.30, for the fourstandard stiffness values 0.25, 0.50, 1.00, and 1.25 N/mm,respectively. Lower Weber fraction indicates a higher sensi-tivity for stiffness difference discrimination.
Palpation ForceThe results indicated that, at each standard stiffness level,
the average of the forces applied by the subjects remainedstationary across all four quartiles of all trials. In Choi et al,16
it was shown that the stiffness of the surface played a signifi-cant role in determining the force level while they were de-tecting surface topography by haptically exploring two sur-faces with different stiffness values and same height.Similarly, we showed that the average palpation force appliedby the subjects remained constant within a session andmonotonically increased as the standard stiffness value in-creased across the sessions. These results prove our hypothe-sis, which predicted that the applied forces would increasewith stiffness. In our study, subjects were asked to discrimi-nate an existing stiffness difference between two virtualcomputer-generated surfaces, whereas in study by Choi et al,subjects were instructed to probe a surface for 15 seconds to
discriminate height of two surfaces (with no need of discrim-inating the stiffness).
Palpation SpeedWe found that palpation speed and Weber fractions are
positively correlated, ie, that higher speed is related to lowersensitivity to stiffness differences, in the sessions with 1.00and 1.25 N/mm standard stiffness. This finding raises thequestion: Is there a range of palpation speeds while exploringobjects with different stiffness values within which the usersare protected from the degrading sensitivity? We cannot an-swer this question with this study because it needs to beexplored further with a study in which velocity is the con-trolled independent variable. The question is whether higherpalpation speed results in lower sensitivity in stiffness dis-crimination and/or whether lower discriminatory sensitivityin a subject (related to other factors) results in a compensa-tory increase in his or her palpation speed (or whether botheffects can be present and interact). The answer to this ques-tion is important for virtual reality and real-life applications.For instance, there are two major palpation techniques thatare taught to osteopathic medical students to diagnose med-ical problems by touch. The first technique is to palpate abody part with slow finger motions to identify any somaticdysfunctions (Glossary of Osteopathic Terminology, 2006,defines a somatic dysfunction as: “Impaired or altered func-tion of related components of the somatic (body framework)
Figure 6. Average palpation forces appliedby individual subjects on the standard side.
Figure 7. Average palpation forces applied bysubjects on the standard and comparison stiff-ness sides in quarterly subsets of the total num-ber of trials (mean � standard error).
balt3/sih-sih/sih-sih/sih00410/sih0250-10z xppws S�1 6/18/10 8:08 4/Color Figure(s): F1,F3–11 Art: SIH200270 Input-us
6 Stiffness Discrimination Experiment Simulation in Healthcare

system: skeletal, arthrodial and myofascial structures, andtheir related vascular, lymphatic, and neural elements.”)(mostly tissue texture changes), whereas in the second, thefingers are used percussively. Both techniques use the tissuetexture to identify acute or chronic dysfunctions. In acutedysfunctions, tissue is edematous and collects fluids fromvessels and chemical reactions in the tissue. In chronic dys-functions, on the other hand, tissue can be doughy, stringy,and shows increased resistance. The percussion techniquerequires the utilization of higher palpation speeds, whencompared with slow motion. If, in fact, there is a speed limitof palpation for an individual after which the sensitivity todiscriminate stiffness decreases, then this outcome could beused in training of medical students in terms of choosing thebest technique of learning and teaching palpation.
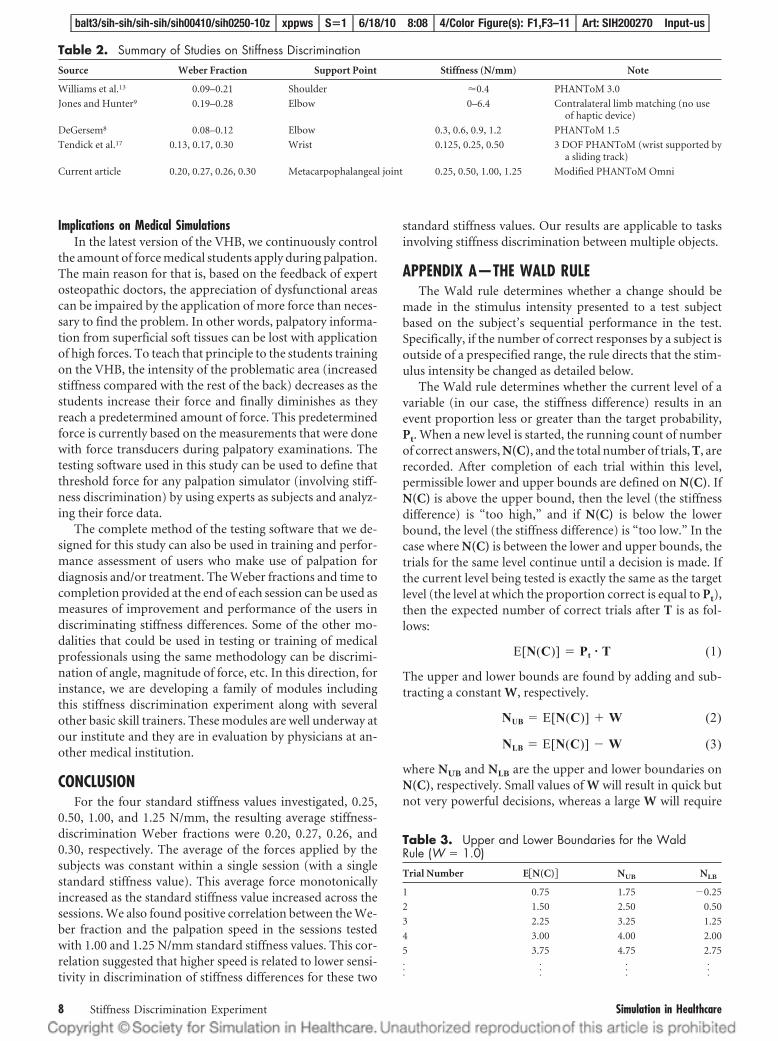
Previous ResearchTable 2 presents our findings (Weber fractions) in com-
parison with the results of previous stiffness discriminationstudies. Our results (average Weber fractions: 0.20, 0.27) arecomparable with the results of Tendick et al17 (average Weberfractions: 0.17, 0.30) for the same nominal stiffness values(0.25, 0.50 N/mm) because the wrist support point is closer tothe metacarpophalangeal joint than the elbow or the shoul-der. The resolution of these two joints was also found to bethe same in a study by Clark et al.18 In their article, the authorspresented a method to assess the exactness of position sens-ing, the target resolution method. This method estimates themaximum number of targets that can be resolved with noerrors within a specified range. Their data indicate that the
target resolution increases as the joint considered becomesmore proximal and the metacarpophalangeal and the wristjoint have the same target resolution. DeGersem8 foundlower Weber fractions than this study for a similar standardstiffness value range, indicating that humans are more sensi-tive at discriminating stiffnesses when the elbow is the sup-port point. It is important to consider the variability in thehardware used for all the aforementioned studies. There isnot a study, to the authors’ knowledge, that uses the samehaptic device, range of standard stiffness values, or method toprove that the amount of proprioceptive feedback and/or thenumber of joints involved during palpation are significantlyimportant to the stiffness discrimination task.
One concern of this experiment was the possibility of thesubjects getting frustrated because each session took between5 and 35 minutes, depending on their performance through-out that specific session. In psychophysical experiments, ex-cessive completion time can negatively affect the perfor-mance of the subject. Therefore, it decreases the convergencerate of the algorithm used to estimate the threshold becausethe subjects can easily get frustrated by repetitively perform-ing the same task. A few subjects did report some level offatigue and frustration but mentioned that it did not obstructtheir ability to discriminate the stiffness differences betweenthe two virtual objects during the experiment. Supporting theirsubjective feedback, we found that the time they spent for eachsession was not positively correlated with the Weber fractionscalculated for each subject for any of the four sessions (P�0.05).This suggested that fatigue did not play a role as to degrading thediscrimination performance of the subjects during any of thesessions.
Figure 9. ●●●.
Table 1. Correlation Between the Average Palpation Speed and the Average Weber FractionsWeber Fraction
Session 1(0.25 N/mm)*
Session 2(0.50 N/mm)*
Session 3(1.00 N/mm)*
Session 4(1.25 N/mm)*
Average palpation speed on the standard side
Pearson correlation 0.342 0.514 0.596 0.649
P (two tailed) 0.253 0.073 0.032† 0.016†
Average palpation speed on the comparison side
Pearson correlation 0.317 0.515 0.651 0.628
P (two tailed) 0.291 0.072 0.016† 0.021†
Average of palpation speed
Pearson correlation 0.330 0.515 0.627 0.640
P (two tailed) 0.271 0.072 0.022† 0.018†
*The standard stiffness value in that session.
†Statistical significance, P � 0.05.
Figure 8. Average palpation speed by subjects on the stan-dard and comparison stiffness sides across four sessions(mean � standard error).
balt3/sih-sih/sih-sih/sih00410/sih0250-10z xppws S�1 6/18/10 8:08 4/Color Figure(s): F1,F3–11 Art: SIH200270 Input-us
Vol. 5, No. 4, Summer 2010 © 2010 Society for Simulation in Healthcare 7
AQ: E
T2
Implications on Medical SimulationsIn the latest version of the VHB, we continuously control
the amount of force medical students apply during palpation.The main reason for that is, based on the feedback of expertosteopathic doctors, the appreciation of dysfunctional areascan be impaired by the application of more force than neces-sary to find the problem. In other words, palpatory informa-tion from superficial soft tissues can be lost with applicationof high forces. To teach that principle to the students trainingon the VHB, the intensity of the problematic area (increasedstiffness compared with the rest of the back) decreases as thestudents increase their force and finally diminishes as theyreach a predetermined amount of force. This predeterminedforce is currently based on the measurements that were donewith force transducers during palpatory examinations. Thetesting software used in this study can be used to define thatthreshold force for any palpation simulator (involving stiff-ness discrimination) by using experts as subjects and analyz-ing their force data.
The complete method of the testing software that we de-signed for this study can also be used in training and perfor-mance assessment of users who make use of palpation fordiagnosis and/or treatment. The Weber fractions and time tocompletion provided at the end of each session can be used asmeasures of improvement and performance of the users indiscriminating stiffness differences. Some of the other mo-dalities that could be used in testing or training of medicalprofessionals using the same methodology can be discrimi-nation of angle, magnitude of force, etc. In this direction, forinstance, we are developing a family of modules includingthis stiffness discrimination experiment along with severalother basic skill trainers. These modules are well underway atour institute and they are in evaluation by physicians at an-other medical institution.
CONCLUSIONFor the four standard stiffness values investigated, 0.25,
0.50, 1.00, and 1.25 N/mm, the resulting average stiffness-discrimination Weber fractions were 0.20, 0.27, 0.26, and0.30, respectively. The average of the forces applied by thesubjects was constant within a single session (with a singlestandard stiffness value). This average force monotonicallyincreased as the standard stiffness value increased across thesessions. We also found positive correlation between the We-ber fraction and the palpation speed in the sessions testedwith 1.00 and 1.25 N/mm standard stiffness values. This cor-relation suggested that higher speed is related to lower sensi-tivity in discrimination of stiffness differences for these two
standard stiffness values. Our results are applicable to tasksinvolving stiffness discrimination between multiple objects.
APPENDIX A—THE WALD RULEThe Wald rule determines whether a change should be
made in the stimulus intensity presented to a test subjectbased on the subject’s sequential performance in the test.Specifically, if the number of correct responses by a subject isoutside of a prespecified range, the rule directs that the stim-ulus intensity be changed as detailed below.
The Wald rule determines whether the current level of avariable (in our case, the stiffness difference) results in anevent proportion less or greater than the target probability,Pt. When a new level is started, the running count of numberof correct answers, N(C), and the total number of trials, T, arerecorded. After completion of each trial within this level,permissible lower and upper bounds are defined on N(C). IfN(C) is above the upper bound, then the level (the stiffnessdifference) is “too high,” and if N(C) is below the lowerbound, the level (the stiffness difference) is “too low.” In thecase where N(C) is between the lower and upper bounds, thetrials for the same level continue until a decision is made. Ifthe current level being tested is exactly the same as the targetlevel (the level at which the proportion correct is equal to Pt),then the expected number of correct trials after T is as fol-lows:
E[N(C)] � Pt � T (1)
The upper and lower bounds are found by adding and sub-tracting a constant W, respectively.
NUB � E[N(C)] � W (2)
NLB � E[N(C)] � W (3)
where NUB and NLB are the upper and lower boundaries onN(C), respectively. Small values of W will result in quick butnot very powerful decisions, whereas a large W will require
Table 3. Upper and Lower Boundaries for the WaldRule (W � 1.0)Trial Number E�N(C)� NUB NLB
1 0.75 1.75 �0.25
2 1.50 2.50 0.50
3 2.25 3.25 1.25
4 3.00 4.00 2.00
5 3.75 4.75 2.75
······
······
Table 2. Summary of Studies on Stiffness DiscriminationSource Weber Fraction Support Point Stiffness (N/mm) Note
Williams et al.13 0.09–0.21 Shoulder 0.4 PHANToM 3.0
Jones and Hunter9 0.19–0.28 Elbow 0–6.4 Contralateral limb matching (no useof haptic device)
DeGersem8 0.08–0.12 Elbow 0.3, 0.6, 0.9, 1.2 PHANToM 1.5
Tendick et al.17 0.13, 0.17, 0.30 Wrist 0.125, 0.25, 0.50 3 DOF PHANToM (wrist supported bya sliding track)
Current article 0.20, 0.27, 0.26, 0.30 Metacarpophalangeal joint 0.25, 0.50, 1.00, 1.25 Modified PHANToM Omni
balt3/sih-sih/sih-sih/sih00410/sih0250-10z xppws S�1 6/18/10 8:08 4/Color Figure(s): F1,F3–11 Art: SIH200270 Input-us
8 Stiffness Discrimination Experiment Simulation in Healthcare

more trials but result in relatively more powerful decisions,ie, for larger values of W, the number of trials it takes to makea decision will increase, but the decision will be more accuratein terms of estimating whether the current level of stiffnessdifference is in fact too high or too low.
In this study, we defined the target probability Pt as 0.75,halfway between chance for a two-alternative trial (0.5) andcertainty (1.0), and W as 1.0. Table 3 shows a sample (firstfive trials only) calculation of the upper and lower boundariesto make a decision with the chosen W value. According to thetable, two consecutive incorrect answers at the beginning of anew level will be below the lower boundary (N(C) �0.0 �N
LB� 0.50), and the decision will be that the level (stim-
ulus intensity) is “too low.” On the other hand, four consec-utive correct answers will reach the upper boundary (N(C) �4.0 �NLB � 4.0) and the decision will be that the level is “toohigh.”
According to the Wald rule, the actual number of trialsneeded to make a decision varies depending on the perfor-mance. Figure 10 illustrates the Wald rule used in this studyby plotting the number of correct responses against the totalnumber of trials at a single level for a series of trials.
In Figure 10, if the subject performance at the current levelis above the upper limit (Target �1), then it is said that thislevel of stimulus intensity, in our case the stiffness difference,is “too high.” On the other hand, if the performance dropsbelow the lower limit (Target �1), the stimulus intensity isdecided to be “too low.” A decision to change the stiffnessdifference is not made as long as the subject’s performancelies in the area encompassed by these two limits. Once thedecision is made, the stimulus intensity is changed in a par-ticular direction (increase or decrease) by using the step sizeas determined by the PEST rules (Appendix B).
APPENDIX B—PEST RULESIn this study, we wanted to determine the minimum stiff-
ness difference that can be discriminated by individuals. Weused the PEST,14 which is an adaptive procedure for rapidand efficient psychophysical testing.19 In adaptive methods,such as the PEST, the level (intensity of the stimulus) to betested at any given trial is determined by a portion of the
history of the run. These methods aim to make measure-ments at levels near the target level (the minimum stiffnessdifference discriminated by an individual). After each trial,the current level is tested with the Wald rule (Appendix A) tochange the stimulus level in a particular direction (increase ordecrease). The next stimulus level is adjusted by increment-ing or decrementing by a step size. The methods that use fixedstep sizes take a long time to recover from possible incorrectdecisions. The PEST, however, uses variable step sizes to ad-dress this problem. The PEST rules generally use decreasingstep sizes but use increasing ones to rapidly recover from anincorrect decision. The PEST rules are basically designed toadjust the step size. These rules are12 as follows:
1. If two blocks of trials at different levels resulted in op-posite answers, then the target level is most probablybetween these two levels. Therefore, after each reversal(a reversal is a step in the opposite direction from theprevious step, for example, a stiffness decrease follow-ing a stiffness increase or vice versa.) the step size ishalved ([1] in Fig. 11), until:
2. The step size remains the same for two consecutivechanges in the same direction ([2]). However, if theWald rule gives the same result several times in a row,then the step size is increased more to shift toward thetarget level rapidly. Therefore, the step size is doubledwhen the third change is in the same direction as theprevious 2 ([2.a]). An exception occurs when a reversalhappens right after doubling the step size. The step sizewill then double when there are three consecutivechanges in the same direction instead of 2 ([2.b]).
3. The step size remains the same when it reaches a pre-specified minimum value ([3]).
ACKNOWLEDGMENTSThe authors thank David Noyes, PhD, for building the
Omni™ haptic interface modified stylus for this study. They alsothank Joseph Samosky, PhD, University of Pittsburgh, Pitts-burgh, PA, for his suggestions and comments, which enhancedthe quality of this paper during the review process.
REFERENCES1. Howell JN, Williams RL II, Conatser RR Jr, Burns JM, Eland DC.
Training for palpatory diagnosis on the virtual haptic back:performance improvement and user evaluations. J Am OsteopathicAssoc 2008;108:29 –36.
Figure 10. Trials correct vs. total trials (adapted from Mac-millan and Creelman, 1991).
Figure 11. Demonstration of the PEST rules (actual subjectdata, reversals are shown with an asterisk).
balt3/sih-sih/sih-sih/sih00410/sih0250-10z xppws S�1 6/18/10 8:08 4/Color Figure(s): F1,F3–11 Art: SIH200270 Input-us
Vol. 5, No. 4, Summer 2010 © 2010 Society for Simulation in Healthcare 9
T3
F10
F11,AQ:F

2. Howell JN, Williams RL II, Conatser RR Jr, Burns JM, Eland DC. TheVirtual Haptic Back (VHB): Detection of Compliance Differences. Paper#06DHM-27, SAE Digital Human Modeling Conference, Lyon,France; July 4 – 6, 2006.
3. Howell JN, Williams RL II, Conatser RR Jr, Burns JM, Eland DC. TheVirtual Haptic Back (VHB): A Virtual Reality Simulation of the HumanBack for Palpatory Diagnostic Training. Paper #05DHM-63, SAE DigitalHuman Modeling Conference, Iowa City, IA; June 14–16, 2005.
4. Pugh CM, Heinrichs WL, Dev P, Srivastava S, Krummel TM. Use of amechanical simulator to assess pelvic examination skills. JAMA 2001;286:1021–1023.
5. Pugh CM, Youngblood P. Development and validation of assessmentmeasures for a newly developed physical examination simulator. J AmMed Inform Assoc 2002;9:448 – 460.
6. Baillie S, Crossan A, Brewster S, Mellor D, Reid S. Validation of abovine rectal palpation simulator for training veterinary students. StudHealth Technol Inform 2005;111:33–36.
7. Parkes R, Forrest N, Baillie S. A mixed reality simulator for felineabdominal palpation training in veterinary medicine. Stud HealthTechnol Inform 2009;142:244 –246.
8. DeGersem G. Kinesthetic Feedback and Enhanced Sensitivity in RoboticEndoscopic Telesurgery. Ph.D. Thesis, Katholieke Universiteit Leuven,Belgium; 2005.
9. Jones LA, Hunter IW. A perceptual analysis of stiffness. Exp Brain Res1990;79:150 –156.
10. Tan HZ, Durlach NI, Beauregard GL, Srinivasan MA. Manual
discrimination of compliance using active pinch grasp: the roles offorce and work cues. Percept Psychophys 1995;57:495–510.
11. Srinivasan MA, LaMotte RH. Tactual discrimination of softness.J Neurophysiol 1995;73:88 –101.
12. Srinivasan MA, Beauregard GL, Brock DL. The impact of visualinformation on the haptic perception of stiffness in virtual environments.Proc ASME Dyn Syst Control Division 1996;58:555–559.
13. Williams RL II, Howell JN, Conatser RR Jr, Burns JM, Eland DC.Palpatory Training on the Virtual Haptic Back Improves Detection ofCompliance Difference. Eurohaptics, Paris, France; 2006.
14. Macmillan NA, Creelman CD. Detection Theory: A User’s Guide.Cambridge: Cambridge University Press; 1991.
15. Gescheider GA. Psychophysics: the Fundamentals. 3rd ed. LawrenceErlbaum Associates, Mahwah, NJ; 1997:3.
16. Choi S, Walker L, Tan HZ, Crittenden S, Reifenberger R. Forceconstancy and its effect on haptic perception of virtual surfaces. ACMTrans Appl Percept 2005;2:89 –105.
17. Tendick F, Cavusoglu MC, Dhruv N, Sherman A. Maximizing theSensation of Compliance in Teleoperative Surgery. Proceedings of theEighth International Symposium on Robotics With Applications,Maui, HI; June 11–16, 2000.
18. Clark FJ, Larwood KJ, Davis ME, Deffenbacher KA. A metric for assessingacuity in positioning joints and limbs. Exp Brain Res 1995;107:73–79.
19. Taylor MM, Creelman CD. PEST: Efficient estimates on probabilityfunctions. J Acoust Soc Am 1967;41:782–787.
balt3/sih-sih/sih-sih/sih00410/sih0250-10z xppws S�1 6/18/10 8:08 4/Color Figure(s): F1,F3–11 Art: SIH200270 Input-us
10 Stiffness Discrimination Experiment Simulation in Healthcare
AQ: G
AQ: H