Embed Size (px)
Citation preview
A SHORT NOTE ON PERMEABILITY ANISOTROPYIN HETEROGENEOUS POROUS MEDIA
by
Xiaomin Zhao and M. Nafi Toksoz
Earth Resources LaboratoryDepartment of Earth, Atmospheric, and Planetary Sciences
Massachusetts Institute of TechnologyCambridge, MA 02139
ABSTRACT
This paper presents some new results of theoretical modeling on permeability anisotropyin heterogeneous porous media. It is shown that the lineation of heterogeneities results·in permeability anisotropy. However, to produce strong anisotropy, the permeabilitycontrast between the lineated high permeability region and the background must bevery high. We demonstrate this using two examples. The first is the fracture modelin which the background has negligible permeability compared to the fractures. In thesecond example the fractures are replaced by impermeable stripes and the backgroundhas high permeability. In both cases permeability anisotropy with an order of magnitude difference is produced. These results compare well with the results of laboratoryexperiments performed to evaluate permeability anisotropy.
INTRODUCTION
Permeability anisotropy is of interest in the study of fluid flow in reservoirs. Recentstudies have emerged in this research area (Gibson and Toksoz, 1990; Bernabe, 1991;Zhao and Toksoz, 1991). These studies demonstrated that the condition for producingstrong permeability anisotropy is that the permeability contrast between the lineatedpermeable region and the less permeable region should be large, as in the lineatedfracture case (Zhao and Toksoz, 1991). In this study, we show that strong anisotropycan also result from the case where the medium contains some impermeable layerssandwiched between permeable regions. The modeling techniques were described inZhao and Toksoz (1991). A Successive Over-Relaxation (SOR) finite-difference schemewas used to simulate the fluid flow field, and the lineated Gaussian correlation functionwas used to produce the lineated heterogeneities.
Bernabe (1991) performed a set of permeability measurements on synthetic anisotropic
180 Zhao and Toksoz
samples. These results provide experimental evidence of permeability anisotropy. Twosets of experimental results are of particular interest to this study. In one case permeablelayers are sandwiched between less-permeable porous plates. But the permeability contrast between the two types of regions is not very large. In the second case, thin layerswith very low permeability are sandwiched between the permeable layers and the porousplates. The two data sets will be modeled using the finite-difference algorithm. Thedata sets, coupled with theoretical results, demonstrate that the permeability contrastis the key factor controlling the degree of anisotropy.
MODELING EXAMPLES
(1) Lineated Heterogeneities (Low Permeability Contrast)
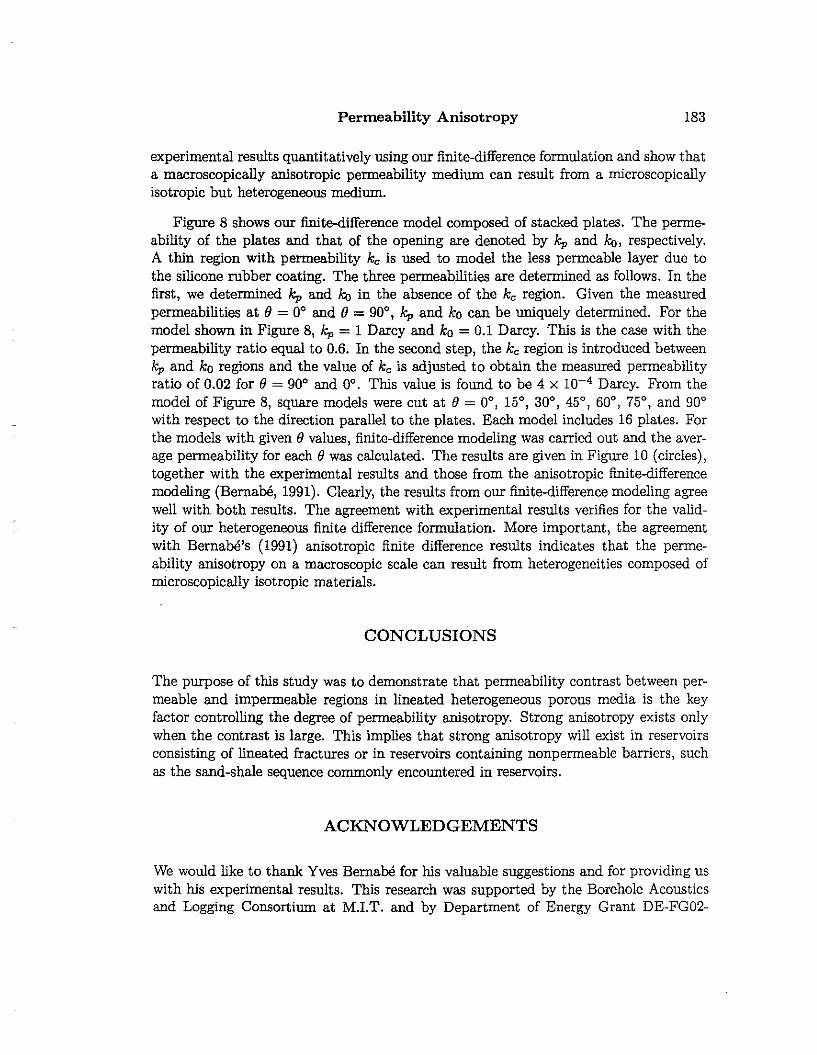
The effects of lineated heterogeneities have been studied by Zhao and Toksoz (1991).Here we present the results of the theoretical modeling in order to explain the experimental results of Bernabe (1991), which will be described later. The heterogeneousdistributions are generated using different correlation lengths in the Gaussian correlation function (al = 20 and a2 = 2, respectively, see Zhao and Toksoz, 1991). The flowfields have been calculated for various () values between 0° and 90°. As an example, thealigned medium and the simulated flow field at () = 45° are given in Figure 1. Becauseof the lineation of permeability heterogeneities, the flow tends to channel through highpermeability regions. This is shown clearly in Figure 1b, where the lineation of high andlow permeability strips makes the flow field have a trend to deflect toward the lineationof high permeability regions. Figure 2 shows the calculated average flow versus (). Thepermeability is the maximum along () = 0°, and becomes minimum along () = 90°; theanisotropy (defined as (ko - kgo)/«ko + k90)/2)) for this case is about 10%. By varyingthe correlation lengths al and a2, the degree of anisotropy does not significantly exceedthis value due to the random medium model used here. In this model, a region withmoderate and low permeabilities is sandwiched between two adjacent high permeability regions. Therefore flow can always cross the less permeable region without havingto flow around the region. Thus due to the presence of background permeability, thelineation of random heterogeneities cannot result in anisotropic permeabilities that arean order of magnitude difference. In order to produce a strong permeability anisotropy,the permeability contrast between the permeable stripes and the background must behigh. This will be the case of fractures studied in the following section.
(2) Fracture Model I (Permeable Channels - Impermeable Background)
Since fractures can contribute significantly to the reservoir permeability, it is importantto model the effects of fracture permeability. As shown by Gibson and Toksoz (1990),

Permeability Anisotropy 181
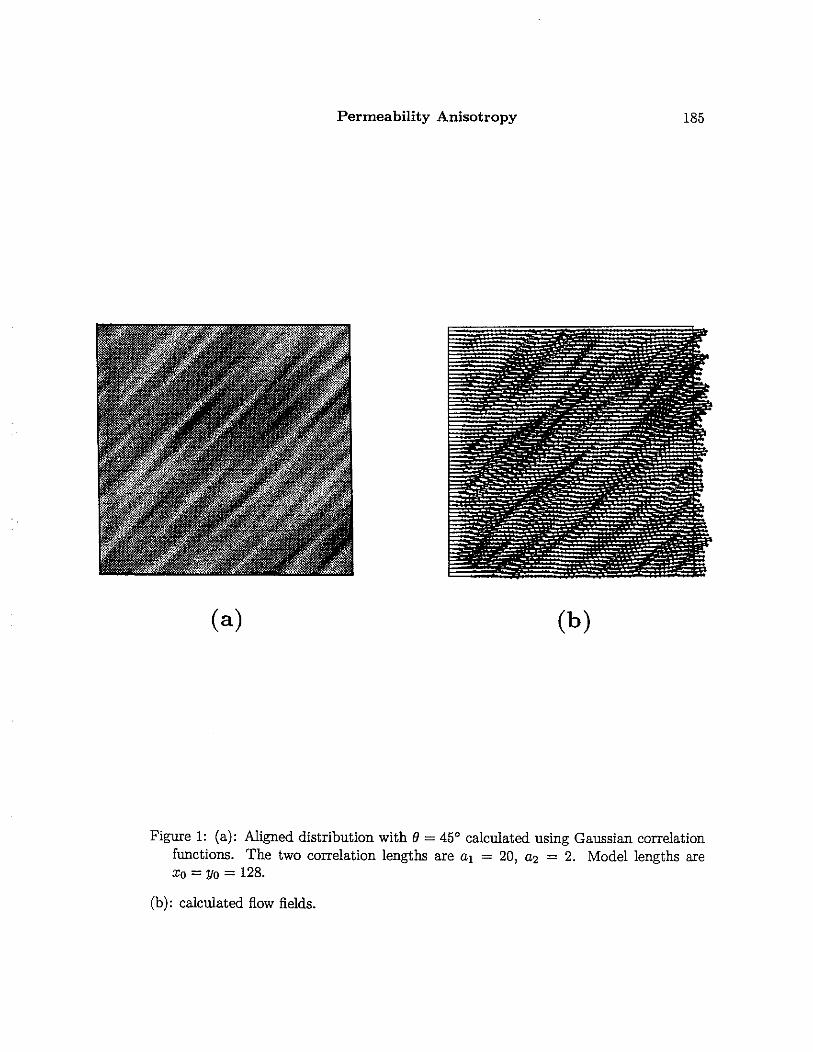
a primary effect of fracture is anisotropy in permeability. Because of the alignment offractures, the permeability can vary with orientation by orders of magnitude. The majorfeatures of fracture fluld flow are that the background has negligible permeability andthat the flow is highly concentrated along the fractures. This situation can be modeledusing the random medium model as follows. We choose the aspect ratio, aJ/a2 »1,so that the heterogeneities are highly lineated. In order to remove the background permeability, we set a threshold, say, 60% of the maximum [a(x, V)]. The values of a(x, y)that are smaller than this threshold are set to a very small number; values greater thanthe threshold are kept unchanged. Figures 3a and 3c show the a(x, y) distributions thatresemble a natural fracture network. The permeability contrast between the fractureand the background is 600:1. Although the background permeability may still be largecompared to typical fractured rocks (granite, limestone, etc.), the highly conductivechannels (fractures) conduct most of the flow so that the background flow is small. Inthis way the flow in the fracture network is simulated. The calculated flow field alongand perpendicular to the fracture alignment is shown in Figures 3b and 3d. The flowpatterns for the two orientations are qulte different. As expected, the flow is highlychanneled along the fractures. For the B = 900 case (Figure 3d) the flow has to windaround the junctions of the fractures, while in the B= 0° case flow takes place along thestraight channel. These result in signlficant permeability difference for the two cases.We have performed the calculation for various orientations. Figure 4 shows the calculated average flow as a function of the orientation B. In this figure, the permeabilityis maximum along fractures and minimum perpendicular to them, the same as in theprevious case of aligned heterogeneities. However, the permeability difference betweenB= 0° and B= 90° is 184% in the present case.
(3) Fracture Model II (Impermeable Barriers - Permeable Background)
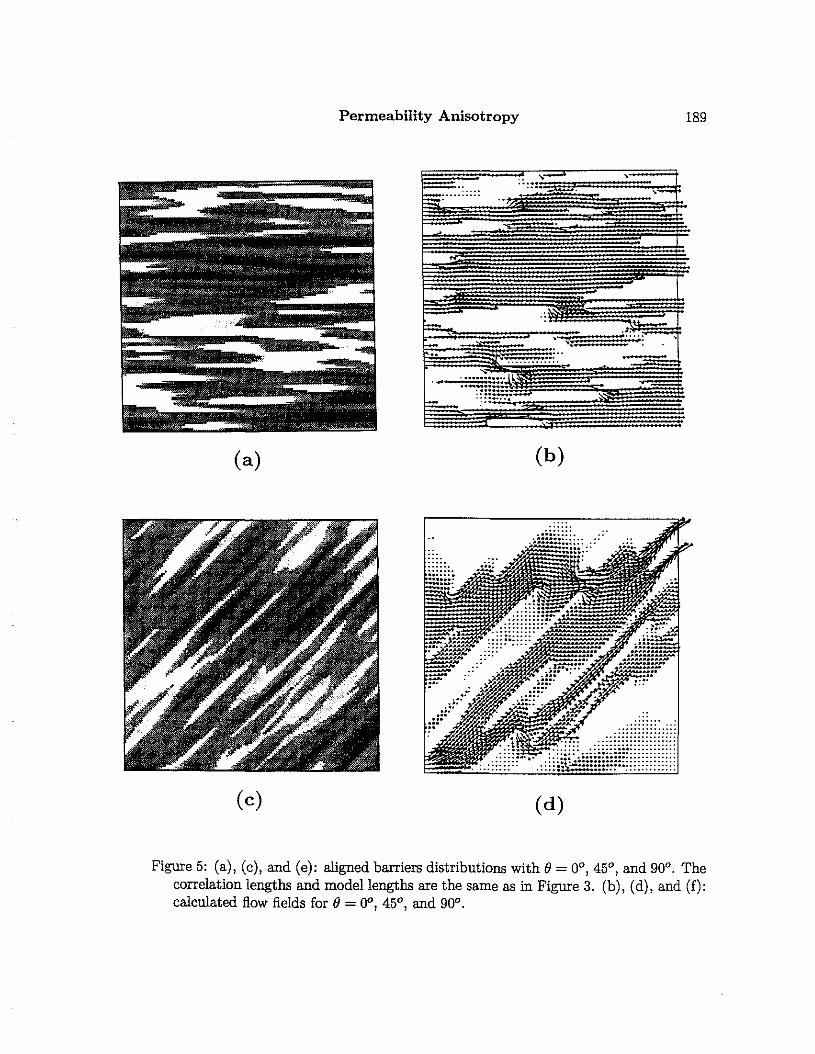
The above fracture model shows that strong permeability anisotropy exists in lineatedheterogeneous porous media only when the permeability contrast between the permeable channels (fractures) and the less permeable background is large. It is interestingto study the case where the background becomes permeable while the flow channels(fractures) are sealed (impermeable). This model can be generated from the previouslineated heterogeneity model, in the same way as the above fracture model. We seta threshold, say, 40% of the maximum permeability value of the model. The regionswhose permeability is less than this threshold is assigned to a very small value (about1/600 of the maximum permeability). Figures Sa, c, and e show heterogeneity modelsfor the angle of lineation B = 00
, 450, and 900 cases, together with the simulated flow
field, Figures 5b, d, f. Because of the no-flow barriers in the heterogeneous distribution,the flow has to wind around these barriers. For the B = 00 case, the flow takes placealong the lineation of the barriers, while for the B= 900 case, the flow has to penetratethe junctions between the barriers and the flow paths are longer than in the B= 00 case.

182 Zhao and Toksoz
Therefore, flow fields along and perpendicular to the channels are very different. Thisresults in significant permeability anisotropy. Fignre 6 shows the calculated average flowas a function of the angle of lineation e. The permeability difference between e = 00
and e= 900 is about 175%, almost the same order as the previous fracture model.
COMPARISON WITH EXPERIMENTAL DATA MEASUREDFROM MATERIALS WITH ANISOTROPIC PERMEABILITY
In a recently published paper Bernabe (1991) showed the experimental results of permeability measurements on anisotropic materials. These experiments were performed toevaluate the validity of the tensor form of Darcy's law in anisotropic porous media. Inthat study a 2-D finite-difference simulation using the anisotropic tensor form Darcy'slaw was also performed. Excellent agreement was found between the numerical analysisand the experiment. The experimental results provide a test of the present numericalanalysis of heterogeneous media.
The experiments were performed on anisotropic porous medium samples made froma stack of identical flat porous plates. In the sample, the space between two adjacentplates was deliberately left open. It was hoped that these openings would act as highpermeability channels, analogous to fractures. However, it turned out that the ratio ofpermeabilities measured perpendicular and parallel to the plates was ouly about 0.6, thematerial obtained being only moderately anisotropic. In fact, these experimental resultsare quite consistent with our modeling results for the aligned permeability distribution(Figure 1), which shows that the lineation of high permeability channels (analogous tothe openings between the plates) surrounded by a less permeable background (analogousto the synthetic porous plates) cannot result in significant permeability anisotropy.
As described in Bernabe's (1991) paper, in order to provide a highly anisotropicpermeability model, a large percentage of the top surface of each plate was coatedwith a thin layer of impermeable silicone rubber so that the flow perpendicular to theplates was largely reduced. This time a permeability ratio of 0.02 for e = 0° and90° was obtained. To determine the variation of permeability measured along differentdirections, the synthetic materials of both cases (i.e., permeability ratios of 0.6 and of0.02) were cut at 0°, 15°, 30°, and 45° with respect to the direction parallel to theplates. Permeabilities along these directions were measured, with other sides of the(cubic) sample that are parallel to the measurement direction sealed with a jacket (noflow boundaries). The experimental results are replotted here in Fignre 7 (crosses). Theanisotropic finite-difference modeling results of Bernabe (1991) are also represented inthe same fignre (triangles). It is seen that strong permeability anisotropy is producedby the impermeable layer, with the ratio of permeabilities measured perpendicular andparallel to the plates being 0.02. This result is also consistent with the modeling resultsfor the permeable background with impermeable barriers (Fignre 6). We model the
Permeability Anisotropy 183
experimental results quantitatively using our finite-difference formulation and show thata macroscopically anisotropic permeability medium can result from a microscopicallyisotropic but heterogeneous medium.
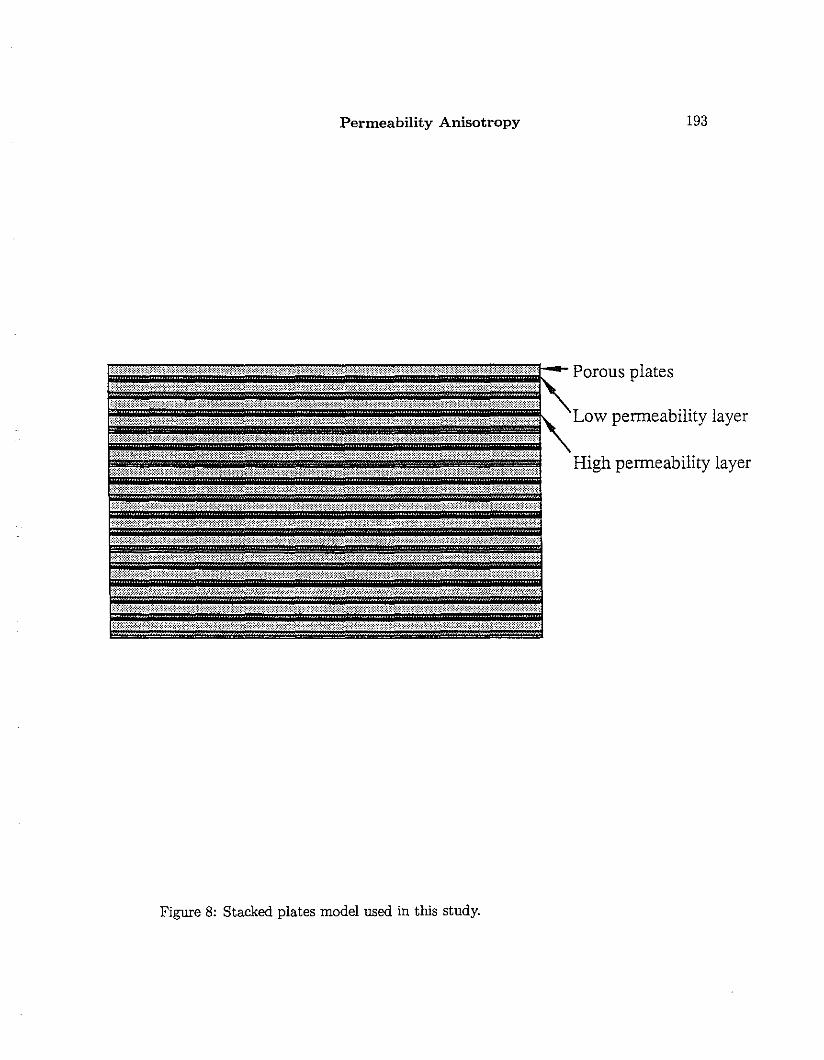
Figure 8 shows our finite-difference model composed of stacked plates. The permeability of the plates and that of the opening are denoted by kp and ko, respectively.A thin region with permeability kc is used to model the less permeable layer due tothe silicone rubber coating. The three permeabilities are determined as follows. In thefirst, we determined kp and ko in the absence of the kc region. Given the measuredpermeabilities at 0 = 0° and 0 = 90°, kp and ko can be uniquely determined. For themodel shown in Figure 8, kp = 1 Darcy and ko = 0.1 Darcy. This is the case with thepermeability ratio equal to 0.6. In the second step, the kc region is introduced betweenkp and ko regions and the value of kc is adjusted to obtaln the measured permeabilityratio of 0.02 for 0 = 90° and 0°. This value is found to be 4 x 10⁻⁴ Darcy. From themodel of Figure 8, square models were cut at 0 = 0°,15°,30°,45°,60°, 75°, and 90°with respect to the direction parallel to the plates. Each model includes 16 plates. Forthe models with given 0 values, finite-difference modeling was carried out and the average permeability for each 0 was calculated. The results are given in Figure 10 (circles),together with the experimental results and those from the anisotropic finite-differencemodeling (Bernabe, 1991). Clearly, the results from our finite-difference modeling agreewell with both results. The agreement with experimental results verifies for the validity of our heterogeneous finite difference formulation. More important, the agreementwith Bernabe's (1991) anisotropic finite difference results indicates that the permeability anisotropy on a macroscopic scale can result from heterogeneities composed ofmicroscopically isotropic materials.
CONCLUSIONS
The purpose of this study was to demonstrate that permeability contrast between permeable and impermeable regions in lineated heterogeneous porous media is the keyfactor controlling the degree of permeability anisotropy. Strong anisotropy exists onlywhen the contrast is large. This implies that strong anisotropy will exist in reservoirsconsisting of lineated fractures or in reservoirs containing nonpermeable barriers, suchas the sand-shale sequence commonly encountered in reservoirs.
ACKNOWLEDGEMENTS
We would like to thank Yves Bernabe for his valuable suggestions and for providing uswith his experimental results. This research was supported by the Borehole Acousticsand Logging Consortium at M.LT. and by Department of Energy Grant DE-FG02-

184
86ER13636.
Zhao and Toksoz
REFERENCES
Bernabe, Y.,1991, On the measurement of permeability in anisotropic rocks. Fault Mechanism and Transport Properties of Rocks: A Festchrijt in Honor of W. F. Brace, B.Evans and T. F. Wong (eds), Academic Press, London, in press.
Gibson, R.L., Jr. and M.N. ToksOz, 1990, Permeability estimation from velocity anisotropyin fractured rock, J. Geophys. Res., 95, 15643--15655.
Zhao, X.M. and M.N. ToksOz, 1991, Permeability anisotropy in heterogeneous porousmedia, SEG Abstracts, D/P1. 7,387-390.
(
(
Permeability Anisotropy 185
(a) (b)
Figure 1: (a): Aligned distribution with e= 45° calculated using Gaussian correlationfunctions. The two correlation lengths are al = 20, a2 = 2. Model lengths areXo = Yo = 128.
(b): calculated fiow fields.

186 Zhao and Toksoz
1.45x 1,,-7~
-1.4 - ,-
-1:-_
Isotropic Gaussian1.35
- ...- ---- -
~ - - .....=
- --'-' ../~---Q" 1.3 -
I- ........... ..... ... .....~ -.....
1.25 - Aligned Gaussian.....
~~I-
1.2~
I I I I I I I I
0 10 20 30 40 50 60 70 80 90e(o)
(
Figure 2: Average flow q versus angle of alignment for the cases of aligned distributions.The case of isotropic Gaussian (a = 20) is also plotted for comparison (solid line).Although permeability anisotropy is present, its magnitude is oniy about 10%.

Permeability Anisotropy 187
....::..-
...............• •••••••• u •••••
. .......
............................................................ .---=_:::::~~g~g~~~~~~;~~~~;~;~~~~~~
....:.\:--=:::::::: ..
:::::::::~
(a) (b)
(c) (d)
Figure 3: (a) and (c): Aligned fracture distributions with () = 0° (a) and 90° (c). Thecorrelation lengths and model lengths are the same as in Figure 4. (b) and (d):calculated flow for () = OO(b) and 90° (d).
188 Zhao and Toksoz
2.5 xl 0-,7,.. --.
, ,, , , ,,,,lil,,,,,,,,,,,.,
, , , , , , ,'..
.... - ... - ---- ... ------
2
1.5
1
0.5
o
---·--·-------·
oI
10I
20I
30I
40I
50I
60I
70I
80 90
8(0)
Figure 4: Average flow q vs. () for the case of Figure 6. In the case of aligned fractures,Ii can have an order of magnitude difference between () = 0° and () = 90°, resultingin significant anisotropy (about 184%).
Permeability Anisotropy 189
(a) (b)
..............••..•................................................ .::::::;~::::::: ::::::
. :.: :~j ~ i~;~"" .: d~li~;;H;~gnn~~~ H~jj ~
(e) (d)
Figure 5: (a), (c), and (e): aligned barriers distributions with e= 0°,45°, and 90°. Thecorrelation lengths and model lengths are the same as in Figure 3. (b), (d), and (f):calculated flow fields for e= 00,45°, and 90°.

190 Zhao and Toksoz
(e)
scale
(f)
(
Figure 5: continued.
Ml 6

Permeability Anisotropy
10 x1v·8 .......... .
. ...."
8,
- , ... ,"6 - ,- - ,
~ - ,E .'-C" 4 - ,
" 'lit..2 - " ...... •.......- .... ---0 I I I I I I I I
0 10 20 30 40 50 60 70 80 90
eO
191
Figure 6: Average flow ij vs. 0 for the case of Figure 5. The permeability anisotropy inthis case is about 175%.

192 Zhao and Toksoz
100 -=: + +- !~ ® ®>- (~(,) ·
J...~ 10 ~~C- :
>- ·-.-- ·.-~.c
~ 1 -: xQ)
E 6J... · X
~Q)
a. x~~· x
0.1 I ,I
,I
,I
0 15 30 45 60 75 90
Angle (Degree) l
Figure 7: Theoretical (triangles and circles) and experimental (crosses + and x) resultsfor the two synthetic materials (k90/ko = 0.6 and koo/ko = 0.02). Triangles are theanisotropic finite difference modeling results obtained by Bernabe (1991). Circlesare the finite difference modeling results of this study.
Permeability Anisotropy
Figure 8: Stacked plates model used in this study.
193
Low permeability layer
High permeability layer

194 Zhao and Toksoz
(


![Development of permeability anisotropy of antigorite ... shortening [mm] 0.7 0.9 1.1 1.3 Gouge thickness [mm] 1.5 0.7 0.9 1.1 1.5 Permeability [m 2] Gouge thickness ... shear)deforma&on)](https://img.dokumen.tips/doc/110x75/5b01a05b7f8b9a65618dea29/development-of-permeability-anisotropy-of-antigorite-shortening-mm-07-09.jpg)