Embed Size (px)
Citation preview

Transp Porous Med (2015) 110:157–169DOI 10.1007/s11242-015-0563-0
A Sensitivity Study of the Effect of Image Resolutionon Predicted Petrophysical Properties
Nayef Alyafei1 · Ali Qaseminejad Raeini1 ·Adriana Paluszny1 · Martin J. Blunt1
Received: 3 June 2014 / Accepted: 6 August 2015 / Published online: 1 September 2015© Springer Science+Business Media Dordrecht 2015
Abstract Micro-CT scanning is a nondestructive technique that can provide three-dimensional images of rock pore structure at a resolution of a few microns. We computepetrophysical properties on three-dimensional images of benchmark rocks: two sandstones(Berea and Doddington) and two limestones (Estaillades and Ketton). We take scans at avoxel size of approximately 2.7 µm and with 10243 voxels for both sandstone and lime-stone rocks. We numerically upscale the images to image sizes of 5123, 2563 and 1283,representing voxel sizes of around 5.4, 10.8, and 21.6 µm respectively, covering the samedomains with coarser resolution. We calculate porosity and permeability on these images byusing direct simulation and by extracting geometrical equivalent networks. We find that thepredicted porosity is fairly insensitive to resolution for sandstones studied with the selectedrange of resolutions but sensitive for limestones with lower porosity for larger voxel sizes.For the permeability predictions, we do not observe a clear trend in permeability as a func-tion of voxel size; however, sandstones, roughly, have comparable permeability regardlessof the voxel size. On the other hand, for limestones, we generally see a decreasing trend inpermeability as a function of upscaled voxel size.
Keywords Pore-scale modeling · Image resolution · Petrophysics · Micro-CT · Upscaling
1 Introduction
Advances in three-dimensional digital imaging have allowed direct visualization of the porespace of many rocks (Dunsmuir et al. 1991; Lindquist andVenkatarangan 1999; Thovert et al.2001;Wildenschild et al. 2002, 2005;Wildenschild and Sheppard 2013). Pore-scale imagingand modeling has received enormous attention in recent years, since it offers the promise topredict flow and transport properties using three-dimensional images of the pore space (see,
B Nayef [email protected]; [email protected]
1 Department of Earth Science and Engineering, Imperial College London, London SW7 2AZ, UK
123

158 N. Alyafei et al.
for instance, Blunt et al. 2013).However, the quality of the predictions is, clearly, related to theresolution of the images used as a basis for these calculations (Arns et al. 2002; Wildenschildet al. 2005). There is, furthermore, an inevitable trade-off between image resolution and theoverall size of the system that can be modeled.
In conventional reservoir simulation models, having more cells is thought to captureheterogeneity more accurately to obtain more reliable predictions of oil recovery. However,at some point, simulation becomes impractical and resource-intensive as the size of themodelis increased. Similarly, we can compare lowering image resolution to upscaling in reservoirsimulation: We upscale in order to reduce the computational time with a deterioration of themodel’s accuracy. However, what resolution is necessary to be representative of the rock atthe pore scale?
There are few studies in the literature on the effect of image resolution. Peng et al. (2012)performed a study on Berea sandstone with two resolutions of 0.35 and 12.7 µm. Theystudied porosity, pore size distribution, pore connectivity, surface area, hydraulic radius,and aspect ratio. They found that the high-resolution image was better able to capture thepore size; however, since they took a smaller volume for the high-resolution images forthe analysis, they found the larger, lower-resolution images represented large pores moreaccurately. Alyafei et al. (2013) studied five different resolution images (≈6–20µm) fortwo different sandstones and demonstrated an insensitivity of porosity to image resolution,while permeability varied considerably. Arns et al. (2005) performed a study on a reser-voir carbonate where they showed that the porosity is very sensitive to image resolution: Itreduced from 11.2% at 2.5 µm to 3.2% at 20 µm. Keemhm and Mukerji (2004) performeda study on image resolution on Fontainebleau sandstone, and they found that that porosityis insensitive to spatial resolution while predicted permeability increases at very low spatialresolutions.
There are two approaches to compute flow and transport based on three-dimensionalrepresentations of the pore space. The first is to compute the flow field directly on imagesusingfinite difference or particle-basedmethods (Gerbaux et al. 2010;Mostaghimi et al. 2012;Raeini et al. 2014; Ramstad et al. 2012; Spanne et al. 1994). The second approach to extractnetwork of pores and throats and compute flow using quasi-static pore network models (Silinet al. 2003; Al-Kharusi and Blunt 2007; Dong and Blunt 2009). While the second approachsimplifies the geometry of the pore space, it enables displacement in each network elementto be computed semi-analytically. It is very efficient for the determination of multi-phaseflow properties where capillary forces dominate (Øren and Bakke 2002; Valvatne and Blunt2004; Ryazanov et al. 2009). In this paper we will use both methods to predict permeability,and the network approach to determine pore and throat size distributions and connectivity.
In this paper, we will quantify the level of uncertainty related to upscaling micro-CTimages on predictions of petrophysical properties using pore-scale simulation. We obtainedscanswith themaximum resolution of themicro-CT scanner and then used averagingmethodsand linear interpolation to upscale our images. Then we compare, as a function of resolution,network structures (number of pores, number of throats, average pore radius, average throatradius, and coordination number), and single-phase properties (porosity and permeability).Where available, we compare the predictions with experimental data.
2 Experimental Methodology
We study four quarry rocks: Berea and Doddington sandstones and Estaillades and Kettonlimestones. Berea is from the Berea quarry in Ohio, USA. It is of Mississippian age and
123
A Sensitivity Study of the Effect of Image Resolution on. . . 159
consists of 87.3% quartz, 4.2% kaolinite, 3.2% mica and 3% K-feldspar (Pepper et al.1954).Doddington is from theDoddington quarry inWooler, UK. It is from theCarboniferousperiod and nonfossiliferous, and consists of 93.6% quartz, 1.9% kaolinite, 2% mica and1.7% K-feldspar (Santarelli and Brown 1989). Estaillades is from the Estaillade Formation,found in the Oppède quarry, south of France. It is from the Cenomanian and Campanian agesand consists of 99% calcite; the remaining 1% accounts for traces of dolomite and silica(Wright et al. 1995). Ketton is from the Lincolnshire Formation, located in Rutland, eastMidlands, UK. It is from the Toarcian and Bajocian ages and consists of 99.1% calcite and0.9% quartz (Ashton 1980).
Basic properties, such as porosity and brine permeability of the rocksmeasured on standardcylindrical cores (diameter 38.1mm, length 75mm) via Helium pycnometry and a Hassler-type cell with cylindrical confining pressure, respectively, are found and shown in Table1. We dry-scanned smaller cylindrical cores (diameter 4.95mm, length 10mm) using anXradia Versa 500 micro-CT scanner at iRock Technologies, Beijing, China. To guaranteeconsistency, the small and large cores were drilled out of the same block. Furthermore, wesent rock samples for mercury injection capillary pressure (MICP) measurements (AutoporeIV 9520, Weatherford Laboratories, East Grinstead, UK).
From the MICP, we can estimate the pore throat radii using the Young–Laplace equation:
Pc = 2σ cos θ
rp(1)
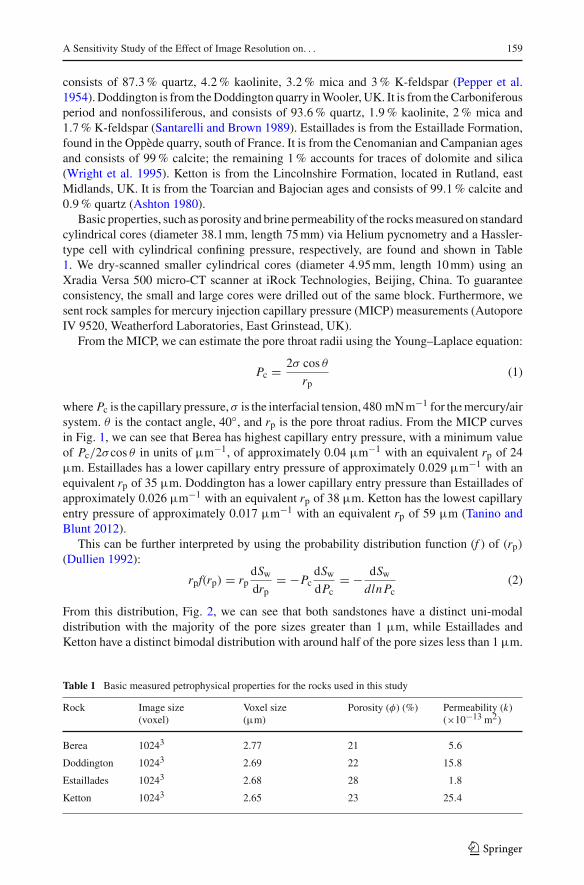
where Pc is the capillary pressure,σ is the interfacial tension, 480 mNm−1 for themercury/airsystem. θ is the contact angle, 40◦, and rp is the pore throat radius. From the MICP curvesin Fig. 1, we can see that Berea has highest capillary entry pressure, with a minimum valueof Pc/2σcos θ in units of µm−1, of approximately 0.04 µm−1 with an equivalent rp of 24µm. Estaillades has a lower capillary entry pressure of approximately 0.029 µm−1 with anequivalent rp of 35 µm. Doddington has a lower capillary entry pressure than Estaillades ofapproximately 0.026 µm−1 with an equivalent rp of 38 µm. Ketton has the lowest capillaryentry pressure of approximately 0.017 µm−1 with an equivalent rp of 59 µm (Tanino andBlunt 2012).
This can be further interpreted by using the probability distribution function (f ) of (rp)(Dullien 1992):
rpf(rp) = rpdSwdrp
= −PcdSwdPc
= − dSwdlnPc
(2)
From this distribution, Fig. 2, we can see that both sandstones have a distinct uni-modaldistribution with the majority of the pore sizes greater than 1 µm, while Estaillades andKetton have a distinct bimodal distribution with around half of the pore sizes less than 1 µm.
Table 1 Basic measured petrophysical properties for the rocks used in this study
Rock Image size(voxel)
Voxel size(µm)
Porosity (φ) (%) Permeability (k)(×10−13 m2)
Berea 10243 2.77 21 5.6
Doddington 10243 2.69 22 15.8
Estaillades 10243 2.68 28 1.8
Ketton 10243 2.65 23 25.4
123
160 N. Alyafei et al.
0.001
0.01
0.1
1
10
100
1000
0.0 0.2 0.4 0.6 0.8 1.0
P c[M
Pa]
Sw
BereaDoddingtonEstailladesKetton
Fig. 1 Measured capillary pressures (mercury/air) as a function of equivalent water saturation, Sw, for all therocks
0
0.5
1
1.5
2
2.5
0.01 0.1 1 10 100
r pf(r
p)
rp [µm]
BereaDoddingtonEstailladesKetton
Fig. 2 The pore size distribution against pore throat radius for all the rocks. The dashed line depicts rp =2.7µm
From the 2.7 µm dashed line in Fig. 2 (which represents approximately the average voxelsize of all the rocks), the vast majority of the pore space can be resolved for the sandstonesand around half of the pore spaces can be resolved for the limestones. Since Estailladesand Ketton are carbonate rocks, approximately half of their porosities are considered to beintra-granular microporosity which cannot be resolved by the micro-CT which requires aninstrument with nm resolution.
3 Image Processing
We crop each grayscale image to a cubic base case of 10243 voxels which is equivalent toa volume of 22.8, 20.9, 20.7, and 20.0 mm3 for Berea, Doddington, Estaillades, and Ket-ton, respectively. Then, we segment the images by applying a three-step method (Iglaueret al. 2011, 2013): (1) We clean CT images of ring artifacts by applying a stripe removalalgorithm based on combined wavelet—Fourier filtering (Münch et al. 2009); (2)We apply aconservative anisotropic regularization filter to reduce salt-and-pepper noise (Tschumperléand Deriche 2005). At this stage the following parameters are used: The parameters for
123

A Sensitivity Study of the Effect of Image Resolution on. . . 161
Fig. 3 Cross section of a grayscalemicro-CT image, b three-phasemulti-thresholding, and c two-phase imagesegmentation for the 10243 voxel image of Berea sandstone
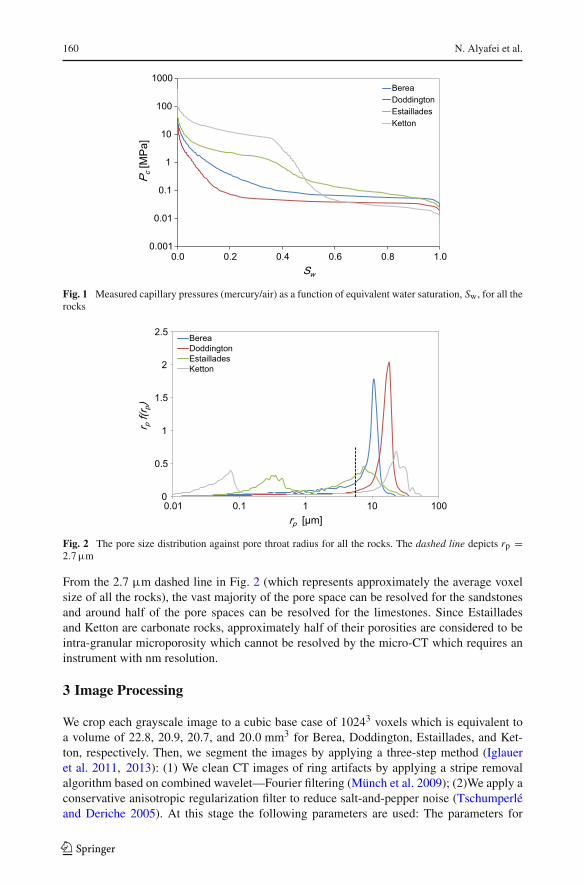
the anisotropic filter are as follows. A total of five smoothing iterations per image is per-formed, with the diffusion limiter along minimal and maximal variations set to 0.50 and0.90, respectively, and an edge threshold height of 2.5. The Otsu segmentation is based onthe identification of five peaks, and these are later classified into pore and grain based ontopological connectivity. The five peaks capture grains and pores, and high density inclu-sions which appear as bright grains in the samples. (3) We segment pore and grain domainsaccording to peaks in the gray level histograms, using Otsu’s multi-thresholding (Otsu 1979).Furthermore, due to their fine resolution and the presence of clay with high X-ray absorption,we subdivided the images into three domains, for which the brightest corresponded to theclay inclusions, Fig. 3. Figure 4 shows segmented three-dimensional images of each rock.
Then, we re-sample/upscale each image on the (x, y) axes directly from the segmentedimages by factors of 2, 4, and 8 using the Lanczos re-sampling algorithm, Figs. 5 and 6.Lanczos is a windowed downsampling interpolation method which performs a local averageover specific finite window (i.e., binning) by averaging distance with the first oscillation ofthe sinc() function. Lanczos prevents the artificial formation of Moiré effects and reduces thelevel of detail without artificially sharpening the image (Duchon 1979). We downsample thedataset on a pixel by pixel basis in the z direction by applying uniform averaging. This is inorder to preserve the same physical volume as the 10243 data set and thus to have a standardcomparison between all the cases. The resizing of the dataset is always performed in thedownsampling sense. Thus, the largest image corresponds to the highest resolution image.The current method corresponds to the slab- averaging technique which is used in themedicalimaging context, and is known to preserve the level of detail without introducing unwantedartifacts to the image. Upscaling in the vertical, z, direction is a function of the spacing andamount of averaged slides in the z direction. If the averaging is performed indiscriminately,this can result in anisotropic sampling of the dataset. However, the present case is simple inthat upscaling reduces the dimension of the dataset by half in each case. Thus, in each step,two pixels were averaged in the z direction after applying the Lanczos filter. The result is a setof datasets of decreasing resolutions: 10243, 5123, 2563, and 1283 representing voxel sizes of2.77, 5.54, 11.08, and 22.16µm for Berea, 2.69, 5.38, 10.76, and 21.52µm for Doddington,2.68, 5.36, 10.72, and 21.44µm for Estaillades, and 2.65, 5.3, 10.6, and 21.2µm for Ketton.
We include all the segmented images used in this study in an online library available fordownload.1
1 The images used in this study can be downloaded from http://www.imperial.ac.uk/engineering/departments/earth-science/research/research-groups/perm/research/pore-scale-modelling/micro-ct-images-and-networks/.
123
162 N. Alyafei et al.
Fig. 4 Segmented three-dimensional micro-CT images for aBerea, bDoddington, c Estaillades and dKettonrepresenting 10243 voxels
Fig. 5 Small region of 2D cross section of Berea sandstone of a 1024 × 1024 pixel2, b after upscaling to512 × 512 pixel2, c after upscaling to 256 × 256 pixel2, and d after upscaling to 128 × 128 pixel2
4 Network Structures
We use a maximal ball algorithm to extract networks from the images. The method finds thelargest spheres that fit in the pore space are pores, while chains of smaller spheres connectingthem represent throats. Details of the method are provided elsewhere (Dong and Blunt 2009).
123

A Sensitivity Study of the Effect of Image Resolution on. . . 163
Fig. 6 A 2D portion of the high-resolution (10243) image of a Doddington, b Estaillades, and c Ketton. Theequivalent portion of the lowest resolution (1283) image of d Doddington, e Estaillades, and f Ketton
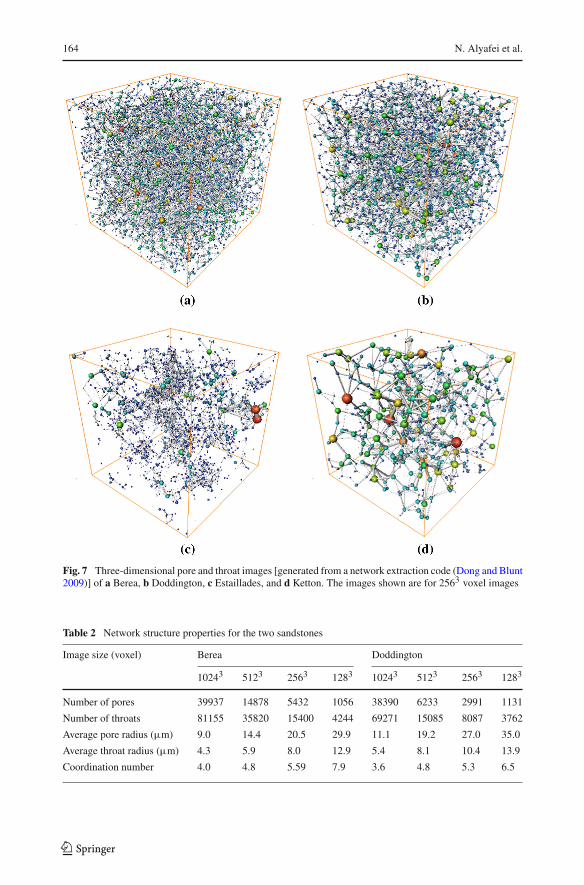
Figure 7 shows three-dimensional images of the extracted pores and throats. We compare therocks in terms of numbers of pores, throats, average pore radius, average throat radius, andcoordination numbers (average number of throats connected to each pore).
Tables 2 and 3 show the network properties of the rocks. We can see that Estaillades hasthe highest number of pores and throats, while Ketton has the lowest. From Fig. 4, we can seethat Estaillades is characterized with both large and small pores, while Ketton has only fewbig pores that can be captured by micro-CT imaging. Similarly, Doddington is characterizedby larger pores compared with Berea. Network extraction does not produce unique networkswith more small pores and throats as the resolution becomes finer. Ketton has the largestaverage pore and throat radii which might be expected due to its high permeability. Bothaverage pore and throat radii decrease as we decrease voxel size for all the rocks. Estailladeshas the highest average coordination number; this can be explained by the large number ofsmall throats that contribute to the connectivity of the rock. The coordination number showsopposite trends for sandstones than limestones. For sandstones, the coordination numberincreases as we increase the voxel size, while we see a decrease for Estaillades and littlechange for Ketton.
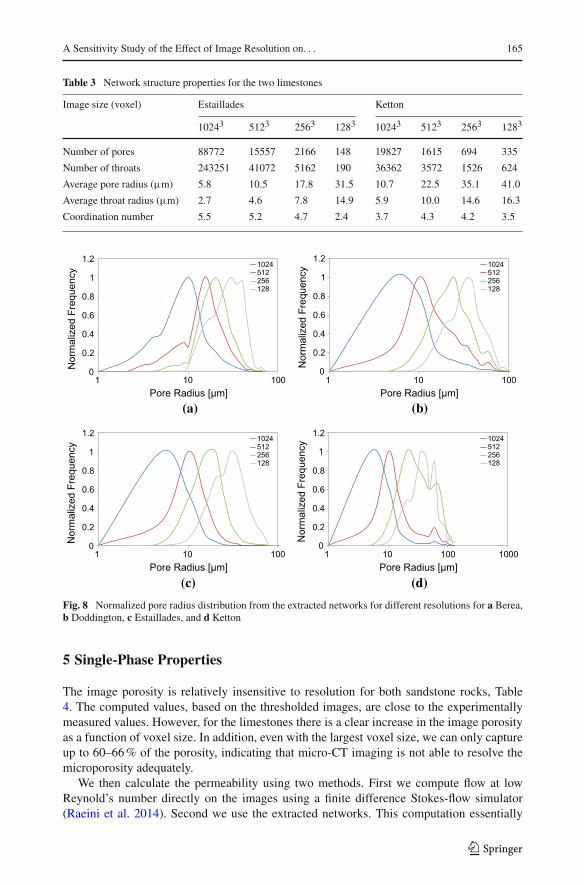
The computed pore and throat radii distribution from the extracted networks are shown inFigs. 8 and 9, respectively. Note that we do not capture microporosity in these images andhence cannot accommodate elements smaller than a few µm in size. This explains the uni-modal distribution of these figures, unlike the MICP measurements. The pore and throat sizedistributions peak close the voxel size. Inmost of the cases, network extraction underestimatesthe macro-pores compared to MICP which has the highest resolution, covering a wider rangeof throat sizes.
123
164 N. Alyafei et al.
Fig. 7 Three-dimensional pore and throat images [generated from a network extraction code (Dong and Blunt2009)] of a Berea, b Doddington, c Estaillades, and d Ketton. The images shown are for 2563 voxel images
Table 2 Network structure properties for the two sandstones
Image size (voxel) Berea Doddington
10243 5123 2563 1283 10243 5123 2563 1283
Number of pores 39937 14878 5432 1056 38390 6233 2991 1131
Number of throats 81155 35820 15400 4244 69271 15085 8087 3762
Average pore radius (µm) 9.0 14.4 20.5 29.9 11.1 19.2 27.0 35.0
Average throat radius (µm) 4.3 5.9 8.0 12.9 5.4 8.1 10.4 13.9
Coordination number 4.0 4.8 5.59 7.9 3.6 4.8 5.3 6.5
123
A Sensitivity Study of the Effect of Image Resolution on. . . 165
Table 3 Network structure properties for the two limestones
Image size (voxel) Estaillades Ketton
10243 5123 2563 1283 10243 5123 2563 1283
Number of pores 88772 15557 2166 148 19827 1615 694 335
Number of throats 243251 41072 5162 190 36362 3572 1526 624
Average pore radius (µm) 5.8 10.5 17.8 31.5 10.7 22.5 35.1 41.0
Average throat radius (µm) 2.7 4.6 7.8 14.9 5.9 10.0 14.6 16.3
Coordination number 5.5 5.2 4.7 2.4 3.7 4.3 4.2 3.5
0
0.2
0.4
0.6
0.8
1
1.2
1 10 100
Nor
mal
ized
Fre
quen
cy
Pore Radius [µm]
1024512256128
0
0.2
0.4
0.6
0.8
1
1.2
1 10 100
Nor
mal
ized
Fre
quen
cy
Pore Radius [µm]
1024512256128
(b)(a)
0
0.2
0.4
0.6
0.8
1
1.2
1 10 100
Nor
mal
ized
Fre
quen
cy
Pore Radius [µm]
1024512256128
0
0.2
0.4
0.6
0.8
1
1.2
1 10 100 1000
Nor
mal
ized
Fre
quen
cy
Pore Radius [µm]
1024512256128
(d)(c)
Fig. 8 Normalized pore radius distribution from the extracted networks for different resolutions for a Berea,b Doddington, c Estaillades, and d Ketton
5 Single-Phase Properties
The image porosity is relatively insensitive to resolution for both sandstone rocks, Table4. The computed values, based on the thresholded images, are close to the experimentallymeasured values. However, for the limestones there is a clear increase in the image porosityas a function of voxel size. In addition, even with the largest voxel size, we can only captureup to 60–66% of the porosity, indicating that micro-CT imaging is not able to resolve themicroporosity adequately.
We then calculate the permeability using two methods. First we compute flow at lowReynold’s number directly on the images using a finite difference Stokes-flow simulator(Raeini et al. 2014). Second we use the extracted networks. This computation essentially
123

166 N. Alyafei et al.
0
0.2
0.4
0.6
0.8
1
1.2
0.01 0.1 1 10 100
Nor
mal
ized
Fre
quen
cy
Throat Radius [µm]
MICP1024512256128
0
0.2
0.4
0.6
0.8
1
1.2
0.01 0.1 1 10 100
Nor
mal
ized
Fre
quen
cy
Throat Radius [µm]
MICP1024512256128
(b)(a)
0
0.2
0.4
0.6
0.8
1
1.2
0.001 0.01 0.1 1 10 100
Nor
mal
ized
Fre
quen
cy
Throat Radius [µm]
MICP1024512256128
0
0.2
0.4
0.6
0.8
1
1.2
0.001 0.01 0.1 1 10 100 1000
Nor
mal
ized
Fre
quen
cy
Throat Radius [µm]
MICP1024512256128
(d)(c)
Fig. 9 Normalized throat radius distribution from the extracted networks for different resolutions for aBerea,b Doddington, c Estaillades, and d Ketton compared to the MICP pore throat radius
Table 4 Image porosity for all the rocks used in this study where φImage/φ is the ratio of the image porosityto the experimental value of the large cores
Image size (voxel) φImage(%) φImage/φ(%)
10243 5123 2563 1283 10243 5123 2563 1283
Berea 20.2 20.2 20.1 20.0 96.2 96.2 95.7 95.2
Doddington 21.7 21.6 21.6 21.6 98.6 98.2 98.2 98.2
Estaillades 16.9 13.3 8.6 3.7 60.4 47.5 30.7 13.2
Ketton 15.2 14.0 12.5 9.7 66.1 60.9 54.3 42.2
treats the porous medium as a random resistor network with semi-analytically computedflow conductances for each element (Valvatne and Blunt 2004).
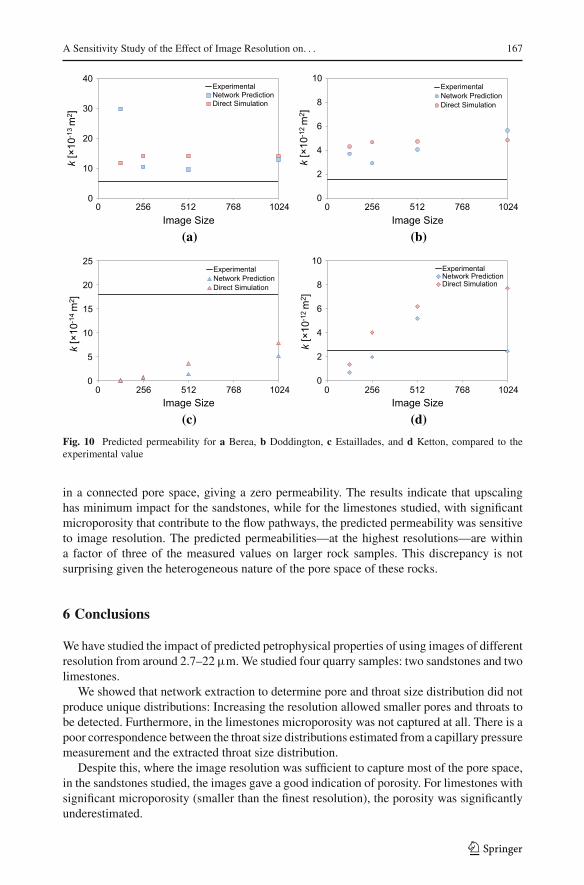
Figure 10 shows the predicted permeability using direct simulation and the extractednetworks as a function of voxel size for all the rocks. For the sandstones the predictedpermeabilities are generally comparable using the two methods and seem to be independentof the voxel resolution, except for the 1283 voxel image using the network approach for Bereasandstone where the permeability is over-predicted.
For the limestones, we observe an increasing trend between the permeability and numberof voxels, which indicates that capturing more features of the limestones will result in higherpermeability. These small pores contribute to the connectivity. For Estaillades, the 1283
image size is too poor to capture the features of the rock morphology, and did not result
123
A Sensitivity Study of the Effect of Image Resolution on. . . 167
0
10
20
30
40
0 256 512 768 1024
k[×
10-1
3m
2 ]
Image Size
ExperimentalNetwork PredictionDirect Simulation
0
2
4
6
8
10
0 256 512 768 1024
k[ ×
10-1
2m
2 ]
Image Size
ExperimentalNetwork PredictionDirect Simulation
(b)(a)
0
5
10
15
20
25
0 256 512 768 1024
k[×
10-1
4m
2 ]
Image Size
ExperimentalNetwork PredictionDirect Simulation
0
2
4
6
8
10
0 256 512 768 1024
k[ ×
10-1
2m
2 ]
Image Size
ExperimentalNetwork PredictionDirect Simulation
(d)(c)
Fig. 10 Predicted permeability for a Berea, b Doddington, c Estaillades, and d Ketton, compared to theexperimental value
in a connected pore space, giving a zero permeability. The results indicate that upscalinghas minimum impact for the sandstones, while for the limestones studied, with significantmicroporosity that contribute to the flow pathways, the predicted permeability was sensitiveto image resolution. The predicted permeabilities—at the highest resolutions—are withina factor of three of the measured values on larger rock samples. This discrepancy is notsurprising given the heterogeneous nature of the pore space of these rocks.
6 Conclusions
We have studied the impact of predicted petrophysical properties of using images of differentresolution from around 2.7–22µm.We studied four quarry samples: two sandstones and twolimestones.
We showed that network extraction to determine pore and throat size distribution did notproduce unique distributions: Increasing the resolution allowed smaller pores and throats tobe detected. Furthermore, in the limestones microporosity was not captured at all. There is apoor correspondence between the throat size distributions estimated from a capillary pressuremeasurement and the extracted throat size distribution.
Despite this, where the image resolution was sufficient to capture most of the pore space,in the sandstones studied, the images gave a good indication of porosity. For limestones withsignificant microporosity (smaller than the finest resolution), the porosity was significantlyunderestimated.
123

168 N. Alyafei et al.
We predicted permeability using both direct simulation based on the Navier–Stokes equa-tions on the images and the extracted networks. The methods gave comparable results. Thisindicates that the network extraction method correctly identified the main flow paths. For thehighest resolution images the predictions were comparable to the measurements on largersamples of the same rock. As resolution decreased, the permeability could be substantiallyunder-predicted if connectivity was lost, or over-predicted if the sizes of the main flow path-ways were over-estimated.
We recommend that the image resolution used for prediction should be sufficient to resolvemost of the pore space: The easiest check is to compare the average throat size of the porenetwork modeling to the mercury pore size distribution. Another approach would be tocompare the measured and imaged porosity and only accept images where the segmentedimage captures at least 90% of the porosity. However, these approaches may be complicatedby the connectivity of the sample. In some cases, there might be significant fraction ofunresolved microporosity which does not contribute to the permeability calculation sincethe flow is governed by the macro-pores. In other cases, a rock might have small fraction ofmicropores that do not contribute significantly to the porosity but provide crucial connectivityand hence have a large impact on the permeability.
While the extracted networks could give good predictions of permeability—subject tothe constraints above—the extracted pore and throat size distributions are not necessarily inagreement with capillary pressure measurements. This implies that the prediction of multi-phase flowproperties, such as capillary pressure and relative permeabilitymay not be reliable.This is a topic of future work.
Acknowledgments We would like to acknowledge funding from the Qatar Carbonates and Carbon StorageResearch Centre, QCCSRC, which is supported jointly by Qatar Petroleum, Shell and the Qatar Science andTechnology Park.
References
Al-Kharusi, A.S., Blunt, M.J.: Network extraction from sandstone and carbonate pore space images. J. Petrol.Sci. Eng. 56, 219–231 (2007)
Alyafei, N., Gharbi, O., Raeini, A.Q., Yang, J., Iglauer, S., Blunt, M.J.: Influence of micro-computed tomog-raphy image resolution on the predictions of petrophysical properties. In: International PetroleumTechnology Conference (2013)
Arns, C.H., Knackstedt, M.A., Pinczewski, W.V., Garboczi, E.J.: Computation of linear elastic properties frommicrotomographic images: methodology and agreement between theory and experiment. Geophysics67(5), 1396–1405 (2002)
Arns, C.H., Bauget, F., Limaye, A., Sakellariou, A., Senden, T.J., Sheppard, A.P., Sok, R.M., Pinczewski,W.V., Bakke, S., Berge, L.I., Øren, P., Knackstedt, M.A.: Pore scale characterization of carbonates usingX-ray microtomography. SPE J. 10(4), 1–10 (2005)
Ashton,M.: The stratigraphy of the Lincolnshire Limestone Formation (Bajocian) in Lincolnshire and Rutland(Leicestershire). Proc. Geol. Assoc. 91, 203–223 (1980)
Blunt,M.J., Bijeljic, B.,Dong,H.,Gharbi,O., Iglauer, S.,Mostaghimi, P., Paluszny,A., Pentland,C.: Pore-scaleimaging and modelling. Adv. Water Resour. 51, 197–216 (2013)
Dong, H., Blunt, M.J.: Pore-network extraction from micro-computerized-tomography images. Phys. Rev. E80(3), 036307 (2009)
Duchon, C.E.: Lanczos filtering in one and two dimensions. J. Appl. Meteorol. 18(8), 1016–1022 (1979)Dunsmuir, J.H., Ferguson, S.R., D’Amico, K.L., Stokes, J.P.: X-ray microtomography: a new tool for the
characterization of porous media. In: SPE Annual Technical Conference and Exhibition (1991)Dullien, F.A.L.: Porous Media. Fluid Transport and Pore Structure. Academic, San Diego (1992)Gerbaux, O., Buyens, F., Mourzenko, V.V., Memponteil, A., Vabre, A., Thovert, J.-F., Adler, P.M.: Transport
properties of real metallic foams. J. Colloid Interface Sci. 342, 155–165 (2010)
123
A Sensitivity Study of the Effect of Image Resolution on. . . 169
Iglauer, S., Paluszny, A., Pentland, C.H., Blunt, M.J.: Residual CO2 imaged with X-ray micro-tomography.Geophys. Res. Lett. 38(21), L21403 (2011)
Iglauer, S., Paluszny, A., Blunt, M.J.: Simultaneous oil recovery and residual gas storage: a pore-level analysisusing in situ X-ray micro-tomography. Fuel 103, 905–914 (2013)
Keemhm, Y., Mukerji, T.: Permeability and relative permeability from digital rocks: Issues on grid resolutionand representative elementary volume. In: Society of Exploration Geophysicists (2004)
Lindquist, W.B., Venkatarangan, A.: Investigating 3D geometry of porous media from high resolution images.Phys. Chem. Earth Part A 24(7), 593–599 (1999)
Mostaghimi, P., Bijeljic, B., Blunt, M.J.: Simulation of flow and dispersion on pore-space images. SPE J.17(4), 1131–1141 (2012)
Münch, B., Trtik, P., Marone, F., Stampanoni, M.: Stripe and ring artefact removal with combined wavelet—Fourier filtering. Opt. Express 17(10), 8567–8591 (2009)
Øren, P., Bakke, S.: Process based reconstruction of sandstones and prediction of transport properties. Transp.Porous Media 46(2–3), 311–343 (2002)
Otsu, N.: An automatic threshold selection method based on discriminate and least squares criteria. DenshiTsushin Gakkai Ronbunshi 63, 349–356 (1979)
Peng, S., Hu, Q., Dultz, S., Zhang, M.: Using X-ray computed tomography in pore structure characterizationfor a berea sandstone: resolution effect. J. Hydrol. 472, 254–261 (2012)
Pepper, J.F., deWitt,W.,Demarest,D.F.:Geology of theBedfordShale andBereaSandstone in theAppalachianbasin. U.S. Geological Survey (1954)
Raeini, A.Q., Bijeljic, B., Blunt,M.J.: Numerical modelling of sub-pore scale events in two-phase flow throughporous media. Transp. Porous Media 101(2), 191–213 (2014)
Ramstad, T., Idowu, N., Nardi, C., Øren, P.E.: Relative permeability calculations from two-phase flow simu-lations directly on digital images of porous rocks. Transp. Porous Media 94(2), 487–504 (2012)
Ryazanov, A.V., van Dijke, M.I.J., Sorbie, K.S.: Two-phase pore-network modelling: existence of oil layersduring water invasion. Transp. Porous Media 80(1), 79–99 (2009)
Santarelli, F.J., Brown, E.T.: Failure of three sedimentary rocks in triaxial and hollow cylinder compressiontests. Int. J. Rock Mech. Min. Sci. Geomech. Abstr. 26(5), 401–413 (1989)
Silin, D.B., Jin, G., Patzek, T.W.: Robust determination of pore space morphology in sedimentary rocks. In:SPE Annual Technical Conference and Exhibition (2003)
Spanne, P., Thovert, J.F., Jacquin, C.J., Lindquist, W.B., Jones, K.W., Adler, P.M.: Synchrotron computedmicrotomography of porous media: topology and transports. Phys. Rev. Lett. 73(14), 2001–2004 (1994)
Tanino, Y., Blunt, M.J.: Capillary trapping in sandstones and carbonates: dependence on pore structure. WaterResour. Res. 48(8), W08525 (2012)
Thovert, J.-F., Yousefian, F., Spanne, P., Jacquin, G.G., Adler, P.M.: Grain reconstruction of porous media:application to a low-porosity Fontainebleau sandstone. Phys. Rev. E 63, 061307 (2001)
Tschumperlé, D., Deriche, R.: Vector-valued image regularization with PDE’s: a common framework fordifferent applications. IEEE Trans. Pattern Anal. Mach. Intell. 27(4), 506–517 (2005)
Valvatne, P.H., Blunt, M.J.: Predictive pore-scale modeling of two-phase flow in mixed wet media. WaterResour. Res. 40(7), W07406 (2004)
Wildenschild, D., Sheppard, A.P.: X-ray imaging and analysis techniques for quantifying pore-scale structureand processes in subsurface porous medium systems. Adv. Water Resour. 51, 217–246 (2013)
Wildenschild, D., Vaz, C.M.P., Rivers, M.L., Rikard, D., Christensen, B.S.B.: Using X-ray computed tomog-raphy in hydrology: systems, resolutions, and limitations. J. Hydrol. 267(3), 285–297 (2002)
Wildenschild, D., Hopmans, J.W., Rivers, M.L., Kent, A.J.R.: Quantitative analysis of flow processes in a sandusing synchrotron-based X-ray microtomography. Vadose Zone J. 4(1), 112–126 (2005)
Wright, V.P., Platt, N.H., Marriott, S.B., Beck, V.H.: A classification of rhizogenic (root-formed) calcretes,with examples from the Upper Jurassic-Lower Cretaceous of Spain and Upper Cretaceous of southernFrance. Sed. Geol. 100, 143–158 (1995)
123