Embed Size (px)
Citation preview

J O U R N A L O F A P P L I E D M E T E O R O L O G Y
The Effect of Model Resolution in Predicting Meteorological Parameters Used in Fire Danger Rating
JEANNE L. HOADLEY,* KEN WESTRICK,+ SUE A. FERGUSON,* SCOTT L. GOODRICK,# LARRY BRADSHAW,@
AND PAUL WERTH&
* U.S. Departntent qf Aoricultuse Forest Service, Pacific Northwest Research Station, Seattle, Rshington '3Tier Environmentai Forecast Gmzrp, Seattle. Wadington
#US. Department qf Agriculture Forest Service, Athens, Georgia @u.s. Departnzent qf Agricultzlre Forest Service, Missozila, Motztana
&U.S. Department qf Interior, Portland, Or-egon
(Manuscript received 15 August 2003, in final form 1 March 2004)
ABSTRACT
Previous studies of model perfonnance at varying resolutions have focused on winter stonns or isolated convective events. Little attention has been given to the static high pressure situations that may lead to severe wildfire outbreaks. This study focuses on such an event so as to evaluate the value of increased model resolution for prediction of fire danger. The results are intended to lay the groundwork for using the fifth-generation Pennsylvania State University-National Center for Atmospheric Research Mesoscale Model (MM5) as input to the National Fire Danger Rating System to provide gridded predictions of fire danger indices. Predicted weather parameters were derived from MM5 and evaluated at three different resolutions (36, 12, and 4 km). Model output was compared with observations during the 2000 fire season in western Montana and northern Idaho to help to detennine the model's skill in predicting fire danger. For application in fire danger rating, little significant i~nprovement was found in skill with increased model resolution using standard forecast verification techniques. Diurnal bias of modeled temperature and relative humidity resulted in errors larger than the differences between resolutions. Significant timing and magnitude errors at all resolutions could jeopardize accurate prediction of fire danger.
1. Introduction provide gridded forecasts of fire danger indices. In order
The purpose of this study is to evaluate the effect of varying resolution on mesoscale meteorological model performance in predicting fire danger. The National Fire Danger Rating System (NFDRS; Deeming et al. 1977) is used by fire weather forecasters and fire managers throughout the United States to monitor and anticipate the potential for dangerous wildfires. The NFDRS is also used to help to plan the timing and assess the po- tential outcome of controlled, "prescribed" fires used for managing fuels and vegetation resources.
Fire Consortia for Advanced Modeling of Meteorol- ogy and Smoke (FCAMMS) are being developed around the country. These centers will be the focus of devel- opment and application of mesoscale modeling efforts in support of land management and fire weather and smoke forecasting. More information about the FCAMMS can be found online at http://www.fs.fed.us/ fcamms. As part of this effort we are planning to apply the mesoscale model output to NFDRS algorithms to
Corresporlding azithor address: Jeanne L. Hoadley, 400 North 34th St., Ste. 201, Seattle, WA 98 103. E-mail: [email protected]
to ensure the most accurate and efficient production of these forecasts we are evaluating the input parameters and resulting indices at varying resolution.
This paper focuses on the first step in this evaluation. Model predictions of weather parameters that are used as input to the NFDRS have been verified by comparing model output from the fi fth-generation Pennsylvania State University-National Center for Atmospheric Re- search (PSU-NCAR) Mesoscale Model, version 3.6 (MM5), simulations run at 36, 12, and 4 km to hourly surface observations of temperature, relative humidity, and wind.
Previous studies evaluating the performance of MM5 have focused primarily on winter-season events. Eval- uation of summer events has been limited to short-term case studies, usually a day or two in scope. The current study considers a 1-month period during the summer of 2000 in order to capture the meteorological events as- sociated with that fire season.
Those weather parameters most pertinent to fire dan- ger rating include temperature, relative humidity, and wind speed (Cohen and Deeming 1985). Though not specifically used in NFDRS equations, wind direction

1334 J O U R N A L O F A P P L I E D M E T E O R O L O G Y VOLUME 43
is a critical factor in fire behavior and fire spread. Wind direction has been evaluated along with the NFDRS weather parameters in order to better understand the usefulness of increasing model resolution for a range of fire weather forecasting requirements.
Precipitation and lightning are also important to fire danger forecasting. During the study period there were too few precipitation events to provide a meaningful analysis of model performance in prediction of precip- itation. Because the model does not explicitly predict lightning and preliminary analysis showed little corre- lation between model forecast convective available po- tential energy (CAPE), a measure of instability that con- tributes to thunderstorm occurrence, and resultant light- ing occurrence, no further evaluation of model perfor- mance in prediction of lightning was done.
To help to evaluate the performance of MM5 we com- pared its output with observations from western Mon- tana and north-central Idaho for the period from 25 July through 24 August 2000. This represents the most active period of a severe fire season in that area.
2. Background
Numerous studies have evaluated the performance of mesoscale models, and in particular the MM5. Several studies also have compared the performance of the MM5 at different resolutions.
Colle et a]. (2000) looked at cool-season precipitation and found that while there was noticeable improvement from 36- to 12-km resolution, the improvement in model skill between 12- and 4-km resolution was limited to heavy rainfall events. In a related study, Colle et a]. (1999) indicated that in some locations, such as in the lee of the Cascade range, the MM5 is more skillful at predicting precipitation at the 36-km resolution than at 12-km resolution.
Another MM5 study, Mass et a]. (2002), covers a multiyear period and evaluated wind, temperature, and sea level pressure. This study found that while there are significant improvements between 36- and 12-km res- olution, traditional verification statistics showed only small improvement from 12- to 4-km resolution. Using a more subjective analysis they showed that increased resolution did improve detail and structure of mesoscale and synoptic-scale features. Such improvements are not captured by objective point verification because of tim- ing and position errors.
Manning and Davis (1997) document a bias of the MM5 to predict too-cool maximum temperatures and too-warm minimum temperatures. This results in veri- fication statistics with large errors near the maximum and minimum validation times but much smaller errors during the diurnal transition periods. Cox et a]. (1998) found a negative bias for both upper-air and surface dewpoint depression in the MM5 (i.e., model dewpoint depression smaller than observed). Both of these studies found a positive bias in wind speed at the surface with
a negative bias aloft (i.e., model winds stronger than observed at the surface and weaker than observed aloft).
Cairns and Corey (1998) compared wind simulations at 27, 9, and 3 km and found that increased resolution improved model simulation of mountain wave winds surfacing in the lee of the Sierra Nevada range near Reno, Nevada, in December. Colle et a]. (2001) looked at timing of trough passages during the cool season and found that the 12-km resolution reduced timing errors by 5%-10% over the 36-km runs near the Washington coast. In a comparison of ensemble predictions over the Pacific Northwest, Grimit and Mass (2002) found that 12-km ensemble mean predictions are as good as those at 4-km resolution and, at lead times beyond 21 h, the error scores are lower for the 12-km predictions.
Two studies looked at much finer resolutions using the Colorado State University Regional Atmospheric Modeling System (RAMS) model. Both focused on pre- dicting wind in single events. McQueen et al. (1995) found that a resolution of 2.5 km or less was needed to resolve terrain forcing and that, when properly resolved, the topographic forcing had a controlling influence even in a synoptically driven event. Salvador et a]. (1999) compared model runs at 6, 4, 2, and 1.5 km and found that significant improvements in the wind field could be demonstrated at the finer resolutions.
White et al. (1999) compared several models, in- cluding the Medium-Range Forecast (MW), Nested Grid Model (NGM), Eta, Meso Eta, MM5, and Utah Local Area Model (LAM). They found that while the Meso Eta led the field at 12 and 24 h, by 36 h the MRF, (which has the coarsest resolution of initial state, to- pography, and dynamical processes), showed the best performance of all the models. They suggest that the value added from mesoscale information may be lost because of phase and amplitude errors. Like Mass et al. (2002), White et a]. (1999) note that traditional verifi- cation statistics based on point observations may not adequately measure the model's performance because a slight difference in timing or spacing can produce large verification errors. This concern is reiterated by Davis and Can (2000) in summarizing a 1998 workshop on mesoscale model verification held at NCAR.
Most of the studies cited above have focused on win- ter-season events. Only two studies that included sum- mer cases, Cox et al. (1998) and Salvador et a]. (1999), could be found. Neither of these studies were concerned with fire weather, and both focused on the events of a single day.
Little can be found in the literature that would help to assess the usefulness of mesoscale models, including the MM5, during relatively static summertime condi- tions that lead to extreme fire danger. The summer of 2000 in the Northern Rockies was characterized by strong high pressure resulting in hot and dry conditions. Occasional dry upper-level trough passages resulted in high-based thunderstorms that produced sufficient light- ning to ignite tinder dry fuels but little precipitation

H O A D L E Y E T A L .
FIG. 1. A shaded relief map of the study area. The Bitterroot National Forest (hatched area); locations of large fires (gray circles); cities (black circles). Boundary between ID and MT (solid white line). Shaded relief is from the U.S. Geological Survey National Elevation Dataset 1 :24 000 scale (7.5').
reaching the surface. While these types of weather West of the Bitterroot Range, in Idaho, are the relatively events are not typically studied, there is a need to un- uninhabited Clearwater Mountains, while to the south derstand how mesoscale models used in predicting fire are the Salmon River Mountains. Elevations in the Bit- weather and fire danger perform during less dramatic terroot basin range from 975 m at the north end of the weather periods. The current study focuses on those valley to the 3095-m Trapper Peak, the most prominent weather parameters used in predicting fire danger. feature in the south valley, although several peaks on
the western Bitterroot Range extend above 2700 m in
3. Study area
The study area is roughly centered on the Bitterroot Valley, which was the focus for much of the fire activity in the United States during the summer of 2000. The area extends from 45" to 48"N and from 1 13" to 1 16OW (Fig. 1).
The Bitterroot valley i n western Montana extends for approximately 130 km to the south from the city of Missoula, Montana. The relatively straight basin is ori- ented south to north and is bounded to the east by the Sapphire Mountains, to the south by the ~nacbnda Range and the Salmon River Mountains, and to the west by the more prominent Bitterroot Range. The Bitterroot Range also marks the state boundary with Idaho. The Bittenoot River flows to the north and drains into the Clark Fork River just south of Missoula.
A relatively broad valley floor exists in the northern half of the valley, roughly 30-40 km wide. To the south of Hamilton the valley narrows to just a few kilometers.
elevation. The somewhat arid valley floor and lower foothills
are composed primarily of a mix of grasslands, shrub, and ponderosa pine, while the mid- to upper elevations are habitat for stands of Douglas fir, lodgepole pine, western larch, Engelmann spruce, subalpine fir, subal- pine larch, and whitebark pine. Much of the mid- to higher-elevation land throughout the area is part of the 650 000 ha Bitterroot National Forest, almost one-half (47%) of which is designated wilderness area.
4. General weather conditions
During the summer of 2000 wildfires were active in the entire region of western Montana and northern Ida- ho, as well as other areas in the interior western United States. Within the study area fires occurred in and near the Bitterroot National Forest, which includes the east- ern flanks of the Bittenoot Range and the western flanks of the Sapphire Range. Fire activity extended westward

J O U R N A L O F A P P L I E D M E T E O R O L O G Y
Date
FIG. 2. Weather and fire events from 10 Jul to 4 Sep 2000. The study period is indicated by the unshaded region. (a) The number of lightn~ng strikes (black bar) and large fire starts (gray bar) within the study area each day. (b) Observed max temperature (thick line), min relative humidity (thin line), ~nax relative humidity (dashed line), and precipitat~on (bars) at Missouia.
into the Clearwater Mountains and southward into the Salmon River region. Significant fires also occurred northeast of Missoula in the Swan Range, and in the Cabinet Mountain and Ninemile Valley regions to the northwest. Locations of fires over 40 ha can be seen in Fig. 1.
Average precipitation in the region in the year leading up to the event was 80%-90% of normal, and only about 70% of normal in the previous 4 months. The previous winter's low- and midelevation snowpack was less than 70% of average, and the early meltout caused an early green-up of vegetation. Below-average spring rains con- tributed to developing drought conditions and by mid- July the Palmer drought severity index showed the re-
gion to be under severe drought conditions (USDA For- est Service 2001).
Figure 2 summarizes the weather events of July through early September 2000. Figure 2a graphs the number of lightning strikes along with the number of large fire starts in the study area each day. Large fires are considered to be those of at least 40 ha. The lightning that occurred in early September was accompanied by sufficient rainfall to inhibit any new large fire starts. Figure 2b shows daily temperature, humidity, and pre- cipitation at Missoula, Montana.
Throughout mid- and late July the upper-level flow was dominated by a quasi-stationary 500-hPa high over the four-corners area of the southwestern United States,

OCTOBER 2004 H O A D L E Y E T A L
FIG. 3. Domain nests used for MM5 sitnulations of the 2000 fire season. Study area for verification purposes is a subset of domain 3. The horizontal resolution is 36 km in domain 01, 12 km in domain 02, and 4 km in domain 03.
with ridging extending northward into Montana and Ida- ho. Southwesterly flow into the area brought sufficient moisture to generate thunderstorms but most were high- based with little precipitation reaching the surface. From 12 to 15 July a series of dry lightning storms initiated hundreds of fires in central Idaho and western Montana. A relatively weak and isolated convective event over the southern Bitterroot Valley on 31 July ignited nu- merous additional fires (Fig. 2a) that would defy sup- pression efforts until widespread heavy rain came to the area in early September.
A cutoff, upper-level low developed offthe California coast between 7 and 10 August. As this low opened into a wave and moved over the northern Rockies the most intense lightning event of the summer occurred, gen- erating 23 additional new large fire starts in the study area. A cutoff low again developed off the California coast on 24 August and a negatively tilted 500-hPa ridge and associated southwesterly flow set up over western Montana. At the surface the winds shifted to southerly, bringing another surge of subtropical moisture into the area. This resulted in the final lightning event of the summer with 14 new large fires in the study area.
In early September a deep upper-level trough, which had extended from northwestern Canada along the west coast to the cutoff low off the California coast, moved through the region bringing widespread precipitation,
ranging from 2.5 to 6.5 mm. By 7 September most fires were under control, although several continued to burn into mid-September.
5. Model description
For this study the PSU-NCAR MM5, version 3.6, was employed. The MM5 is a nonhydrostatic mesoscale atmospheric model that uses the sigma-coordinate sys- tem. Use of sigma coordinates means that the vertical levels closely approximate the terrain at lower levels but relax to a model "top" defined at a specific pressure level of 100 hPa.
Figure 3 shows the domain nesting used for this study. Resolutions for domains 1, 2, and 3 are 36, 12, and 4 km, respectively. There are generally two limiting fac- tors regarding the finest spatial resolution that one can use. First, the physical equations are designed to work at the mesoscale, which in modeling is generally ac- cepted to be captured by a grid spacing between 10 and 1000 km. At resolutions of less than 10 km, assumptions used in various parameterizations may no longer be val- id. A second and possibly more often cited reason is the increase in computational needs when using higher resolution. For example, for a given area, a threefold increase in model resolution (i.e., going from 12- to 4- km grid spacing) requires a 27-fold increase in computer
1338 J O U R N A L O F A P P L I E D M E T E O R O L O G Y VOLUME 43
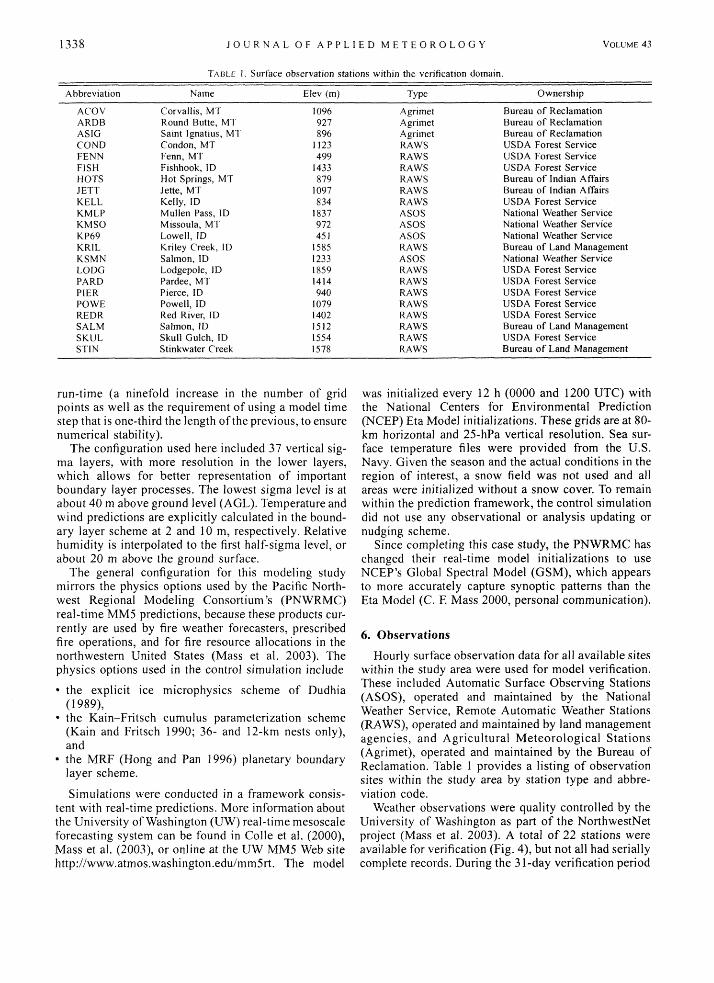
TABLE I . Surface observatron stattons wlthln the verlficatton domain.
Abbreviation Name EIev (m) Type Ownersh~p
ACOV ARDB ASlG COND FENN FISH HOTS J ETT KELL KMLP KMSO KP69 KRlL KSMN LODG PARD PIER POWE REDR SALM SKUL STIN
Corvallis, MT Round Butte, MT Saint lgnatius, MT Condon, MT Fenn, MT Fishhook, ID Hot Springs, MT Jette, MT KelIy, ID Mullen Pass, ID Missoula, MT Lowell, ID Kriley Creek, ID Salmon, ID Lodgepole, ID Pardee, MT Pierce, ID Powell, ID Red River, ID Salmon, ID Skull Gulch, ID Stinkwater Creek
Agrimet Agrilnet A gritnet RAWS RAWS RAWS RAWS RAWS RAWS ASOS ASOS ASOS RAWS ASOS RAWS RAWS RAWS RAWS RAWS RAWS RAWS RAWS
Bureau of Reclamation Bureau of Reclamation Bureau of Reclamation USDA Forest Service USDA Forest Service USDA Forest Service Bureau of Indian Affairs Bureau of Indian Affairs USDA Forest Service National Weather Service National Weather Service National Weather Service Bureau of Land Manageinent National Weather Service USDA Forest Service USDA Forest Service USDA Forest Service USDA Forest Service USDA Forest Service Bureau of Land Management USDA Forest Service Bureau of Land Managetnent
run-time (a ninefold increase in the number of grid points as well as the requirement of using a model time step that is one-third the length of the previous, to ensure numerical stability).
The configuration used here included 37 vertical sig- ma layers, with more resolution in the lower layers, which allows for better representation of important boundary layer processes. The lowest sigma level is at about 40 m above ground level (AGL). Temperature and wind predictions are explicitly calculated in the bound- ary layer scheme at 2 and 10 m, respectively. Relative humidity is interpolated to the first half-sigma level, or about 20 m above the ground surface.
The general configuration for this modeling study mirrors the physics options used by the Pacific North- west Regional Modeling Consortium's (PNWRMC) real-time MM5 predictions, because these products cur- rently are used by fire weather forecasters, prescribed fire operations, and for fire resource allocations in the northwestern United States (Mass et al. 2003). The physics options used in the control simulation include
the explicit ice microphysics scheme of Dudhia (1 9891, the Kain-Fritsch cumulus parameterization scheme (Kain and Fritsch 1990; 36- and 12-km nests only), and
* the MRF (Nong and Pan 1996) planetary boundary layer scheme.
Simulations were conducted in a framework consis- tent with real-time predictions. More information about the University of Washington (UW) real-time mesoscale forecasting system can be found in Colle et al. (2000), Mass et a]. (2003), or online at the UW MM5 Web site http://www.atmos.washington.edu/mm5rt. The model
was initialized every 12 h (0000 and 1200 UTC) with the National Centers for Environmental Prediction (NCEP) Eta Model initializations. These grids are at 80- km horizontal and 25-hPa vertical resolution. Sea sur- face temperature files were provided from the U.S. Navy. Given the season and the actual conditions in the region of interest, a snow field was not used and all areas were initialized without a snow cover. To remain within the prediction framework, the control simulation did not use any observational or analysis updating or nudging scheme.
Since completing this case study, the PNWRMG has changed their real-time model initializations to use NCEP's Global Spectral Model (GSM), which appears to more accurately capture synoptic patterns than the Eta Model (C. F. Mass 2000, personal communication).
6 . Observations
Hourly surface observation data for all available sites within the study area were used for model verification. These included Automatic Surface Observing Stations (ASOS), operated and maintained by the National Weather Service, Remote Automatic Weather Stations (RAWS), operated and maintained by land management agencies, and Agricultural Meteorological Stations (Agrimet), operated and maintained by the Bureau of Reclamation. Table 1 provides a listing of observation sites within the study area by station type and abbre- viation code.
Weather observations were quality controlled by the University of Washington as part of the NorthwestNet project (Mass et al. 2003). A total of 22 stations were available for verification (Fig. 4), but not all had serially complete records. During the 3 3-day verification period

OCTOBER 2004 H O A D L E Y E T A L . 1339
FIG. 4. Observation station locations within the study area. Table 1 lists station narrtes, type, and ownership. State line between ID and MT is given by the black line.
(25 July-24 August 2000) missing observations ranged from 12% at hour 18 to 3% at hour 24.
7. Results
Objective evaluation of temperature, relative humid- ity, wind speed, and wind direction was performed for all stations at 6-h model output intervals using tradi- tional point verification statistical techniques, including mean absolute error (MAE), root-mean-square error (rmse), and bias (mean error). Only the 0000 UTC runs were evaluated. Thus 24- and 48-h predictions are valid at 0000 UTC or 1800 local time and the 12- and 36-h predictions are valid at 1200 UTC or 0600 local time.
Results were computed for all stations in aggregate and then for each station individually. A specific case example was also presented for each weather parameter except wind speed to help to evaluate model perfor-
2 I
-8.00 6hr 12hr 18hr 24hr 30hr 36hr 42hr 48hr
Forecast Hour
FIG. 5 . Bias of modeled rninus observed differences in temperature for 36- (solid black line), 12- (solid gray line), and 4-km (dotted line) resolutions.
mance at differing resolutions in critical fire weather situations.
a. Temperature
Table 2 summarizes the results for temperature when all stations are taken in aggregate. The 12- and 36-h predictions roughly approximate minimum tempera- tures, while 24- and 48-h predictions are near the time of maximum temperature.
The differences in MAE between model resolutions are small, generally less than 1.5"C. This is within the acceptable error when forecasting fire danger and there- fore cannot be considered an operationally significant difference. On the other hand, the overall magnitude of MAE, ranging from 3.1" to 6.7"C, is greater than would be considered acceptable for fire danger forecasting.
Larger differences in MAE occur between verification time steps than between resolutions, on the order of 2"- 3°C. This is a reflection of the diurnal temperature bias of the model as discussed by Manning and Davis (1997). Figure 5 clearly shows this diurnal bias. A positive or warm bias of 0.7"-3.5"C occurs at forecast hours 12 and 36 (0600 local time on the first and second day). A negative, or cool bias of -3.6" to -6.6OC occurs at forecast hours 24 and 48 (1800 local time on the first and second day). These results show MM5 predicted minimum temperatures that are warmer than observed and maximum temperatures that are cooler than ob- served. In other words, the model predicted a diurnal
TABLE 2. Differences in temperature ( O C ) of modeled ininus observed for mean absolute error (MAE), root-mean-square error (rmse), and mean error (bias).
MAE Rrnse Forecast Local
Bias
hour tirne 36 km 12 km 4 ktn 36 km 12 km 4 km 36 km 12 km 4 krn

1340 J O U R N A L O F A P P L I E D M E T E O R O L O G Y VOLUME 43
TABLE 3. The percent of t ~ m e the MAE scores showed best and worst performance for tetnperature at each horizontal resolution of the model.
36 krn 12 km 4 km
Best 29.0 23.3 47.7 Worst 40.9 17.0 42.0
range 4"-10°C smaller than observed. Because temper- ature plays a critical role in fire ignition and spread the large errors in modeled diurnal patterns may greatly affect fire danger predictions.
To further evaluate the performance of the model at different resolutions, verification statistics were com- puted for each individual observation site. The percent of time the model performed best and worst at each resolution at each of the eight 6-h time steps was de- termined based on these scores. If there were no dif- ferences between the three resolutions one would expect that each resolution would come out best about 33% of the time. In this temperature test the 4-km resolution was best 48% of the time but was also worst most often at 42%. The 36 km was a close second for worst honors at 41% of the time (Table 3).
To illustrate the spatial distribution of differences in MAE, scores were averaged over all verification time steps and mapped (Fig. 6) . Contours were added using an inverse distance-weighted interpolation scheme in Arcview GIs software. The difference in error is gen- erally less than 1°C for any given station between spatial resolutions. Therefore, only MAE at the 4-km resolution is shown. Stations in the Clearwater Mountains of Idaho generally show errors in excess of 4°C. These obser- vation sites are located in narrow valleys surrounded by higher terrain, which is not well resolved by the model. These same stations also consistently show higher MAE scores at 4 km than at 36 km. Also showing large errors is Condon (COND). This site is in a broad valley but with very high mountains on both sides and two sig- nificant drainages nearby. It is likely that the subme- soscale flows of these drainages are not being captured by the model. This is supported by the bias statistics for that station, which indicate a strong (5'-8°C) warm model bias for minimum temperatures. One would ex- pect the drainage flow out of the mountains to result in colder minimum temperatures at this site. The smallest errors in the study are all at fairly high elevations, Mul- len Pass (KMLP) at 1837 m, Skull Gulch RAWS (SKUL) at 1554 m, and Kriley Creek RAWS (KRIL) at 1585 m.
b. Tenzperature example
Figure 7 shows observed and model temperature trends at Missoula, Montana, for the period from 0000 UTC 27 July (1800 local time 26 July) to 0000 UTC 30 July (1800 local time 29 July). During this time a ridge of high pressure was building over the area and
FIG. 6. Mean absolute error (MAE) in temperature by station av- eraged over ail verification time steps for 4-km domain. Contour interval is 1°C.
the observed maximum temperature at Missoula rose from 32" to 38OC. Such a rise in temperature can be critical to fire behavior because of the associated drop in relative humidity, which results in drying of fine fu- els.
In this case, the model showed a very slight warming trend but did not capture the magnitude of the high temperatures, especially on day 2. The diurnal bias of the model is quite obvious in this graph. It also can be seen that while the 4-km resolution appears to have a slight edge, especially in handling maximum tempera- tures, the differences in MAE among the three resolu- tions are minor.
Overall, it can be concluded that for temperature alone there is little to be gained from increasing MM5 model resolution within the ranges tested. Although, as seen in Table 3, the 4-km domain has the best MAE
5 - - - - ---- - - I
0 1 5 9 13 17 21 25 29 33 37 42 46
Forecast Hour
FIG. 7. Temperature on 27-30 Jul at Mlssoula, MT. Observed ( th~ck black hne), and modeled from 36- (thin black I~ne), 12- (thtn gray line), and 4-km (dashed 11ne) domams.
OCTOBER 2004 H O A D L E Y E T A L . 1341
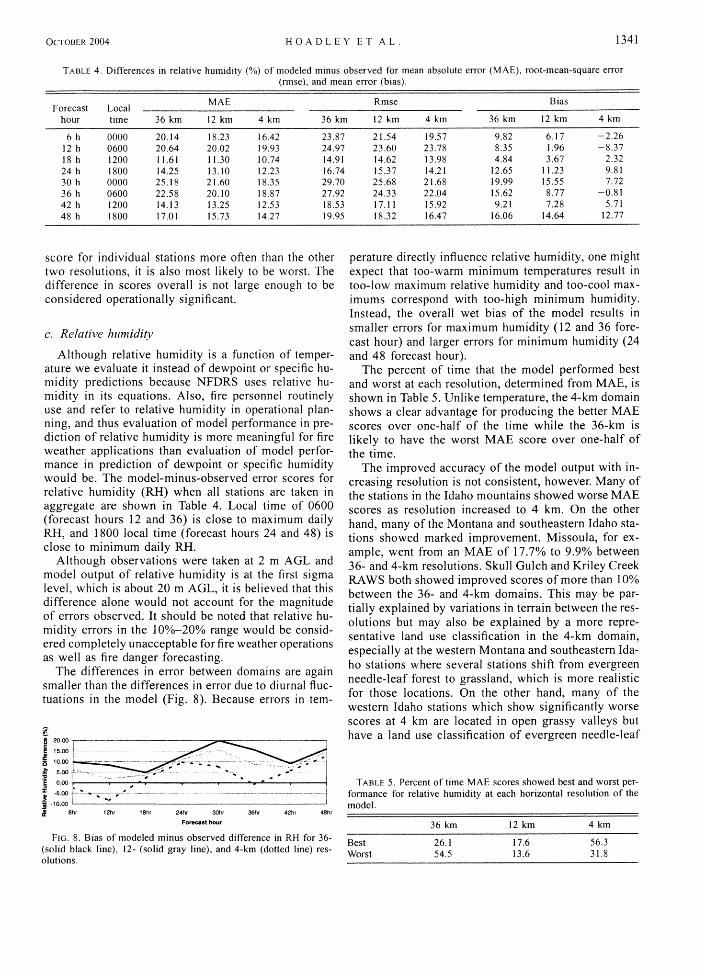
TABLE 4. D~n'erences In relatlve hu~nld~ty (%) of rnodeled rnlnus observed for mean absolute error (MAE), root-mean-square error (rinse), and inean error (blas).
MAE Rmse Bias Forecast Local
hour time 36 km 12 km 4 km 36 km 12 km 4 km 36kin 12km 4 km
score for individual stations more often than the other two resolutions, it is also most likely to be worst. The difference in scores overall is not large enough to be considered operationally significant.
c. Relative hz~nl idi~y
Although relative humidity is a function of temper- ature we evaluate it instead of dewpoint or specific hu- midi ty predictions because NFDRS uses relative hu- midity in its equations. Also, fire personnel routinely use and refer to relative humidity in operational plan- ning, and thus evaluation of model performance in pre- diction of relative humidity is more meaningful for fire weather applications than evaluation of model perfor- mance in prediction of dewpoint or specific humidity would be. The model-minus-observed error scores for relative humidity (RH) when all stations are taken in aggregate are shown in Table 4. Local time of 0600 (forecast hours 12 and 36) is close to maximum daily RH, and 1800 local time (forecast hours 24 and 48) is close to minimum daily RH.
Although observations were taken at 2 m AGL and model output of relative humidity is at the first sigma level, which is about 20 m AGL, it is believed that this difference alone would not account for the magnitude of errors observed. It should be noted that relative hu- midity errors in the 10%-20% range would be consid- ered completely unacceptable for fire weather operations as well as fire danger forecasting.
The differences in error between domains are again smaller than the differences in error due to diurnal fluc- tuations in the model (Fig. 8). Because errors in tem-
z a m@
$ om - - --- -- - -- - - ..
3 6hr 1Zhr 18hr 24hr 30hr 36hr 42hr 4Bhr
Forecast hour
FIG. 8. Bias of modeled minus observed difference in RH for 36- (solid black line), 12- (solid gray line), and 4-km (dotted line) res- olutions.
perature directly influence relative humidity, one might expect that too-warm minimum temperatures result in too-low maximum relative humidity and too-cool max- imums correspond with too-high minimum humidity. Instead, the overall wet bias of the model results in smaller errors for maximum humidity (12 and 36 fore- cast hour) and larger errors for minimum humidity (24 and 48 forecast hour).
The percent of time that the model performed best and worst at each resolution, determined from MAE, is shown in Table 5. Unlike temperature, the 4-km domain shows a clear advantage for producing the better MAE scores over one-half of the time while the 36-km is likely to have the worst MAE score over one-half of the time.
The improved accuracy of the model output with in- creasing resolution is not consistent, however. Many of the stations in the Idaho mountains showed worse MAE scores as resolution increased to 4 km. On the other hand, many of the Montana and southeastern Idaho sta- tions showed marked improvement. Missoula, for ex- ample, went from an MAE of 17.7% to 9.9% between 36- and 4-km resolutions. Skull Gulch and Kriley Creek RAWS both showed improved scores of more than 10% between the 36- and 4-km domains. This may be par- tially explained by variations in terrain between the res- olutions but may also be explained by a more repre- sentative land use classification in the 4-km domain, especially at the western Montana and southeastern Ida- ho stations where several stations shift from evergreen needle-leaf forest to grassland, which is more realistic for those locations. On the other hand, many of the western Idaho stations which show significantly worse scores at 4 km are located in open grassy valleys but have a land use classification of evergreen needle-leaf
TABLE 5. Percent of time MAE scores showed best and worst per- formance for relative humidity at each horizontal resolution of the model.
Best 26.1 17.6 56.3 Worst 54.5 13.6 3 1.8

1342 J O U R N A L O F A P P L I E D M E T E O R O L O G Y VOLUME 43
FIG. 9. MAE in RH by station averaged over all verification time steps for 4-km domain. Contour interval is 2%.
forest at all resolutions. A more complete discussion of the land use classification is presented below.
The spatial distribution of 4-km MAE scores for rel- ative humidity, averaged over all time intervals, is shown in Fig. 9. As with temperature the smallest errors appear to be associated with those stations in broad open valleys or exposed higher-elevation sites.
d. Relative hzrmidity exantple
During the 2000 fire season, minimum relative hu- midity at Missoula ranged between 10% and 20% until late August when humidity began to rise (Fig. 2b). These low values were related to very dry fuel moistures in the area. Maximum relative humidity can be just as critical to fire danger, however, because when humidity shows poor recovery (remains low overnight) fires can burn actively through the night. When humidity recov- ery is good, approaching 90%-loo%, the fire will die down as fine fuel moisture increases. Low maximum humidity also results in fuels starting out drier in the morning after a night of poor humidity recovery, leading to more active burning throughout the day.
Two instances of particularly poor humidity recovery occurred at Missoula during the summer of 2000. Both coincided with the passage of a weak upper-level trough. Winds associated with these trough passages allowed mixing to continue through the night so that maximum humidity was lower than would occur on a calm night. At a valIey station, such as Missoula, humidity will generally approach 90%-100% at the time of minimum temperature in the early morning. On the mornings of 31 July and 15 August, however, relative humidity re-
0 I
0 4 8 12 16 20 24 28 32 36 40 44 48
Forecast hour
FIG. 10. Relative humidity on 3 1 Jul-2 Aug (0000-0000 UTC) at Missoula, MT, during a weak upper-level trough passage. Observed (thick black line) and modeled from 36- (thin black line), 12- (gray line), and 4-kin (dashed line) domains.
mained below 60% even at the coolest time of day. In both cases, modeled humidity for all resolutions begins higher than observed and never reaches the daytime lows. In the first case (Fig. lo), the 4-km resolution underpredicts the first maximum while the 36- and 12- km resolutions overpredict and reach maximum far too early. All resolutions overpredict the day-2 maximum. In the second case (Fig. 11) the resolution of 4 km is again low while the 12 and 36 km are high and early.
In general, MM5 tends to begin humidity recovery too soon, reaching maximum as much as 6 h before the observed peak, and keeps humidity high all night. Be- cause of its impact on fuel moisture in the shorter-time- lag fuels (1 and 10 h), the timing of humidity recovery is very critical to fire danger prediction.
e. Wind speed
Comparison of modeled winds with point observation is problematic because model winds are spatial means at a specific time while observed winds are temporally averaged but spatially explicit. Nevertheless, in order to gain some understanding of the usefulness of model winds as input to the NFDRS an attempt has been made to approximate point values for comparison. Modeled surface winds, interpolated to 10 m AGL, are compared with observations with anemometer heights of 10 m at ASOS stations, 6 m at RAWS sites, and about 2 m at Agrimet sites. Observed winds for the RAWS and Agri-
FIG. 1 1 . Relative humidity during a weak upper-level trough pas- sage on 15- 17 Aug at Missoula, MT. Observed (thick black line) and modeled from 36- (thin black line), 12- (gray line), and 4-km (dashed line) domains.

H O A D L E Y E T A L . 1343
6hr 12hr 18hr 24hr 30hr 36hr 42hr 48hr
Forecast hour
FIG. 12. Bias of modeled minus observed differences in wind speed for 36- (solid black line), 12- (solid gray line), and 4-km (dotted line) resolutions.
met sites were interpolated to 10 m using a logarithmic scheme (Whiteman 2000, 306-307). The modeled mi- nus observed error scores for wind speed when all sta- tions are taken in aggregate are shown in Table 6. MAE scores range from 1.09 to 1.83 m s-I . This is somewhat higher than would be preferred for fire weather fore- casting but is not unreasonably high. The bias in wind speed is almost always positive-that is, the modeled winds are stronger than observed (Fig. 12).
The percent of time that the model performed best and worst at each resolution, determined from MAE, is shown in Table 7. Once again, the 4-km resolution is most likely to have the lowest MAE score while the 36- km resolution is most likely to have the highest.
Figure 13 shows the spatial distribution of MAE scores at the 4-km resolution. The highest scores occur at Kriley Creek (KRIL), located on an exposed knoll, and Pierce (PIER), which is located in a narrow valley. Siting of RAWS stations with respect to vegetation may influence the accuracy of the wind speed observations because of sheltering. Also showing fairly high scores are Hot Springs (HOTS) and Jette (JETT). These errors may be influenced by the proximity of those stations to the 495-km2 Flathead Lake near the northern edge of the study area. On the low end of the MAE score spec- trum are stations such as Powel (POWE) and Fishook (FISH) in narrow valleys, Mullen Pass (KMLP) exposed and at high elevation, and Corvallis in a broad open valley.
f: Wiind speed example
Figure 14 shows an event recorded in Missoula when winds remained above 5 m s-I for 6-8 h during the evening of 4 August 2000 (forecast hours from 19 to
TABLE 7. Percent of time MAE scores showed best and worst performance for wind speed at each horizontal resolution of the model.
Best 15.9 37.5 46.0 Worst 47.2 18.8 34.1

1344 J O U R N A L O F A P P L I E D M E T E O R O L O G Y VOLUME 43
FIG. 13. MAE for wind speed by station averaged over all verification time steps for 4-km domain. Contour interval is 0.2 in s-I.
about 26). An upper-level trough moved through the area during this period with winds at the 500-hPa level of 15-20 m s-I. A surface low was centered just east of the area with a fairly strong pressure gradient over western Montana and northern Idaho.
While the model captures the trend of increasing winds, it is unable to resolve the peak magnitudes of the wind at any resolution. The 4-km domain performs slightly better in sustaining the wind through the period but underpredicted the peak by 4-8 m s- ' for several hours. This magnitude of error is quite significant for fire fighting operations.
g. Wind direction
15 17 19 21 23 25 27 29 31 33 35 37 39 41 43 45 47
FOT(KBSI how
FIG. 14. Surface winds on 4-5 Aug 2000 at Missoula, MT. Ob- served (thick black line) and modeled from 36- (thin black line), 12- (gray line), and 4-km (dashed line) domains.
m s- ' . Depending on the time of day, this resulted in a significant reduction of available observations. In many cases there were not enough observations to make a meaningful sample for an individual station after light wind observations were deleted.
Statistics for modeled minus observed wind direction are shown in Table 8. The 4-km resolution shows con- sistently lower scores for MAE and rrnse than the 12- or 36-km domains, although the 12-km resolution does slightly better at 48 h. MAE scores improve at 24 and 48 h. This may be reflecting stronger afternoon winds. Note that bias scores are generally positive, which in- dicates modeled winds are almost always clockwise from observed, which may be because the model con- sistently predicts stronger wind (the stronger Coriolis effect associated with stronger winds results in a greater deflection from perpendicular to the pressure gradient). The 4-km results show consistently lower bias scores than the other two domains. This is shown graphically in Fig. 15.
Table 9 shows the percentage of time each model resolution performs best and worst on MAE scores for wind direction. The 4-krn runs were best over one-half of the time and 36-km runs worst over one-half of the time, indicating that increased resolution improves wind direction predictions.
Verification of wind direction is somewhat less Figure 1 6 shows the spatial distribution of MAE straightforward than for other parameters. It is necessary scores for wind direction at 4-km spatial resolution. In to eliminate all observations of less than 1 m s-I wind general the MAE scores are fairly large, ranging from speed because mechanical anemometers, such as those near 40" to as much as 98". The highest scores occur available for this study, have stall speeds of about 1 over the complex terrain of the Clearwater Mountains
TABLE 8. Differences in wind direction (") between modeled minus observed for mean absolute error (MAE), root-mean-square error (rinse), and mean error (bias).
Forecast Local MAE Rmse Bias
hour time 36 km 12 km 4 km 36 km 12 km 4 ktn 36 km 12 kin 4 km

OCTOBER 2004 H O A D L E Y E T A L . 1345
6t-i 12hr 18hr 24hr 35hf 38hr 42hr 48hr
F0nu.t hwr
FIG. 15. Bias of modeled mmus observed wind direction for 36- (solid black line), 12- (solid gray line), and 4-km (dotted line) res- olutions.
in Idaho. The lowest score at Mullen Pass (KMLP) also occurs in an area of rugged terrain, but in a more ex- posed high-elevation location.
8. Discussion
The only significant improvement in predictive skill as the model resolution increases from 36 to 4 km was observed in wind direction. This shows that the influ- ence of terrain on turning wind is clearly captured by the model. Predicted values of temperature, relative hu- midity, and wind speed did not improve significantly as the model resolution increased. However, comparison of MAE scores showed that the 4-km resolution is most likely to have the most accurate prediction for all pa- rameters though i t is also most likely to have the worst score for temperature. The 36-km resolution is most likely to have the worst MAE score for relative humid- ity, wind speed, and wind direction.
Because land use affects soil moisture initializations and surface roughness, and thus energy fluxes, we in- vestigated the representation of land use as a possible reason for lack of increasing skill with resolution. Figure 17 shows the MM5 land-use categories within the study area at the 4-, 12-, and 36-km resolutions. The area is dominated by categories of grassland (orange) and ev- ergreen needle-leaf (dark green) at all scales. While de- tail improves with increasing spatial resolution, causing overall spatial patterns in predicted values to improve, the land-use categories at observation locations, where model comparisons are made, change little with increas- ing resolution. In some places the model uses land cover types that are incorrect (e.g., grassland instead of forest), but for the most part the land cover types in the model are consistent with what is known about the area. Some isolated instances of improved model skill where land cover type becomes more representative with increased resolution were noted.
The configuration of MM5 for this case study as- signed a value of soil moisture that represents the sea- sonal average for each cover type, which is a common procedure for real-time simulations. Because soil mois- ture conditions during the 2000 fire season were much
TABLE 9. Percent of time MAE scores showed best and worst performance for wind direction at each horizontal resolution of the model.
Best 20.4 26.3 53.3 Worst 55.3 19.7 27.0
that adjusting the seasonal-averaged values with a daily drought index greatly improved values of relative hu- midity at the surface. Other values, primarily wind speed, were degraded. Lower moisture content led to surface heating, which in turn increased the strength of the thermal circulations, which added to the strong wind bias. This suggests that inclusion of more realistic soil moisture schemes could improve the overall simulation.
The influence of terrain on shading is not considered in the simulation. While invoking terrain shading at coarse spatial resolutions is not common, the deep relief of the study region and its influence on incidence of solar radiation may affect temperature and relative hu- midity in ways that are not captured by the model. The NFDRS, however, does account for slope in its calcu- lations of burning indices. Therefore, we expect that some of the errors found in MM5's ground-level fields may be compensated for in the NFDRS calculations that will be evaluated in the next phase of this project.
9. Conclusions
These preliminary results from a case study of the 2000 fire season have shown some valuable application to fire danger prediction. While standard point-by-point analysis was used for this study, we believe that errors
- drier than normal, we believe this approximation to be FIG. 16. MAE in wind direction by station averaged over all a source of error. In a cursory study in Florida, we found verification time steps for 4-km domain. Contour interval is 10"

J O U R N A L O F A P P L I E D M E T E O R O L O G Y VOLUME 43
m$ Urban
Dryland Qop Past, Irrg Crop Past.
r' O.*w,- 3 CropiGr ass Mosaic k g CropjWood Mosaic c: Grassland
Shrubland Deciduous Broadleaf
gll Evergreen NeedleaF Mixed Forest Water
FIG. 17. MM5 land-use categories within the study area in each of the rnodeling domains: (a) 36, (b) 12, and (c) 4 km. Yellow dots indicate locations of observations stations.
resulting from position and timing are minimized be- cause the study period was during the summer with only a few relatively weak and slow-moving systems passing through the domain.
In general, MM5 overpredicts temperature and rela- tive humidity at night and underpredicts temperature and relative humidity during the day by values that are great- er than acceptable for fire danger prediction. Bias re- moval applied to the MM5 forecasts may offer an op- portunity to reduce or eliminate these errors. Our results show much higher bias at 24 and 48 h, which correspond locally to maximum and minimum temperature time, than at 18 and 36 h, which correspond to transitions in the diurnal cycle. This leads us to conclude that a simple debiasing scheme wou Id greatly improve accuracy, es- pecially for temperature and humidity forecasts. In ad- dition, MM5 predicts the timing of humidity recovery
at night several hours in advance of observed maximum and holds it up through the night, which limits useful application of relative humidity predictions to fire dan- ger. Because this was a drought period in the study area and climatological values were used for the soil moisture initialization, we believe that much of this error could be corrected by adjusting the soil moisture initialization to reflect more realistic values. MM5 overpredicts sur- face wind speed at all hours of day and night but, while the magnitudes of error are greater than desired for a good fire danger forecast, they are within an acceptable limit. The model does not, however, do well with pre- dicting strong winds sustained over short periods that are critical to fire-fighting operations. Wind direction predictions are biased in the clockwise direction, prob- ably because predicted wind speeds are stronger than observed. In general, however, errors in wind direction

OCTOBER 2004 H O A D L E Y E T A L . 1347
are within a quadrant (90°), especially when predicted at 4-km spatial resolution, which is within an acceptable range for fire weather forecasting.
Accuracy of model-predicted values did not improve significantly as model resolution increased, except for wind direction. Because terrain and land-use categories are two values that change as resolution increases, we speculated on their influence. While land-use categories are generally reasonable, their increasing spatial reso- lution does not appear to affect model-derived values at selected points. Improving the soil moisture assigned to each land-use category, however, could improve mod- el results. The effect of shading by terrain also may be considered a model improvement in mountainous re- gions.
The MM5 is being employed in a number of geo- graphic areas around the United States to support fire weather forecasting. Forecasters who know how to in- terpret spatial patterns and trends have found MM5 to be significantly more accurate than other guidance tools. Because the model output is now being coupled with fire danger and fire spread models, however, its point- by-point accuracy during fire season has become im- portant. While we found errors in the model output, traditional point verification alone does not fully assess the usefulness of the model for fire danger prediction. Our next step is to determine whether the fire danger and fire spread models can compensate for some of the coarseness or inaccuracies that were found.
Acbzowledgments. Funding for this work was pro- vided by the U.S. Department of Agriculture and U.S. Department of Interior Joint Fire Science Program. The authors are grateful for assistance from Trent Piepho in solving software and hardware issues during the MM5 runs on our multiprocessing PC cluster, to Steve McKay for his helpful review of statistical methods, and to Sim Larkin, John Snook, Miriam Rorig, and Cliff Mass for their review of a preliminary draft.
REFERENCES
Cairns, M. M., and J. Corey, 1998: An application of the MM5 to modeling high winds in complex terrain: A case study in the eastern Sierra. Western Region Tech. Amchtnent 98-13, 4 pp. [Available online at http:iiwww.wrh.noaa.gov/wrhq/98TAs/98 13.1
Cohen, J. D., and J. E. Deeming, 1985: The National Fire Danger
Rating System: Basic equations. USDA Forest Service, Pacific Southwest Forest and Range Experiment Station, GTR PSW-82, 16 PP,
Colle, B. A., K. J . Westrick, and C. F. Mass, 1999: Evaluation of the MM5 and Eta- 10 precipitation forecasts over the Pacific North- west during the cool season. Wea. Forecasting, 14, 137- 154.
----, C. F. Mass, and K. J. Westrick, 2000: MM5 precipitation ver- ification over the Pacific Northwest during the 1997-99 cool seasons. Wea. Forecasting, 15, 730-744.
-- , , and D. Ovens, 2001 : Evaluation ofthe timing and strength of MM5 and Eta surface trough passages over the eastern Pacific. Wea. Forecasting, 16, 5.53-572.
Cox, R., B. L. Bauer, and T. Smith, 1998: A mesoscale model inter- comparison. Bull. Amer. Meteor. Soc., 79, 265-283.
Davis, C., and E Can; 2000: Summary of the 1998 workshop on mesoscale rnodel verification. Bull. Amer. Meteor. Soc., 81,809- 819.
Deeming, J . E., R. E. Burgan, and J. D. Cohen, 1977: The National Fire Danger Rating system-1978. USDA Forest Service Gen- eral Tech. Rep. INT-39, USDA Forest Service Intermountain Forest and Range Experiment Station, Ogden, UT, 63 pp.
Dudhia, J., 1989: Nu~nerical study of convection observed during the Winter Monsoon Experiment using a mesoscale two-dimensional model. J. Atmos. Sci., 46, 3077-3107.
Gritnit, E. P., and C. F. Mass, 2002: Initial results of a mesoscale short-range ensemble forecasting system over the Pacific North- west. Wea. Forecasting, 17, 192-205.
Hong, S.-Y., and H.-L. Pan, 1996: Nonlocal boundary layer vertical diffusion in a medium-range forecast tnodel. Mon. Wea. Rev., 124, 2322-2339.
Kain, J. S., and J. M. Fritsch, 1990: A one-dimensional entraining/ detraining plume model and its application in convective param- eterization. J. Atmos. Sci., 47, 2784-2802.
Manning, K. W., and C. A. Davis, 1997: Verification and sensitivity experiments for the WISP94 MM5 forecasts. Wea. Forecasting, 12, 719-735.
Mass, C. F., D. Ovens, K. J. Westrick, and B. A. Colle, 2002: Does increasing horizontal resolution produce more skillful forecasts? Bull. Amer. Meteor. Soc., 83, 407-430.
-, and Coauthors, 2003: Regional environmental prediction over the Pacific Northwest. Bull. Amer. Meteor. Soc., 84, 1353-1366.
McQueen, J. T., R. R. Draxler, and G. D. Rolph, 1995: Influence of grid size and terrain resolution on wind field predictions from an operational ~nesoscale model. J. Appl. Meteor., 34, 2166- 2 18 1.
Salvador, R., J . Calbo, and M. M. Millan, 1999: Horizontal grid size selection and its influence on tnesoscale tnodel sunulations. J. Appl. Meteor., 38, 13 1 1-1329.
USDA Forest Service, cited 2000: The extent and effects of the fires of 2000: A preliminary assessment. [Available online at http:/i www.fs.fed.us/rl/nfp/old/preliminaryassessmen~index.html.]
White, B. G., J. Paegle, W. J . Steenbugh, J. D. Horel, R. T. Swanson, L. K. Cook, D. J. Onton, and J. G. Miles, 1999: Short-tenn forecast validation of six models. Wea. Forecasting, 14,84-107.
Whiteman, C. D., 2000: Mountain Meteorology: Fundamentals and Applications. Oxford University Press, 355 pp.