Embed Size (px)
Citation preview

JOURNAL OF REGIONAL SCIENCE, VOL. 48, NO. 1, 2008, pp. 29–65
A SEARCH FOR MULTIPLE EQUILIBRIA IN URBANINDUSTRIAL STRUCTURE∗
Donald R. DavisDepartment of Economics, Columbia University and NBER, 420 W. 118th
St. MC 3308, New York, NY 10027.
David E. WeinsteinDepartment of Economics, Columbia University and NBER, 420 W. 118th
St. MC 3308, New York, NY 10027. E-mail: [email protected]
ABSTRACT. Theories featuring multiple equilibria are widespread across economics.Yet little empirical work has asked if multiple equilibria are features of real economies.We examine this in the context of the Allied bombing of Japanese cities and industries inWorld War II. We develop a new empirical test for multiple equilibria and apply it to datafor 114 Japanese cities in eight manufacturing industries. The data provide no supportfor the existence of multiple equilibria. In the aftermath even of immense shocks, a citytypically recovers not only its population and its share of aggregate manufacturing, buteven the industries it had before.
1. MULTIPLE EQUILIBRIA IN THEORY AND DATA
The concept of multiple equilibria is a hallmark of modern economics, onewhose influence crosses broad swathes of the profession. In macroeconomics, itis offered as an underpinning for the business cycle (Cooper and John, 1988).In development economics it rationalizes a theory of the “big push” (Murphy,Shleifer, and Vishny, 1988). In urban and regional economics, it provides a foun-dation for understanding variation in the density of economic activity acrosscities and regions (Krugman, 1991). In the field of international economics, ithas even been offered as a candidate explanation for the division of the globaleconomy into an industrial North and a nonindustrial South, as well as the pos-sible future collapse of such a world regime (Krugman and Venables, 1995).1
∗The authors want to thank Kazuko Shirono, Joshua Greenfield, and Heidee Stoller forresearch assistance. Richard Baldwin, Andrew Bernard, Steven Brakman, Harry Garretsen, JamesHarrigan, and Marc Schramm made helpful suggestions. We are grateful to the National ScienceFoundation for its support of this research. We appreciate the financial support of the Center forJapanese Economy (Grant 0214378) and Business at Columbia University. Weinstein also wants tothank the Japan Society for the Promotion of Science for funding part of this research, and SeiichiKatayama for providing him with research space and access to the Kobe University library.
Received: May 2006; accepted: April 2007.1A simple indication of the flood of work in these areas is that the Journal of Economic
Literature has featured three surveys of segments of this literature in recent years (see Matsuyama,
C© Blackwell Publishing, Inc. 2008.Blackwell Publishing, Inc., 350 Main Street, Malden, MA 02148, USA and 9600 Garsington Road, Oxford, OX4 2DQ, UK.
29

30 JOURNAL OF REGIONAL SCIENCE, VOL. 48, NO. 1, 2008
The theoretical literature has now firmly established the analytic founda-tions for the existence of multiple equilibria. However, theory has far outpacedempirics.2 The most important empirical question arising from this intellectualcurrent has almost not been touched: Are multiple equilibria a salient feature ofreal economies? This is inherently a difficult question. At any moment in time,one observes only the actual equilibrium, not alternative equilibria that existonly potentially. If the researcher observes a change over time, it is difficult toknow if this change reflects a shift between equilibria due to temporary shocksor a change in fundamentals that are perhaps not yet well understood by theresearcher. If a cross section reveals heterogeneity that seems hard to explainby the observed variation in fundamentals, it is hard to know if this may betaken to confirm theories of multiple equilibria or if it suggests only that ourempirical identification of fundamentals falls short.
Testing for multiple equilibria is also difficult for other reasons. The theoryof multiple equilibria relies on the existence of thresholds that separate distinctequilibria. In any real context, it is difficult to identify such thresholds or thelocation of unobserved equilibria. In addition, a researcher may look for exoge-nous shocks, but these need to be of sufficient magnitude to shift the economyto the other side of the relevant threshold and they need to be clearly temporaryso that we can see that we fail to return to the status quo ante. A researcher israrely so blessed.
Davis and Weinstein (2002) initiated work that addresses the practicalsalience of multiple equilibria in the context of city sizes. The experiment con-sidered was the Allied bombing of Japanese cities during World War II. Thisdisturbance was exogenous, temporary, and one of the most powerful shocks torelative city sizes in the history of the world. Hence, it is an ideal laboratoryfor identifying multiple equilibria. That paper examined city population dataand, in the context of the present paper, may be viewed as having answeredtwo questions. Do the data reject a null that city population shares have aunique stable equilibrium? Do the data support a stated condition that wouldbe sufficient to establish multiple equilibria in city population shares? In bothcases, our answer was “no” we could not reject a unique stable equilibriumnor could we establish the sufficient condition for multiple equilibria in citypopulation shares.
The present paper goes beyond Davis and Weinstein (2002) in several di-mensions. First, we examine new and more detailed data. In addition to thecity population data of the first paper, we consider data on aggregate city
1995; Anas, Arnott, and Small 1998; and Neary, 2001). Recent major monographs in economicgeography include Masahisa Fujita, Paul R. Krugman, and Anthony Venables (1998), Fujita andJacques Thisse (2002), and Richard Baldwin et al. (2003).
2Cooper (2002) discusses issues of estimation and identification in the presence of multipleequilibria as well as surveying a selection from the small number of papers that seek to test empir-ically for multiple equilibria in specific economic contexts. We view these as welcome contributionsto understanding a difficult problem, but also believe much remains to be done. Andrea Moro (2003)considers multiple equilibria in a statistical discrimination labor model.
C© Blackwell Publishing, Inc. 2008.

DAVIS AND WEINSTEIN: A SEARCH FOR MULTIPLE EQUILIBRIA 31
manufacturing and city-industry data for eight manufacturing industries. Thisis the first paper, to our knowledge, that tests whether the location of produc-tion is subject to multiple equilibria. Moreover, the detailed industry data isimportant because multiple equilibria may well arise at one level of aggrega-tion even if not at another. For example, physical geography may act stronglyto determine relative city populations or even relative sizes of city manufactur-ing, but multiple equilibria may yet arise in particular manufacturing indus-tries. Subject to the level of detail in the available data, we can consider thisquestion.
The second important advance over Davis and Weinstein (2002) is that weprovide a sharper contrast between the implications of models of unique andmultiple equilibria, one that naturally suggests empirical implementation in aframework of threshold regression. This new approach no longer requires thatwe treat unique equilibrium as the null, hence gives a greater opportunity formultiple equilibria to demonstrate their empirical relevance. Moreover, subjectto the restrictions underlying our analysis, we now examine necessary (ratherthan sufficient) conditions for multiple equilibria. Hence, a failure to find evi-dence of these conditions would be a more powerful rejection of the theory ofmultiple equilibria in this context. The methods developed in this paper to testfor multiple equilibria may have application across a broad range of fields.
The present paper delivers a clear message: The data prefer a model witha unique stable equilibrium. Faced even with shocks of frightening magnitude,there is a strong tendency for cities to recover not only their prior share ofpopulation and manufacturing in aggregate, but even the specific industriesthat they previously enjoyed. Our tests provide no support for the hypothesisof multiple equilibria.3
These results are highly relevant for policy analysis. Theories of multipleequilibria carry within them an important temptation. If multiple equilibria arepossible, it is tempting to intervene to select that deemed most advantageousby the policymaker. If thresholds separate radically different equilibria, thenthe resolute policymaker can change the whole course of regional developmentor strongly affect the industrial composition of a region even with limited andtemporary interventions. Implicitly, such views are at the base of regional andurban development policies in Europe, the United States, and elsewhere.4
3It is crucial to keep in mind that the broad structure of the models applied to the studyof multiple equilibria rarely suffice for this phenomenon—multiple equilibria also depend on pa-rameter values. Hence, a rejection of multiple equilibria would not be a rejection of the underlyingmodel of economic geography. Moreover, the fact that such models allow the possibility of multipleequilibria, but do not imply them, also underscores the idea that tests for the salience of multipleequilibria must be conducted directly in the context of interest. Our results are offered only as acontribution to what we hope will be a broader research effort to examine the salience of multipleequilibria in a wide variety of contexts.
4Baldwin et al. (2003) provide a thorough and lucid analysis of the policy issues raised bythe new economic geography. They refer to the possibility of spatial catastrophes as the “mostcelebrated” feature of Krugman’s core-periphery model (p. 35).
C© Blackwell Publishing, Inc. 2008.

32 JOURNAL OF REGIONAL SCIENCE, VOL. 48, NO. 1, 2008
Our results provide a strong caution against the idea that one may uselimited and temporary interventions to select equilibria with large and perma-nent effects on city development. We confirm on population and city-aggregatemanufacturing data that such aggregate measures of activity in cities are highlyrobust to temporary shocks even of immense size. Perhaps this is not so sur-prising given that natural geographic features may have a very strong influ-ence on aggregate activity (Rappaport and Sachs, 2001). However, it is muchharder to believe that these visible features of geography impose the same di-rect constraints on the size of individual industries. Here, the theory of multipleequilibria should emerge in full force. The fact that cities have a very strongtendency to return not only to the prior level of manufacturing activity but alsoto recover the specific industries that previously thrived there even in the af-termath of overwhelming destruction is very strong evidence that temporaryinterventions of economically relevant magnitude are extremely unlikely to al-ter the course of aggregate manufacturing or even to strongly affect industrialstructure in a given locale. Small and temporary interventions to reap largeand permanent changes in levels and composition of regional economic activityis an idea that does not find support in the data.
2. THEORY
Krugman (1991) develops what has come to be known as the “core-periphery model,” which provides a theoretical framework for the empiricalexercise we undertake. Krugman considers a country with two regions that aresymmetric in all fundamentals. Each location has a fixed quantity of immo-bile factors dedicated to production of a constant returns, perfect competition,homogeneous good termed “agriculture.” There is also a labor force mobile be-tween regions that produces an increasing returns, monopolistic competitionset of differentiated varieties in what is termed “manufacturing.” There arecosts of trade only in the manufactured good. With only two regions, symmet-rically placed, the state of the system can be summarized by the share of themobile manufacturing labor force in Region 1, which we can term S. Mobilelabor is assumed to adjust between regions according to a myopic Marshallianadjustment determined by instantaneous differences in real wages in each ofthe regions.
By symmetry of the underlying fundamentals, S = 1/2, that is, equal regionsizes, is always an equilibrium (although it need not be stable). The symmetricequilibrium could be globally stable, as illustrated in Figure 1. However, the keynovelty of Krugman’s paper concerns the possibility of asymmetric equilibria,ones in which manufacturing is concentrated in a single region. The spatialequilibrium is viewed as a contest between centripetal forces pulling economicactivity together and centrifugal forces pushing economic activity apart. Therelative strength of these forces varies with S, the share of the mobile laborforce in Region 1. The mobile labor force itself provides the source of demand for
C© Blackwell Publishing, Inc. 2008.

DAVIS AND WEINSTEIN: A SEARCH FOR MULTIPLE EQUILIBRIA 33
S
SΩ
0 1
: Stable EquilibriumS: Region 1 Manufacturing Share
FIGURE 1: Globally Stable Unique Equilibrium.
locally produced manufactured products that can make regional concentrationself-sustaining.
Krugman found it convenient to focus on examples of equilibria either withperfect symmetry or complete concentration of manufactures. However, giventhat there are many potential types of centrifugal and centripetal forces, aslightly richer model is perfectly capable of admitting multiple stable equilibriawithout complete concentration. For our purposes, it is convenient to illustrateour approach in just such a case. As above, let S be the value of manufacturingin Region 1 expressed as a share of manufacturing in all of Japan, and S beits rate of change. Figure 2 exhibits three stable equilibria (indicated by +1, , and + 3), as well as two thresholds (indicated by b1 and b2).
We can now use Figure 2 to illustrate the key ideas underlying our empiricalwork. For concreteness, assume we are initially in the symmetric equilibrium(), and consider the impact of shocks to S. If these shocks are small, that is,do not shift S out of the range (b1, b2), then local stability of the symmetricequilibrium insures that in the aftermath of the shocks, manufacturing sharesreturn to their original magnitudes. This is why an empirical test of thesetheories requires that shocks be large: Small shocks mimic the effects of aglobally stable equilibrium, making it difficult to know if we are in the worldof Figure 1 or Figure 2.
Now consider, for example, a large negative shock that pushes S below thethreshold b1 in Figure 2. The manufacturing share of Region 1 will thereafterconverge to a new lower equilibrium at + 1. Similarly, a large shock thatraises S above b2would lead S to converge to a new long-run equilibrium at + 3. A key feature in these examples that has drawn attention to the neweconomic geography is the possibility of these spatial catastrophes. Small in-cremental movements that push an economy past a threshold can have large ef-fects on the equilibrium. Similarly, this literature has emphasized the potential
C© Blackwell Publishing, Inc. 2008.

34 JOURNAL OF REGIONAL SCIENCE, VOL. 48, NO. 1, 2008
0 11Ω + ∆ Ω 3Ω + ∆1b 2bS
S
: Stable Equilibrium
S: Region 1 Manufacturing Share : Threshold
FIGURE 2: Multiple Spatial Equilibria.
importance of hysteresis. Even if the initial shock is only temporary, once athreshold is passed, the change in equilibrium will be permanent.5
As a step in the direction of our empirical analysis, it is useful to translatethe information in Figures 1 and 2 into the space of two-period growth rates.First, convert the units to log-shares (excluding a zero share, of course). Second,divide the time analytically into two periods. Period t is the period of an initialand temporary shock. Period t+1 is the time interval of convergence from theinitial shock to the new full equilibrium. Figure 3 illustrates this for the caseof a unique stable equilibrium. In this case, the analytics are extremely simple.Whatever happens in the period of the shock is precisely undone in the periodof the recovery. Accordingly, the only possible location for an observation is ona line of slope minus unity through the origin.
5It is worth clarifying at this point the sense of “multiple equilibria” that we use. In thesimple Krugman (1991) model, each starting value for S, Region 1’s share of the mobile laborforce, converges to a unique equilibrium; however, multiple values of S are consistent with fullequilibrium. This sense of multiple equilibria is perhaps closest to the experiment below focusing oncity population and possibly aggregate manufacturing. Alternatively, as in Krugman and Venables(1995), a given division of immobile productive resources between locations may be consistentwith multiple equilibria. In this case, the initial structure of production serves to pin down whichequilibrium reigns. In the experiments below, this sense of multiple equilibria may pertain eitherto city-aggregate manufacturing or city-industry data, depending on the structure of input–outputlinkages. Neither approach rules out the possibility that expectations could help to coordinate on anequilibrium. Since we do not observe expectations of the mechanism by which they are formed, ourapproach implicitly assumes the same Marshallian expectations applied in the theoretical modelsthat provide foundation for our work.
C© Blackwell Publishing, Inc. 2008.

DAVIS AND WEINSTEIN: A SEARCH FOR MULTIPLE EQUILIBRIA 35
DATA
45°
∆St+1
∆St
0
s: Region One Ln(Manufacturing Share)
FIGURE 3: Two-Period Adjustment in the Model of GloballyStable Unique Equilibrium.
The analysis is only slightly more complicated in the case of multiple equi-libria. This is considered in Figure 4. First, so long as the period t shock remainsin the interval (b1, b2), the result is precisely as in the case of the unique stableequilibrium.6 Within this interval, any observation in this space must lie on aline through the origin with slope minus unity. Now consider what happens ifthere is a negative shock sufficiently large to push the log-share below thresh-old b1. It is simplest to begin by imagining that (by chance) the shock pushesthe log-share all the way down to the new equilibrium at + 1 (−1 log unitsbelow ). In the following period, in this case, there would be no further change.If the initial shock had pushed the log-share below b1 but to some point otherthan the new full equilibrium, then the second period adjustment would simplyundo the deviation relative to the new full equilibrium at + 1. That is, intwo-period growth space and for the domain below b1, any observation mustlie on a line with slope minus unity passing through 1. An exactly paralleldiscussion would be pertinent to shocks that push the initial log-share aboveb2. Any observation must then lie on a line with slope minus unity passingthrough 3.
6Note the change in notation. As we move from levels to log units, we remove the overstrikesabove the variables.
C© Blackwell Publishing, Inc. 2008.

36 JOURNAL OF REGIONAL SCIENCE, VOL. 48, NO. 1, 2008
ts
DATA
b1 b2
45°
DATADATA
∆10 ∆3
∆1
∆3
∆St+1
s: Region One Ln(Manufacturing Share)
FIGURE 4: Two-Period Adjustment in the Model of Multiple Equilibrium.
The translation to the two-period growth space thus provides a very simplecontrast between a model of a unique equilibrium versus one of multiple equi-libria. In the case of a unique equilibrium, an observation should simply lie ona line with slope minus unity through the origin. In the case of multiple equi-libria, we get a sequence of lines, all with slope minus unity, but with differentintercepts. Because in this latter case these lines have slope minus unity, theintercepts are ordered and correspond to the displacement in log-share spacefrom the initial to the new equilibrium. These elements will be central whenwe turn to empirical analysis.
The Krugman model features a ruthlessly simple environment—one inwhich there is a single state variable, the share of manufacturing in one regionof a two-region world. In that world, the dynamics can be viewed as s = (s), sothat changes in a region’s size depend on that region’s size alone. When we turnto the empirics, our implementation of the Krugman model will impose strongassumptions.7 For a wide class of new economic geography models, relativeallocation is unaffected by the size of the aggregate economy, so that the dy-namics could be written generically as a function of the shares, sct = (sct, sc′t).
7These assumptions should surely be revisited in future work. Nonetheless, we believe thatthe gains from having a structured look at the data are sufficient justification for imposing theseassumptions at this stage of development of empirical research into multiple equilibria.
C© Blackwell Publishing, Inc. 2008.

DAVIS AND WEINSTEIN: A SEARCH FOR MULTIPLE EQUILIBRIA 37
The first assumption is that the dynamics (hence thresholds) for a particularcity may be written as sct = (sct), hence independent of the evolution of othercity shares (and correlatively for the city-industry case). The second assumptionis that, where relevant, the thresholds are common in log-share units acrosscities and industries. Hence, if it takes a 40 percent negative shock to moveaggregate manufacturing in Tokyo past the threshold to a lower equilibrium,it likewise takes a 40 percent negative shock to do so in Osaka or Himeji.Similarly, when we consider pooled city-industry observations, we require thatif it takes a 35 percent negative shock to move metals in Niigata to a lowerequilibrium, it would take the same size negative shock to move machineryin Kyoto to a lower equilibrium. In short, we have assumed that movementsacross thresholds can be stated in terms of a city’s (or city-industry) own sizealone and that these thresholds require a common proportional decline (rise)to pass a threshold (or thresholds). Under these assumptions, the two periodmodel of adjustment in Figures 3 and 4 is not just a representation of changesfor a single city (or city-industry), but is rather one in which we can place allrelevant observations.
3. EXPERIMENTAL DESIGN
The Experiment
In searching for multiple equilibria in city-industry data,8 an ideal experi-ment would have several key features. Shocks would be large, variable, exoge-nous, and purely temporary. In this paper, we consider the Allied bombing ofJapanese cities and industry in World War II as precisely such an experiment.
The devastation of Japanese cities in the closing months of the war is oneof the strongest shocks to relative city and industry sizes in the history of theworld. United States strategic bombing targeted 66 Japanese cities. These in-clude Hiroshima and Nagasaki, well known as blast sites of the atomic bombs.In these two blasts alone, more than 100,000 people died and major segmentsof the cities were razed. However, the devastation of the bombing campaignreached far beyond Hiroshima and Nagasaki. Raids of other Japanese cities
8The contrast between Figures 3 and 4 also helps in understanding the difference betweenthe exercise on population data of Davis and Weinstein (2002) and the tests provided here. Note thatobservations in quadrants 1 and 3 represent regions with a positive (negative) shock in a first periodfollowed by a further positive (negative) shock in the second (recovery) period. A comparison ofFigures 3 and 4 shows that such observations cannot arise in the case of a unique stable equilibrium,but could well arise in the case of multiple equilibria. Davis and Weinstein (2002) asked whethersuch observations were a central tendency in the city-population data. If they had found a positiveanswer, that would have been sufficient to establish the existence of multiple equilibria. However,a finding that such observations are a central tendency is not a necessary consequence of multipleequilibria. Here, we will use the full structure of the contrast between Figures 3 and 4 to distinguishthe cases of unique equilibrium versus multiple equilibria.
C© Blackwell Publishing, Inc. 2008.

38 JOURNAL OF REGIONAL SCIENCE, VOL. 48, NO. 1, 2008
0
25
50
75
100
125
1930 1931 1932 1933 1934 1935 1936 1937 1938 1939 1940 1941 1942 1943 1944 1945 1946 1947 1948
Year
FIGURE 5: Annual Index of Manufacturing Production in Japan(1938 = 100).
with high explosives and napalm incendiaries were likewise devastating. Tokyosuffered over 100,000 deaths from firebombing raids and slightly over half ofits structures burned to the ground. Most other cities suffered far fewer casual-ties. However, the median city among the 66 targeted had half of all buildingsdestroyed.
If anything, these figures understate the impact of the bombing campaignon production (see Figure 5). Wartime manufacturing production peaked in1941, falling mildly through 1944 as the slowly tightening noose of the Alliedwar effort made re-supply of important raw materials more difficult and theearly stages of Allied bombing began to bite. Manufacturing output plummetedin 1945 as the Allied bombing raids reached their height. From the peak in 1941to the nadir in 1946, Japanese manufacturing output fell by nearly 90 percent.In short, it is fair to say these are large shocks.
While the magnitude of the shocks to city sizes and output was large, therewas also a great deal of variance in these shocks. Our sample includes 114cities for which we could obtain production data. The median city in our samplehad one casualty for every 600 people; however those in the top 10 percent hadcasualty rates ranging from one in 100 to one in five. By contrast, those citiesin the bottom quartile lost less than one person in 10,000. Capital destructionexhibits similar variability. The median number of buildings lost in a city wasabout one for every 35 people. But cities in the top decile of destruction lostmore than one building for every nine people. And at the other end of thedistribution, approximately a quarter of the cities lost fewer than one buildingfor every 10,000 inhabitants. Reasons for this variance include not bombing
C© Blackwell Publishing, Inc. 2008.

DAVIS AND WEINSTEIN: A SEARCH FOR MULTIPLE EQUILIBRIA 39
TABLE 1: Evolution of Japanese Manufacturing During World War II(Quantum Indices from Japanese Economic Statistics)
1941 1946 Change
Manufacturing 206.2 27.4 −87%Machinery 639.2 38.0 −94%Metals 270.2 20.5 −92%Chemicals 252.9 36.9 −85%Textiles and Apparel 79.4 13.5 −83%Processed Food 89.9 54.2 −40%Printing and Publishing 133.5 32.7 −76%Lumber and Wood 187.0 91.6 −51%Stone, Clay, Glass 124.6 29.4 −76%
for cultural reasons (e.g., Kyoto); preservation of future atomic bomb targets(e.g., Niigata and Kitakyushu); distance from the U.S. airbases (e.g., Sapporo,Sendai, and other Northern cities); evolving antiaircraft defense capabilities(e.g., Osaka); the topography of specific cities (the relatively larger destructionin Hiroshima as opposed to Nagasaki); evolution of the U.S. air capabilities; thefact that early and incomplete fire bombings created firebreaks that preventedthe most destructive firestorms; and sheer fortune, as in the fact that Nagasakiwas bombed only when the primary target, Kokura (now Kitakyushu), couldnot be visually identified due to cloud cover.
There was also substantial variation in the impact of bombing on differentindustries. Table 1 presents data on how quantum indices of output movedover the 5 years between 1941 and 1946.9 Heavily targeted industries, suchas machinery and metals, saw their output fall by over 90 percent while othersectors, such as processed food and lumber and wood had declines that were halfas large. This suggests that the bombing had a significant impact on aggregateJapanese industrial structure.
Even within cities, there was often considerable variation in the severity ofdamage by industry. This reflected variation in the type of bombing carried out(conventional ordnance, firebombing, or nuclear weapons), targeted production,errors in targeting, and sheer fate. Table 2 presents correlations between thegrowth rate between 1938 and 1948 of one industry in a given city with thoseof the other industries in the same city. Not surprisingly, these within-city cor-relations in growth rates are positive, indicating that having one’s city bombedtended to be bad for all industries. More startling is the low level of these cor-relations: the median correlation is just 0.31. Even the highly targeted sectorsof machinery and metals only exhibit a correlation of 0.60. This suggests thatthere was substantial variation in the relative shares of industries even withincities.
9These quantum indices are aggregated using value added weights.
C© Blackwell Publishing, Inc. 2008.

40 JOURNAL OF REGIONAL SCIENCE, VOL. 48, NO. 1, 2008
TABLE 2: Correlation of Growth Rates of Industries Within Cities 1938–1948
Machinery Metals Chemicals Textiles Food Printing Lumber
Metals 0.60Chemicals 0.30 0.36Textiles 0.12 0.35 0.25Food 0.32 0.65 0.31 0.49Printing 0.11 0.30 0.04 0.29 0.35Lumber 0.23 0.35 0.21 0.25 0.25 0.41Ceramics 0.13 0.53 0.36 0.38 0.50 0.41 0.23
A more detailed look at the data bears this out. For example, incendiariescomprised 90 percent of the ordnance dropped on Tokyo and these attacks de-stroyed 56 square miles. As a result, output of all manufacturing sectors inTokyo declined relative to the Japan average. Even so, there was substantialvariation. Textiles and apparel fell only 12 percent relative to the national av-erage, but metals and publishing fell 44 percent and 79 percent, respectively.More surprising is the case of Nagoya, which received more bomb tonnage (14.6kilotons) than any other Japanese city. It actually emerged from the war withsome industries increasing their share of national production. In part, this wasdue to the firebreaks discussed above and in part this was due to the high shareof precision raids using high-explosive bombs, which left many untargeted fac-tories untouched. In 1938, Nagoya supplied 12 percent of Japan’s ceramicsproducts and 11 percent of Japan’s machinery. Over the next 10 years, the ma-chinery industry in Nagoya, a principal target of bombing raids, saw its outputfall by more than 35 percent relative to the industry as a whole. By contrast,the output of ceramics in Nagoya rose by 21 percent relative to the national av-erage. Similarly, the metals sector in Nagoya saw its share of national outputrise 64 percent.
It is interesting to compare these numbers to what happened to industrialsectors in cities bombed lightly or not at all. In Kyoto and Sapporo, machinerywas the fastest growing sector, with output rising 75 percent and 186 percentfaster than the national average. By contrast, ceramics—which had risen inNagoya—fell by 58 percent in Kyoto (relative to the national average) and fellas a share of Sapporo’s aggregate manufacturing output.
In sum, these data suggest that the allied bombing of Japan producedtremendous variation within and across cities in the output of Japaneseindustries.
Since our dependent variables will be city and industry growth rates, weneed to address one potential selection issue. While there is evidence that theU.S. targeted cities on the basis of population and industrial structure, there isno evidence that U.S. picked industries on the basis of past or estimated futuregrowth rates. We could find no references to targeting based on urban industrialgrowth in any source material. Moreover, the U.S. Strategic Bombing Surveydid not even cite the main data source on Japanese urban output data, raising
C© Blackwell Publishing, Inc. 2008.

DAVIS AND WEINSTEIN: A SEARCH FOR MULTIPLE EQUILIBRIA 41
the question of whether they knew the existence of these data. Even if theydid, there is scant evidence that the U.S. actually or inadvertently targeted onthe basis of growth rates. For example, the correlation between prewar (1932–1938) manufacturing growth and casualty rates is only 0.07. Taken together,we believe that the choice of the U.S. targets can safely be treated as exogenous.
The empirical exercise that we conduct requires that we can appropriatelyidentify the period of the shock, which should be temporary, as well as identi-fying the period of the recovery. The dramatic decline in output during the warprovides a very natural periodization for the shock itself. In our central tests,our measure of the period of the shock is the change in output from 1938 to1948, as is mandated by data availability. While peak to trough would take usfrom 1941 to 1946, the period available is proximate and hence should suffice.Even by 1948, Japanese manufacturing output levels remained barely 25 per-cent of their 1938 level. That the wartime shocks were temporary is obvious,but for this no less important. Deciding on the appropriate period of recoveryis more difficult, since one has to decide whether to use an endpoint at whichJapan reaches its prewar peak level of manufacturing (which occurred in theearly 1960s) or the point at which it resumes the prior trend (which would benear the end of the 1960s). We have opted for the latter, although the principalresults are not affected by taking an earlier cutoff.
Relevance of the Japanese Case
One important concern is the relevance for modern economies of results onJapanese manufacturing industries, where our earliest data goes back to 1932and the most recent is 1969. After all, the main body of the theoretical literaturecontemplates a modern industrial economy with differentiated products and awell-articulated web of intermediate suppliers (Krugman and Venables, 1999).If these conditions were not met, then this would be an inappropriate venuein which to test these theories. Violation of these conditions could arise, inprinciple, either in large autonomous plants or small home-production plants,either of which failed to integrate in an essential way with other local producers.
An examination of the historical literature strongly points to the impor-tance of producers tightly linked to a diverse set of intermediate suppliers, assuggested by theory. Indeed, the shift from precision bombing of large Japaneseplants with high explosives to area bombing of Japanese cities was premisedprecisely on the need to disrupt the web of suppliers widely dispersed in thecities. However, the U.S. Strategic Bombing Survey (henceforth USSBS) arguesexplicitly that these plants were not simply small cottage industries: “Beforethe urban attacks began, ‘home’ industry, in the strict sense of household indus-try (which by Japanese definition included plants with up to 10 workers), hadalmost disappeared.” (p. 29) In its place, the USSBS argued, was an elaboratesystem of specialized contractors which became the focus of the U.S. air assault:
Part of the objective of the urban raids was the destruction of the smaller‘feeder’ plants in the industrial areas. It was believed that the effect of such
C© Blackwell Publishing, Inc. 2008.

42 JOURNAL OF REGIONAL SCIENCE, VOL. 48, NO. 1, 2008
destruction would be immediately and seriously felt in the war economy . . . Itwas discovered, however, that subcontracting in wartime Japan followed moreor less the same pattern as it did in the Western countries, being widely dis-tributed in plants of 50–10,000 or more workers. The effect of the urban raidson the great number of plants within that range was extensive. The ultimateeffect of such destruction or damage varied considerably as among cities andindustries. (p. 20–21)
This view was strongly supported by postwar surveys that considered thereasons for declines in production. A survey of 33 of the largest end productplants in Tokyo, Kawasaki, and Yokohama, corroborates the notion that it wasthe destruction of specialized components manufacturers. The USSBS writes:
Bomb damage to component suppliers was cited as the primary cause of com-ponent failure among the 33 customer plants. Next in order of importance wasthe shortage of raw materials as it affected these suppliers, and last was labortrouble. The latter two causes were in part induced, in part aggravated, bybomb damage. The impact of bomb damage on smaller component plants isillustrated by the damage statistics for the Tokyo–Kawasaki–Yokohama com-plex, which revealed that plants of 100 workers and under were 73 percentdestroyed. In Tokyo, the electrical equipment industry, particularly radio andcommunications equipment, was drastically affected by damage to its smallercomponent suppliers . . . The Osaka Arsenal suffered a precipitous decline inproduction because of the destruction of the Nippon Kogaku plant . . . whichsupplied firing mechanisms for AA [Antiaircraft] guns, the Arsenal’s chief itemof output. The electric steel production of the Mitsubishi Steel Works at Na-gasaki, was virtually stopped because of the destruction, in an urban attack,of its supplier of carbon electrodes . . . (pp. 31–32)
A second feature important for verifying the relevance of the Krugman-typemodels is the localization of demand and cost influences on local production.One window on this is to compare declines in production across three typesof plants: (1) Plants that are bombed; (2) Plants not bombed in cities that arebombed; (3) Plants in cities not bombed. By July 1945, plants that were bombedhad their output reduced by nearly three-fourths from an October 1944 peak.Over the same period, plants that were not bombed located in cities that werebombed had output fall by just over half. Plants located in cities that werenot bombed had output fall by a quarter (USSBS). A comparison between planttypes (1) and (2) reveals that the direct impact of a plant’s own bombing on plantoutput is surprisingly modest—only an incremental 25 percent in lost output.A comparison of plant types equation (2) and (3) reveals the importance of localfactors. Even in comparing plants not bombed, simply to be in a city that isbombed costs the plant a quarter of its output. This is the same magnitude asthe direct effect of bombing!
One tempting alternative to the hypothesis of highly localized demand andcost effects on production through the web of intermediate suppliers is the
C© Blackwell Publishing, Inc. 2008.

DAVIS AND WEINSTEIN: A SEARCH FOR MULTIPLE EQUILIBRIA 43
TABLE 3: Inflation Adjusted Percent Decline in Assets Between 1935and 1945
Decline
Total 25.4Buildings 24.6Harbors and canals 7.5Bridges 3.5Industrial machinery and equipment 34.3Railroads and tramways 7.0Cars 21.9Ships 80.6Electric power generation facilities 10.8Telecommunication facilities 14.8Water and sewerage works 16.8
Source: Namakamura, Takafusa.and Masayasu Miyazaki.Shiryo, Taiheiyo Senso Higai ChosaHokoku (1995), pp. 295–296.
possibility that the negative impact of being in a city that is bombed comesthrough the destruction of urban infrastructure. This would be a mistake. TheUSSBS categorically rejects the notion that infrastructure destruction was cru-cial, “Shipping and rail movements were maintained during the raid period withonly slight interruptions, and the supply of water, gas and electric power to theremaining essential consumers was always adequate . . . At Hiroshima, targetof the atom bomb, rail traffic was delayed only a few hours.” (p. 20) Japanesedata bears this out. In Table 3, we present destruction of Japanese assets byasset class. A clear implication of this table is that public infrastructure, whileobviously impaired, tended to be damaged far less seriously than other forms ofcapital. Hence infrastructure damage does not seem to be the primary culprit.
Taken together, these historical accounts and data draw a picture ofJapanese industrial structure of the time for which the canonical models ofthe new economic geography may appear a good representation. There seemsto have been a highly articulated web of intermediate suppliers to industry, thedestruction of which was a primary factor determining the U.S. bombing strat-egy. Moreover, there seems to have been an importantly localized component ofthe effects of bombing, consistent with emphases within this literature.
5. EMPIRICS
Data
Our data include three measures of economic activity. The first is acoarse measure—city population—previously employed in Davis and Weinstein(2002), which we include here for the purpose of comparison and because weapply new methods to the data. The second is aggregate city manufacturing.
C© Blackwell Publishing, Inc. 2008.

44 JOURNAL OF REGIONAL SCIENCE, VOL. 48, NO. 1, 2008
This is consistently available for 114 cities, which jointly accounted for 64 per-cent of Japanese manufacturing in 1938.10 In the early periods, these data areavailable at infrequent intervals, namely 1932, 1938, and 1948; the last date weuse is 1969. Our third and final measure of economic activity is city-industrydata for eight manufacturing industries. In order of size in 1938, they are Ma-chinery; Metals; Chemicals; Textiles, and Apparel; Processed Food; Printing,and Publishing; Lumber and Wood; and Ceramics (Stone, Glass, and Clay).
The new data on manufacturing in aggregate and by industry is very impor-tant. First, it provides a more direct and precise measure of economic activitythan the population data. Indeed, both the magnitude of the shocks and vari-ability are much greater in the production than the population data. Second,a great deal of the theory has been developed specifically to capture featuresconsidered of particular importance in manufacturing. Finally, the ability tomove down to the level of industries within manufacturing will allow us to seewhether it is possible to identify multiple equilibria at any of a variety of lev-els of aggregation—since they could well be present at one level even if not atanother.
In moving from theory to data, there will be an additional concern. Al-though the literature following in the wake of Krugman (1991) is often termedthe “new economic geography,” real features of physical geography are rarelymodeled. Yet in particular locations, physical geography may impose stronglimits on city expansion. In particular, this could be an issue in a highly moun-tainous country, such as Japan. Tokyo, lying on the large Kanto Plain, maynaturally be larger in aggregate than Kyoto, nestled in a considerably smallervalley. Even if over half of Tokyo is destroyed in the war, with Kyoto nearlyuntouched, the grip of geography may imply that in aggregate Tokyo will re-turn to a much greater size. This suggests the great advantage in the presentpaper of moving from the aggregate city data of Davis and Weinstein (2002)to the city-industry data of the present paper. While physical geography mayimpose strong restrictions on the aggregate expansion of a city, typically thesedo not constrain expansion of particular industries in particular cities. Thispoint is underscored by the fact that across all cities and industries the me-dian observation on city-industry output as a share of city output is just 4.5percent. For most city-industry observations, physical geography imposes nomeaningful constraint on expansion of city-industry output.
We will also require direct measures of shocks to cities during the war. Thefirst is death—the number killed or missing as a result of bombing deflated bycity population in 1940. The second is destruction—the number of buildings de-stroyed per capita in the city in the course of the war. We can also divide citiesaccording to whether or not they were bombed. In order to control for inter-ventions by the government, as opposed to the consequences of private actions,
10This number was calculated by dividing the total manufacturing output of the 114 citieslisted in the Nihon Toshi Nenkan by the total manufacturing output number in the Kogyo Tokei50 Nenshi [50 Year History of Industrial Statistics].
C© Blackwell Publishing, Inc. 2008.

DAVIS AND WEINSTEIN: A SEARCH FOR MULTIPLE EQUILIBRIA 45
we will also need a measure of regionally directed government reconstructionexpenditures. This excludes subsidy programs that do not discriminate by lo-cation. The total expenditures of this type are small. These expenditures aredivided by the city’s 1947 population to obtain a per capita variable governmentreconstruction expenses. Further details on the data are available in the DataAppendix.
Specifications
Unique equilibriumThe next step, then, is to move from the theoretical discussion of Section II
above to an empirical implementation. It is useful to break this discussion upinto two parts, one in which we assume there is a unique equilibrium andthe other in which we contemplate the possibility that there may be multipleequilibria.
We begin with the case of unique equilibrium, as represented in Figure 3.If we could partition time into two periods—the first the period of the shockand the second the period of the recovery—then the unique equilibrium modelmakes a very simple prediction: Starting from equilibrium, whatever shockthere is in period one will simply be undone in the second period. As we can seein Figure 3, the data should lie on a line with slope minus unity through theorigin.
This is the basis for the empirical specification employed by Davis andWeinstein (2002). Let Scit be the share of output produced in city c in industryi at time t, and let scit be the natural logarithm of this share. Let vci48 be the(typically large) shock to the city-industry share occasioned by the war and vci69be the (typically small) shock around the new postwar equilibrium. Supposefurther that in each city, industry i has an initial stable equilibrium size ciand is buffeted by city-industry specific shocks εcit (for years t = 16, 27, 48, 69).We can think about ci as the result of all unchanging locational forces thataffect an industry’s size in a particular location. In this case we can write theshare of total Japanese output in industry i that occurs in city c in 1948 as,
sci48 = + εci48.(1)
We can model the persistence in these shocks to industry shares as:
εci48 = εci27 + vci48,(2)
where the parameter ∈ [0, 1) represents the rate at which shocks dissipateover time. Davis and Weinstein (2002) showed this gives rise to:
sci69 − sci48 = ( − 1)vci48 + [vci69 + (1 − )εci27].(3)
The term in square brackets is the error term and is uncorrelated withthe wartime shock. An obvious proxy for the shock, vci48, is the growth ratebetween 1938 and 1948. Unfortunately, we cannot simply plug this variable
C© Blackwell Publishing, Inc. 2008.
46 JOURNAL OF REGIONAL SCIENCE, VOL. 48, NO. 1, 2008
into equation (3). The reason can be understood most simply by writing out theterms of the growth rate explicitly:
sci48 − sci38 = vci48 + [( − 1)vci38 + (1 − )εci16].(4)
The terms in square brackets represent classical measurement error. Theobvious solution to this problem is to instrument for the innovation using bomb-ing data. The instruments we use to identify the magnitude of the shock, ci48,are “death” (the number of casualties and missing11 in the city as a share ofthe 1940 population) and the interaction of “destruction” (buildings destroyedas a share of the 1940 population) with industry dummies.12 This enables us tocontrol for the fact that bombing is likely to have varying impacts on industriesdepending on whether the industry was targeted or not.
Importantly, under the null of a unique equilibrium, we expect the es-timated value of to equal zero so the coefficient on instrumented wartimegrowth will equal minus unity.
Multiple equilibriaWe now develop an empirical specification for the case in which there might
be multiple equilibria. This case is complicated by the fact that a priori we knowneither the number of equilibria nor the location of the thresholds. Our task isconsiderably simplified if we first abstract from this and assume that indeedwe do know the number of equilibria and the location of the thresholds. We canthen turn later to how we would determine these empirically.
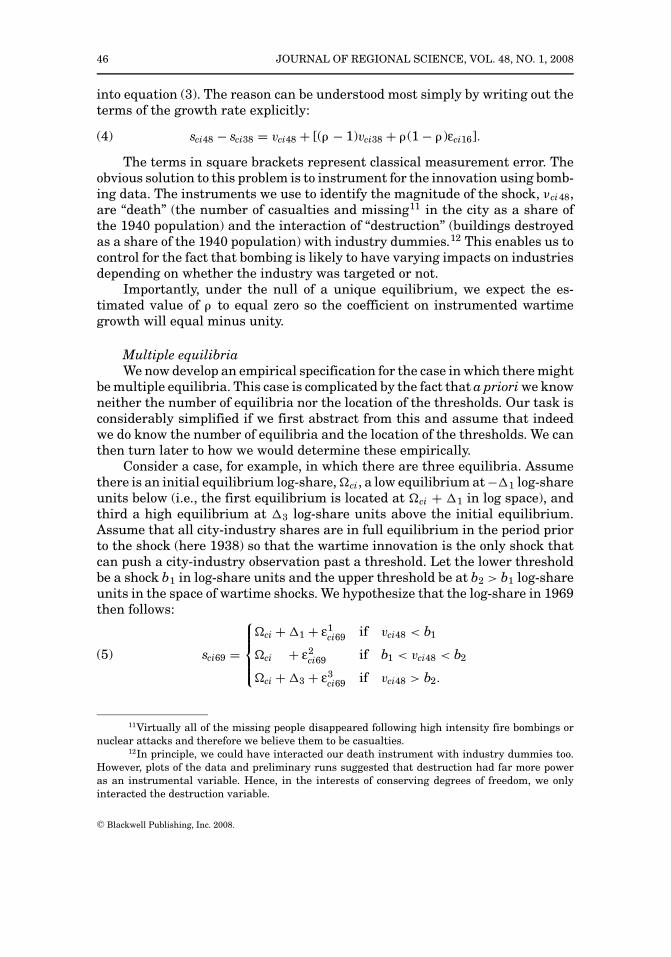
Consider a case, for example, in which there are three equilibria. Assumethere is an initial equilibrium log-share, ci, a low equilibrium at −1 log-shareunits below (i.e., the first equilibrium is located at ci + 1 in log space), andthird a high equilibrium at 3 log-share units above the initial equilibrium.Assume that all city-industry shares are in full equilibrium in the period priorto the shock (here 1938) so that the wartime innovation is the only shock thatcan push a city-industry observation past a threshold. Let the lower thresholdbe a shock b1 in log-share units and the upper threshold be at b2 > b1 log-shareunits in the space of wartime shocks. We hypothesize that the log-share in 1969then follows:
sci69 =
ci + 1 + ε1ci69 if vci48 < b1
ci + ε2ci69 if b1 < vci48 < b2
ci + 3 + ε3ci69 if vci48 > b2.
(5)
11Virtually all of the missing people disappeared following high intensity fire bombings ornuclear attacks and therefore we believe them to be casualties.
12In principle, we could have interacted our death instrument with industry dummies too.However, plots of the data and preliminary runs suggested that destruction had far more poweras an instrumental variable. Hence, in the interests of conserving degrees of freedom, we onlyinteracted the destruction variable.
C© Blackwell Publishing, Inc. 2008.

DAVIS AND WEINSTEIN: A SEARCH FOR MULTIPLE EQUILIBRIA 47
The error terms change as we cross a threshold because shocks must bestated as relative to the new equilibrium. Formally, we have
ε1ci69 = (εci48 − 1) + vci69,
ε2ci69 = εci48 + vci69,
ε3ci69 = (εci48 − 3) + vci69.
(6)
If we subtract equation (1) from the equations presented in (5) we obtainour equations of motion:
sci69 − sci48 =
1 + (ε1
ci69 − εci48)
if vci48 < b1(ε2
ci69 − εci48)
if b1 < vci48 < b2
3 + (ε3
ci69 − εci48)
if vci48 > b2.
(7)
If we substitute in equation (2) and (6) into the above expressions we obtain
sci69 − sci48 =
1(1 − ) + ( − 1)vci48 + [vci69 + (1 − )εci27] if vci48 < bi
( − 1)vci48 + [vci69 + (1 − )εci27] if b1 < vci48 < b2
3(1 − ) + ( − 1)vci69 + [vci69 + (1 − )εci27] if vci48 > b2.
(8)
There are a few important features of the equations of motion described inequation (8). First, each of these equations differs only in the constant term.Second, if there is not much persistence in the shocks, then the coefficient onthe innovation due to bombing, vci48, should be close to minus one. Finally, theerror term, which is the set of variables that is enclosed in square brackets,is uncorrelated with the remaining variables on the right-hand side. It will beconvenient for future reference to re-write equation (8) as:
sci69 − sci48 = (1 − )1 I1(b1, vci48) + (1 − )3 I3(b2, vci48)
+ ( − 1)(sci48 − sci38) + [vci69 + (1 − )εci27],
(9)
where I1(b1, vci48) and I3(b2, ci48) are indicator variables that equal unity ifvci48 < b1 or vci48 > b2 respectively, and we have substituted in the wartimegrowth rate as a proxy for the unobserved wartime shock vci48.
Thus far we have simply assumed that we know the locations of the thresh-olds and so we must return to this question now. It is not possible to run astandard threshold regression with an endogenous variable because the set ofinstruments would vary with the threshold values. Thus we have no way ofcomparing the fit any two regressions with different thresholds. In the face ofthis, we develop an alternative. If we assume that the periods we look over arelong enough for noncontemporaneous shocks to dissipate, then we can impose = 0. This is equivalent to assuming that by 1969, Japanese industries andcities had a chance to move back to their prewar equilibrium or some new one.
C© Blackwell Publishing, Inc. 2008.

48 JOURNAL OF REGIONAL SCIENCE, VOL. 48, NO. 1, 2008
This then allows us to focus on the long difference between equations (9) and(3). We can then estimate
sci69 − sci38 = 1 I1 (b1, ci48) + 3 I3 (b2, ci48) + ci69,(10)
where we correct for the measurement error in the shocks by using the instru-mented shocks, ci48, as before.
The key advantage of equation (10) is that it has a well-defined likelihoodfunction because we no longer need to instrument. Once we have transformedthe data in this way, we can proceed as if we were performing a standard thresh-old regression and pick the four parameters (1, 3, b1, and b2) that maximizethe value of the likelihood function. In the general case where we have n thresh-olds, our estimates of the parameters answer a question of the following form:“Contingent on believing that there are n thresholds separating n+1 stableequilibria, which parameters maximize the likelihood function?”
The mechanics of the threshold regression require us to maximize the like-lihood function for all parameter values. This cannot be done analytically be-cause the likelihood function will have flat spots when small movements in thethreshold values cause no points to be moved from one equilibrium grouping toanother and will jump discretely when infinitesimal movements in thresholdvalues move points from one equilibrium to another. For computational ease,we focus on thresholds in which observations move from one equilibrium toanother in clusters of 5 percent of the observations.
We implement this as follows. Theory indicates that the determinant ofwhether we cross a threshold is going to be monotonically related to themagnitude of the shock. By regressing industry growth between 1938 and 1948on death, destruction, prewar growth, and postwar reconstruction expenses,we obtain a linear relationship of how bombing affects population or industrysize.13 If we multiply the magnitude of death and destruction by their respec-tive estimated coefficients, we obtain an estimate of the magnitude of the shockto each location generated by the bombing. We can then use this shock vari-able in order to group the data according how much the growth rate of eachindustry in each city was affected by the bombing. Bin 1 corresponds to the5 percent hardest hit industrial locations, and Bin 20 contains the least dam-aged 5 percent. We then perform a grid search for the thresholds using a numberof strategies.
First, if there is only one equilibrium, then there should only be one in-tercept. In this case we can run two specifications. First, we can use two-stageleast squares to estimate , and then test the reasonableness of restriction thatit equals zero in the one stable equilibrium case. Second, we can estimate theconstrained version so that we can obtain a likelihood function and calculatethe Schwarz criterion under the maintained hypothesis that there is a uniqueequilibrium and = 1.
13We include postwar reconstruction expenses because they may have affected growth be-tween 1945 and 1948.
C© Blackwell Publishing, Inc. 2008.

DAVIS AND WEINSTEIN: A SEARCH FOR MULTIPLE EQUILIBRIA 49
We next consider the possibility of two equilibria. In order to test for thispossibility, we first order the data according to our shock variable. We thenset the threshold b1 to the level of the fifth percentile and pick the remainingparameters in order to maximize the likelihood function. We then repeat thisexercise by calculating the maximum likelihood values of the parameters whenb1 is set at the tenth percentile, the fifteenth percentile and so on. This processis continued until we have a maximum likelihood value for each value of b1.The parameters that maximize the likelihood across all values of the thresholdbecome our estimates.
Our procedure in the case of three equilibria is analogous. In this case wedivide the data into three groups based again on the shock variable. This timewe allow the thresholds to occur at any percentile that we can factor by five(i.e., thresholds at [5,10]; [5, 15]; [5, 20]; and so on until all possible combi-nations have been exhausted). Once again we calculate maximum likelihoodparameters for each set of thresholds, and then pick the set of parameters andthresholds that generate the highest of these maximum values of the likelihoodfunction. The maximum number of equilibria that we consider (in a correlativemanner) is four.
Holding fixed the number of equilibria, the preferred selection of the thresh-olds is determined by the value of the likelihood function. For the selected spec-ification to be admissible, we impose one further requirement. As we have setit up, the theory requires that locations suffering more negative shocks cannotarrive at a higher equilibrium. This then implies an ordering on the interceptsassociated with the corresponding equilibria. Hence for a particular specifica-tion to be admissible, we require that the ordering of intercepts be in accordwith the predictions of the theory of multiple equilibria.
Having obtained the preferred specification for each assumption regardingthe number of equilibria, we can then apply the Schwarz criterion to identifywhich model is best supported by the data. The Schwarz criterion is defined tobe:
ln(Lt) − p/2 ∗ ln(N),
where Li is the maximized likelihood under hypothesis t (i.e., the number ofthresholds), p is the number of parameters and N is the number of observa-tions. The preferred specification is the one with the largest Schwarz crite-rion. This criterion will asymptotically pick the correct model with probabilityone.
Before turning to the estimation, there are a few remaining technical is-sues that we need to address. First, we should correct for government policies torebuild cities. Although Davis and Weinstein (2002) found that the effect ofthese policies became insignificant 20 years after the end of the war, we includethem for completeness. There are two government interventions that we need toaddress. In the first few years after the end of the Second World War, the al-lies thought Japan should pay war reparations to other countries. Unfortu-nately, the abject poverty of Japan made this difficult, and so the allies began
C© Blackwell Publishing, Inc. 2008.

50 JOURNAL OF REGIONAL SCIENCE, VOL. 48, NO. 1, 2008
dismantling surviving Japanese factories and shipping the machinery abroad.This in combination with the fact that Japan had to pay for the U.S. occupationexplains why Japanese government transfers to the U.S. exceeded the U.S. aiduntil 1948. Fortunately for us, since we are looking at growth after 1948, ourresults are unlikely to be biased by this policy.
In 1949, with the fall of China to the communists and the rise of a left-wingmovement in Japan, the U.S. policy toward Japan changed, and a less punitivepolicy was adopted. U.S. aid, although always small, began to exceed Japanesepayments to the U.S. Moreover, the Japanese government made some smallpayments to rebuild particular cities. Since these may have some impact on thelocation of particular industries, we include these reconstruction expenses inour specification (RECON).
The second potential problem that we should correct for is that it is possi-ble that would not equal zero because there may be some other correlationbetween past and future growth rates that we do not model. In order to correctthis, we include the prewar growth rate in the regression. Finally, we include aconstant term to allow for the fact that the error term might not be mean zero.Hence, our estimating equation is:
sci69 − sci38 = 2 + 1 I1(b1, ci48) + 3 I3(b2, ci48)
+ PREWARci + RECONc + ci,
(11)
where 1, 2, 3, , , b1, and b2 are all parameters to be estimated, PREWARis the prewar growth rate, and is an iid error term. In the unique equilibriumwe postulate that 1 = 3 = 0. Here, one believes that stronger negative shockspush cities or industries to smaller equilibria, it should be the case that 1 +2 < 2 < 2 + 3 or 1 < 0 < 3. It is important to note that 2 here representsonly the second equilibrium from the left. As such, it is simply a normalization.Our work does not impose that 2 reflects the initial equilibrium point and sodoes not presume whether any or all of the multiple equilibria lie above or belowthe initial equilibrium.
Data Preview
Regression analysis will provide the key evidence in this paper. However, itis useful to get a feel for the data by considering some simple experiments andshowing plots of the data. The key feature of the theory of multiple equilibriathat we build on is the idea that big shocks will differ qualitatively from smallshocks. Small shocks return to a (local) stable equilibrium. Big shocks pass athreshold and fail to return to the initial equilibrium. Hence, a natural firstplace to look is to consider what happened to manufacturing in the cities thatwere hit hardest during the war. Measure the intensity of destruction by thenumber of buildings destroyed per inhabitant in 1940. Let us create a sampleof the 10 cities hit hardest according to this measure. In this sample, thesecities lost at least one building for every eight inhabitants. If we now order our
C© Blackwell Publishing, Inc. 2008.

DAVIS AND WEINSTEIN: A SEARCH FOR MULTIPLE EQUILIBRIA 51
sample by the manufacturing growth rate between 1938–1948, the median citysaw its share of Japanese manufacturing fall by nearly 25 percent. If we noworder these same cities by their growth in the subsequent period, 1948–1969,the median city in this sample increased its share of Japanese manufacturingby 40 percent. In other words, this simple view of the data offers no suggestionthat the hardest hit cities failed to recover their shares of Japanese manufac-turing. Indeed, as it turns out, the typical member in this sample of hard-hitcities actually increased its share of Japanese manufacturing in the period ofrecovery.
We can get a further feel for the data by looking at plots. For each city andeach period, we can normalize the manufacturing growth rate by subtractingoff the corresponding growth rate for all cities. There is mean reversion in thedata if a negative shock in one period is followed by a positive shock of thesame magnitude in the following period. In the pure mean reversion case,the data will be arrayed along a line with slope minus unity. By contrast,if there were multiple equilibria, one would expect to see the data for industriesthat were particularly hard hit arrayed along a line parallel and to the left ofthe data for less damaged sectors. Figure 6 summarizes the data on aggregatemanufacturing, the size of each circle representing the size of manufacturingin that city in 1938. The data reveal three things. First, there is a clear neg-ative association between the two growth rates. This strongly suggests somedegree of reversion back to the initial share. Second, the data for the extremepoints seems to be arrayed roughly along the same line as for more moderatelyaffected industries. Finally, there is a lot of dispersion among small cities. Thismay reflect an underlying high degree of volatility in manufacturing growthrates in small cities.
One obvious concern with drawing conclusions from the previous graph isthat manufacturing may be too large an aggregate to be meaningful. Geographymay lock in city size and also aggregate manufacturing. It is less clear thatgeography should lock in a city’s industrial structure. One of the problemsof using disaggregated data is that cities with infinitesimal shares of outputin particular industries often have explosively large or small growth rates.14
This threatens to swamp the variation that arises among city-industry datathat accounts for the vast majority of output. We therefore decided to restrictour attention to only those industrial locations that account for more than 0.1percent of Japanese urban output in that industry. This collection of industriallocations comprised at least 98 percent of Japanese urban output in 1938 ineach of our eight industries.
14For example, between 1932 and 1938 the share of Japanese printing and publishing inMaebashi (population 161,000) fell from one thousandth to 0.4 millionths, but by 1948 Printingand Publishing in Maebashi had returned to its 1932 share. Whether this dramatic evolutionreflects the fortunes of a particular plant in Maebashi or measurement error is hard to say, butthese fluctuations of several thousand percent in tiny city-industry cases threaten to swamp theother variation in our data.
C© Blackwell Publishing, Inc. 2008.

52 JOURNAL OF REGIONAL SCIENCE, VOL. 48, NO. 1, 2008
Nor
mal
ized
Gro
wth
(19
48 to
196
9)
Normalized Growth (1938 to 1948)
-2 0 2 4
-2
-1
0
1
2
FIGURE 6: Prewar and Postwar Growth Rates of Manufacturing Shares inBombed Cities.
In Figure 7, we repeat our experiment by plotting the normalized growthrates of industrial locations that account for more than 0.1 percent of Japaneseurban output in 1938. Here, we normalize each industry’s growth rate ina city with the industry’s growth rate in all cities and the size of the cir-cle represents the share of that industry in the Japan total for that indus-try. Once again we see the clear negative relationship. When industries incities suffer negative shocks, they appear to grow faster in subsequent peri-ods. If multiple equilibria were prominent features of the data, one might ex-pect to see industries with extreme shocks have less complete recoveries thanthose with smaller shocks. The data, however, do not appear to match thishypothesis.
As a final preview of the data we present the corresponding graphs for eachof the eight industries in Figure 8. The plots are quite striking. In each industrythere appears to be a clear negative association between the magnitude of theshock to that industry during the war and the rate of growth in the postwarperiod. The behavior of extreme points is particularly striking in these plots. Ifone believed in multiple equilibria, one should not expect extreme points to liealong the line defined by the other points. Instead, they seem to lie more or lesswhere one would predict based on a linear extrapolation of the less extremepoints.
Indeed these plots demonstrate that even as we switch from populationto output data and disaggregate from total city manufacturing to city-industry
C© Blackwell Publishing, Inc. 2008.

DAVIS AND WEINSTEIN: A SEARCH FOR MULTIPLE EQUILIBRIA 53
Nor
mal
ized
Gro
wth
(19
48 t
o 19
69)
Normalized Growth (1938 to 1948)
-5 0 5
-5
0
5
FIGURE 7: Mean-Differenced Industry Growth Rates.
observations we find the same kind of mean reversion as Davis and Weinstein(2002, Figure 1) found in city population data.
Regression Results
In this section, we present our threshold regression results. Because it ispossible that multiple equilibria arise at one level of aggregation even if not atanother, we consider this at various levels of aggregation. We consider it firstusing the city population data considered in Davis and Weinstein (2002). Theanalysis of that data is augmented here by our new approach which sharpensthe contrast between the theory of unique versus multiple equilibria and whichalso places the theories on a more even footing in our estimation approach.Thereafter, we consider the same questions using data on city aggregate man-ufacturing and city-industry observations for eight manufacturing industries.Since manufacturing is less than half of all economic activity within a typicalcity, it should be clear that even if population in a city were to recover from theshocks, this need not be true of aggregate city-manufacturing. The same pointholds a fortiori for particular industries within manufacturing, which we alsoexamine.
We begin by considering city population data. Column 1 of Table 4 replicatesthe Davis and Weinstein (2002) results using population data. The IV estimatein column 1 tests a null of a unique stable equilibrium by asking if we can reject
C© Blackwell Publishing, Inc. 2008.

54 JOURNAL OF REGIONAL SCIENCE, VOL. 48, NO. 1, 2008
Normalized Growth (1938 to 1948)
Ceramics
-4 -2 0 2-1
0
1
2
Chemicals
-1 0 1 2 3-2
-1
0
1
2
Processed Food
-2 -1 0 1 2-1
0
1
2
Lumber and Wood
-4 -2 0 2-6
-4
-2
2.2e-15
2
Machinery
-6 -4 -2 0 2-2
0
2
Metals
-4 -2 0 2
-1
0
1
2
3
Printing and Publishing
-4 -2 0 2
-2
-1
0
1
Textiles and Apparel
-4 -2 0 2-4
-2
0
2
4
FIGURE 8: Prewar vs Postwar Growth Rate.
that the coefficient on the wartime (1940–1947) growth rate is minus unity. Wecannot reject a coefficient of minus unity, hence cannot reject a null that there isa unique stable equilibrium. We also find that regionally-directed governmentreconstruction expenses following the war had no significant impact on citysizes 20 years after the war.
We next apply our threshold regression approach described above to testingfor multiple equilibria. This places unique and multiple equilibria on an evenfooting. The results are reported in the remaining columns of Table 4. In column2 of Table 4, we present the results for the estimation of equation (11) in the casein which there is a unique equilibrium. Given how close our previous estimateof was to 0 (minus unity on wartime growth), it is not surprising that theestimates of the other parameters do not change much when we constrain totake on this value.
Columns 3–5 present the results for threshold regressions premised onvarious numbers of equilibria.15 In these regressions, the constant plus 1 is
15In principle, we could have considered the possibility of more than four equilibria. However,neither the data plots nor any of the regression results suggested that raising the number ofpotential equilibria was likely to improve the results.
C© Blackwell Publishing, Inc. 2008.

DAVIS AND WEINSTEIN: A SEARCH FOR MULTIPLE EQUILIBRIA 55
TABLE 4: Population Regressions
1940 and 1965Dependent variable is 1947 and 1965growth rate between IV Estimate 1 Equilibrium 2 Equilibria 3 Equilibria 4 Equilibria
Population growth rate 0.617 0.627 0.501 0.514 0.508between 1925 and 1940 (0.0923) (0.0671) (0.0734) (0.0738) (0.074)
Population growth rate −1.03between 1940 and 1947 (0.163)
1 0.0978 −0.0720 −0.090(0.0256) (0.0325) (0.036)
3 −0.127 −0.055(0.0272) (0.045)
4 −0.147(0.040)
Gov’t reconstruction 0.392 0.412 −0.0358 0.236 0.203expenses (0.514) (0.495) (0.498) (0.500) (0.500)
Constant 0.215 0.209 0.196 0.315 0.335(0.0407) (0.0146) (0.0146) (0.0267) (0.032)
Thresholdsb1 −0.001 −0.056 −0.056b2 0 −0.001b3 0
Intercept ordering N/A N/A Fail Fail Failcriterion
Schwarz criterion N/A 75.6 77.1 74.9 69.9Number of observations 303 303 303 303 303
Note: Standard errors are in parenthesis below estimated coefficient value.
the intercept for the first equilibrium; the constant term is the intercept forthe second equilibrium, the constant plus 3 is the intercept for the third equi-librium; and the constant plus 4 is the intercept for the fourth equilibrium.For each model of the number of equilibria, we calculate threshold values cor-responding to how big a shock the city needs to receive to cross over into thatnew equilibrium. In order for the equilibria to be sensible in the sense thatgreater destruction does not cause a city to become larger, we require that theintercepts must be ordered as follows: 1 + 2 < 2 < 2 + 3 < 2 + 4 whichcan be simplified to 1 < 0 < 3 < 4. Similarly, because it cannot be the casethat an equilibrium is both stable and lies along a transition path to anotherequilibrium, it must be the case that the thresholds lie between the equilibria.Putting these together, we have the following condition:
Intercept Ordering Criterion: 1 < b1 < 0 < b2 < 3 < b3 < 4.
In other words, in order to accept the hypothesis that a model of multipleequilibria describes the data, we require that the data selects the model andthat the parameter estimates are consistent with the model.
The Schwarz criterion, presented at the bottom, slightly favors a multi-ple equilibrium model with two equilibria, but the parameter values associ-ated with this model violate the intercept ordering criterion. In this case, the
C© Blackwell Publishing, Inc. 2008.

56 JOURNAL OF REGIONAL SCIENCE, VOL. 48, NO. 1, 2008
intercept for the low equilibrium has the wrong sign. Taken literally, the esti-mates would imply that cities that receive a negative shock of magnitude 0.1percent or more would increase their size by 10 percent. This is inconsistentwith the model underlying the exercise, hence we rule it out.16 The data dolet us draw a different conclusion. We can ask: Contingent on believing thatmultiple equilibria are possible, does the data suggest that negative shocks canmove urban populations to lower equilibria? The answer to this question is “no.”Following enormous shocks there is no evidence that cities unravel further orfail to return to their former size.
We now examine whether multiple equilibria are evident at the city ag-gregate manufacturing level. Since manufacturing constitutes significantlyless than half of all economic activity, it is quite possible that geographymight lock in population but not aggregate city manufacturing. Indeed, alarge class of theory about multiple equilibria in economic geography mod-els is about the location of manufacturing. The results for city-manufacturingappear in Tables 5 and 6. The number of observations falls to 98 becausethe Japan City Yearbook only reports production data for the largest cities.As expected, the instrumentation equations (reported in the first columnof Table 5) reveal death and destruction significantly affect the growth ofproduction.
Turning to our threshold regressions in columns 2–5 of Table 6, the Schwarzcriterion clearly favors the model of one equilibrium. The model of multipleequilibria that fares best is the two equilibria model. Here, the estimated inter-cept for the growth path for the lower equilibrium lies below the intercept forthe higher equilibrium, although the intercepts are not statistically distinct.As we move to higher numbers of potential equilibria, the Schwarz criterioncontinues to reject these models ever more strongly and the parameters vio-late the intercept ordering criterion. For example in the three equilibrium case,the parameter estimates indicate that by increasing the magnitude of a nega-tive shock from just under 0.3 percent to anything under 1.4 percent of output,would cause the equilibrium output to rise by 1.33 log units. Moreover, thecloseness of the threshold values and volatility of the estimates suggests theseresults are being driven by a few outliers between thresholds that are very closetogether and probably do not reflect multiple equilibria.
Other parameter estimates seem to be precisely estimated and plausiblein magnitude. Reconstruction expenses have the correct sign in most specifi-cations and are significant at the 10 percent level. Interestingly, past growthrates of manufacturing seem to have, if anything, a negative correlation withfuture growth rates. This may suggest some degree of mean reversion over longtime periods.
16In principle, one could think about a more complicated model in which a negative shockmight provide an opportunity for more than a full recovery. Perhaps this could be constructed as avariant of the model of Brezis, Krugman, and Tsiddon (1993). In any case, such an outcome is clearlyinconsistent with multiple equilibria in the context of the model underlying our data exercise.
C© Blackwell Publishing, Inc. 2008.

DAVIS AND WEINSTEIN: A SEARCH FOR MULTIPLE EQUILIBRIA 57
TABLE 5: Instrumenting Equations
Dependent variable is growth ratebetween 1938 and 1948
Total Standard IRFE w/ Standardmanufacturing errors industry shocks errors
(1) (1a) (2) (2a)
Growth between 1932 and 1938 −0.368 (0.107) −0.239 (0.049)Deaths per capita 1.54 (3.66) −0.317 (2.13)Buildings destroyed per capita −8.00 (1.64)Destruction ∗ Ceramics −4.38 (4.80)Destruction ∗ Chemicals −7.70 (4.19)Destruction ∗ Processed Food −4.03 (2.83)Destruction ∗ Lumber and Wood −5.27 (2.55)Destruction ∗ Machinery 1.65 (4.12)Destruction ∗ Metals −11.3 (4.97)Destruction ∗ Printing and Publishing −2.39 (3.09)Destruction ∗ Textiles and Apparel −11.7 (2.51)Gov’t reconstruction expenses 14.0 (10.3) 3.51 (9.81)Constant 0.700 (0.111)Ceramics constant 0.141 (0.371)Chemicals constant 0.884 (0.332)Processed Food constant 0.505 (0.200)Lumber and Wood constant 0.554 (0.191)Machinery constant −0.039 (0.295)Metals constant 0.840 (0.378)Printing and Publishing constant 0.540 (0.236)Textiles and Apparel constant 0.439 (0.189)
R2 0.309 0.211Number of observations 98 325
Note: Standard errors are in parenthesis to the right of estimated coefficient value.
Given that our threshold regression has indicated that a unique equilib-rium is the preferred model, it is reasonable to ask whether we obtain plausibleestimates of if we take as the null that the manufacturing output in each lo-cation is uniquely determined. In order to assess this, we estimate equation (3)using instrumental variables and report the results in column 1 of Table 6.Most interesting for our purposes is the coefficient on wartime growth. It isnegative, significant, and indistinguishable from minus unity even though thepoint estimate is of slightly smaller magnitude. Once again we cannot rejectthe hypothesis that manufacturing shares recover completely from these tem-porary shocks. This time, however, the standard errors are larger, in part dueto the smaller number of observations and the greater variability in manufac-turing output relative to that of population.
Although we cannot reject the hypothesis that equals zero, the point esti-mate we obtain is 0.26. It is therefore reasonable to ask whether the assumption
C© Blackwell Publishing, Inc. 2008.

58 JOURNAL OF REGIONAL SCIENCE, VOL. 48, NO. 1, 2008
TABLE 6: Aggregate Manufacturing
1938 and 1948 plus 1948 and 19691948 and 1969
Dependent variable is IV Estimate 1 Equilibrium 2 Equilibria 3 Equilibria 4 Equilibriagrowth rate between. . . (1) (2) (3) (4) (5)
Growth rate between −0.287 −0.397 −0.376 −0.340 −0.3601932 and 1938 (0.146) (0.131) (0.131) (0.127) (0.126)
Growth rate between −0.7371938 and 1948 (0.214)
1 −0.306 −1.47 −1.47(0.184) (0.434) (0.429)
3 −1.33 −0.954(0.452) (0.495)
4 −1.6990(0.323)
Gov’t reconstruction 22.1 25.3 −4.01 21.3 21.3criterion (11.6) (12.8) (8.86) (12.5) (12.4)
Constant 0.291 0.376 −0.170 1.77 1.76(0.113) (0.102) (0.0586) (0.432) (0.427)
Thresholdsb1 −0.0490 −0.014 −0.014b2 −0.003 −0.003b3 0
Intercept ordering N/A N/A Pass Fail Failcriterion
Schwarz criterion N/A −131 −134 −135 −137Number of 98 98 98 98 98
observations
Note: Standard errors are in parenthesis below estimated coefficient value.
that equals zero, imposed in the implementation of the threshold regression,might be biasing our results. If is indeed greater than zero, it is straight-forward to see that this would bias our estimates of 1 downward and the 3’supward. The reason is that if is positive, the error term will contain ci48,which is negatively correlated with the lower indicator variable and positivelycorrelated with the higher indicator variable. This means that our tests willbe biased in favor of finding multiple equilibria because the coefficient on thelower indicator is biased downwards and the coefficient on the higher one isbiased upwards. The fact that we reject the model of multiple equilibria despitethis potential bias strengthens the case for the unique equilibrium version.
We next consider the question of whether multiple equilibria matter forindividual industries within manufacturing. There are a number of reasonswhy this might allow a finding of multiple equilibria even where it was diffi-cult to find them at higher levels of aggregation. One reason is that the focuson individual industries goes a long way toward relieving purely geographicalconstraints that can bind more tightly on city population or even aggregate city
C© Blackwell Publishing, Inc. 2008.

DAVIS AND WEINSTEIN: A SEARCH FOR MULTIPLE EQUILIBRIA 59
manufacturing. Namely, if population equilibria are stable and shares of man-ufacturing are proportional to city population, it could be the case that manu-facturing simply grew with population. This view of the world does not does notfind much support in the data. While there is no question that there is a strongpositive correlation between city-size and the size of manufacturing (which inour data is 0.95), the correlation necessary to link population with manufactur-ing in our econometric specification is a correlation between the growth rates.The correlation between the growth rate of manufacturing between 1948 and1969 with population between 1947 and 1970 is only 0.33.17 This low correla-tion suggests that the growth rate of manufacturing is not easily explainableby the growth rate of population alone. Nevertheless, it may make sense to seeif the results hold up on datasets that exhibit even lower correlations with pop-ulation growth. For example, since the correlation between the growth rate ofsectors within manufacturing and urban population is only 0.13, we can safelyclaim that the recovery of a city’s population is largely uncorrelated with thegrowth rates of individual industries within the city.
A more compelling reason to examine disaggregated data is that the priorfocus using higher levels of aggregation may have obscured a great deal of theheterogeneity across cities. As noted before, differences in bombing accuracy,which industries were targeted, geography, urban defenses, and just plain luckled to very different outcomes among industries in cities. If precision attackssavaged Nagoya’s machinery industry but spared its metals sector, did thishave a long-term effect on the structure of production in the city?
Working with the more disaggregated data enables us to exploit the factthat bombing is likely to affect industries differently. For example, sectors incities that were principally targeted by high-explosive bombs, such as machin-ery, were likely destroyed with relatively small amounts of collateral damage toother structures. Other sectors, such as textiles, were typically affected througharea bombing that destroyed large numbers of structures. Hence, by interact-ing our building destruction variable with an industry dummy and includingindustry fixed effects, we can exploit the variation generated by the varyingcorrelations between building destruction and output reductions of particularsectors.
Results from this estimation are presented in Table 5. As one can see,building destruction has no discernible impact on machinery output, but thelow fixed effect for this sector indicates that it was fairly uniformly targeted.At the other extreme is textiles, which was a fairly unconcentrated sector inprewar Japan, and which is extremely sensitive to area bombing. It is hard togive clear interpretations to the other coefficients except to say that the datastrongly reject the notion that bombing affects all industries similarly.
If we multiply the coefficient estimates by death and the interaction of de-struction with the industry dummies, we obtain a measure of the magnitude
17The different start and end points correspond to the different years in which the manufac-turing surveys and censuses were performed.
C© Blackwell Publishing, Inc. 2008.
60 JOURNAL OF REGIONAL SCIENCE, VOL. 48, NO. 1, 2008
of the shock in each industry within a city that was due to the bombing. Onceagain we can use these estimates to calculate the shock values and perform thethreshold regression. The results are presented in Table 7. Government recon-struction expenses cease to have any impact in these specifications probablybecause these expenditures did not target particular industries in particularlocations and hence there is little correlation between these regionally-directedexpenditures and the growth rate of particular industries. More interesting forour purposes, however, is the fact that the Schwarz criterion prefers the modelin which there is a unique equilibrium. This implies that not only do populationand aggregate manufacturing return to their prior level, but that even shocksto particular industries within those cities were reversed.
Of the specifications that entail multiple equilibria, the one featuringtwo equilibria again appears most plausible even though it is rejected by theSchwarz criterion. The estimated threshold is at −0.67 log units, which indi-cates that those industrial locations saw their output fall 49 percent more thanthe Japan average. Given that the average industry in Japan fell by 87 percentas a result of the war, these locations saw output fall by around 93 percent.Indeed, the industrial locations that make up the data in this interval onlyinclude the 15 percent of the data that comprise the most bomb sensitive in-dustries in the hardest hit locations. While one might want to interpret thepoint estimate of −0.425 for 1 as evidence that these cities shifted to a newlower equilibrium, the point estimate violates the intercept-ordering criterion,because the new equilibrium point lies to the right of the threshold (at −0.672).Hence, the most sensible multiple equilibria model is rejected by the data anddoes not produce plausible point estimates.
To investigate the plausibility of the interpretation that a high might bebiasing the estimate for 1 downward, we estimated in unique equilibriumcase using instrumental variables. Since the Schwarz criterion indicates thatthis is the correct model, it seems appropriate to see what value for we obtain.Our parameter estimate for − 1 is 0.655 (i.e., is 0.34). Moreover, we can rejecta of 0 (but not 0.1) at conventional levels. One possible reason for this higherestimate of is that it may be the case that places hit extremely hard takelonger to recover. One of the features of the industry data is that the impactsof bombing were significantly more heterogeneous across industrial locationsthan across urban populations or aggregate manufacturing. For example, thestandard deviation of our shock variable received for bombed cities was 0.09when we use population data but 0.41 when we use industry data. This sug-gests that there were far more industries that received extreme shocks thanpopulations. One reason why this might matter is that Davis and Weinstein(2002) found that it took Hiroshima’s population, which had a casualty rate inexcess of 20 percent, around half again longer than the typical city to recover.
Given that 10 percent of our data below, the lower threshold comes from Hi-roshima as well as our two most extreme points, it is reasonable to ask whetherindustries in Hiroshima are responsible for finding > 0. Dropping Hiroshimadoes not qualitatively affect any of the threshold regressions (using any of the
C© Blackwell Publishing, Inc. 2008.

DAVIS AND WEINSTEIN: A SEARCH FOR MULTIPLE EQUILIBRIA 61
TA
BL
E7:
Indi
vidu
alIn
dust
ryR
un
sw
ith
Indu
stry
Fix
edE
ffec
ts:B
ombi
ng
All
owed
toH
ave
Dif
fere
nt
Indu
stry
Impa
cts
1948
and
1969
1938
and
1948
plu
s19
48an
d19
69
IVIV
Est
.1
23
4D
epen
den
tva
riab
leis
Est
imat
eN
oH
iros
him
aE
quil
ibri
um
Equ
ilib
ria
Equ
ilib
ria
Equ
ilib
ria
grow
thra
tebe
twee
n..
.(1
)(2
)(3
)(4
)(5
)(6
)
Gro
wth
rate
betw
een
−0.1
32−0
.150
−0.2
13−0
.218
−0.2
19−0
.225
1932
and
1938
(0.0
476)
(0.0
510)
(0.0
450)
(0.0
446)
(0.0
443)
(0.0
44)
Gro
wth
rate
betw
een
−0.6
55−0
.747
1938
and
1942
(0.1
24)
(0.1
35)
1
−0.4
25−0
.836
−0.3
89(0
.157
)(0
.0.2
40)
(0.1
67)
3
−0.7
000.
776
(0.2
48)
(0.2
40)
4
0.03
10(0
.247
)G
ov’t
reco
nst
ruct
ion
−1.2
2−1
.01
−0.5
430.
133
−5.4
1−5
.20
expe
nse
s(7
.64)
(7.9
2)(9
.07)
(8.9
8)(9
.10)
(9.0
4)T
hre
shol
dsb 1
−0.6
72−0
.188
−0.6
72b 2
−0.1
07−0
.187
b 3−0
.107
Inte
rcep
tor
deri
ng
N/A
N/A
N/A
Fail
Fail
Fail
crit
erio
nS
chw
arz
crit
erio
nN
/AN
/A−4
51−4
53−4
56−4
59N
um
ber
of32
531
932
532
532
532
5ob
serv
atio
ns
Not
e:S
tan
dard
erro
rsar
ein
pare
nth
esis
belo
wes
tim
ated
coef
fici
ent
valu
e.
C© Blackwell Publishing, Inc. 2008.

62 JOURNAL OF REGIONAL SCIENCE, VOL. 48, NO. 1, 2008
datasets), but it does drive down the estimate of by 0.1 (as one can see incolumn 2 of Table 7) and makes it indistinguishable from zero. Hence, we canconclude that the industry-level runs always support the model featuring aunique equilibrium, and we cannot reject the hypothesis that industries hitwith nonnuclear ordnance returned to their prewar locations after 24 years.
In short, the conclusions above from city population and aggregate citymanufacturing data are strongly reinforced when we turn to the disaggregatedcity-industry data. The population of cities, aggregate manufacturing, and evenspecific industries have no tendency to move to lower equilibria following largeshocks.
One additional possibility that it is worth exploring is whether it is possiblethat manufacturing consists of some industries that exhibit multiple equilibriaand others that do not. We have already presented plots indicating that in mostindustries the data suggests that there is a strong tendency for damaged indus-trial locations to recover. Unfortunately, we do not have enough observations toconduct tests of multiple equilibria for individual industries that have powerto distinguish between hypotheses. One way around this problem is to test formultiple equilibria among the set of industries that are a priori most likely toexhibit them. It is often argued that concentrated industries are more likelyto exhibit increasing returns and multiple equilibria. Thus, it is reasonable toask whether we would obtain the same results if we restricted our estimationto sectors which are more geographically concentrated.
In order to determine which sectors are the most geographically concen-trated, we constructed Herfindahl indices based on the share that each industryhad in each location. Given that we had 98 or 99 observations in each industry, aHerfindahl of unity indicates perfect geographic specialization, while a Herfind-ahl of 0.01 indicates no specialization. In our sample, this procedure yields aplausible set of industries as candidates for increasing returns. The most con-centrated sector is Printing and Publishing (Herfindahl = 0.28) followed byMachinery (0.19), Metals (0.18), and Chemicals (0.15). The least concentratedsectors were Processed Foods (0.08) and Textiles (0.05).
Our estimates using only data from the four most concentrated industries—Printing and Publishing, Machinery, Metals, and Chemicals—resulted in ourdropping about two-thirds of the data. The reason why our sample containsmore points from less concentrated industries is that concentrated industriescontain more zeros or industries of trivial size. Had we kept our bin sizes at5 percent of the data this would have meant that we were trying to identifyequilibria using only five or six points instead of the 33 points that we wereworking with earlier. Since this would make our procedure vulnerable to out-liers, we increased our bin size to 10 percent of the data, which still meant thatwe were searching for equilibria that could encompass as few as 11 points.
Splitting the sample this way resulted in coefficients that were not quali-tatively different from those reported in Table 7. The Schwarz criterion prefersthe model of one equilibrium and the coefficient on wartime growth is negativeand significant. As in Table 7, the estimate of was just above zero for the
C© Blackwell Publishing, Inc. 2008.

DAVIS AND WEINSTEIN: A SEARCH FOR MULTIPLE EQUILIBRIA 63
full sample, but indistinguishable from zero if Hiroshima was dropped. As aresult, we conclude that our results are robust to limiting our sample to themost concentrated industries.
5. CONCLUSIONS
The concept of multiple equilibria is a powerful force in modern economicthought. Yet, theory has far outpaced formal empirics. The most crucial empiri-cal question—are multiple equilibria a salient feature of real economies—seemshardly to have been touched. One reason for the scarcity of empirical work test-ing for the existence of multiple equilibria is that they are inherently difficultto identify. In many contexts, one needs large, exogenous, highly variable, andtemporary shocks. Such experiments are rare.
The present paper considers the Allied bombing of Japan during WorldWar II as precisely such an experiment. The paper makes important advancesover prior work. It provides the first test for multiple equilibria in the location ofproduction. To do this, it develops simple analytics and an associated thresholdregression framework for distinguishing the hypotheses of unique versus mul-tiple equilibria. It then applies these tests to data on city population, aggregatecity manufacturing, and city-industry data for eight manufacturing industries.The disaggregated industry runs are particularly important because they re-move any obvious geographical limitations on the opportunities of particularcity-industry observations to expand or contract.
The results of our experiments are clear: At all levels of aggregation ex-amined, the data prefer a model of unique equilibrium. In the aftermath of ashock, there is a strong tendency for city population, aggregate manufacturingand even the particular industries that existed prior to the shock to return totheir former importance. As such, the results are also a caution against anytendency to view small policy interventions as likely to have large effects in theselection of equilibria.
We hope that our paper will encourage further work by researchers in thisand other fields to explore more deeply the empirical importance of multipleequilibria. The negative results for multiple equilibria in the context of citypopulation and production structure obviously need not carry over to othercontexts. We believe that the methods we develop to test for multiple equilibriaare suitable for application in a broad range of fields. Moreover, we hope thatour paper has demonstrated that empirical examination of these issues is bothfeasible and worthwhile.
REFERENCESBaldwin, Richard, Rikard Forslid, Philippe Martin, Gianmarco Ottaviano, and Frederic Robert-
Nicoud. 2003. Economic Geography and Public Policy. Princeton: Princeton University Press.Cohen, Jerome B. 1949. Japan’s Economy in War and Reconstruction, Minneapolis: University of
Minnesota Press.Cooper, Russell. 2002. “Estimation and Identification of Structural Parameters in the Presence of
Multiple Equilibria,” mimeo, Boston University, May.
C© Blackwell Publishing, Inc. 2008.

64 JOURNAL OF REGIONAL SCIENCE, VOL. 48, NO. 1, 2008
Cooper, Russell and Andrew John. 1988. “Coordinating Coordination Failures in Keynesian Mod-els,” Quarterly Journal of Economics, 103(3), 441–463.
David, Paul A. 2000. “Path Dependence, Its Critics, and the Quest for ‘Historical Economics’,”Stanford University Working Papers 00-011.
Davis, Donald R. and David E. Weinstein. 2002. “Bones, Bombs, and Breakpoints: The Geographyof Economic Activity,” American Economic Review, 92(5), 1269–1289.
Fujita, M., P. R. Krugman, and A. J. Venables. 1999. The Spatial Economy: Cities, Regions, andInternational Trade. Cambridge: The MIT Press.
Fujita, M. and J.F. Thisse. 2002. Economics of agglomeration. Cambridge: Cambridge U. Pr.Gabaix, Xavier. 1999. “Zipf’s Law for Cities: An Explanation,” Quarterly Journal of Economics,
114(3), 739–767.Gallup, John, Jeffrey Sachs, and Andrew Mellinger. 1999. “Geography and Economic Development,”
International Regional Science Review, 22(2), 179–232.Hammel, Eric. 1998. Air War Pacific: America’s Air War Against Japan in East Asia and the Pacific
1941–1945 Chronology. Pacifica: Pacifica Press.Henderson, J.V. 1974. “The Sizes and Types of Cities,” American Economic Review, 64, 640–656.Krugman, P. R. 1991a. “Increasing Returns and Economic Geography,” Journal of Political Econ-
omy, 99, 483–499.———. 1991b. “History versus Expectations,” Quarterly Journal of Economics, 106(2), 651–667.Krugman, Paul R. and Anthony J. Venables. 1995. “Globalization and the Inequality of Nations,”
Quarterly Journal of Economics, 110(4), 857–880.Lucas, Robert E, Jr. 2001. “Externalities and Cities,” Review of Economic Dynamics, 4(2), 245–274.Management and Coordination Agency of Japan, 1987. Nihon Choki Tokei Soran (Historical Statis-
tics of Japan), Vol. 1, pp. 94–104.Matsuyama, Kiminori, 1995, “Complementarities and Cumulative Processes in Models of Monopo-
listic Competition,” Journal of Economic Literature, American Economic Association, vol. 33(2),pp. 701–729, June.
Moro, Andrea. 2003. “The Effect of Statistical Discrimination on Black-White Wage Inequality:Estimating a Model With Multiple Equilibria,” International Economic Review, 44(2), 467–500.
Murphy, Kevin M, Andrei Shleifer, and Robert W. Vishny. 1989. “Industrialization and the BigPush,” Journal of Political Economy, 97(5), 1003–1026.
Nakamura, Takahide. and Masayasu Miyazaki. ed. 1995. Shiryo Taiheiyo Senso Higai ChosaHokoku (Damage Survey Report of the Second World War) Todai Shuppankai.
Neary, J.P. 2001. “The Spatial Economy: Cities, Regions and International Trade by Fujita M,Krugman P, Venables AJ,” Journal of Economic Literature, 39(2), 536–561.
Rappaport, Jordan and Jeffrey D. Sachs. 2001. “The US as a Coastal Nation,” Mimeo.Statistics Bureau of the Prime Minister’s Office. 1950. Nihon Tokei Nenkan. Japan Statistical
Yearbook, pp. 154–155.Simon, H. 1955. “On a Class of Skew Distribution Functions,” Biometrika, 42, 425–440.Tokyo Shisei Chosakai. Various Years. Nihon Toshi Nenkan [Japan City Yearbook] Tokyo: Daiichi
Hoki Shuppan.Toyo Keizai Shinposha. ed. 1991. Kanketsu Showa Kokusei Soran [Complete Showa Census Com-
pendium] Vol. 1, Tokyo: Toyo Keizai Shinposha.Tsusan, Sangyo, Daijin Kanbo, and Chosa Tokeibu. 1961. Kogyo Tokei 50 Nenshi [50 Year History
of Industrial Statistics] Tokyo: Okurasho Insatsukyoku.United States Strategic Bombing Survey. 1947. Effects of Air Attack on Japanese Urban Economy.
Vol. 55, Washington, D.C.: Urban Areas Division.Werrell, Kenneth P. 1996. Blankets of Fire: U.S. Bombers over Japan during World War II. Wash-
ington: Smithsonian Institution Press.
DATA APPENDIX
There are two principal sources of information on death and destructioncaused by World War II in Japan: the U.S. Strategic Bombing Survey (USSBS)
C© Blackwell Publishing, Inc. 2008.

DAVIS AND WEINSTEIN: A SEARCH FOR MULTIPLE EQUILIBRIA 65
(1947) and Nakamura and Miyazaki (1995). This latter source is basically areprint of “The Report on Damage and Casualties of World War II” compiledby The Central Economic Stabilization Board (CESB) in 1949 and reprintedin Nakamura and Miyazaki (1995). The U.S. source is particularly good formatching death and destruction to particular the U.S. air operations, whilethe Japanese source is a far more complete 600-page census of all death anddestruction that occurred within Japan proper. As such, we use Nakamura andMiyazaki (1995) as the source for all death and destruction data presented inour tables, figures, and regressions.
Urban population data were taken from the Kanketsu Showa Kokusei So-ran. This data source reports urban populations for several hundred cities basedon censuses every 5 years.18 The only exception is 1945. The 1945 census ofcities was not performed until 1947 due to the war. This is actually fortunatefor us. Japanese ground transportation was largely unaffected by the war. Thismeans that by 1947, anyone who had fled due to the fear of air strikes couldhave returned provided that housing and employment existed there.
Urban manufacturing data was taken from the Japan City Yearbook, andreconstruction expense data was taken from the Japan Statistical Yearbook.
18We dropped the city of Kure from our data. Kure became the site of a major Japanese navalarsenal. As a result its population rose 50 percent between 1925 and 1940 as Japan built up itsfleet. Kure was heavily bombed during the war and then returned to its prewar size as demand fornaval warships approached zero after the war.
C© Blackwell Publishing, Inc. 2008.

66


![On boundedness of solutions of periodic systems: a ... · multiple equilibria are [1], [5], [9]. A special case of systems often exhibiting multiple equi-libria is represented by](https://img.dokumen.tips/doc/110x75/60c44b86cf2f0a38fc7823b9/on-boundedness-of-solutions-of-periodic-systems-a-multiple-equilibria-are-1.jpg)