Embed Size (px)
Citation preview
A RoAd MAp foR AddRessing QuAlity And MAnufActuRing chAllenges in life sciences:Moving Beyond RegulAtoRy BuRdens to enABle new collABoRAtive Models foR gRowth
CONNECT:
lnsresearch.com

A Road Map for Addressing Quality and Manufacturing challenges in life sciences: Moving Beyond Regulatory Burdens to enable new collaborative Models for growth
tABle of contents
Section 1: Executive Summary . . . . . . . . . . . . . . . . . . . . . . . . . . . . . . . . . . . . . . . . . . . . . . . . . 3
Section 8: The Next Generation of Quality and Compliance Software . . . . . . . . . . 33
Section 2: Research Demographics . . . . . . . . . . . . . . . . . . . . . . . . . . . . . . . . . . . . . . . . . . . . 5
Section 7: Next-Generation MOM Software and Traceability Capabilities . . . . 25
Section 3: Life Sciences Megatrends . . . . . . . . . . . . . . . . . . . . . . . . . . . . . . . . . . . . . . . . . . . 8
Section 9: Recommended Actions & Final Takeaways . . . . . . . . . . . . . . . . . . . . . . . . . 39
Section 5: Industry Trends and Challenges . . . . . . . . . . . . . . . . . . . . . . . . . . . . . . . . . . . 16
Section 4: Individual Company Responses . . . . . . . . . . . . . . . . . . . . . . . . . . . . . . . . . . . . . 12
Section 6: Moving to a Culture of Operational Excellence . . . . . . . . . . . . . . . . . . . . 21

section 1
eXecutive suMMARy

executive summaryThe life sciences industry faces many challenges coming from all directions,
and the most immediate and pressing are external. Due to the inextricable
connection between the industry’s products and public health, life
sciences companies are subject to increasingly strict regulatory measures,
which are only poised to tighten in the future.
Additionally, the face of the life sciences industry/pharmaceuticals
is in the midst of a broad transformation as healthcare adapts to
growing world populations and standards of living, a move toward more
personalized medicine, and a growing number of dispersed suppliers.
Put simply, the systems and processes life sciences have used to
manage production and quality up until now are inadequate. But
in this daunting operational climate is opportunity.
Today, leading life sciences companies are greatly enhancing
operational capacity and achieving business value through the adoption
of next-generation Enterprise Quality Management Software (EQMS) and
Manufacturing Operations Management (MOM) software, along with
formal processes to better manage quality and build the end-to-end
traceability capabilities that have become so vital for compliance.
This eBook dives deep into life science challenges and how leading
organizations are approaching them.
Specifically, it addresses:
• Howrisingworldpopulationsandstandardsof livingare increasing
spending on healthcare
• PressuresofcGMPregulationsfromFDAandotherregulatorybodies.
• Organizationforapproachingqualityholisticallyratherthan
“as a department”
• Real-world examples of leading life science companies’ responses
to regulation issues
• Benchmark data on how EQMS and MOM applications correlate
to improvements in On-Time Complete Shipments (OTCS),
New Product Introduction (NPI), and Products in Compliance (PiC)
• Recommendedactions
QuAl
ity
& M
Anuf
Actu
Ring
ch
Alle
nges
in l
ife
scie
nces
pAge
4
1
3
5
7
9
2
4
6
8

section 2
ReseARch deMogRAphics

Research demographics: Quality ManagementThe 2012-2013 LNS Research Quality Management Survey has been
completed by over 500 executives and other senior leaders, hailing from
companies large and small across a range of industries and locations. The
survey questions drill down into the challenges and opportunities that
companies face, strategic objectives data, and the most important goals
currently being pursued around quality. As seen in the demographic
information listed above, more than half of the respondents were from
discrete manufacturing industries. A majority of the participants, 51.5%,
were from North America, with 41.2% from Europe. And nearly half,
43.4%, were from medium-sized companies, with 35.6% and 21% from
small and large companies, respectively.
coloR By coMpAny Revenue
lARge: $18BB++
MediuM: $250MM–$1BB
sMAll: $0–$250M
coloR By hQ locAtion
AsiA
euRope
Middle eAst/AfRicA
noRth AMeRicA
coloR By industRy
discRete MAn
f&B / cpg
life sciences
pRocess MAn
21.0%
35.6%
43.4%
51.5% 41.2%
6.1%
2.2%
18.1%
16.8%
54.3%
10.8%
QuAl
ity
& M
Anuf
Actu
Ring
ch
Alle
nges
in l
ife
scie
nces
pAge
6
1
3
5
7
9
2
4
6
8

Research demographics: Manufacturing operations ManagementThe pie charts above provide background demographic information
on the LNSResearchMOM survey participants.As shown, the results
depictadiversesetofRespondents.Therewere60%fromthediscrete
manufacturing industries, 10% from process manufacturing, 16% from
food&beverage/consumerpackagedGoods,and13%fromlifesciences.
Nearly 65% of the executives surveyed were from Small to Medium
businesses, with 35.6% from Companies with revenue greater than $1
billion.Geographically,NorthAmerican companies composed44%of
respondents;32%were fromEurope,12%fromtheAsia/Pacificregion,
and 11% were from the rest of the world.
coloR By coMpAny Revenue
lARge: $18BB++
MediuM: $250MM–$1BB
sMAll: $0–$250M
coloR By hQ locAtion
AsiA/pAcific
euRope
Rest of woRld
noRth AMeRicA
coloR By industRy
discRete MAn
f&B / cpg
life sciences
pRocess MAn
35.6%
49.4%
15.0%
4.44%32.0%
11.4% 12.2% 16.1%
10.2%
60.4%
13.3%
QuAl
ity
& M
Anuf
Actu
Ring
ch
Alle
nges
in l
ife
scie
nces
pAge
7
1
3
5
7
9
2
4
6
8

section 3
life sciences MegAtRends

world population and economic growthAs the global population continues to grow the world faces unprecedented
challenges in healthcare. As life expectancy increases, predictions for the
proportion of the population over 65 approach or exceed 10% globally,
20% in Western Europe and 27% in Japan by 2017. In parallel, the number
of high-income households is on the rise with more than 500 million
households earning over $25,000. Over half of this growth comes from
Asia. As a result, the average increase in global spending on healthcare is
expected to rise an average of 5.3% (4.4% per head) through 2017.
Despite pressure to reduce healthcare costs, sector expansion is
predicted, driven by treatment advancements and government initiatives
as an aging population creates an increase of incidences of chronic
ailments that are expensive to treat.
china’s Aging population vs. global comparison groupAging population in China
(2008–2020F)
% percentage of aged 65 +
population aged 65 +
107
8.28
111
8.50
113
8.60
118
8.90
121
9.10
126
9.40
129
9.60
136
171120.9
42.430.1
10.71.5 6.0
16.9
12.40
Comparison of population 65+
Number in Million (2012)
population aged 65 +
chin
A us
JApA
n uK
MAl
Aysi
A
s. K
oReA
geRM
Any
JApA
n
geRM
Any
Rich
woR
ld us
chin
A
dev.
woR
ld
2008
2009
2010
2011
2012
2013
2014
2015
2020
the Big shiftOld-age dependency, population aged 65 and over per 100 people aged 25–64
2000 2010 2035*
10.16
70
60
50
40
30
20
10
0
Reference: http://www.economist.com/news/briefing/21601248-generation-old-people-about-change-global-economy-they-will-not-all-do-so
Reference: https://www2.deloitte.com/content/dam/Deloitte/global/Documents/Life-Sciences-Health-Care/dttl-lshc-2014-global-health-care-sector-report.pdf
China’s elderly population exceeds the combined elderly population in
this comparison group.
QuAl
ity
& M
Anuf
Actu
Ring
ch
Alle
nges
in l
ife
scie
nces
pAge
9
1
3
5
7
9
2
4
6
8

$100M
$10M
$1M
$100K
$10K
$1K
personalized Medicine: A trend on the horizon Personalized medicine is the ubiquitous term to describe the potential
for treatments specifically tailored for an individual patient based
on their individual genotype (genetic characteristics). Since its
beginnings in the 1990s, this field has slowly gainedmomentum to
present day, where some say that global healthcare is on the cusp of
thisrealitywhileothersassertthatthetimehasalreadyarrived(FDA).
Nevertheless, at present only 102 pharmaceuticals have an “associated”
biomarker to date (GENReports:Market&Tech Analysis, Produced by
EnalRazvi,Ph.D.©2014).
As acceptance increases and costs for genomic sequencing are reduced
themarkethasexperiencedgrowth.Forexample,costshaveplummeted
inthelastsixyearsandthe“$1,000Genome”isonthenearhorizon.
A vast change from the $100M cost less than 15 years ago.
A substantial share of current growth is expected to be generated
by cancer companion diagnostics. It is clear though that based on
cancercarecostsalonethecompaniondiagnosticsmarketisattractive.
One critical element for personalized medicine is the speed of
newinvitrocompaniondiagnostic(IVD)devicestomarketwherethese
are required for the safe and effective use in personalized therapies.
Organizations with mature EQMS solutions have demonstrated
improved NPI.
One impact on the life sciences sector as emphasis on personalized
medicinetakesholdisthepotentialforfewerblockbusterdrugsmakingit
tomarket.ThegapbetweenR&Dspendinpharmaanddrugapprovalsby
theFDA(knownastheinnovationgap)isindicativeoftheneedaheadfor
different, streamlined manufacturing models while enhancing traceability.
The success of this will rely heavily on technology.
Other advances that will play into the overall picture of personalized
medicine include devices designed to be capable of monitoring and
processing individual health characteristics and the traceability of these
products. As monitoring devices become pervasive a new wave of
individual patient data will feed the Big Data landscape, increasing the
demand and opportunity for analysis service and resulting diagnoses.
peRsonAliZed Medicine
coMpARison diAgnostictARgeted theRApeutic
2001
2002
2003
2004
2005
2006
2007
2008
2009
2010
2011
2012
2013
2014
MooRe’s lAw
Reference:(NHGRI) http://www.genome.gov/sequencingcosts/
huMAn genoMe seQuencing costs
QuAl
ity
& M
Anuf
Actu
Ring
ch
Alle
nges
in l
ife
scie
nces
pAge
10
1
3
5
7
9
2
4
6
8

life sciences industry Regulatory BurdenNew challenges have placed and continue to place enormous pressures on
improving qualitymanagement andmanufacturing traceability. Regulatory
burdens and rising customer demands are two notable examples that have
changed the industry landscape over the past several years.
FDADirectoroftheCenterforDrugEvaluationandResearch(CDRH),
JanetWoodcock,statedinOctober2014that,“Qualityistheunderpinningof
everything we do, and it is imperative that we have a drug quality program as
robustasthoseprogramswepresentlyhavefordrugefficacyanddrugsafety.”
Addingcomplexity,theFDAplacesspecialfocusontheglobalnature
of manufacturing and raw materials sourced from outside the U.S.
The number of quality system inspections has been generally
increasinginrecentyears.Between2005and2012,FDA’sroutineQuality
SystemsRegulations(QSR)inspectionsincreasedbyatotalof37%and93%
respectively,inU.S.andforeignfirms.
To address increasingly aggressive regulatory oversight, forward
thinking companies are dramatically improving collaboration with their
researchandmanufacturingpartnerstoalleviatethepressureandreducerisk.
Routine QsR suRveillAnce inspections
Reference: http://www.raps.org/Regulatory-Focus/News/2014/10/16/20584/FDA-Announces-Major-Agency-Reorganization-With-Focus-on-Drug-Quality/
Reference: http://www.insidemedicaldevices.com/2014/06/04/fda-issues-report-on-2012-qsr-enforcement-activities/
2,500
2,000
1,500
1,000
500
0
2005
2006
2007
2008
2009
2010
2011
2012
foReign doMestic
QuAl
ity
& M
Anuf
Actu
Ring
ch
Alle
nges
in l
ife
scie
nces
pAge
11
1
3
5
7
9
2
4
6
8

section 4
individuAl coMpAny Responses

Quality in corporate ReportsOrganizations in life sciences face demands from customers and
shareholders to demonstrate that quality in and across the value chain
receives the appropriate attention. The strategic objectives that relate to
manufacturing and quality management are illustrated by clear statements
madeinannualreports.Pfizer,forexample,outlinestheimportanceof
quality,safetyandavailabilityof theirproducts,stating that they takea
“holistic, multi-faceted approach to quality and compliance programs.”
The annual report outlines how the company relentlessly challenges itself
to enhance systems and processes with numerous ongoing continuous
improvementprojects.Technologyiscitedasthekeytoleverageexpertise
throughout the supplier network, for the supply of quality products at
competitive prices.
“Pfizer is committed to supplying products to patients that significantly
improve their lives. Therefore, our manufacturing and supply division
focusesonensuringthatallthePfizerproductsareproducedtothehighest
standardsofquality,safetyandefficiancyandareavailablewhenneeded.”
600major product group
pfizer 2013 AnnuAl RepoRt
175markets
130+ market disttribution and
logistics center operation
200 contract manufacturers
56 manufacturing sites
MAnufActuRing And supply chAin
QuAl
ity
& M
Anuf
Actu
Ring
ch
Alle
nges
in l
ife
scie
nces
pAge
13
1
3
5
7
9
2
4
6
8
$277.8
$258.5
$229.8
$205.4
$166.9
$138.1
$128.9
$109.0
$100.8
$93.1
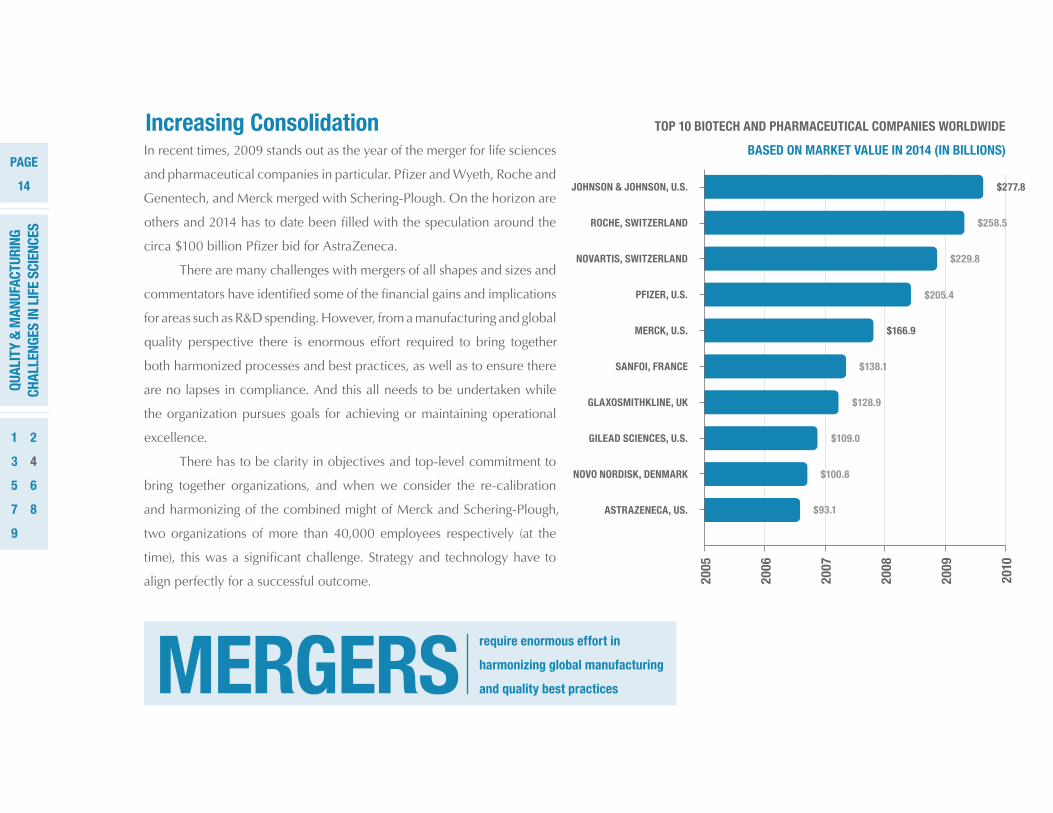
increasing consolidation In recent times, 2009 stands out as the year of the merger for life sciences
andpharmaceuticalcompaniesinparticular.PfizerandWyeth,Rocheand
Genentech,andMerckmergedwithSchering-Plough.Onthehorizonare
othersand2014hastodatebeenfilledwiththespeculationaroundthe
circa$100billionPfizerbidforAstraZeneca.
There are many challenges with mergers of all shapes and sizes and
commentatorshaveidentifiedsomeofthefinancialgainsandimplications
forareassuchasR&Dspending.However,fromamanufacturingandglobal
quality perspective there is enormous effort required to bring together
both harmonized processes and best practices, as well as to ensure there
arenolapsesincompliance.Andthisallneedstobeundertakenwhile
the organization pursues goals for achieving or maintaining operational
excellence.
There has to be clarity in objectives and top-level commitment to
bring together organizations, and when we consider the re-calibration
andharmonizingofthecombinedmightofMerckandSchering-Plough,
two organizations of more than 40,000 employees respectively (at the
time), thiswasasignificantchallenge.Strategyand technologyhave to
align perfectly for a successful outcome.
top 10 Biotech And phARMAceuticAl coMpAnies woRldwide
BAsed on MARKet vAlue in 2014 (in Billions)
Johnson & Johnson, u.s.
Roche, switZeRlAnd
novARtis, switZeRlAnd
pfiZeR, u.s.
MeRcK, u.s.
sAnfoi, fRAnce
glAXosMithKline, uK
gileAd sciences, u.s.
novo noRdisK, denMARK
AstRAZenecA, us.
MeRgeRs require enormous effort in
harmonizing global manufacturing
and quality best practices20
05
2006
2007
2008
2009
2010
QuAl
ity
& M
Anuf
Actu
Ring
ch
Alle
nges
in l
ife
scie
nces
pAge
14
1
3
5
7
9
2
4
6
8

Responding to Regulatory ActionInJune2014anofficialstatementwaspostedonBoehringerIngelheim’s
website to the effect that a warning letter, or 483 citation, had been lifted.
This is an example of one of the top 20 pharmaceutical companies having
a plant cited for violations of current good manufacturing practices
(cGMP) relative toCFR21Parts210&211.Thespecifics related toan
active pharmaceutical ingredient (API) and finished pharmaceutical
manufacturing facility in Europe.
The statement included specific reference to the improvements
made to remove the warning letter. “The successful lifting of the Warning
Letter is a measure of the progress we have made toward improving our
quality systems and manufacturing processes.” The company continued
to say, “We will continue to maintain and further improve our quality
systems to provide products of the highest possible standards to patients.”
This example is used not to single any manufacturer out but rather to
highlight how quality management and compliance are a challenge for the
larger, well funded enterprise and how a lapse in the quality management
system can occur.
Through2012FDAdataforinspectionalobservationshighlightsthe
two most pervasive lapses in quality subsystems corrective and preventive
actions(CAPA)andproductandprocesscontrol(P&PC).AstheFDAre-
organizes and increases focus proactively on quality both domestically
and globally organizations must rise to the challenge.
1600
1400
1200
1000
800
600
400
200
0
inspection oBseRvAtions 2003–2012 By QuAlity systeM suBsysteM
2002
2003
2004
2005
2006
2007
2008
2009
2010
2011
2012
2013
doc des MgMt cApA p&pc
QuAl
ity
& M
Anuf
Actu
Ring
ch
Alle
nges
in l
ife
scie
nces
pAge
15
1
3
5
7
9
2
4
6
8

section 5
industRy tRends And chAllenges

challenges with Quality ManagementLNSResearch’sQualityManagementsurveybringsintofocustheroadblocks
standing between Life Sciences organizations and effective Quality
Management. When asked about their top challenges, executives from
all Life Sciences industries placed considerable focus on quality culture,
effectively measuring quality metrics, and disparate systems and data sources.
Also, deeper analysis of this data shows that pharmaceutical manufacturing
companies in particular face challenges with visibility into supplier quality.
ThisisofrelevancetodayastheUSFDAandotherinternationalregulatory
bodies demonstrate more focus on upstream activities.
challenges Addressing top Quality Management objectives for life sciences
Quality is considered a department, not a responsibility
Quality metrics are not effectively measured
Disparate quality systems and data source
no formal process for continuous improvement
lack of visibility into supplier quality
lack of executive support
0%
12.5
%
25%
37.5
%
50%
29.9%
26.3%
18.4%
10.5%
10.5%
5.3%
QuAl
ity
& M
Anuf
Actu
Ring
ch
Alle
nges
in l
ife
scie
nces
pAge
17
1
3
5
7
9
2
4
6
8

0%
12.5
%
25%
37.5
%
50%
challenges with Manufacturing operations ManagementInaseparatesurvey—LNSResearch’sManufacturingOperationsManagement
survey—executiveswereaskedabouttheirtopchallenges.Thedatashows
alignment with the quality challenges regarding the effective management of
performance as well as operating with disparate systems and data sources.
Coupled with collaboration obstacles, this poses significant risk for Life
Sciencescompanieswhenconsideringsomethinglikeensuringend-to-end
traceability in a high-speed, complex global manufacturing environment. Life
sciencescompaniesneedtobeabletoquicklyreacttochangesincustomer
requirementsandmarketdemandswhilealsoensuring100%compliance
in operations, which can be incredibly challenging without harmonized
IT systems. Furthermore, identifying the root cause of non-conformances,
encouraging continuous improvement, and conducting what-if analysis based
on real-time performance become increasingly challenging as manufacturing
IT becomes more dispersed and disconnected over time.
challenges Addressing top Manufacturing objectives for life sciences companies
timely visibility into manufacturing performance metrics
Disparate systems and data sources
lack of collaboration across different departments
lack of continuous improvement culture & processes
lack of available talent
lack of executive support
RoI justifications for improvement investments
25.0%
20.0%
20.0%
10.0%
10.0%
10.0%
5.0%
QuAl
ity
& M
Anuf
Actu
Ring
ch
Alle
nges
in l
ife
scie
nces
pAge
18
1
3
5
7
9
2
4
6
8

Quality Management and traceability top trends impacting life sciencesIn another question, LNS Research asked Life Sciences executives in
particular about the top trends impacting organizations. Not surprisingly,
almost two in three noted regulatory requirements for quality management
asmakingthegreatestimpact.Notfarbehindwereregulatoryrequirements
for serialization and traceability.Given that the topqualitymanagement
challenges and the top manufacturing challenges were both related to
disparate systems and data sources, these quality and manufacturing trends
surfacing to the top is not a surprise even though it does create concern.
Quality and traceability challenges being at the top greatly highlights the
need for next-generation quality, compliance, and manufacturing technology
inLifeSciencesthatprovideflexibilitywhilealsoensuringcompliance.
top life sciences trends
Regulatory requirements for quality management
Regulatory requirements for serialization and traceability
increased need to reduce costs because of new market conditions
collaborative business models with outsourced research and manufacturing companies
competition from emerging markets
use of Quality by design to improve process understanding
need to speed new drugs and devices from research through clinical trials to patients
disposable manufacturing equipment and techniques
Application of process Analytical technology (pAt)
0% 15%
30%
45%
60%
59%
49%
41%
39%
36%
32%
20%
15%
14%
QuAl
ity
& M
Anuf
Actu
Ring
ch
Alle
nges
in l
ife
scie
nces
pAge
19
1
3
5
7
9
2
4
6
8

challenges with speeding products from R&d to patientsIt is no surprise that those organizations able to achieve a seamless New
ProductIntroduction(NPI)processtendtobetheonesleadingthemarket.
However, doing so is easier said than done. A separate question asked
specifically to Life Sciences executives regarding top challenges with
speedingproductsfromR&Dtopatientsshedsmorelightonthistopic—47%
ofexecutivescheckedqualitymanagementissuesasthegreatestroadblock
for successful NPIs, with supply chain optimization coming in second with
45% of respondents. Many may be surprised that these operational issues
actually have a greater impact than the actual discovery and approval
processes. The following sections in this eBook dive into these “issues,”
delineating the role of people, processes, and technology in achieving
market-leadingqualityandmanufacturingperformance.
top new product introduction challenges in life sciences
Quality Management issues
supply chain optimization
validation
gaps in product portfolio management
Rapidly scaling pilot processes, equipment and systems to volume production
inefficiency in managing basic research
inefficiency in regulatory submissions process
inefficiency in clinical trials
0%
12.5
%
25%
37.5
%
50%
47%
45%
34%
30%
25%
23%
19%
18%
QuAl
ity
& M
Anuf
Actu
Ring
ch
Alle
nges
in l
ife
scie
nces
pAge
20
1
3
5
7
9
2
4
6
8

section 6
Moving towARd A cultuRe of opeRAtionAl eXcellence

1in2 executives stated their organization
considered quality more of a department
than a responsibility
disconnected cultureLikeallareasofbusiness,leadershipandcultureexperienceasimilarset
of maturity phases that progress over time. When it comes to quality and
compliance maturity in Life Sciences, in the early phases, a “culture” of
quality is virtually non-existent. There tends to be a disconnect, where
quality is considered more of a department than a responsibility. As was
revealedintheprevioussection,LNSResearch’ssurveydatashowsthat
almost one in three Life Sciences organizations maintain this mindset.
Because of the high quality and compliance requirements in Life Sciences,
this can be the source of many challenges.
Although many organizations have this “quality as a department” mindset,
in many ways it is putting them at a disadvantage. When quality is
perceived thisway,quality issuesaremore likely tobedealtwith ina
reactive manner, employees tend to view quality as a policing function,
and quality outside of the manufacturing environment is difficult to
manage. Quality is more effectively managed when resources are shifted
toward proactive measures, and this rings true regardless of whether
discussing people, processes, or technology.
eXecutive MAnAgeR shop flooR QuAlity dpt.
QuAlity As A depARtMent
Business peRfoRMAnce coMpliAnce
QuAl
ity
& M
Anuf
Actu
Ring
ch
Alle
nges
in l
ife
scie
nces
pAge
22
1
3
5
7
9
2
4
6
8

Changes in quality perception are possible, but they need to be initiated
at the executive level. Too often, grassroots campaigns fall by the
waysidebecause theyarenot taken seriously.Togainmomentumand
drive transformation, LNS Research suggests incorporating quality and
complianceintotheOperationalExcellencestrategy.Bymakingquality
a pillar within a common vision of Operational Excellence shared by the
entire organization, the progression toward quality as a responsibility
starts to happen organically, but there are several things executives can
do to accelerate that progression.
Bringing together operations and Quality
eXecutive MAnAgeR shop flooR QuAlity dpt.
QuAlity As A depARtMent
Business peRfoRMAnceeXecutive MAnAgeR shop flooR QuAlity dpt.
QuAlity As A ResponsiBility
coMMon vision of opeRAtionAl eXcellence
coMpliAnce
QuAl
ity
& M
Anuf
Actu
Ring
ch
Alle
nges
in l
ife
scie
nces
pAge
23
1
3
5
7
9
2
4
6
8

Assess and prioritize areas of improvement based on both internal and third party quality audits
third party quality audits
Dedicate a portion of the annual budget to create an internal marketing plan for employees
Develop a short and long-term plan for internal education, process improvements, and capital investments
Require managers regularly report on metrics and create plans for improvement
Set rewards-based performance programs for quality improvements
Develop a resource center with dynamic quality education courses, Sops, and instructions
Stay current on quality trends, emerging technologies, and regulations
Require quality management metrics such as Cost of be used in operations
Incorporating quality into a common vision of Operational Excellence
requires more than simply making an amendment to a corporate
document. It requires investment of time and resources and should be
driven from the top down. Successful examples seen in Life Sciences
include commitment to and all encompassing business operating system
(BOS) that explicitly incorporates global quality, supplier quality, and other
management system disciplines.
Accelerating cultural transformationexecutives responsible for quality can help to ensure
progress is being made by doing the following:
QuAl
ity
& M
Anuf
Actu
Ring
ch
Alle
nges
in l
ife
scie
nces
pAge
24
1
3
5
7
9
2
4
6
8

neXt-geneRAtion MoM softwARe And tRAceABility cApABilities
section 7

The challenges life sciences companies face today around increased
traceability requirements are due in part to the traditional MOM software
architectures many companies have in place.
Connecting the automation systems of the shop-floor up to the
enterprise reporting software, MOM software traditionally handles a
variety of functions, including, production execution, scheduling, planning,
riskmanagement,maintenance,qualityapplications,andothers.
With growth—organic and acquisitional—often comes a legacy of
homegrown and point solutions for each of these functions mentioned
above that typically do not integrate and interoperate easily, and force
organizations to deal with costly and time-consuming manual analysis
andreporting toobtain therequired information.NewFDAregulations
around electronic batch records (EBR) and electronic medical device
records(EMDR)requirefullend-to-endtraceabilityaroundtheproduct
genealogy of pharmaceuticals and medical devices, rendering this
traditional disjointed model obsolete for life science companies.
With the required pace and agility needed of today’s operations,
particularly with many companies operating large numbers of production
facilities spanning the globe, this traditional model of disjointed legacy
and point solutions is rapidly becoming obsolete.
traditional MoM software Architectures
QuAl
ity
& M
Anuf
Actu
Ring
ch
Alle
nges
in l
ife
scie
nces
pAge
26
1
3
5
7
9
2
4
6
8

Leading life sciences companies are migrating toward a platform approach
toMOM software that simplifies system architecture, eliminates redundant
applications and functionality, and facilitates open integration with legacy and
enterprise systems as well as supporting the new technologies of Cloud, Big
Data, Mobile, and IoT.
With integrated data and information available across the value chain, life
sciencescompanieshavetheabilitytotracktheentirelifecycleofinformation,
including raw materials/stock feed coming from suppliers, the production
process, and delivery and service to customers .
This end-to-end visibility connects batch and device history records up
through enterprise reporting and scheduling systems, allowing organizations
to pinpoint and isolate product non-compliances and understand their origin,
whichiscrucialformeetingcGMPcompliance.Alackofthisidentification
and reporting ability can result in costly and time-consuming shutdowns as
well as reputational damage. Additionally, next-generation MOM software
applications that heed the FDA’s PAT recommendations incorporate quality
into the process itself, rather than test after the fact.
Additionally, this typeofagilityandflexibility iscrucialnhelping life
sciencesadjusttocustomerandmarketplacedemandsand,aspersonalized
medicine moves toward the industry norm, will become an essential capability.
the Move toward next-generation MoM software Architectures
enterprise Applications
MAnufActuRing opeRAtions MAnAgeMent | future: integration & collaboration platforms
industrial Automation
Common ApplICAtIon FunCtIonAlIty pRovIDeD by mom plAtFoRmS
Modules/Apps: Scheduling, Dispatching
Configuration: platform Services, module/Apps
Modules/Apps:time & Attention training
Modules/Apps: execution, tracking
Modules/Apps:purchasing Warehouse
Modules/Apps: Asset tracking, mRo, RCm
Modules/Apps:emI / oI, Reporting
Modules/Apps: oee, Quality
ApplicationIntegrations
Security & Access unified Assets & production model
unified operations Database & Historian
Global Development & licensing
Integrated Development environment
Collaboration & Workflow
visualization & mobility
esB, standards
standards, proprietary
QuAl
ity
& M
Anuf
Actu
Ring
ch
Alle
nges
in l
ife
scie
nces
pAge
27
1
3
5
7
9
2
4
6
8

Ashasalreadybeenmentionednumeroustimes,trackandtracewithitem
level serialization is a major challenge in the life sciences industry today and
it will only become more important as life sciences companies serve an ever
larger global community with ever-more personalized medicine.
The challenges with track and trace are multi-faceted:
• “Systems of record” are often financially based and cannot go to the
needed level of detail to due true item level traceability with all the necessary
quality, production, maintenance, and inventory data
• MOM software systems are not harmonized across plants and are
attempting to integrate with a heterogeneous landscape of the automation
and equipment in facilities and multiple enterprise level business systems
• TheROIofinvestingintrackandtraceisoftendifficulttocalculate(until
there is a major adverse event)
By taking an enterprise level approach to MOM software, life sciences
companies can have harmonized processes and systems at the plant
level, common interfaces to automation and equipment, and a common
manufacturing data model across all facilities. Such an approach can
providetrackandtracecapabilitiesacrossthemanufacturingnetworkand
connections to enterprise systems where needed; allowing for forward and
backwardtraceabilitythroughthesystemwhenanissueisidentified.With
aholistictraceabilityenabled;aquickandminimallyinvasiveidentification
of contaminated or adulterated products becomes possible across the supply
chain, as opposed to when companies attempt traceability with disparate
systems only to discover what was believed to be in the system never made it.
supporting end-to-end track and trace capabilities
QuAl
ity
& M
Anuf
Actu
Ring
ch
Alle
nges
in l
ife
scie
nces
pAge
28
1
3
5
7
9
2
4
6
8

current and planned Adoption of MoM softwareThoughLNSResearchMOMsurveydatashowsthatcurrentimplementations
are at 24%, it is noteworthy to see that 21% of respondents are planning
to adopt MOM software applications within a year’s time. Life sciences
companies choosing to adopt new generation MOM software will
enjoyreal-time,actionableinformationspecifictorole,integrationwith
enterprise and automation applications, and visualizations that allow faster,
more accurate decisionmaking. These increased capabilities in speed,
visibility,andflexibilityareinstrumentalinhelpinglifesciencesovercome
theaforementionedindustry-specificchallenges,suchasthetrendtoward
personalized medicine, improving collaboration and identifying the root
causes of non-conformances. As modern MOM software platforms and
applications become more widespread and the industry sees its leaders
MoM software as enterprise vs. plant ApplicationToday, most companies approach MOM above the plant level, as 68%
see it as either a business unit or corporate level initiative, whereas
the remaining 32% view it as a plant-by-plant initiative. This shows a
clear trend toward corporate level standardization of MOM platforms
and applications. The holistic performance benefits afforded by
taking an enterprise approach to MOM software are a critical step
for life sciences companies in standardizing the CAPA processes on
which heightened FDA requirements have placed additional pressure.
$277.855%
41%
24%
28%
21%
27%
5%
coMpRehensive suite of MoM ApplicAtions Adopted
scope of MoM softwARe iMpleMentAtion
not plAnned
cuRRently iMpleMented
plAnned within 1 yeAR
coRpoRAte level
plAnt level
Business unit level
line level
0% 10%
20%
30%
40%
50%
0% 10%
20%
30%
40%
50%
continue to nudge the bar upward, those organizations that choose to stay
with outdated and disparate systems will be in an even further disadvantaged
position as they add heightened competition onto their pile of challenges.
QuAl
ity
& M
Anuf
Actu
Ring
ch
Alle
nges
in l
ife
scie
nces
pAge
29
1
3
5
7
9
2
4
6
8

Role-Based
Kpis & Alerts
continuous
improvement projects
drill-down
Analytics
Business units, sites
products, Assets, teams
corporate offices
Business dAtA:
customers
partners
plans - orders
costs - Assets
Materials
compliance
utilities
eneRgy dAtA:
price
usage
Renewables
efficiency projects
demand Response
Manufacturing
pRoduction dAtA:
schedules - orders
Materials - output
yield - Quality
efficiency
Assets - personnel
safety
distribution &warehousing
logistics dAtA:
schedules - orders
inventory
shipments
facilities - Assets
personnel
safety
enterprise Manufacturing intelligence (eMi)Perhaps one of the most important MOM software applications in improving
collaboration in operations is Enterprise Manufacturing Intelligence (EMI).
EMI is critical in helping organizations connect, federate, aggregate, and
contextualizedatafromtheshop-floorintoactionableintelligence.This
mayincludedataonbusiness,energy,productionandlogisticsthatflow
into different data historians and other databases. Serving as a common
data portal and information source for various job roles, EMI is a tool
particularly well-suited to fostering collaboration within life sciences
and diffusing quality responsibilities throughout, as it breaks down
informational silos by integrating disparate systems across the enterprise
to form a “single version of the truth.”QuAl
ity
& M
Anuf
Actu
Ring
ch
Alle
nges
in l
ife
scie
nces
pAge
30
1
3
5
7
9
2
4
6
8

A critical manufacturing metric that comprehensively measures the
performanceofavailability,efficiency,andqualityperformanceofassets
is Overall Equipment Effectiveness (OEE). According to the MOM survey,
organizations that have implemented a comprehensive MOM software
suite report a median OEE of more than 10% over those that have yet to
implement MOM software. MOM software allows for improved visibility
of manufacturing processes as well as enhanced control of quality,
inventory, production, and maintenance.
MediAn 80%
cuRRently iMpleMented
72.5%
not iMpleMented
MAnufActuRing opeRAtions MAnAgeMent
oee performance Benefits of MoM software
90%
80%
70%
60%
50%
40%
30%
20%
10%
oee
coMpAnies hAving Adopted MAnufActuRing opeRAtions MAnAgeMent softwARe hAve A 10% higheR MediAn oveRAll eQuipMent effectiveness
QuAl
ity
& M
Anuf
Actu
Ring
ch
Alle
nges
in l
ife
scie
nces
pAge
31
1
3
5
7
9
2
4
6
8

One of the most important measures of supply chain performance is on
time delivery. According to the MOM survey, users of comprehensive
MOM software reported median annual improvements of 30% vs. 17%
in On-Time Complete Shipments for the overall respondent average. This
demonstrateshowtakingabroadapproachtoMOMsoftwarecanbenefit
more than a single factory’s performance, but instead can improve system
wide supply chain performance.
MediAn 30%
cuRRently iMpleMented
17%
not iMpleMented
MAnufActuRing opeRAtions MAnAgeMent
on time delivery performance Benefits of MoM software
80%
70%
60%
50%
40%
30%
20%
10%
0%
on t
iMe
ship
Men
t iM
pRov
eMen
tscoMpAnies hAving Adopted MoM softwARe hAve AlMost twice the iMpRoveMent in on tiMe deliveR yeAR oveR yeAR
QuAl
ity
& M
Anuf
Actu
Ring
ch
Alle
nges
in l
ife
scie
nces
pAge
32
1
3
5
7
9
2
4
6
8

the neXt geneRAtion of QuAlity And coMpliAnce softwARe
section 8

traditional Approaches to QualityAs discussed in the previous section, a culture of quality is crucial for
effectively managing and improving quality performance, as well as
taking a proactive approach to quality issues. Culture, however, is
only part of the equation. Today, many Life Sciences companies are
struggling to achieve market leadership due to a disconnected set
of IT resources, which greatly reduces the effectiveness of people
and leadership. This disconnect can be sourced back to movement
throughout the different phases of Quality Management maturity.
Technology is generally deployed to supplement and sometimes
automate particular business processes. It may also be deployed to
enable collaboration internally as well as with upstream partners or
contract manufacturers. For Life Sciences, this increasingly includes
contract research partners (CRPs). Although IT resources are almost
always deployed to solve a problem or set of problems, in the early
phases of quality maturity, they tend to be deployed on an as-needed
basisratherthanwithanenterprisevisionofqualityinmind.Following
this strategy year over year has led many of today’s organizations to a
state of disconnect, where IT resources aren’t providing the support
needed to keep pace with stringent regulatory burdens. In some
cases, this disconnect is delivering more challenges than benefits.
78% of companies report operating in a state of
quality management disconnect
QuAl
ity
& M
Anuf
Actu
Ring
ch
Alle
nges
in l
ife
scie
nces
pAge
34
1
3
5
7
9
2
4
6
8

40% of companies are planning an eQMs
implementation or already have budget
allocated
enterprise Quality Management software Today’s leading organizations are moving beyond managing quality with
disparate systems and data sources by investing in next-generation EQMS
solutions. With the use of workflows and document control, EQMS
enables secure and efficient communication and collaboration on a
commonplatform. Italsostreamlines,centralizes,andstandardizeskey
quality processes such as CAPA, Audit Management, and Supplier Quality
Management. Numerous vendors have solutions tailored specifically
to Life Sciences, with FDA eSubmissions or eMDR modules built in.
EQMS is architected to easily integrate with other enterprise systems
suchasERP,ProductLifecycleManagement(PLM),EnvironmentHealth
andSafety(EHS),MOM,CRM,andLIMS.Thisintegrationisimperative
for progressing through the phases of quality management maturity, as it
connects quality with operational areas across the value chain. In many
ways, EQMS is a hub for quality process content and data. One integration
of particular importance for many Life Sciences companies is between
EQMS and MOM, which will be discussed in more detail in the next section. eQMsreporting, Analytic, Configurability,
Mobility, Interoperability
plM• ApQp/FmeA
• Design Quality• Inspection plan
ehs• Incedent management
• Inspection management• Sops
eRp
eRp
cRM• Customer Complaints• Sentiment Analysis
• Warranty management
MoM• In-line and At-line testing
• SpC• HACCp
• nC Reporting
proccess Automation
NC/CAPA •
Audit Management •
Supplier Quality Management •
Training & Certification •
Change Management •
Risk Management •
document Management
• Regulatory Submissions
• Collaborate (Search, Share, Comment)
• Control (eSignature, View, Print,
Read & Understood)
QuAl
ity
& M
Anuf
Actu
Ring
ch
Alle
nges
in l
ife
scie
nces
pAge
35
1
3
5
7
9
2
4
6
8

Quality in the cloudDue to the sensitivity of information in the Life Sciences industry,
organizations have been hesitant to adopt cloud-based EQMS solutions.
However,fromLNSResearch’sdiscussionswithindustryexecutivesand
as more use cases emerge, it is clear that these perceptions are slowly
changing. Many of today’s leading companies are moving to the cloud
to more easily collaborate with upstream partners, facilitate quicker
FDA approvals, and more efficiently extend quality and compliance
functionality to professionals in distributed locations.
in the neXt yeAR 32% plan on deploying manufacturing software in the cloud
cuRRently 20%
of companies deploy manufacturing software in the cloud
QuAl
ity
& M
Anuf
Actu
Ring
ch
Alle
nges
in l
ife
scie
nces
pAge
36
1
3
5
7
9
2
4
6
8

closed-loop Quality ManagementAs a drug or device moves from ideation through its actual use by a patient
or hospital, quality plays a role in each of those stages. Traditionally, quality
in these different stages is managed in silos, which, overall, leads to quality
being managed in a reactive manner. Most Life Sciences companies,
of course, cannot afford to manage quality reactively. However, as
companiescontinuetobuildoutcapabilities,moreandmorearethinking
about quality not just within one functional unit (development, supply
chain, production), but how it interacts between functional units. This is
the concept of closed-loop quality.
Closed-loop quality enables bi-directional automated streams of
information between functional units with the goal of catching quality
issues as upstream as possible. With its tight integration with other
enterprise systems, EQMS is ideal for creating an environment for effective
closed-loop quality management. A medical devices company may, for
instance, create a closed-loop quality scenario where as-manufactured
data is streamlinedback toR&D, soqualitynon-conformancescanbe
monitored in real-time. As will be shown in the following sections, MOM
software applications tie into this vision of closed-loop quality as well.
Quality specifi cations
work instructions
Mat
erial
perform
ance
proc
ess p
er
formance traceability
final test
cgMp
As-designed/specifi ed
voice of customer
field failures
chan
ge order
failu
re
data
R&d/engineeRing
supplieRs
MAnufActuRing
custoMeR/pAtient
40% of companies are
planning to establish closed-loop
quality processes within a year
(e) MdR/BR
QuAl
ity
& M
Anuf
Actu
Ring
ch
Alle
nges
in l
ife
scie
nces
pAge
37
1
3
5
7
9
2
4
6
8
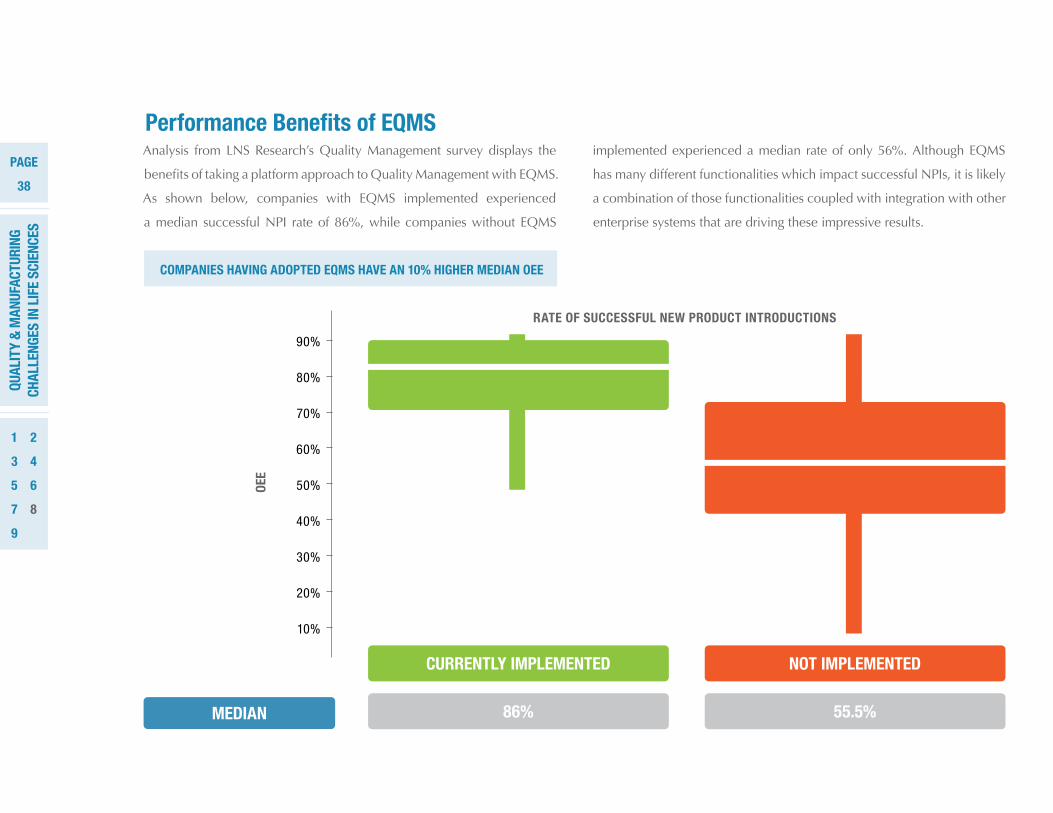
Analysis fromLNSResearch’sQualityManagement surveydisplays the
benefitsoftakingaplatformapproachtoQualityManagementwithEQMS.
As shown below, companies with EQMS implemented experienced
a median successful NPI rate of 86%, while companies without EQMS
implemented experienced a median rate of only 56%. Although EQMS
hasmanydifferentfunctionalitieswhichimpactsuccessfulNPIs,itislikely
a combination of those functionalities coupled with integration with other
enterprise systems that are driving these impressive results.
MediAn
90%
80%
70%
60%
50%
40%
30%
20%
10%
oee
86%
cuRRently iMpleMented
55.5%
not iMpleMented
RAte of successful new pRoduct intRoductions
performance Benefits of eQMs
coMpAnies hAving Adopted eQMs hAve An 10% higheR MediAn oee
QuAl
ity
& M
Anuf
Actu
Ring
ch
Alle
nges
in l
ife
scie
nces
pAge
38
1
3
5
7
9
2
4
6
8

RecoMMended Actions & finAl tAKeAwAys
section 9

Due to the macro-economic and global population trends in healthcare, the
life sciences industry is in the midst of tightening pressures on production,
from a multifaceted perspective: product quality, volume, speed, and
complexity.
success starts with a top-down Approach: Executive management needs to lead the way in instilling a culture of
collaboration where quality and compliance initiatives are incorporated into
all areas of the value chain, rather than being seen as a “policing function.”
end-to-end traceability and tighter Quality Management Are imperative: Inordertomakethenecessaryimprovementsinqualityandtraceability
tomeetFDAregulatoryrequirements,lifesciencesorganizationsneedto
developend-to-endproducttraceabilitycapabilitiestoproduceEBRsand
EMDRsuponrequestaswellastightenqualitymanagement.
the integrated platform Approachof eQMs and MoM software solutions enable connecting the entire value chain: EQMS breaks down informational silos and is critical to establishing
closed-loop quality. A platform approach to MOM allows companies to
track and trace from supplier to customer, and allows the flexibility in
operationsneededtokeeppacewithmarketdemands.
understand current andfuture drivers in life sciences:
Authors:
Matthew LittlefieldPresident and Principal [email protected]
Rob Harrison Research [email protected]
Mike Roberts Marketing [email protected]
Greg Goodwin Research [email protected]
presented by:
connect:
LNSResearch.com
QuAl
ity
& M
Anuf
Actu
Ring
ch
Alle
nges
in l
ife
scie
nces
pAge
40
1
3
5
7
9
2
4
6
8