Embed Size (px)
Citation preview
A revised operational
limit for the water 226Ra
activity concentration
downstream of Ranger
mine
Andreas Bollhöfer, Che Doering,
Peter Medley
February 2016
Release status – Public
Project number – MON-2000-002
643 internal
report

This page has been left blank intentionally.
A revised operational limit for the water 226Ra activity concentration downstream of Ranger
mine
Andreas Bollhöfer, Che Doering, Peter Medley
Supervising Scientist
GPO Box 461, Darwin NT 0801
February 2016
(Release status – Public)

How to cite this report:
Bollhöfer A, Doering C & Medley P A revised operational limit for the water 226Ra activity concentration downstream
of Ranger mine. Internal Report 643, February, Supervising Scientist, Darwin.
Project number: MON-2000-002
Authors of this report:
Andreas Bollhöfer – Environmental Research Institute of the Supervising Scientist, GPO Box 461, Darwin NT 0801, Australia
Che Doering – Environmental Research Institute of the Supervising Scientist, GPO Box 461, Darwin NT 0801, Australia
Peter Medley – Environmental Research Institute of the Supervising Scientist, GPO Box 461, Darwin NT 0801, Australia
Supervising Scientist is a branch of the Australian Government Department of
the Environment.
© Commonwealth of Australia 2015
Supervising Scientist
Department of the Environment
GPO Box 461, Darwin NT 0801 Australia
environment.gov.au/science/supervising-scientist/publications
IR643 is licensed by the Commonwealth of Australia for use under a Creative Commons
By Attribution 3.0 Australia licence with the exception of the Coat of Arms of the
Commonwealth of Australia, the logo of the agency responsible for publishing the
report, content supplied by third parties, and any images depicting people. For licence
conditions see: http://creativecommons.org/licenses/by/3.0/au/
Disclaimer
The views and opinions expressed in this publication are those of the authors and do not
necessarily reflect those of the Australian Government or the Minister for the Environment.
While reasonable efforts have been made to ensure that the contents of this publication
are factually correct, the Commonwealth does not accept responsibility for the accuracy
or completeness of the contents, and shall not be liable for any loss or damage that may
be occasioned directly or indirectly through the use of, or reliance on, the contents of
this publication.
Printed and bound in Darwin NT by Supervising Scientist.
iii
Contents
Executive summary vi
1 Introduction 7
1.1 Radium 8
1.2 Radionuclide concentration ratios 11
1.3 Radiation protection of humans 12
1.3.1 Ingestion pathway approach 12
1.3.2 Existing operational radium-226 water quality limit based on human radiological protection criteria 12
1.4 Radiation protection of the environment 13
1.4.1 Approach 13
1.4.2 Aquatic organisms 14
2 Methods 16
2.1 Data provenance 16
2.1.1 Mussels 16
2.1.2 Water 16
2.1.3 Concentration ratios 16
2.2 Human dose assessment 17
2.2.1 Exposure scenario 17
2.2.2 Concentration ratio 17
2.2.3 Benchmark dose rate 17
2.2.4 Assessment approach 17
2.3 Environmental dose assessment 17
2.3.1 Exposure scenario 17
2.3.2 Benchmark dose rate 18
2.3.3 Assessment approach 18
3 Results 19
3.1 Mudginberri mussel 226Ra activity concentrations 19
3.2 Water 226Ra activity concentrations 19
3.2.1 Mudginberri Billabong 19
3.1.2 Magela Creek 20
3.3 Radium-226 concentration ratios 22
3.4 Human dose assessment 23
3.5 Environmental dose assessment 24
4 Summary and conclusions 26
References 27

iv
List of Figures
Figure 1 Location of Ranger mine and Supervising Scientist Branch sampling sites along
the Magela Creek channel. BBB, Bowerbird Billabong; MCUS, Magela Creek
upstream; GTC, Georgetown Creek; MCDS, Magela Creek downstream; MBB,
Mudginberri Billabong. GTB and CJB are Georgetown and Coonjimba Billabongs
(from Supervising Scientist, 2008). ...................................................................................... 7
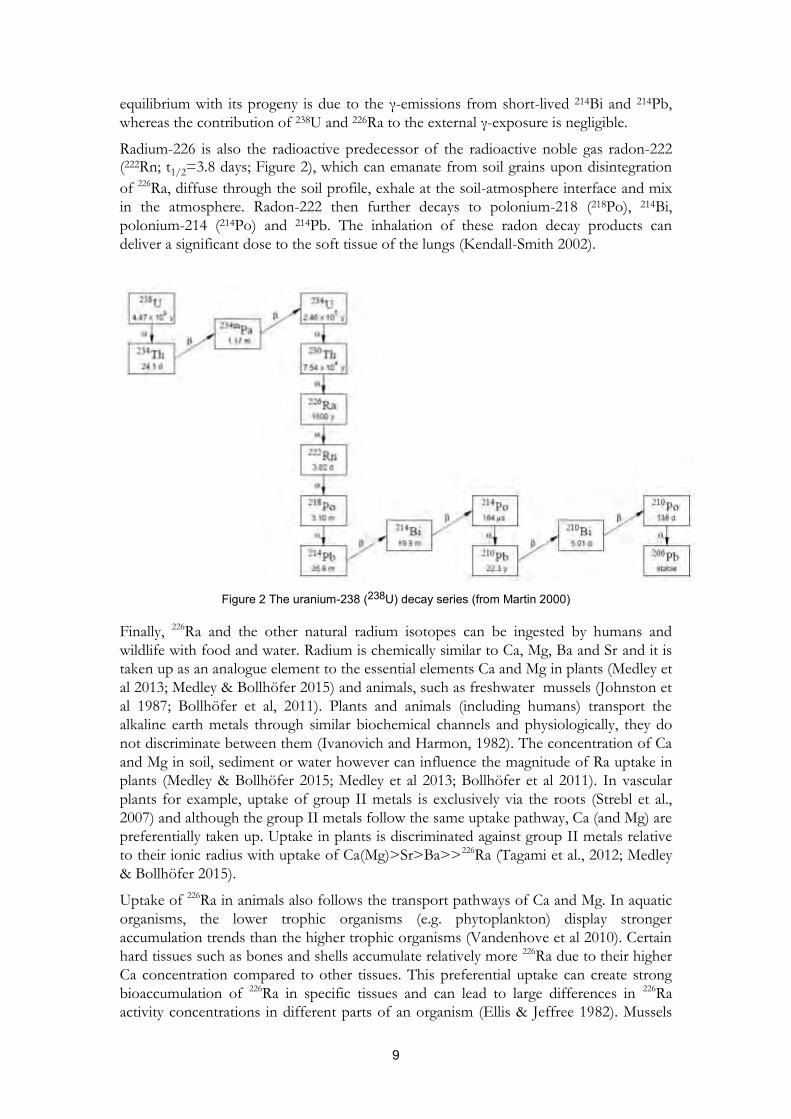
Figure 2 The uranium-238 (238U) decay series (from Martin 2000) ...................................... 9
Figure 3 Predicted contributions to the weighted absorbed dose for organisms in Magela
creek with an RP2 discharge rate of 2 m3·s-1
(from Johnston et al 2005). ................. 14
Figure 4 (a) Histogram and (b) cumulative probability plot of all 226Ra activity
concentrations (in Bq·kg-1 dry weight) measured in flesh of age classed freshwater
mussels, Velesunio angasi. The blue lines are lognormal fits to the distribution and
associated 95% confidence intervals. ............................................................................... 19
Figure 5 Time series of (a) total and (b) filtered 226Ra activity concentrations in
Mudginberri Billabong from the 1980s to 2013. ............................................................ 19
Figure 6 (a, c) Histograms and (b, d) cumulative probability plots of all total and filtered
water 226Ra activity concentrations (in Bq.L-1) measured in Mudginberri Billabong.
The blue lines are a lognormal fit to the distribution and associated 95% confidence
intervals. ............................................................................................................................... 20
Figure 7 Time series of (a) total and (b) filtered 226Ra activity concentrations in Magela
Creek, from 2000 to 2013. ................................................................................................. 21
Figure 8 (a, c) Histograms and (b, d) cumulative probability plots of all total and filtered
water 226Ra activity concentrations (Bq.L-1) measured in Magela Creek from 2000
onwards. The blue lines are lognormal fits to the distribution and associated 95%
confidence intervals. ........................................................................................................... 21
Figure 9 (a) Histogram and (b) cumulative probabilities of CRs [L·kg-1wet] measured in
all mussels collected since 2001 in Mudginberri Billabong. The blue line represents a
lognormal fit to the data. ................................................................................................... 22
Figure 10 Concentration ratios ([L/kgwet] measured in mussels older than 2 years,
collected since 2001 in Mudginberri Billabong. The blue line represents a lognormal
fit to the distribution. ......................................................................................................... 23
Figure 11 Distributions of internal and external an/d dose rates modelled for freshwater
mussels, Velesunio angasi, from an assumed water 226Ra activity concentration of 1
Bq.L-1 ................................................................................................................................... 25
v
List of Tables
Table 1 Concentration ratios in L·kg-1 (relative to total water 226Ra activity
concentrations) for freshwater mussel flesh (from Johnston et al 1984) ................... 12
Table 2 Summary of total and filtered water 226Ra activity concentrations (Bq·L-1).
Arithmetic means and standard deviations are shown. Geometric means are in
brackets................................................................................................................................. 21
Table 3 Statistical summary for the whole CR data-set. ........................................................ 22
Table 4 Statistical summary of the CR data-set excluding 0, 1 and 2 year old mussels. ... 23
Table 5 Input parameter values used in the tier 3 assessment module of the ERICA Tool
1.2 to calculate the absorbed dose rate to mussels per unit activity concentration of
226Ra in water. .................................................................................................................... 24

vi
Executive summary
The current trigger value for the above background water radium-226 (226Ra) activity
concentration at the Magela Creek compliance site is 10 mBq·L-1 (in the total fraction).
This has been derived from human radiation protection considerations, based on the
potential for bioaccumulation of 226Ra in mussels downstream of the Ranger mine and
subsequent ingestion by humans. The potential for radiological impact on the
environment has not been considered in previous derivations of trigger values for 226Ra.
The aim of this report is to provide a review of the trigger value for 226Ra, including
assessment of the potential impacts on human health and also taking into consideration
the potential radiological impacts on the environment.
The current 226Ra trigger value for Magela Creek is based on data collected and assessed
in the 1980s and, as the major source of mine related doses to people from the ingestion
of traditional food items, with new data available it was considered timely to conduct this
review into the appropriateness of the current value. Data from more than ten years
(2001-2013) of bioaccumulation monitoring in Mudginberri Billabong mussels are
statistically evaluated and concentration ratios for Mudginberri Billabong mussels are
calculated and used in subsequent assessments of radiation doses to human and the
environment.
Our assessment is based on the above background total water 226Ra activity
concentration in Magela Creek. It assumes that a 10 year old child consumes 2 kg (wet
weight) of large mussels per year. The resulting ingestion dose to humans, as well as
internal and external doses to mussels from 226Ra are assessed. It is shown that human
radiological protection is more limiting on total water 226Ra activity concentration in
Magela Creek than environmental radiation protection considerations.
A mine origin increase in total water 226Ra activity concentration of less than 3 mBq·L-1
will lead to a mine origin ingestion dose to humans of less than 0.2 mSv per year. The
same increase in total water 226Ra activity concentration of 3 mBq·L-1, will lead to a
maximum additional dose rate to a small number of mussels (1%) of 50 µGy·h-1. This is
much lower than the 400 µGy·h-1 benchmark dose rate, which, according to the United
Nations Scientific Committee on the Effects of Atomic Radiation (UNSCEAR), would
not have any detrimental effect at the population level in an aquatic environment.
Thus, the operational limit for the above background water total 226Ra activity
concentration downstream of Ranger mine should be revised and set at 3 mBq·L-1.

7
1 Introduction
The Ranger uranium mine (RUM) is located in the Alligator Rivers Region (ARR) in the
wet-dry tropics of Australia’s Northern Territory (Figure 1). It is surrounded by, though
technically separate from, the World Heritage listed Kakadu National Park (KNP).
The mine is located along Magela Creek, which is part of the East Alligator River system.
The headwaters of Magela Creek are located on the Arnhem Land Plateau. It flows
through Bowerbird Billabong, a channel rock pool billabong near the headwaters of
Magela Creek (Walker and Tyler, 1982) upstream of the mine. The creek continues its
path through the lowlands within the Ranger mineral lease and then on to Mudginberri
Billabong, a permanent channel billabong 12 km downstream from RUM and within
KNP (Bollhöfer 2012) (Figure 1). Finally, the creek flows through the Magela Corridor
and drains into the South Alligator floodplain which flows into Van Diemen Gulf.
Figure 1 Location of Ranger mine and Supervising Scientist Branch sampling sites along the Magela Creek channel. BBB, Bowerbird Billabong; MCUS, Magela Creek upstream; GTC, Georgetown Creek; MCDS, Magela Creek downstream; MBB, Mudginberri Billabong. GTB and CJB are Georgetown and
Coonjimba Billabongs (from Supervising Scientist, 2008).
The climate of the ARR is characterised by distinct wet (November to April) and dry
(May to October) seasons. The average annual rainfall over the past 100 years has been
1422 mm at Jabiru East (BoM 2015). More than 95% of rainfall occurs in the wet season
and approximately two thirds occurs between January and March with individual rainfall
events as high as 784 mm over 72 hours (Suradi et al 2014). It is these distinct seasons
MCDS

8
and high rainfall intensities during the first three months of the year that lead to the
requirement of intense water quality monitoring downstream of RUM.
Monitoring is focussed on Magela and Gulungul Creeks as both creeks receive inputs
from areas within the RUM mineral lease, including:
Runoff from the walls of the tailings storage facility (TSF)
Runoff from land application areas (LAAs)
Waste waters from retention ponds (in particular Retention Pond 1)
Through the groundwater pathway (in particular Mn, see Iles 2004).
Water quality objectives have been set for key variables (Klessa 2001a & b) and were
reviewed by Iles (2004). Whereas the water quality objectives for pH and turbidity have
been derived from the reference site distribution of these parameters upstream of the
mine site, for uranium, magnesium and manganese the recommended trigger values are
based on ecotoxicity testing (Iles 2004; Hogan et al 2003; Sinclair & Tayler 2012, Harford
et al 2014).
For radium-226 (226Ra), the trigger value is based on human radiation protection
considerations (Klessa 2001b), based on the potential for bioaccumulation of 226Ra in
mussels of Mudginberri Billabong downstream of RUM and subsequent ingestion by
humans. The potential for radiological impact on the environment has not been
considered in previous derivations of trigger values for 226Ra in Magela creek waters. The
aim of this report is to provide a review of the trigger value for 226Ra, including
assessment of the potential impacts on human health and also taking into consideration
the potential radiological impacts on the environment.
1.1 Radium
Radium belongs to the alkaline earth metals (Group IIA) in the Periodic Table. The four radium isotopes occurring naturally in the environment are radium-226 (226Ra; t1/2=1600
yr) of the uranium (238U) series (Figure 2), radium-228 (228Ra; t1/2=5.75 yr) and radium
224 (224Ra; t1/2=3.66 d) of the thorium (232Th) series and radium-223 (223Ra; t1/2=11.8 d)
of the actinium (235U) series. Radium and its radioactive properties were discovered in
1898 by Pierre and Marie Curie together with the discovery of another radioactive
element, polonium (Curie et al 1898). Radium was hailed as the wonder drug for ‘medical
conditions with no known cure’, and it took more than a decade to realise its potentially
harmful properties (IAEA 1990). In the 1950s, it was Tsivoglou (1958) who first
identified radium as a significant pollutant from uranium mining and milling activities
because the longest lived natural radium isotope, 226Ra, is a member of the uranium decay
series (Figure 2) and uranium mining residues generally still contain considerable
activities of 230Th and its radioactive decay products, including 226Ra. A significant
proportion of the radiation dose derived from 226Ra is also related to its short-lived decay
products.
Radium-226 and these shorter-lived decay products contribute to radiation dose to
humans and the environment via three principal pathways. Firstly, the short lived 226Ra
decay products bismuth-214 (214Bi) and lead-214 (214Pb) emit γ-radiation, which can lead
to external radiation exposure. Although 238U, 226Ra and their decay products emit
characteristic gamma radiation, Monte Carlo modelling by Saito and Jacobs (1995)
identified that more than 98% of the gamma dose field over an area containing 238U in
9
equilibrium with its progeny is due to the γ-emissions from short-lived 214Bi and 214Pb,
whereas the contribution of 238U and 226Ra to the external γ-exposure is negligible.
Radium-226 is also the radioactive predecessor of the radioactive noble gas radon-222 (222Rn; t1/2=3.8 days; Figure 2), which can emanate from soil grains upon disintegration
of 226Ra, diffuse through the soil profile, exhale at the soil-atmosphere interface and mix
in the atmosphere. Radon-222 then further decays to polonium-218 (218Po), 214Bi,
polonium-214 (214Po) and 214Pb. The inhalation of these radon decay products can
deliver a significant dose to the soft tissue of the lungs (Kendall-Smith 2002).
Figure 2 The uranium-238 (238U) decay series (from Martin 2000)
Finally, 226Ra and the other natural radium isotopes can be ingested by humans and
wildlife with food and water. Radium is chemically similar to Ca, Mg, Ba and Sr and it is
taken up as an analogue element to the essential elements Ca and Mg in plants (Medley et
al 2013; Medley & Bollhöfer 2015) and animals, such as freshwater mussels (Johnston et
al 1987; Bollhöfer et al, 2011). Plants and animals (including humans) transport the
alkaline earth metals through similar biochemical channels and physiologically, they do
not discriminate between them (Ivanovich and Harmon, 1982). The concentration of Ca
and Mg in soil, sediment or water however can influence the magnitude of Ra uptake in
plants (Medley & Bollhöfer 2015; Medley et al 2013; Bollhöfer et al 2011). In vascular
plants for example, uptake of group II metals is exclusively via the roots (Strebl et al.,
2007) and although the group II metals follow the same uptake pathway, Ca (and Mg) are
preferentially taken up. Uptake in plants is discriminated against group II metals relative
to their ionic radius with uptake of Ca(Mg)>Sr>Ba>>226Ra (Tagami et al., 2012; Medley
& Bollhöfer 2015).
Uptake of 226Ra in animals also follows the transport pathways of Ca and Mg. In aquatic
organisms, the lower trophic organisms (e.g. phytoplankton) display stronger
accumulation trends than the higher trophic organisms (Vandenhove et al 2010). Certain
hard tissues such as bones and shells accumulate relatively more 226Ra due to their higher
Ca concentration compared to other tissues. This preferential uptake can create strong
bioaccumulation of 226Ra in specific tissues and can lead to large differences in 226Ra
activity concentrations in different parts of an organism (Ellis & Jeffree 1982). Mussels

10
for example bioaccumulate 226Ra in calcium phosphate granules in their soft tissue and 226Ra activity concentrations in these calcium phosphate granules is extremely high (Ellis
& Jeffree 1982). The influence of group II metals on 226Ra uptake in mussels is such that
if Ca and Mg concentrations in the (aquatic) environment are low, 226Ra uptake generally
increases. For example, Brenner et al (2007) have reported much lower uptake of 226Ra
for freshwater mussels in a groundwater augmented lake with high Ca concentrations, in
contrast, uptake is particularly high from the low EC waters of Magela Creek (Bollhöfer
et al 2011).
In mammals (and humans), most ingested 226Ra is promptly excreted again, however,
some enters the bloodstream and is incorporated into bones. Radium-226 follows
biochemical pathways as an analogue to Ca and Mg and can isomorphously substitute for
Ca in the apatite mineral structure of bone tissue (Vandenhove et al 2010). Because of its
preference for bone, Ra is commonly referred to as a bone seeker (National Research
Council 1988). Once deposited in bones, 226Ra decays and delivers, either directly or via
the short-lived daughter isotopes, a radiation dose to bone tissue. The ingestion of
mussels with high concentrations of 226Ra can thus lead to significant radiation doses to
humans from 226Ra.
The high radiotoxicity of radium to humans upon ingestion is evidenced by the high
dose conversion coefficient (DCC) for 226Ra of 0.28 µSv·Bq-1 for adults and 0.8 µSv·Bq-1
for a 10 year old child. Only 210Po and 210Pb have higher DCCs than 226Ra within the
elements of the uranium series decay chain (1.2 µSv·Bq-1 for an adult and 2.6 µSv·Bq-1
for a child for 210Po; 0.69 µSv·Bq-1 for an adult and 1.9 µSv·Bq-1 for a child for 210Pb).
Both 210Po and 210Pb also have the potential to bioaccumulate in animal tissues, however,
in the freshwater environment they are less mobile than 226Ra and have a stronger affinity
for suspended particles (Alam & Mohamed 2010); both isotopes are quickly adsorbed on
suspended sediment and removed from the water column into bottom sediments. Martin
et al (1998) for example report 210Po and 210Pb activity concentrations in Retention Pond
2 (RP2) water more than 100 times lower than the activity concentration of 226Ra. This is
similar to the ratios reported in Johnston et al (2005) where 210Po and 210Pb activity
concentrations in RP2 water are assumed to be approximately 70 times lower than 226Ra.
The 210Po and 210Pb activity concentrations in Retention Pond 1 (RP1) water in 1994/95
were low (5 mBq·L-1) (Martin 2000) and similar to the activity concentration in
Mudginberri Billabong measured during that time period (Martin et al 1998) confirming
fast removal of these two radioisotopes from the water column into the sediment of
RP1. Total (filtered) activity concentrations for 226Ra, 210Po and 210Pb in Mudginberri
Billabong in the 1980s have been reported by Martin et al (1998) as 3.4 (0.7) mBq·L-1, 4.5
(1.6) mBq·L-1 and 6.3 (1.3) mBq·L-1 respectively.
The activity concentrations of 210Po and 210Pb in mine waters is much lower than that of 226Ra and the contribution (if any) of 226Ra to the downstream environment from RUM
is very low (Supervising Scientist 2015). Thus, although not directly measured, it can be
assumed that mine origin 210Po and 210Pb do not contribute to the presence of these
isotopes in water downstream of RUM and consequently do not contribute to the
activity concentrations of these two radionuclides in mussels. This assumption is
confirmed by the results of measurements of stable lead (206Pb, 207Pb, 208Pb) isotope ratios
in mussel flesh, which confirm that the contribution of mine origin stable Pb to Pb in
mussel flesh is consistently low at approximately 2 per cent (Bollhöfer 2012).

11
In a model to estimate mine related doses to people from the ingestion of traditional
food items Martin (2000) used a concentration ratio for mussels for 226Ra from the water column (CRRa-226,mussel) of 19,000 L·kg-1, which was determined by Johnston et al (1984,
1987). For the other radionuclide-tissue combinations in the model, CRs are published in
Martin et al (1998). For a hypothetical release of RP2 water from RUM Martin (2000) has
shown that 226Ra is the main contributor to a mine related ingestion dose (>92.2%)
downstream of RUM and the main food item responsible for this dose is the
consumption of freshwater mussels1, Velesunio angasi, (85.1%).
The 226Ra trigger value for Magela creek is based on data collected and assessed in the
1980s and, as the major source of mine related doses to people from the ingestion of
traditional food items, with new data available it is timely to conduct this review into the
appropriateness of the current value used.
1.2 Radionuclide concentration ratios
Concentration ratios (CRs) are commonly used to quantify radionuclide transfer to biota
from the surrounding environmental media that generally function as the reservoirs for
nutrients and contaminants (Doering 2013). The CR method is a simplistic approach and
does not take into account the chemical form of the radionuclide, competing ions, pH,
and other chemical parameters that can affect the transfer of radionuclides. Nevertheless,
it is consistent with the approach used in many human and environmental assessment
models for quantifying radionuclide transfer (Brown et al 2008; USDOE 2004; Yu et al
2002). CRs for biota in aquatic systems are typically expressed as:
(1)
The CR method assumes equilibrium conditions between the receptor and donor
compartments. Equilibrium conditions can reasonably be expected to exist in natural and
undisturbed environments or where the environment is receiving continuous (steady)
inputs of radionuclides from a site. In the uranium mining context, the CR method is
likely to be valid for conditions of normal operation and also in the post-rehabilitation
phase (Doering 2013).
The mussel CR for 226Ra has previously been determined as the average CR of four
billabongs in the Alligator Rivers Region (Johnston et al 1984). These billabongs were
Georgetown, Mudginberri, Leichhardt and Corndorl billabongs. Table 1 reproduces the
CR values for 226Ra in freshwater mussel tissue from Johnston et al (1984). More
recently, Bollhöfer et al (2011) have reported CRs for 226Ra that range from 28 000 to
33 000 with an average of 30 500 for sites in Magela Creek, downstream of Bowerbird
Billabong.
Concentration ratios for 226Ra uptake in freshwater mussels are calculated relative to total
water 226Ra activity concentrations. This is because mussels are filter feeders, meaning
they take up food (plankton, algae and other nutrients and particles) suspended in the
1 This is assuming that 2 kg of wet mussel tissue is consumed by a 10 year old child per year.
12
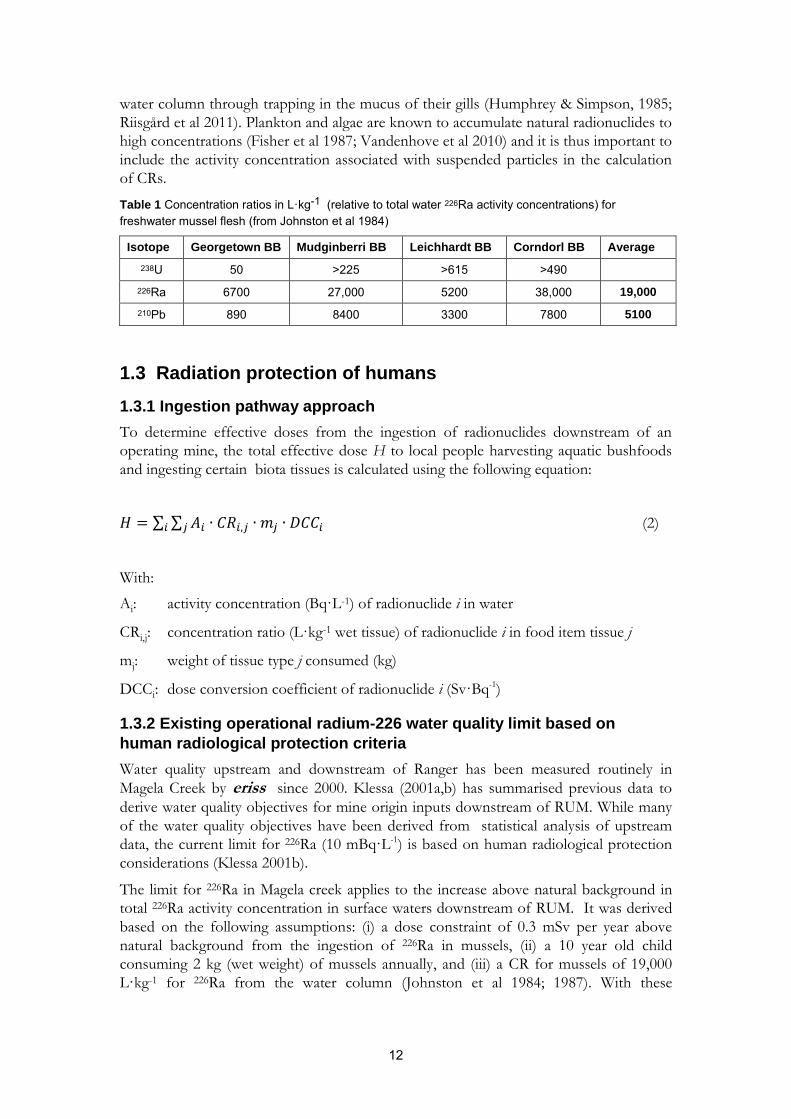
water column through trapping in the mucus of their gills (Humphrey & Simpson, 1985;
Riisgård et al 2011). Plankton and algae are known to accumulate natural radionuclides to
high concentrations (Fisher et al 1987; Vandenhove et al 2010) and it is thus important to
include the activity concentration associated with suspended particles in the calculation
of CRs.
Table 1 Concentration ratios in L·kg-1 (relative to total water 226Ra activity concentrations) for freshwater mussel flesh (from Johnston et al 1984)
Isotope Georgetown BB Mudginberri BB Leichhardt BB Corndorl BB Average
238U 50 >225 >615 >490 226Ra 6700 27,000 5200 38,000 19,000
210Pb 890 8400 3300 7800 5100
1.3 Radiation protection of humans
1.3.1 Ingestion pathway approach
To determine effective doses from the ingestion of radionuclides downstream of an
operating mine, the total effective dose H to local people harvesting aquatic bushfoods
and ingesting certain biota tissues is calculated using the following equation:
(2)
With:
Ai: activity concentration (Bq·L-1) of radionuclide i in water
CRi,j: concentration ratio (L·kg-1 wet tissue) of radionuclide i in food item tissue j
mj: weight of tissue type j consumed (kg)
DCCi: dose conversion coefficient of radionuclide i (Sv·Bq-1)
1.3.2 Existing operational radium-226 water quality limit based on
human radiological protection criteria
Water quality upstream and downstream of Ranger has been measured routinely in
Magela Creek by eriss since 2000. Klessa (2001a,b) has summarised previous data to
derive water quality objectives for mine origin inputs downstream of RUM. While many
of the water quality objectives have been derived from statistical analysis of upstream
data, the current limit for 226Ra (10 mBq·L-1) is based on human radiological protection
considerations (Klessa 2001b).
The limit for 226Ra in Magela creek applies to the increase above natural background in
total 226Ra activity concentration in surface waters downstream of RUM. It was derived
based on the following assumptions: (i) a dose constraint of 0.3 mSv per year above
natural background from the ingestion of 226Ra in mussels, (ii) a 10 year old child
consuming 2 kg (wet weight) of mussels annually, and (iii) a CR for mussels of 19,000
L·kg-1 for 226Ra from the water column (Johnston et al 1984; 1987). With these

13
assumptions and considering the 226Ra activity concentration in mussels only, equation
(2) simplifies and reduces to:
(3)
With:
ARa-226: total activity concentration (Bq·L-1) of 226Ra in water above background
CRRa-226,mussel: concentration ratio for mussels for 226Ra from the water column (L·kg-1)
mmussel: weight of mussel tissue consumed (kg)
DCCi: dose conversion coefficient for 226Ra (Sv·Bq-1).
With the 3 assumptions above and using equation (3), a 226Ra activity concentration limit
of 10 mBq·L-1 above natural background in Magela creek water will lead to an annual
dose of 0.3 mSv for a 10 yr old child from the ingestion of 2 kg wet weight of mussels.
Iles (2004) revised the water quality objectives for Magela Creek. For the total water 226Ra activity concentration the objective is: “The median total 226Ra activity concentration for
the wet season at the downstream site will not be more than 10 mBq/L greater than that at the
upstream site”. A measure of success for meeting this objective is that “the downstream
median total 226Ra activity concentration for the wet season minus the upstream median total 226Ra
activity concentration for the wet season is not greater than 10 mBq/L”.
1.4 Radiation protection of the environment
1.4.1 Approach
Revisions of the Australian Radiation Protection and Nuclear Safety Agency’s
(ARPANSA) National Directory for Radiation Protection (republished in February 2014)
and Safety Fundamentals in Radiation Protection Series F-1 (ARPANSA 2014b) were
undertaken to take account of more recent recommendations by the ICRP (ICRP 2007;
2008) and the revised IAEA Basic Safety Standards (IAEA 2014) to explicitly include
protection of the environment from the harmful effects of ionising radiation in national
guidance documents. The Safety Fundamentals in Radiation Protection Series F-1
(which is the top tier document in the Australian national framework to manage risks
from ionising radiation) explicitly includes environmental exposures of wildlife in the
natural environment and state that “Regulatory consideration of scenarios that may put the
environment at risk (either individuals or species that may be protected for conservation purposes, or
populations or ecosystems) protects against effects of ionising radiation of environmental concern”.
Consequently, radiation doses to wildlife from radionuclides released into the
environment by human activities should be considered and assessed, where the potential
for environmental effects exists (Supervising Scientist 2014).
Environmental exposures are typically quantified as the above-background absorbed
dose rate to wildlife from a radionuclide contaminated environment and are typically
placed in a risk context by comparing to a benchmark dose rate (Doering 2013). The
benchmark dose rate is an absorbed dose rate value that is considered to provide an
acceptable level of protection to the environment; generally the prevention of deleterious
14
impacts to wildlife populations and ecosystem biodiversity (Doering & Bollhöfer 2015a;
ICRP, 2007, 2008). The United Nations Scientific Committee on the Effects of Atomic
Radiation (UNSCEAR) concluded from review of the scientific literature on radiation
effects that “maximum dose rates of 400 uGy/h to a small proportion of the individuals in aquatic
populations of organisms would not have any detrimental effect at the population level” (UNSCEAR,
1996, 2008).
Doering (2010) has reviewed several approaches that are used to assess radiation doses to
wildlife, to provide some national guidance on available frameworks for radiation
protection of wildlife, identified through the National Directory for Radiation Protection.
He concludes that the ERICA Integrated Approach and ERICA Tool (Brown et al 2008)
provide a practical framework for assessing absorbed dose rates to wildlife. Using the
ERICA tool, absorbed dose rates to wildlife can be modelled and compared in a 3-Tier
approach. Other tools are available, such as ResRad-Biota (Yu et al 2002) and K-Biota
(Kum et al 2010). It is important to note that currently, radiation exposure of wildlife is
not formally considered when deriving radiological water quality criteria for Magela
Creek.
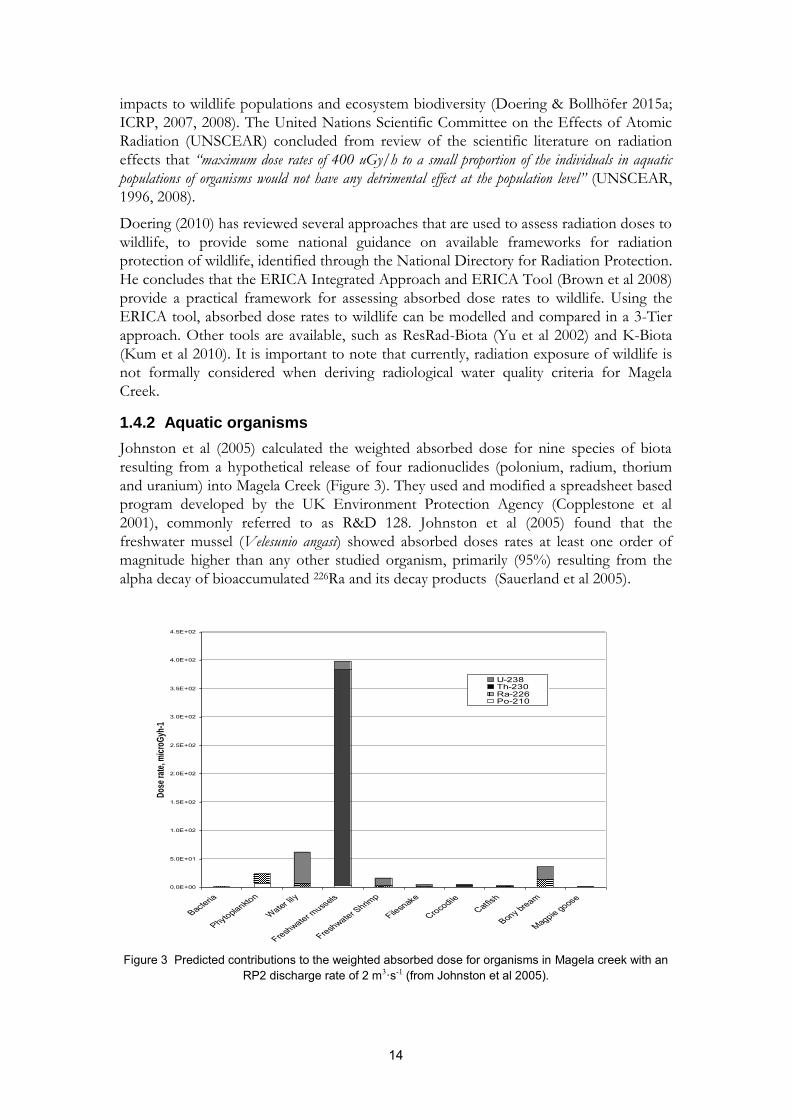
1.4.2 Aquatic organisms
Johnston et al (2005) calculated the weighted absorbed dose for nine species of biota
resulting from a hypothetical release of four radionuclides (polonium, radium, thorium
and uranium) into Magela Creek (Figure 3). They used and modified a spreadsheet based
program developed by the UK Environment Protection Agency (Copplestone et al
2001), commonly referred to as R&D 128. Johnston et al (2005) found that the
freshwater mussel (Velesunio angasi) showed absorbed doses rates at least one order of
magnitude higher than any other studied organism, primarily (95%) resulting from the
alpha decay of bioaccumulated 226Ra and its decay products (Sauerland et al 2005).
Figure 3 Predicted contributions to the weighted absorbed dose for organisms in Magela creek with an RP2 discharge rate of 2 m3·s-1 (from Johnston et al 2005).
0.0E+00
5.0E+01
1.0E+02
1.5E+02
2.0E+02
2.5E+02
3.0E+02
3.5E+02
4.0E+02
4.5E+02
Bacteria
Phytoplankton
Water lily
Freshwater mussels
Freshwater Shrim
p
Filesnake
CrocodileCatfis
h
Bony bream
Magpie goose
Dos
e ra
te, m
icro
Gyh
-1
U-238Th-230Ra-226Po-210
15
For their assessment Johnston et al (2005) used a similar approach to Martin (2000) and
Martin et al (1998) for human dose assessment, in so far as they assumed a scenario in
which RP2 water is released from the mine site, with water 226Ra activity concentrations
approximately 70 times higher than activity concentrations of 210Po. Figure 3 is a
reproduction of their results, showing that the magnitude of the absorbed effective dose
to mussels will be from 226Ra. It also shows that mussels are the limiting organism, as far
as doses to aquatic wildlife in the Alligator Rivers Region from an assumed release of
mine waters are concerned.
In this report we use the ERICA tool (Brown et al 2008) to undertake a dose assessment
for mussels in Magela Creek that receive internal exposures from bioaccumulated
radionuclides and external exposures from radionuclides in water and sediment.

16
2 Methods
2.1 Data provenance
The data used in our study originates from annual collections of mussels and surface
waters from Mudginberri Billabong (Figure 1). These collections were made by eriss
between 2000 and 2013 (inclusive) as part of its routine bioaccumulation monitoring
program. Summaries of each collection have been published in Supervising Scientist
Annual Reports (Supervising Scientist, 2008, 2009 2014, 2015).
2.1.1 Mussels
As part of the bioaccumulation monitoring program of the Supervising Scientist, mussels
are collected each year from Mudginberri Billabong at the end of the dry season in
September or October (Ryan et al 2005). The 2007 collection was done in May at the end
of the wet season as part of a larger study of radium bioaccumulation in mussels along
Magela Creek (Bollhöfer et al. 2011). In 2008, mussels were collected at three different
locations within Mudginberri Billabong, effectively giving three separate collections for
that year (Supervising Scientist 2009). Mussels collected in each year other than 2009 and
2010 were aged and all mussels of the same age were combined to form a single sample
for analysis. In 2009 and 2010, all mussels collected were combined into one bulk
sample; results from these two years have not been used in this data analysis. Further
details on the methods of mussel collection, processing, aging and analysis are provided
in Ryan et al (2005) and Bollhöfer et al. (2011).
2.1.2 Water
Surface water samples from Mudginberri Billabong are collected at the same time that
mussels are collected. The samples were filtered in all years other than 2013. Analysis of
both the filtered water and particulate fractions was done in 2000, 2002, 2007, 2008 and
2012. Only the filtered water fraction was analysed in other years. Further details on the
methods of water collection, processing, and analysis are provided in Ryan et al (2005)
and Bollhöfer et al. (2011).
To calculate total water 226Ra activity concentrations, which have been used in this study
to calculate CRs for mussels, the following data manipulations were applied:
results of the filtered water and particulate fractions were summed for those years
where measurements on both had been made;
for those years where only the filtered water fraction was analysed, the analysis
result was multiplied by the arithmetic mean of the ratio of total/filtered 226Ra
activity concentration in water samples collected from Magela Creek and
Mudginberri Billabong during the years 2000 to 2013 (inclusive);
no manipulations were applied to the 2013 data as the water sample was not
filtered prior to analysis and results were for the total water fraction.
2.1.3 Concentration ratios
A CR dataset for mussels was generated by dividing the fresh weight 226Ra activity
concentration in each age-composited mussel sample from each year by the total 226Ra
activity concentration in water. The arithmetic mean 226Ra activity concentration in total
water over all years was used to calculate CRs as it was considered to better represent the

17
long-term 226Ra exposure conditions of mussels in Mudginberri Billabong compared to
the activity concentration in water on the day of mussel collection.
2.2 Human dose assessment
2.2.1 Exposure scenario
The exposure scenario for humans was based on a 10 year old child consuming 2 kg of
mussels (fresh weight) from Mudginberri Billabong per year, with the further assumption
that larger sized mussels were consumed in preference to smaller sized mussels since they
offer greater nourishment for the effort expended in collecting them.
Mussels from the Magela Creek system reach approximately 90% of their lifetime size by
the age of 3 years (Bollhöfer et al., 2011) and it was assumed that only mussels of this
age and older were collected and consumed.
2.2.2 Concentration ratio
The geometric mean CR of mussels aged 3 years and older was calculated from the CR
dataset taking into account the number of individual mussels in each age composited
sample from each year. This value was used in the assessment as it represents the most
likely CR of any mussel aged 3 years or older randomly collected from the billabong, as
would be the case for an Aboriginal person collecting mussels opportunistically for
sustenance.
2.2.3 Benchmark dose rate
The member of the public dose constraint for Ranger mine is 0.3 mSv (ERA 2014). This
value denotes an upper bound on the annual doses that members of the public should
receive from all above-background radiation exposures traceable to the mine such that
radiation protection could be considered optimised – it is not a dose limit (ICRP, 2007).
Doses from the ingestion of 226Ra in mussels represents radiation exposure to the public
from a single radionuclide via a single pathway only. Although this is expected to be the
dominant radionuclide-pathway combination contributing to public doses downstream
of the mine following a release of retention pond water (Martin et al. 1998), other
radionuclides and bush foods will also contribute to dose, and so too will the inhalation
of radon progeny in air. To account for dose contributions coming from radionuclides
and pathways other than 226Ra in mussels, the guideline value was not back-calculated
from the dose constraint of 0.3 mSv, but from a lower annual benchmark dose of 0.2
mSv.
2.2.4 Assessment approach
Calculation of the guideline value was done by dividing the benchmark dose by the
product of the geometric mean CR of mussels aged 3 years and older, the 226Ra ingestion
dose coefficient for a 10 year old child (8.0x10⁻⁷ mSv mBq-1, ICRP (1996)) and the
weight of mussels consumed per year.
2.3 Environmental dose assessment
2.3.1 Exposure scenario
The exposure scenario for the environment was based on mussels in Magela Creek
receiving internal exposures from bioaccumulated radionuclides and external exposures

18
from radionuclides in the water and sediment. A previous assessment by Johnston et al.
(2005) found that mussels were the limiting organism for the creek and, in the case of a
release of mine waters, would receive their dose predominantly from bioaccumulated 226Ra.
2.3.2 Benchmark dose rate
The United Nations Scientific Committee on the Effects of Atomic Radiation
(UNSCEAR) is the international authority on the effects of ionising radiation and has
concluded from a review of the scientific literature on radiation effects that “maximum
dose rates of 400 µGy/h to a small proportion of the individuals in aquatic populations of organisms
would not have any detrimental effect at the population level” (UNSCEAR, 1996, 2008).
2.3.3 Assessment approach
The tier 3 assessment module in the ERICA Tool 1.2 (Brown et al., 2008) was used to
determine probabilistically the absorbed dose rate to the organism (ie – a mussel) per unit
of 226Ra activity concentration in water. This absorbed dose rate was then compared to
the benchmark dose rate of 400 µG·h-1 to derive a total 226Ra activity concentration that
would result in a dose rate of less than the benchmark to 99% of the population.

19
3 Results
3.1 Mudginberri mussel 226Ra activity concentrations
Figures 4a and 4b show a summary of all 226Ra activity concentrations measured in the
flesh of age classed samples of freshwater mussels (including 0, 1 and 2 year old mussels),
Velesunio angasi, collected between 2001 and 2013.
Radium-226 activity concentrations (Bq·kg-1 dry weight) are lognormally distributed (p =
0.25; Anderson-Darling statistic: 0.466), with a geometric mean of 780 Bq·kg-1 and an
arithmetic mean of 940 Bq·kg-1. The average (both arithmetic and geometric) dry to wet
weight ratio in mussels collected between 2001 and 2013 is 0.10.
Figure 4 (a) Histogram and (b) cumulative probability plot of all 226Ra activity concentrations (in Bq·kg-1 dry weight) measured in flesh of age classed freshwater mussels, Velesunio angasi. The blue lines are
lognormal fits to the distribution and associated 95% confidence intervals.
3.2 Water 226Ra activity concentrations
3.2.1 Mudginberri Billabong
Figures 5a and 5b show the time series of all water 226Ra activity concentrations
measured by eriss in Mudginberri Billabong since the early 1980s, total and filtered
respectively. Data have been extracted from the BRUCE tool described in Doering
(2013).
Figure 5 Time series of (a) total and (b) filtered 226Ra activity concentrations in Mudginberri Billabong from the 1980s to 2013.
30002400180012006000
30
25
20
15
10
5
0
Ra-226
Fre
qu
en
cy
Loc 6.655
Scale 0.6442
N 141
100001000100
99.9
99
95
90
80
7060504030
20
10
5
1
0.1
Ra-226
cu
mu
lati
ve
pe
rce
nt
Loc 6.655
Scale 0.6442
N 141
AD 0.466
P-Value 0.249
Year
1980 1990 2000 2010
22
6R
ato
t [B
q/L
]
0.000
0.002
0.004
0.006
0.008
0.010
Year
1980 1990 2000 2010
22
6R
afi
lt [
Bq
/L]
0.000
0.002
0.004
0.006
0.008
0.010

20
Figures 6a, b, c and d show a statistical summary of all measured 226Ra activity
concentrations in Mudginberri Billabong water collected between the early 1980s and
2013. Radium-226 activity concentrations in Mudginberi Billabong water follow a log-
normal distribution with low Anderson-Darling statistics and p-values above 0.35. Table
2 shows that total 226Ra activity concentrations appear to be higher in the 1980s (which
could be an effect of sample collection), but filtered 226Ra activity concentrations have
not changed over the sampling periods.
The average ratio of 226Ra activity concentrations in the total water relative to the filtered
water in samples taken from 2000 onwards is 1.6 which is the same as the ratio in Magela
Creek samples (see below). This ratio was used to determine a total 226Ra activity
concentration in water samples from Mudginberri Billabong where only the filtered water
fraction was analysed. Arithmetic and geometric means of 0.0020 and 0.0018 Bq·L-1 were
calculated for the total 226Ra activity concentration in Mudginberri Billabong between
2001 and 2013.
Figure 6 (a, c) Histograms and (b, d) cumulative probability plots of all total and filtered water 226Ra activity concentrations (in Bq.L-1) measured in Mudginberri Billabong. The blue lines are a lognormal fit
to the distribution and associated 95% confidence intervals.
3.1.2 Magela Creek
Figures 7a and 7b show the time series of all water 226Ra activity concentrations
measured by eriss in Magela Creek (upstream and downstream sites) since the
commencement of 226Ra monitoring in 2000. Data shown are for both total and filtered
water activity concentrations. Data have been extracted from the BRUCE tool, described
in Doering (2013) and sites include all sites along the Magela Creek channel from which
water samples have been collected.
Total water 226Ra activity concentrations in Magela Creek follow a log-normal
distribution with an Anderson-Darling statistics value of 0.482 and p = 0.227 (Figure 8),
a statistical summary of the data is provided in Table 2.
0.00900.00750.00600.00450.00300.00150.0000
12
10
8
6
4
2
0
Ra-226 total
Fre
qu
en
cy
Loc -6.187
Scale 0.6554
N 27
0.010.0010.0001
99
95
90
80
70605040
30
20
10
5
1
Ra-226 total
Cu
mu
lati
ve
pe
rce
nt
Loc -6.187
Scale 0.6554
N 27
AD 0.389
P-Value 0.361
0.00900.00750.00600.00450.00300.00150.0000
18
16
14
12
10
8
6
4
2
0
Ra-226 filtered
Fre
qu
en
cy
Loc -6.926
Scale 0.6430
N 35
0.010.0010.0001
99
95
90
80
70605040
30
20
10
5
1
Ra-226 filtered
Cu
mu
lati
ve
pe
rce
nt
Loc -6.926
Scale 0.6430
N 35
AD 0.287
P-Value 0.601
a b
c d

21
Figure 7 Time series of (a) total and (b) filtered 226Ra activity concentrations in Magela Creek, from
2000 to 2013.
Figure 8 (a, c) Histograms and (b, d) cumulative probability plots of all total and filtered water 226Ra activity concentrations (Bq·L-1) measured in Magela Creek from 2000 onwards. The blue lines are
lognormal fits to the distribution and associated 95% confidence intervals.
Table 2 Summary of total and filtered water 226Ra activity concentrations (Bq·L-1). Arithmetic means and standard deviations are shown. Geometric means are in brackets.
Ra-226 total Ra-226 filtered total/filtered
Mudginberri Billabong
All data 0.0026± 0.0019 (0.0021)
0.0012 ±0.0009 (0.010)
2.1 (2.1)
1980s 0.0031 ± 0.0023 (0.025)
0.0012 ± 0.0011 (0.009)
2.5 (2.8)
Post 2000 0.0020 ± 0.0010 (0.018)
0.00012 ± 0.0007 (0.010)
1.6 (1.6)
Magela Creek
Post 2000 0.0021 ± 0.0008 (0.0020)
0.0013 ± 0.0005 (0.0013)
1.6 (1.6)
Year
00 01 02 03 04 05 06 07 08 09 10 11 12 13
22
6R
ato
t [B
q/L
]
0.000
0.002
0.004
0.006
0.008
0.010
Year
00 01 02 03 04 05 06 07 08 09 10 11 12 13
22
6R
afi
lt [
Bq
/L]
0.000
0.002
0.004
0.006
0.008
0.010
0.00900.00750.00600.00450.00300.0015
60
50
40
30
20
10
0
Ra-226 total
Fre
qu
en
cy
Loc -6.226
Scale 0.3139
N 124
0.010.001
99
95
90
80706050403020
105
1
0.1
Ra-226 total
cu
mu
lati
ve
pe
rce
nt
Loc -6.237
Scale 0.2896
N 123
AD 0.482
P-Value 0.227
0.00900.00750.00600.00450.00300.0015
90
80
70
60
50
40
30
20
10
0
Ra-226 filtered
Fre
qu
en
cy
Loc -6.681
Scale 0.3334
N 124
0.010.001
99
95
90
80706050403020
105
1
0.1
Ra-226 filtered
cu
mu
lati
ve
pe
rce
nt
Loc -6.681
Scale 0.3347
N 123
AD 1.952
P-Value <0.005
a b
c d

22
3.3 Radium-226 concentration ratios
Figure 9 shows a histogram of all 226Ra CRs (rather than concentrations) measured in
flesh of age classed freshwater mussels (including 0, 1 and 2 year old mussels), Velesunio
angasi, collected between 2001 and 2013 from Mudginberri Billabong. This dataset was
generated by dividing the fresh weight 226Ra activity concentration in each age-
composited mussel sample from each year by the arithmetic mean 226Ra activity
concentration in total water of 0.0020 Bq·L-1 measured in Mudginberri Billabong post
2000. The average was used to calculate CRs as it was considered to better represent the
long-term 226Ra exposure conditions of mussels in Mudginberri Billabong compared to
the activity concentration in water on the day of mussel collection. In addition, the CRs
were weighted by the number of mussels in each composite age class: when an aged
composite sample from a particular collection consisted of i mussels, the CR value is
represented i-times in Figure 9. Table 3 shows the summary statistics for this dataset.
Figure 9 (a) Histogram and (b) cumulative probabilities of CRs [L·kg-1wet] measured in all mussels collected since 2001 in Mudginberri Billabong. The blue line represents a lognormal fit to the data.
Table 3 Statistical summary for the whole CR data-set. AM: arithmetic mean; AMSD: arithmetic mean standard deviation; GM: geometric mean; GMSD: geometric mean standard deviation.
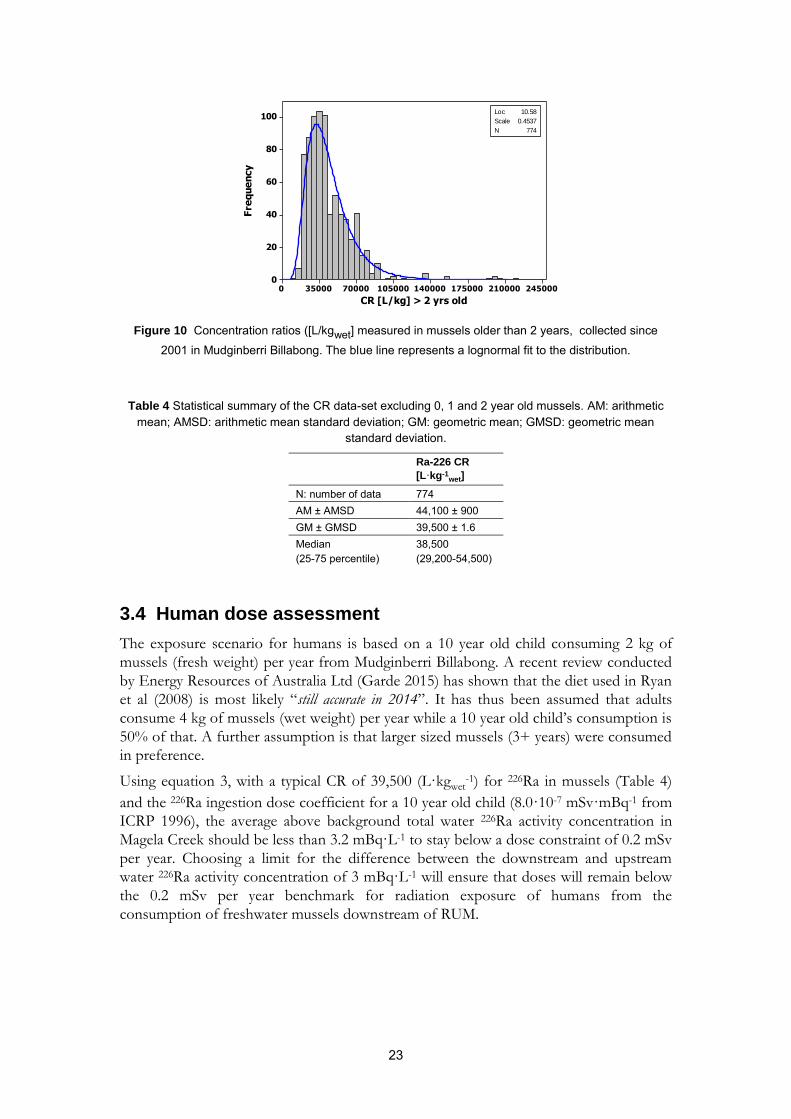
Figure 10 shows a histogram of all 226Ra CRs measured in flesh of age classed freshwater
mussels (excluding those mussels that are 0, 1 and 2 year old), collected between 2001
and 2013 from Mudginberri Billabong and Table 4 shows the summary statistics for this
data set.
24500021000017500014000010500070000350000
160
140
120
100
80
60
40
20
0
CR [L/kg]
Fre
qu
en
cy
Loc 10.31
Scale 0.6303
N 1106
1000000100000100001000
99.99
99
95
80
50
20
5
1
0.01
CR [L/kg]
cu
mu
lati
ve
pe
rce
nt
Loc 10.31
Scale 0.6303
N 1106
AD 3.199
P-Value <0.005
Probability Plot of CRLognormal - 95% CI
Ra-226 CR
[L·kg-1wet]
N: number of data 1106 AM ± AMSD 36,100 ± 23,900 GM ± GMSD 30,000 ± 1.9 Median (25-75 percentile)
31,200 (19,700-44,000)
23
Figure 10 Concentration ratios ([L/kgwet] measured in mussels older than 2 years, collected since 2001 in Mudginberri Billabong. The blue line represents a lognormal fit to the distribution.
Table 4 Statistical summary of the CR data-set excluding 0, 1 and 2 year old mussels. AM: arithmetic mean; AMSD: arithmetic mean standard deviation; GM: geometric mean; GMSD: geometric mean
standard deviation.
3.4 Human dose assessment
The exposure scenario for humans is based on a 10 year old child consuming 2 kg of
mussels (fresh weight) per year from Mudginberri Billabong. A recent review conducted
by Energy Resources of Australia Ltd (Garde 2015) has shown that the diet used in Ryan
et al (2008) is most likely “still accurate in 2014”. It has thus been assumed that adults
consume 4 kg of mussels (wet weight) per year while a 10 year old child’s consumption is
50% of that. A further assumption is that larger sized mussels (3+ years) were consumed
in preference.
Using equation 3, with a typical CR of 39,500 (L·kgwet-1) for 226Ra in mussels (Table 4)
and the 226Ra ingestion dose coefficient for a 10 year old child (8.0·10-7 mSv·mBq-1 from
ICRP 1996), the average above background total water 226Ra activity concentration in
Magela Creek should be less than 3.2 mBq·L-1 to stay below a dose constraint of 0.2 mSv
per year. Choosing a limit for the difference between the downstream and upstream
water 226Ra activity concentration of 3 mBq·L-1 will ensure that doses will remain below
the 0.2 mSv per year benchmark for radiation exposure of humans from the
consumption of freshwater mussels downstream of RUM.
24500021000017500014000010500070000350000
100
80
60
40
20
0
CR [L/kg] > 2 yrs old
Fre
qu
en
cy
Loc 10.58
Scale 0.4537
N 774
Ra-226 CR
[L·kg-1wet]
N: number of data 774 AM ± AMSD 44,100 ± 900 GM ± GMSD 39,500 ± 1.6 Median (25-75 percentile)
38,500 (29,200-54,500)

24
3.5 Environmental dose assessment
Table 5 gives the input parameter values used for the ERICA assessment.
Figure 11 shows the distributions of internal and external dose rates for an ERICA Tier 3
assessment for the freshwater mussel, Velesunio angasi, from an assumed water 226Ra
activity concentration of 1 Bq·L-1 and using parameters in Table 5. Only around 1% of
the dose rate to the mussels is from external gamma radiation.
The 99th percentile of the output probability distribution of the total dose rate was
chosen to represent the maximum dose rate to ‘a small proportion of individuals’ in the
mussel population and was subsequently used to back-calculate the guideline value from
the 400 µGy·h-1 benchmark dose rate adopted from UNSCEAR (1996, 2008). The total
water activity concentration of 226Ra leading to an exposure of 400 µGy·h-1 to 1 per cent
of the mussel population was calculated to be 24 mBq·L-1.
Table 5 Input parameter values used in the tier 3 assessment module of the ERICA Tool 1.2 to calculate the absorbed dose rate to mussels per unit activity concentration of 226Ra in water.
Parameter Value
Radionuclides 226Ra Organisms Mollusc - bivalve CR The arithmetic mean (36,100) and standard deviation (23,900) of the total mussel
population were entered as a lognormal distribution with a lower bound of zero and an upper bound of infinity.
Kd The arithmetic mean (227,500) and standard deviation (47,170) of values presented in Humphrey and Simpson (1985) for 226Ra in Magela Creek were entered as a lognormal distribution with a lower bound of zero and an upper bound of infinity.
Occupancy factor 100% at sediment-surface Radiation weighting factorsa 10 for alpha, 1 for gamma/beta and 3 for low energy beta Water activity concentration 1 Bq·L-1 Simulations 10000 Seed 0
aThe UNSCEAR dose rate of 400 µGy h-1 refers to the effects of exposure to low-LET radiation. Where a significant part of the incremental radiation exposure comes from high-LET radiation (alpha particles), it is necessary to take account of the different relative biological effectiveness of the radiation.

25
Figure 11 Distributions of internal and external an/d dose rates modelled for freshwater mussels, Velesunio angasi, from an assumed water 226Ra activity concentration of 1 Bq·L-1

26
4 Summary and conclusions
Doses to humans and the environment arising from 226Ra in Magela Creek water have
been assessed. As it has previously been shown (Martin et al 1998; Martin 2000; Johnston
et al 2005) that for a potential release of mine water from Ranger mine, 226Ra in mussels
will be the most important contributor to radiation doses to both humans and the
environment, the assessment presented here focussed on 226Ra in water only.
Our assessment of ingestion doses to humans and internal and external doses to mussels
from 226Ra has shown that human radiological protection is more limiting than
considerations for radiation protection of the environment. The assessment is based on
the above background total water 226Ra activity concentration in Magela Creek
downstream of RUM and by assuming that a 10 year old child consumes 2 kg (wet
weight) of large mussels per year. Using a typical CR for 226Ra in 3+ year old mussels
from Mudginberi Billabong collected between 2001 and 2013 we have shown that a mine
derived increase in total water 226Ra activity concentration of less than 3 mBq·L-1, will
lead to a mine origin ingestion dose to humans of less than 0.2 mSv per year. The same
increase in total water 226Ra activity concentration of 3 mBq·L-1, will lead to a maximum
additional dose rate to a small number of mussels (1%) of 50 µGy·h-1.
Total water 226Ra activity concentrations in Magela Creek are log-normally distributed,
thus the revised operational water quality objective for 226Ra in Magela Creek should be:
“The geometric mean of the total 226Ra activity concentration for the wet season at the downstream site
will not be more than 3 mBq/L greater than that at the upstream site”.
This will ensure that doses to humans from the ingestion of mussels will be below 0.2
mSv, and that the radiological impact from 226Ra in the water column to the aquatic
environment in Magela Creek will be negligible.

27
References
Alam L & Mohamed CAR 2010. Polonium. In: Atwood, DA (Editor). Radionuclides in
the Environment,. John Wiley & Sons Ltd.
ARPANSA 2014a. National Directory for Radiation Protection. Republished February
2014, including amendments 1–6. Radiation Protection Series no. 6. Available from:
www.arpansa.gov.au/pubs/rps/rps6.pdf.
ARPANSA 2014b. Protection against Ionising Radiation. Radiation Protection Series F-
1. Available from: www.arpansa.gov.au/pubs/rps/rpsF-1.pdf.
Bollhöfer, A 2012. Stable lead isotope ratios and metals in freshwater mussels from a
uranium mining environment in Australia’s wet-dry tropics. Applied Geochemistry
27, 171–185.
Bollhöfer A, Brazier J, Ryan B, Humphrey C, Esparon A, 2011. A study of radium
bioaccumulation in freshwater mussels, Velesunio angasi, in the Magela Creek
catchment, Northern Territory, Australia. J. Environ. Radioact. 102, 964–974.
BoM, 2015. Australian Bureau of Meteorology. Accessed January 2015.
http://www.bom.gov.au/climate/averages/tables/cw_014198.shtml
Brenner M, Smoak JM, Leeper DA, Streubert M, Baker SM, 2007. Radium-226
accumulation in Florida freshwater mussels. Limnol. Oceanog. 52, 1614–1623.
Brown JE, Alfonso B, Avila R, Beresford NA, Copplestone D, Pröhl G, Ulanovsky A,
2008. The ERICA Tool. Journal of Environmental Radioactivity 99, 1371–1383.
Copplestone D, Bielby S, Jones SR, Patton D, Daniel P & Gize I 2001. Impact
assessment of ionising radiation on wildlife. R&D Publication 128. Environment
Agency, Bristol, UK.
Curie M, Curie P, Bemont G 1898. Another new radio-active element, C.R. 127, 1215-
1217.
Doering C 2010. Environmental protection: Development of an Australian approach for
assessing effects of ionising radiation on non-human species, ARPANSA Technical
Report No. 154.
Doering C 2013. The BRUCE tool. Internal Report 619, Supervising Scientist Division,
Canberra. Unpublished paper.
Doering C, Bollhöfer A, 2015. A soil radiological quality guideline value for wildlife-
based protection in uranium mine rehabilitation, Journal of Environmental
Radioactivity, http://dx.doi.org/10.1016/j.jenvrad.2015.08.020
Ellis WR, Jeffree RA, 1982. Determination of the distribution of alpha emitters in the
tissue of the freshwater mussel Velesunio angasi using the alpha track etch method.
In: Fowler, P.H., Clapham, V.M. (Eds.), Proceedings of the 11th International
Conference on Solid State Nuclear Track Detectors, Bristol, September 1981.
Pergamon Press, Oxford, pp. 683e689.
ERA 2014. Energy Resources of Australia Ltd. Radiation Protection Program (Revision
1.14.1). Ranger Operations Radiation Management Plan. January 2014.
28
Fisher NS, Teyssie JL, Krishnaswami S, Baskaran M 1987. Accumulation of Th, Pb, U
and Ra in marine phytoplankton and its geochemical significance. Limnol.
Oceanogr., 32(l), 131-142.
Garde M 2015. Closure Criteria Development - Cultural. ERA Ranger Integrated Tailings
Water & Closure, April 2015, p 160.
Harford A, Trenfield M, Cheng K & Van Dam R 2014. Ecotoxicological assessment of manganese. Internal report 630, Supervising Scientist, Darwin NT. Unpublished paper
Hogan AC, van Dam RA, Markich SJ & Camilleri C 2003. Chronic toxicity of uranium to
the tropical green alga Chlorella sp. for the derivation of a site specific Trigger Value
for Magela Creek. Internal Report 412, December, Supervising Scientist, Darwin.
Unpublished paper.
Humphrey CL & Simpson RD 1985. The biology and ecology of Velesunio angasi
(Bivalvia: Hydiidae) in the Magela Creek, Northern Territory (4 parts). Open file
record 38, Supervising Scientist for the Alligator Rivers Region, Canberra.
Unpublished paper.
IAEA 1990. The Environmental Behaviour of Radium. International Atomic Energy
Agency Technical Report Series No 30. IAEA, Vienna.
IAEA 2014. Radiation Protection and Safety of Radiation Sources: International Basic
Safety Standards. General Safety Requirements. International Atomic Energy Agency
Safety Standards Series GSR Part 3. IAEA, Vienna.
ICRP 1996. Age-dependent Doses to Members of the Public from the Intake of
Radionuclides: Part 5. Compilation of Ingestion and Inhalation Dose Coefficients.
In: ICRP Publication 72.
ICRP 2007. The 2007 recommendations of the International Commission on
Radiological Protection. ICRP Publication 103, Annals of the ICRP 37(2–4).
ICRP 2008. Environmental protection: the concept and use of reference animals and
plants. ICRP Publication 108, Annals of the ICRP 38(4–6).
Iles M 2004. Water quality objectives for Magela Creek – revised November 2004.
Internal Report 489, December, Supervising Scientist, Darwin. Unpublished paper.
Ivanovich M, Harmon RS 1982. Uranium series disequilibrium: applications to
environmental problems. Clarendon Press, Oxford.
Johnston A, Humphrey C, Martin P 2005. Protection of the environment from the
effects of ionizing radiation associated with uranium mining. In: Protection of the
Environment from the Effects of Ionizing Radiation. Proceedings of an International
Conference Stockholm, 6–10 October 2003. International Atomic Energy Agency,
Vienna.
Johnston A, 1987. Radiation Exposure of Members of the Public Resulting from
Operation of the Ranger Uranium Mine. Technical Memorandum 20. Supervising
Scientist for the Alligator Rivers Region, AGPS, Canberra.
Johnston A, Murray A, Marten R, Martin P, Pettersson H, 1984. Uranium series
radionuclide concentrations in significant Aboriginal foods. In: Alligator Rivers

29
Region Research Institute, Research Report for 1983-84. Supervising Scientist for the
Alligator Rivers Region. Australian Government Publishing Service, Canberra.
Johnston A, Murray AS, Marten R, Martin P, Petterson H, 1987. Bioaccumulation of
Radionuclides and Stable Metals in the Freshwater Mussel, Velesunio angasi.
Alligator Rivers Region Research Institute Annual Research Summary 1986-87.
Supervising Scientist for the Alligator Rivers Region, AGPS, Canberra, pp. 69-74.
Kendall GM, Smith TJ, 2002. Doses to organs and tissues from radon and its decay
products. J Radiol Prot. 22(4), 389–406.
Klessa D 2001a. Water quality in Magela Creek upstream and downstream of Ranger: A
summary of findings for the 1999–2000 Wet season. Internal Report 360,
Supervising Scientist, Darwin. Unpublished paper.
Klessa D 2001b. Water quality in Magela Creek upstream and downstream of Ranger: A
summary of performance for 2000–2001 and derived triggers and limits for 2001–
2002. Internal Report 380, Supervising Scientist, Darwin. Unpublished paper.
Kum DK, Jun I, Choi YH, Lim KM, 2010 K-BIOTA V 1.0 User's Manual. Korea
Atomic Energy Research Institute (KAERI ) Technical Report 4230.
Martin P 2000. Radiological impact assessment of uranium mining and milling. PhD
thesis. Queensland University of Technology, Brisbane.
Martin P, Hancock GJ, Johnston A, Murray AS, 1998. Natural-series radionuclides in
traditional north Australian Aboriginal foods. J. Environ. Radioact. 40, 37-58.
Medley P, Bollhöfer A, Parry D & Martin P 2013. Radium concentration factors in
passionfruit (Passiflora foetida) from the Alligator Rivers Region, Northern Territory,
Australia. Journal of Environmental Radioactivity 126, 137-146.
Medley P, Bollhöfer A 2015. Influence of group II metals on Radium-226 concentration
ratios in the native Green Plum (Buchanania obovata) from the Alligator Rivers
Region, Northern Territory, Australia. Journal of Environmental Radioactivity (in press).
http://dx.doi.org/10.1016/j.jenvrad.2015.07.013
National Research Council (US) Committee on the Biological Effects of Ionizing
Radiations. Health Risks of Radon and Other Internally Deposited Alpha-Emitters:
Beir IV. Washington (DC): National Academies Press (US); 1988. 4, Radium.
Available from: http://www.ncbi.nlm.nih.gov/books/NBK218126/
Riisgård HU, Egede PP, Saavedra IB, 2011. Feeding Behaviour of the Mussel, Mytilus
edulis: New Observations, with a Minireview of Current Knowledge. Journal of
Marine Biology, Article ID 312459, 13 pages.
Ryan B, Martin P, Humphrey C, Pidgeon R, Bollhöfer A, Fox T & Medley P 2005.
Radionuclides and metals in fish and freshwater mussels from Mudginberri and
Sandy Billabongs, Alligator Rivers Region, 2000–2003. Internal Report 498,
November, Supervising Scientist, Darwin. Unpublished paper.
Ryan B, Medley P, Bollhöfer A, 2008. Bioaccumulation of radionuclides in terrestrial
plants on rehabilitated landforms. In: eriss research summary 2006–2007, eds Jones,
D.R., Humphrey, C., van Dam, R., Webb, A., Supervising Scientist Report 196,
Supervising Scientist, Darwin NT, 99–103.

30
Saito K, Jacob P, 1995. Gamma ray fields in the air due to sources in the ground.
Radiation Protection Dosimetry 58 (1), 29–45.
Sauerland C, Martin P, Humphrey C, 2005. Radium 226 in Magela creek, northern
Australia: application of protection limits from radiation for humans and biota.
Radioprotection 40 (Suppl. 1), S451eS456.
Sinclair A, Tayler K, van Dam R & Hogan A 2013. Site-specific water quality guidelines:
2. Development of a water quality regulation framework for pulse exposures of mine
water discharges at a uranium mine in northern Australia. Environmental Science and
Pollution Research. DOI 10.1007/s11356-013-1922-4.
Strebl F, Ehlken S, Gerzabek MH, Kirchner G, 2007. Series: Radioactivity in the
Environment, Year: 2007, Volume 10, Page 19. DOI: 10.1016/S1569-
4860(06)10002-9
Supervising Scientist, 2008. Annual Report 2007–2008. Supervising Scientist, Darwin.
Supervising Scientist, 2009. Annual Report 2008–2009. Supervising Scientist, Darwin.
Supervising Scientist, 2014. Annual Report 2013–14, Supervising Scientist, Darwin.
Supervising Scientist 2015. Annual Report 2014–2015. Supervising Scientist, Darwin.
Suradi M, Fourie A, Beckett C, Buzzi O, 2014. Rainfall induced landslides: development
of a simple screening tool based in rainfall data and unsaturated soil mechanics
principles. In: Unsaturated Soils: Research & Applications (Eds. Khalili N., Russell,
A., Khoshghalb A.). Taylor & Francis Group, London.
Tsivoglou EC, Bartsch AF, Rushing DE, Holaday DA, 1958. Effects of uranium ore
refinery wastes on receiving waters. Sewage Industrial Wastes 30, 1012-1027.
UNSCEAR 1996. Sources and Effects of Ionizing Radiation. Report to the General
Assembly with Scientific Annexes. United Nations, New York.
UNSCEAR 2008. Sources and Effects of Ionizing Radiation. Report to the General
Assembly with Scientific Annexes. United Nations, New York (published 2011).
United States Department of Energy (USDOE) 2004. RESRAD-BIOTA: A tool for
implementing a graded approach to biota dose evaluation. DOE/EH-0676, National
Technical Information Service, Springfield.
Vandenhove H, Verezzen F, Landa ER 2010. Radium. In: Atwood, DA (Editor).
Radionuclides in the Environment,. John Wiley & Sons Ltd.
Walker TD, Tyler PA, 1982. Chemical characteristics and nutrient status of billabongs of
the Alligator Rivers Region, Northern Territory. Open File Record 27, Supervising
Scientist for the Alligator Rivers Region, Canberra.
Yu C, LePoire D, Arnish J, Cheng JJ, Hlohowskij I, Kamboj S, Klett T, Domotor S,
Higley K, Graham R, Newkirk P, Harris T 2002. The RESRAD-BIOTA Code for
Application in Biota Dose Evaluation: Providing Screening and Organism -Specific
Assessment Capabilities for Use Within an Environmental Protection Framework.
In: International Atomic Energy Agency.