Embed Size (px)
Citation preview
Oleg V. Pavlov and Khalid Saeed: Analysis of Peer-to-Peer Technology 237A resource-based analysis of peer-to-peertechnology
Oleg V. Pavlova* and Khalid Saeeda
Abstract
Peer-to-peer technology allowed massive free music file sharing, which led to much controversy,
legal debate, and a great deal of speculation about the technology’s business viability. Operation of
a peer-to-peer (P2P) network depends on the content and bandwidth contributions from its users.Many users free ride by contributing fewer resources than they use. Research found that free riding
intensifies with crowding. These salient features suggest that the underlying template describing a
P2P system may be the limits to growth archetype. We expand on this idea by building a systemdynamics model, which captures complex causal interactions between private provision of com-
mon resources, free riding, network performance, and membership dynamics. Base runs confirm
that the model reproduces historically observed behavior. We use the calibrated model to testeffectiveness of certain modifications that have been proposed for real P2P networks. Simulation
results are explained by reviewing the interplay of reinforcing and limiting feedbacks that drive
the system. Copyright © 2004 John Wiley & Sons, Ltd.
Syst. Dyn. Rev. 20, 237–262, (2004)
In 1999, 19-year old Shawn Fanning released Napster software. Its sole pur-pose was to allow music lovers to swap free MP3 files. Within 20 months, 65million people used the software to trade music (Leuf 2002, p. 191). A groupof big record labels responded with a fierce legal offensive against Napster,Inc. The group claimed that the P2P network violated copyright laws and costthem millions of dollars in lost CD sales (CNN Money 2002). Napster, Inc.eventually lost the case in court and had to shut down. However, a numberof peer-to-peer networks withstood legal challenges and are thriving. Twopopular systems are Gnutella and KaZaA. Unlike Napster, current systems donot require a central server or a centralized controlling body.
The phenomenal popularity of the technology led to the predictions of anapproaching peer-to-peer revolution in electronic commerce. Commercial adop-tion of P2P systems may be driven by its many coveted features: distributedcost of storage, distributed processing cost, autonomy of nodes, robustnessagainst malicious attacks, and load balancing (Yang and Garcia-Molina 2002a).Future distributed computing ( Jovanovic et al. 2001) and massive storagesystems (Leuf 2002, p. 106) will be affected by P2P. The technology may havea profound impact on the structure of the economy. It may democratize mar-kets by allowing individuals and organizations to conduct their own auctions
Oleg V. Pavlov is an
Assistant Professor
of Economics andSystem Dynamics
at Worcester
Polytechnic Institute,U.S.A. His current
research focuses on
the economics ofinformation systems.
He earned his BS in
physics and computerscience and PhD in
economics from the
University of SouthernCalifornia.
Khalid Saeedis Professor and
Department Head ofSocial Science and
Policy Studies at
Worcester PolytechnicInstitute, U.S.A. He
holds a dual PhD in
system dynamicsand economic
development from
MassachusettsInstitute of
Technology and
has served as aPresident of the
System Dynamics
Society. ProfessorSaeed received the
Jay Wright Forrester
Award in 1995 for hiswork on sustainable
development.
System Dynamics Review Vol. 20, No. 3, (Fall 2004): 237–262 Received September 2003Published online in Wiley InterScience Accepted June 2004(www.interscience.wiley.com). DOI: 10.1002/sdr.297Copyright © 2004 John Wiley & Sons, Ltd.
237
a Social Science and Policy Studies, Worcester Policy Institute, 100 Institute Road, Worcester, MA 01609, U.S.A.
* Correspondence to: Oleg V. Pavlov; E-mail: [email protected] early version of this paper was presented at the Conference on Economic Behavior and Organization, 26–27 April 2003, University of Southern California Law School, Los Angeles, U.S.A.

238 System Dynamics Review Volume 20 Number 3 Fall 2004
without the need for intermediaries (Non 2000). The technology may also actas a payment platform (Elkin 2002).
About 60 per cent of Americans, or 174.6 million people, regularly use theInternet (Lenhart et al. 2003). Millions of additional devices including variousappliances will come online after the adoption of the IPv6 protocol (Tanenbaum2003, p. 464). The pressing issue is whether or not peer technology can scaleto accommodate all the potential online users. Some experts have concludedthat peer-to-peer technology is not capable of handling large volumes of trafficrequired for successful scaling (Ritter 2001). Proponents of the technologydisagreed (Kabanov 2001), suggesting that as nodes gain access to faster con-nections the problem would go away (Shirky 2000).
An examination of a typical peer-to-peer system suggests that it may bedescribed by the limits to growth archetype (Senge 1990). The archetype isone of the fundamental structures that are common to a great variety ofmanagerial, economic, and physical systems. These systems are characterizedby the presence of reinforcing processes that encourage growth. Secondaryeffects, however, gradually rise in strength and slow down or even reverse theupward movement.
The next section describes a representative peer-to-peer network and pro-poses a dynamic hypothesis. The following sections review the computermodel, describe base numerical experiments aimed at understanding thesystem, and present a series of experimental results, which underscore thelessons from the limits to growth archetype. The final section offers discussionand conclusions.
Resource sharing
The peer grid of a system such as Gnutella or KaZaA is a virtual networkformed at the application level, which is distinct from the underlying physicalnetwork (Ripeanu et al. 2002). A person can participate in a peer network byeither downloading a piece of software commonly referred to as a “servent” orby logging on to a dedicated web site (Bolcer 2000). A node forwards a searchquery to other nodes to which it is connected until the message travels themaximum allowed number of hops determined by the Time To Live (TTL)parameter. Hosts that contain the material in the query respond with a messagethat traverses the path by which it arrived.
Peer-to-peer systems have been compared to an Internet potluck: nodescontribute to the network by providing files and by routing network traffic(Kan 2001). Providing content to other peers is costly not only because acquir-ing the content imposes some fixed cost on the altruistic peer in terms ofpurchasing CDs, but also because each additional upload slows down theserving computer and its own downloads (Adar and Huberman 2000; Yangand Garcia-Molina 2002b). Users clearly have an incentive to free ride with

Oleg V. Pavlov and Khalid Saeed: Analysis of Peer-to-Peer Technology 239
respect to content and bandwidth, which means “taking their share of itand keeping their own resources for themselves” (Marwell and Ames 1979).Economic literature on private provision of public goods suggests that typi-cally the free riding problem worsens with the group size (see, for example,Isaac and Walker 1988; Gaube 2001). Asvanund et al. (2002) confirmed theexistence of a positive correlation between free loading and crowding in P2Pnetworks.
Free riding may be accomplished in a variety of ways. By default, most of theP2P software shares all downloaded files (Golle et al. 2001; LimeWire 2003).However, Adar and Huberman (2000) found that only about 30 per centof users share files on Gnutella and 20 per cent of hosts share 98 per cent of allthe files available on the network. Many more studies later confirmed theconsiderable free riding tendencies of P2P systems. Figure 1a shows resultsfrom a measurement study by one of the research teams. Providing undesirablecontent is also a form of freeloading (Adar and Huberman 2000). Adar andHuberman reported that 1 per cent of hosts provided 47 per cent of answers tofile requests and 25 per cent provided 98 per cent of the responses. Capacityoffered to the network can be controlled through the number of allowed con-nections and by misstating the connection speed. Extreme cases of free ridingare browser-based search web sites, e.g., asiayeah.com and gnute.com, thatallow users to enter a peer network and search the shared database withoutcontributing any content or routing the network data traffic.
A person may also choose not to contribute to the network simply by turningthe computer off. There is a special term used in the peer-to-peer communityto describe this type of behavior—fishing—the user logs into the network,downloads what she needs, and promptly leaves the system. Data presented inFigure 1(b) show that about half of the sessions are 60 minutes or shorter andonly 20 per cent of hosts remain continuously in the network for longer than3 hours.
Fig. 1. Resourcesharing on peer
networks: (a) file
sharing on Gnutella;(b) session duration on
Napster and Gnutella.
Source: Saroiu et al.(2001)

240 System Dynamics Review Volume 20 Number 3 Fall 2004
Fig. 2. Adaptation of
the Limits to Growth
archetype for a P2Psystem
Adar and Huberman (2000) proposed that rampant free riding behavior mayresult in resource inadequacy, which in turn leads to variations in networkperformance, as measured by latency of search responses and the probabilityof a successful download. The system dynamics community has identified andstudied many examples of human and physical systems that show character-istics similar to the ones observed in file sharing networks: reinforcing processesstimulate a system’s growth, but the growth strengthens the balancing effectsthat impose limits to growth (e.g., Senge 1990; Moxnes 1998; Sterman 2000).The underlying template for such systems is the limits to growth archetype(Senge 1990, p. 95).
Figure 2 presents an adaptation of the archetype for the case of an onlinefile sharing system. More users imply greater stocks of shared resources (filesand bandwidth), which improve network performance and encourage furthernetwork growth. The word-of-mouth (WOM) effect creates another reinforcingloop. The two reinforcing loops are checked by two balancing loops: crowdingmeans more traffic, which degrades performance directly, and crowdingamplifies the free riding problem, which lowers performance indirectly. Per-formance is positively linked to network usage.
Model implementation
The feedback structure of Figure 2 has been converted into a numerical modelusing the system dynamics methodology. The model has been programmed inVensim DSS software. The model consists of four sectors (Figure 3), which wedescribe in this section.
Network users
The Network Users sector (Figure 4) models the daily average number ofunique hosts U connected to the peer-to-peer system. In a recent measure-ment study, Bhagwan et al. (2003) found that a certain percentage of uniquehosts (as measured by unique user IDs, rather than IP addresses) were joining
Oleg V. Pavlov and Khalid Saeed: Analysis of Peer-to-Peer Technology 241
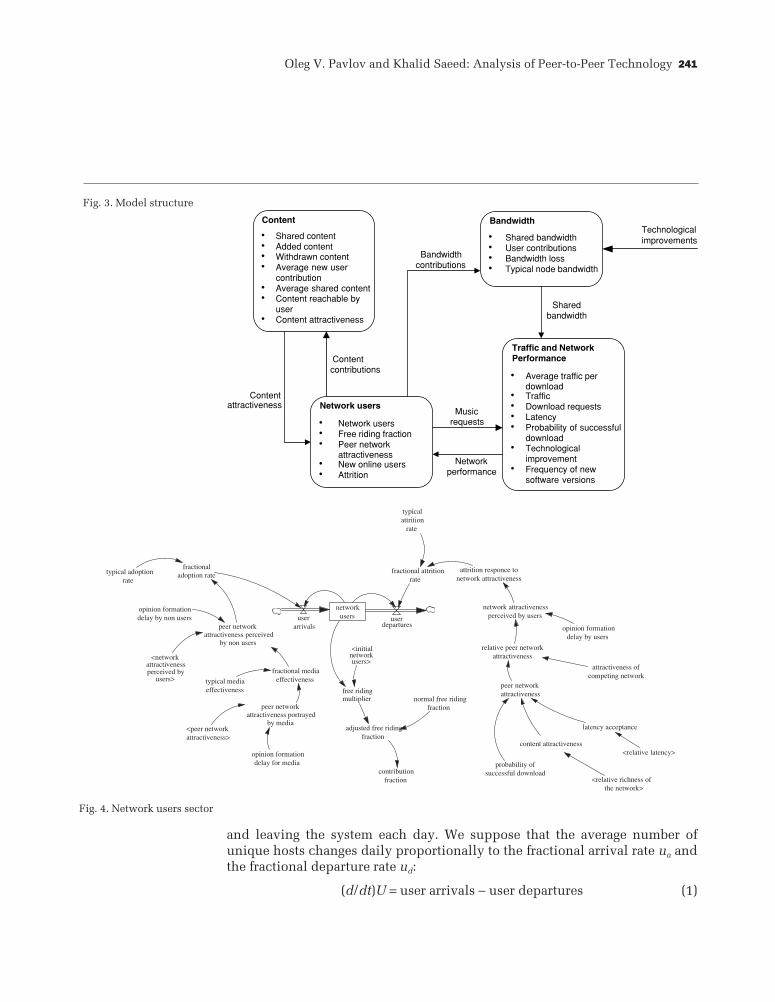
Fig. 3. Model structure
Fig. 4. Network users sector
and leaving the system each day. We suppose that the average number ofunique hosts changes daily proportionally to the fractional arrival rate ua andthe fractional departure rate ud:
(d/dt)U = user arrivals − user departures (1)

242 System Dynamics Review Volume 20 Number 3 Fall 2004
where
user arrivals = uaUuser departures = udU
Fractional adoption and attrition rates vary on the basis of the current percep-tion of network attractiveness. We distinguish two effects (Dutta and Hsu2001; Warren 2003): non-users join on the basis of the second-hand networkreputation rn and current users stay or leave on the basis of the first-handreputation ru. The rates are:
ua = utarn ud = ut
a(1 + gd(ru)) 0 ≥ rn, ru ≥ 1 (2)
where uta and ut
a are typical adoption and departure rates respectively. Func-tion gd(·) captures the departure rate response to the network reputation:
gd(ru) > 0 (3)
gd′ (ru) < 0
gd″(ru) < 0
Changes in the peer network reputation modify the typical growth rates ofthe system: lower reputation increases departures and leads to a reduction inthe new user arrival rate; greater reputation has the opposite effect.
Network attractiveness a depends on content attractiveness aC, networklatency acceptance al, and the probability of a successful download psd:
a = aC · al · psd (4)
Content attractiveness is defined in the following section. Latency acceptanceand the probability of a successful download are defined in the section Trafficand network performance.
Current users gradually modify their perception of network attractiveness inresponse to daily changes of network performance a:
ru = SMOOTHI(a, τu, 1) (5)
where parameter τu is the opinion formation delay. We assume that initiallyusers have high hopes with respect to the network performance, and thereforewe set the initial value for reputation to one. Non-users rely on the opinion ofusers regarding the network attractiveness, which may be buttressed by mediareports. For example, LimeWire, which provides software to connect to theGnutella network, acknowledges that positive media exposure helped withhigh adoption rates of the P2P technology (LimeWire 2003). We model thesecond-hand opinion formation as
rn = media impact · SMOOTHI(ru, τn, 1) (6)
where
media impact = media effectiveness · am (7)
Oleg V. Pavlov and Khalid Saeed: Analysis of Peer-to-Peer Technology 243
is a multiplier that captures the effect media has on opinion formation. Vari-able am is the peer network attractiveness portrayed by media:
am = SMOOTHI(a, τm, 1) (8)
where τm is the time the media takes to report successes and failures of a peer-to-peer network. Since the media, including on-line news groups, is typicallyvery quick to report and discuss any performance glitches of a popular net-work, we will assume that the shortest delay among the three delays in themodel is the opinion formation delay by the media:
τm < τu < τn (9)
The model gauges the free riding effect through the adjusted free riding frac-tion f. Following experimental evidence (see the previous section), this modelassumes that the free riding problem intensifies with crowding. This is modeledby introducing a nonlinear function named free riding effect f (U ). The freeriding fraction is benchmarked to some minimal value f min:
f = f min · f (U ) (10)
f min ≤ f ≤ 1
f (U ) ≥ 1
f (U initial) = 1
f ′(U ) > 0
Content
New network arrivals contribute to the common pool of files C and departinghosts withdraw content:
(d/dt)C = added content − withdrawn content (11)
A typical user joining a P2P network shares cav files, which is a fraction κC ofthe maximum new user contribution, cmax. The fraction size on average dependson the severity of the free riding problem measured by free riding fraction f:
κC = 1 − f (12)
Then the number of files a new node brings to the network is
cav = cmax · κC (13)
New nodes together contribute content proportional to cav:
added content = cav · user arrivals (14)
The model separates the decision to join the network from the decision toleave it. The average shared content sav is the total stock of shared files dividedby current users U:
sav = C/U (15)

244 System Dynamics Review Volume 20 Number 3 Fall 2004
The model assumes that total withdrawn content is proportional to total numberof departing users:
withdrawn content = sav · user departures (16)
As a result of the highly dynamic topology and the finite time to live (TTL)parameter, the actual reach of each node is significantly smaller than the entirenetwork (Leuf 2002, p. 199). For data collected for a seven month periodstarting in November 2000, Ripeanu et al. (2002) found that the average numberof hosts visible to a node is independent of the network size. Ritter (2001)mathematically estimates that for a network in which each node has on aver-age three edges and TTL is set to 7 (a typical number in Gnutella), at best nv =381 nodes are visible from each peer. We model content reachable by the usercr as:
cr = α · nv · sav (17)
Accounting for the highly dynamic nature of node connections ( Jovanovicet al. 2001), parameter 0 > α > 1 adjusts the theoretical value of visible nodes.The relative collection size s is a ratio of cr to the typical personal digitalcollection cp:
s = cr/cp (18)
We assume that the average collection of a non-user is time invariant. Therelative collection size determines content attractiveness aC through a sched-ule of diminishing returns:
aC = fC(s) (19)
0 ≤ fC(s) ≤ 1
fC(0) = 0
f C′ (s) > 0
f C″ (s) < 0
Figure 5 presents a rendition of the sector’s coflow formulation (Sterman 2000,p. 503).
Bandwidth
The formulation of the Bandwidth sector (Figure 6) is analogous to the Contentsector. Network capacity, which is measured in terms of the shared band-width, increases with the addition of a new peer, and diminishes when a peerabandons the network. At best, each peer contributes its entire bandwidth,which is the typical node bandwidth bt. However, in most situations thecontribution is below this maximum value and is controlled by the contribu-tion fraction κB:
bandwidth contribution = user arrivals · bt · κB (20)

Oleg V. Pavlov and Khalid Saeed: Analysis of Peer-to-Peer Technology 245
κB = 1 − f (21)
Nodes that depart from the network no longer process network traffic. Thebandwidth loss due to the nodes leaving is:
bandwidth loss = bav · user departures (22)
Here
bav = B/U (23)
The shared bandwidth resource is modeled as a dynamic process:
(d/dt)B = bandwidth contribution − bandwidth loss (24)
In time, more users upgrade their Internet connections; therefore, the typicalnode bandwidth bt increases according to the following rule:
(d/dt)bt = ρ · bt (25)
where ρ > 0 is the bandwidth growth rate.
Traffic and network performance
The Traffic and Network Performance sector (Figure 7) models traffic T of afile-sharing network and the impact the traffic has on latency and the probability
Fig. 5. Content sector

246 System Dynamics Review Volume 20 Number 3 Fall 2004
Fig. 6. Bandwidth
sector
Fig. 7. Traffic and
network performancesector

Oleg V. Pavlov and Khalid Saeed: Analysis of Peer-to-Peer Technology 247
of a successful download, which are the two dimensions of network perform-ance adopted in this model. By implementing a well-known negative relation-ship between data traffic and network performance (Tanenbaum 2003), thesubsystem completes the Traffic loop in the feedback structure of Figure 2.
If it is assumed that an average user requests du files per day, the total dailydemand for files is
d = du · U (26)
where U is the number of current network users. Peer-to-peer traffic consistsof protocol maintenance packets, search and response messages, and file trans-fers (Yang and Garcia-Molina 2002b; Ritter 2001). The model assumes thateach successful download is associated with a certain average traffic volumetav. It then follows that the total traffic generated by all file downloads is
T = d · t av (27)
Utilization λ is a ratio of the network traffic to the total bandwidth capacity B:
λ = T/B (28)
Utilization indicates the capacity adequacy of a network.Once a node’s bandwidth is saturated, a number of things may happen (Leuf
2002, p. 121). First, connections to other nodes may be dropped. This would leadto the loss of return paths, unfulfilled requests, and repeat of request broad-casts. Second, the node may simply ignore some of the request traffic. Third,the node can buffer some messages and wait until bandwidth frees up, but thiswould slow down the performance of the computer and also contribute to thelatency along the path. Network theory suggests that for a given networkcapacity there is a nonlinear relationship between delay (latency) and trafficload (Figure 8). In busy P2P networks, latency has been known to increasebeyond its typical values by as much as a factor of six (Asvanund et al. 2002).
The model benchmarks latency l to some normal latency ln:
l = (1 + ldf) · ln (29)
where ldf is the delay factor that captures a nonlinear relationship betweenlatency and network utilization:
ldf = l(λ) (30)
l′(λ) > 0
l″(λ) > 0
l(0) = 0
It has been observed that peer-to-peer file sharing became popular becauseearly networks were relatively fast (Leuf 2002, p. 130). Network speed wasranked second in importance only to the “no-fee” nature of the exchanges in arecent survey of P2P users (Lee 2003). The model simulates user attitudes

248 System Dynamics Review Volume 20 Number 3 Fall 2004
Fig. 8. Average packet
delay as a function
of traffic load.Source: Pecar and
Garbin (2000, p. 429)
toward latency as latency acceptance al, which is a declining function oflatency with increasing marginal dissatisfaction:
al = fl(l) 0 ≤ fl ≤ 1, fl′ < 0, fl″ < 0 (31)
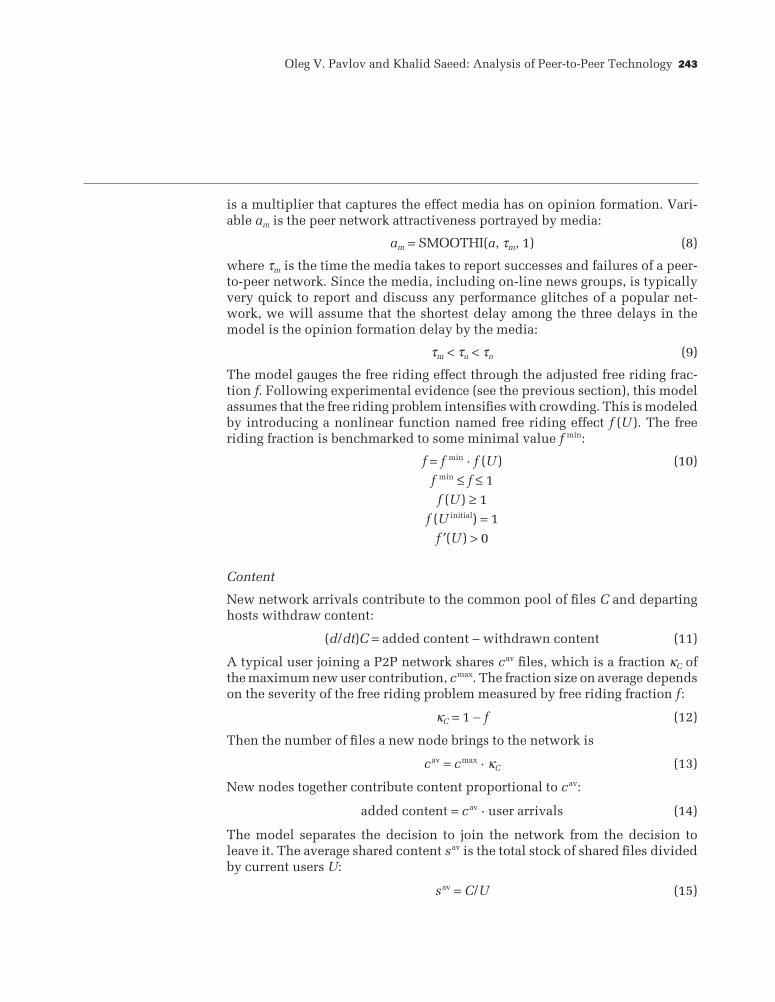
Asvanund et al. (2002) report that on busy days it can take up to 45 requestattempts, rather than the average of 2.85 in a non-busy network, before a songdownload can be initiated. The telecommunication industry defines a fractionof attempts to obtain a service that were not successful as the blocking prob-ability (Pecar and Garbin 2000, p. 202). For digital networks, blocking prob-ability is a nonlinear function of network utilization (Figure 9). Accordingly,the probability of an unsuccessful download attempt is modeled as a nonlinearlookup function of capacity utilization λ with the following characteristics:
pud = pud(λ) (32)
p ′ud(λ) > 0
limλ→0
p ′ud(λ) = 0
limλ→1
p ′ud(λ) = 0
The probability of a successful download attempt is given by:
psd = 1 − pud (33)
When the network is sluggish, users tend to resubmit their queries. If peer-to-peer software does not receive a positive query response within an allottedtime frame, then it also automatically resubmits the query (Leuf 2002).Furthermore, unsuccessful downloads must be repeated. For these reasons, in
Oleg V. Pavlov and Khalid Saeed: Analysis of Peer-to-Peer Technology 249
a busy network the average traffic per each download tav swells beyond thebase traffic per download tb:
(d/dt)tav = traffic adjustment (34)traffic adjustment = t* − tav
Here t* is the traffic per download adjusted for traffic congestion. It is modeledas a nonlinear multiplicatively separable function of two factors: the probab-ility of unsuccessful download pud and delay factor ldf,
t* = (1 + pud)α · (1 + ldf)
α · tb 0 ≤ α ≤ 1 (35)
Parameter α is the traffic elasticity, which measures the sensitivity of trafficvolume to congestion.
Base runs
Figure 10 shows actual P2P node count overlaid by a trajectory from a simula-tion for the set of parameter values in Table 1. One immediately notices theabsence of fast fluctuations in the simulation. The high-frequency oscillationsin the real data are due to the hourly variations in online usage: more peopleare on the Internet around midnight than at 6 o’clock in the morning (Kitz andEssien 2002). In this model we do not replicate hourly variations in order toavoid the potential problem of stiffness that arises when time constants ofsignificantly different magnitudes are employed in a model (see, for example,Maron and Lopez 1991 for discussion).
Fig. 9. Blocking
probability.
Source: Pecar andGarbin (2000, p. 425)

250 System Dynamics Review Volume 20 Number 3 Fall 2004
Fig. 10. Simulated
trajectory. Gnutella
network hosts data arefor one year between
1 January 2001 and
1 February 2002.Source: http://
www.limewire.com
Table 1. ParametersParameter Value Units
nv Number of reachable nodes 381 Nodesτn Opinion formation delay by non users 100 Day
τu Opinion formation delay by users 25 Day
τm Opinion formation delay for media 1 Daydu Individual file demand 1.87 Files/user
cmax Maximum new user contribution 3,000 Files
f min Minimal free riding fraction 0.09 —tb Base traffic per download 15,000 Bits
α Traffic elasticity 0.192 —
ln Normal latency 1 Secondsut
a Typical adoption rate 0.02 —
utd Typical departure rate 0.0015 —
cp Typical private collection size 500 Filesρ Bandwidth growth rate 0.0013 —
Media effectiveness 2.3 —
Average initial content contribution 3,000 FilesU initial Initial network users 2,000 Users
Initial typical node bandwidth 60,000 Bits/sec
Figure 11 shows model behavior during the base simulation, which can beexplained in terms of the major feedback loops in Figure 12. Two positivenetwork externality effects drive the growth of the system: users providecontent that boosts network attractiveness (the positive Provided Content loopR1) and contribute bandwidth needed for routing network traffic (the ProvidedCapacity loop R2). Adequate availability of resources (Figure 11a) ensuresnetwork attractiveness, which in turn helps to draw more users and encourages

Oleg V. Pavlov and Khalid Saeed: Analysis of Peer-to-Peer Technology 251
Fig. 11. Simulated network dynamics
current users to stay with the network. The expansionary growth is limited bynegative externalities associated with crowding. As membership increases, thefree riding problem becomes more pronounced, which checks the contributionof the shared bandwidth and content through the Capacity Free Riding loop B2and the Content Free Riding loop B3 respectively. Another negative externalityis linked to the traffic volume: the greater the network usage, the more trafficpasses through the nodes, the worse the network performance becomes. This isshown as the negative Traffic loop B1. The traffic problem has a tendency toescalate (see average traffic in Figure 11b) because of the simple reinforcingloop R3: members tend to resubmit their queries a few times if earlier attemptswere unsuccessful (see probability of unsuccessful download in Figure 11b)and the P2P software resends request packages after the time outs due toincreased latency (see latency Figure 11b). The overall dissatisfaction with thenetwork (Figure 11c) lowers the adoption rate (Figure 11d) and increases the

252 System Dynamics Review Volume 20 Number 3 Fall 2004
Fig. 12. Major
feedbacks of a
peer-to-peer network
departure rate. Feedback effects are strengthened as a result of the positivemedia exposure and reputation perceived by nonusers.
The robustness of the feedback structure outlined above has been confirmedin a number of natural experiments. When Napster’s future became legallyquestioned, many of its users switched to Gnutella, causing what was termedthe “Napster Flood” in July/August 2000 (Ritter 2001). A similar event oc-curred in March 2002 when Morpheus temporarily shut down its networkand scores of stranded Morpheus users rushed to competing networks, suchas KaZaA and Gnutella (PR Newswire 2002; Rincon 2002). In each case, suddensurges in usage led to poor network performance. To simulate this scenario, weused the base model and parameter values in Table 1, and interjected 350,000new adopters at time 540. Actual data for the boom of March 2002 is comparedto the simulation in Figure 13. A substantial initial increase in membershipbrought the problem of lower average content and bandwidth contributionsdue to free loading. Resource inadequacy ballooned the latency and loweredthe probability of successful downloads, which reduced network attractive-ness. The drop in network performance eventually eroded the earlier member-ship gain.
Experiments
An important lesson from the limits to growth archetype is that additionalgrowth can be achieved not only by reinforcing positive loops, but also by

Oleg V. Pavlov and Khalid Saeed: Analysis of Peer-to-Peer Technology 253
Fig. 13. A simulated
membership ‘flood.”
Source for the actualdata for the period of
1 February 2002 to
20 April 2003: http://www.limewire.com
weakening the force of the secondary limiting effects (Senge 1990). This sec-tion explores the impact of strategies that are aimed at leveraging the balancingloops of a peer-to-peer system. We begin by extending the base run through theperiod 3000 without any changes to the model or parameter values.
Dynamics in the long run
In the absence of external shocks, such as a sudden influx of users, the member-ship converges to a steady state (Figure 14a). Attractiveness is determined bythree factors: content attractiveness, latency acceptance, and the probabilityof a successful download (Eqs 4, 19, 31, and 33). Variations in these threeingredients of attractiveness (Figure 14b) are due to the changes in resourceadequacy as determined by the shared resources (Figure 14c) and the trafficvolume (Figure 14d). The stock of shared content reaches some steady value

254 System Dynamics Review Volume 20 Number 3 Fall 2004
Fig. 14. Long run dynamics

Oleg V. Pavlov and Khalid Saeed: Analysis of Peer-to-Peer Technology 255
when network size stabilizes. On the other hand, the stock of bandwidth iscontinuously growing because with the passage of time a greater fraction ofusers upgrade to faster connections. Under the assumption of invariant indi-vidual demand, bandwidth abundance leads to a lower bandwidth utilizationrate (Figure 14e), which allows good performance in terms of latency anddownload successes. In the later stages of the simulation, bandwidth abund-ance means that capacity is no longer a limiting factor; it is the file selectionthat limits further growth (see Figure 14b). Figure 14f shows the easy ridingindexes, which track the free loading problem with respect to content andcapacity provision. The index is defined as a fraction of private resources thatare made available to the public (Cornes and Sandler 1984). The two indexesfor the content and bandwidth respectively are
εC
C
c U
max=
⋅(36)
εB
t
B
b U
=
⋅
Here C and B are shared content and bandwidth, cmax is the maximum personalcontribution, bt is the typical bandwidth of a node, and U is the current net-work membership. Higher index values indicate a lesser free riding problem.
Reducing overhead traffic
Peer-to-peer networks generate and route a significant amount of traffic. Astudy found that around 60 per cent of the Internet traffic at Cornell Universitydorms was generated by three popular peer-to-peer applications: KaZaA,Morpheus, and Gnutella. The study was performed for the period October–December 2001 (Cornell 2003). A big portion of the P2P traffic, as much as63 per cent of the Gnutella traffic (Zeinalipour-Yazti and Folias 2002), consistsof maintenance messages sent by peers to establish and keep up connectionswith other nodes. The main reasons for the voluminous overhead are thehighly dynamic nature of the virtual P2P topology ( Jovanovic et al. 2001),which requires the nodes to continuously update connections, and the in-efficiencies of P2P protocols (Bolcer 2000). The reduction of overhead trafficis currently a topic of active research in computer science (e.g. Ripeanu et al.2002; Yang and Garcia-Molina 2002b).
Lower overhead traffic will abate the balancing force of the Traffic loop B1in Figure 12. To test this scenario, we lower the base traffic per download inthe Traffic sector (Figure 7) by 50 per cent at time 352. After the policy is im-plemented, the simulation is continued until the time 3000, the same durationas in the earlier long run experiment. Results are presented in Figure 15. Thedrop in traffic boosts network performance in terms of the higher probability ofa successful download and lower latency (Figure 15a). Better performance

256 System Dynamics Review Volume 20 Number 3 Fall 2004
Fig. 15. Reducing traffic overheard
translates into faster network growth than in the base experiment (Figure 15b).The network response is consistent with the limits to growth scenario (Senge1990): weakening a balancing loop encourages more growth.
Reducing one limiting effect may, however, strengthen another negativeforce, which is true for the majority of limits to growth structures (Senge 1990,p. 102). Brisk growth is accompanied by the exacerbation of the free loadingproblem acting through loops B2 and B3. The stronger balancing effect due tothe free riding is documented as a drop of the easy riding indexes for content(Figure 15c) and bandwidth (Figure 15d).
Traffic reduction does not have a long-term impact: the network stillconverges to the same long-term steady state as for the base run (Figure 15b).In the base case, bandwidth growth (Figure 14c) gradually leads to lowerutilization rates (Figure 14e) and a weaker limiting Traffic loop B1 (Figure 12).In other words, the intrinsic increase in shared bandwidth has the same effect

Oleg V. Pavlov and Khalid Saeed: Analysis of Peer-to-Peer Technology 257
on the balancing loop B1 as the reduction in traffic per download. Thissuggests that active efforts to curb traffic volume may not be effective in thelong-term.
Improving resource sharing
Recognizing the limiting influence of free riding on peer-to-peer networks,distributors of P2P software attempted educational and technical solutions tothe problem. For example, LimeWire, Inc. has been informing its softwareadopters through the Good Citizen Tips campaign (LimeWire 2003) about thepotluck nature of the Gnutella file-sharing network. Because moral argumentsare not very effective in eliminating the free-riding problem (Park 2000), soft-ware designers have been also busy incorporating features that marginalize theimpact of slow and non-sharing nodes. The software may follow strict prefer-ential attachment rules: connections to users sharing more files are preferredand connections to a node are dropped if the node cannot handle the traffic.Uploads may be also forbidden for non-sharing browser-based nodes, for ex-ample originated from http://gnutella.asiayeah.com or gnute.com.
GREATER CONTENT CONTRIBUTION. Reducing free riding with respect to file shar-ing reduces the limiting effect of the Content Free Riding loop B3 (Figure 12).Figure 16 presents results from three experiments in which the content contri-bution fraction was adjusted upwards by 10, 15, and 20 per cent over the levelstypical for a given network size starting at t = 352. The greater contributionpushed system boundaries: membership grew in all cases (Figure 16a). Moreusers, however, implied more traffic (Figure 16b), which led to networkperformance degradation (Figure 16c). A contribution improvement of 20 percent boosted network attractiveness sufficiently high (Figure 16d) to breakaway from the limiting effects simulated by the model, which, however, didnot include a constraint imposed by the maximum number of Internet userspotentially interested in the P2P technology.
GREATER BANDWIDTH CONTRIBUTION. Early versions of peer-to-peer algorithms didnot discriminate against slow peers (Bolcer 2000). But modern P2P softwareactively manages network links, disconnecting from nodes that do not ad-equately contribute bandwidth to the network (Kan 2001). This experimenttests the effect such measures may have on the network. The bandwidthcontribution fraction has been improved by 20, 40, and 60 per cent at time 352.This is equivalent to weakening the importance of the Capacity Free Ridingloop B2 (Figure 12). The results are similar to the results from an earlierexperiment that lowered overhead traffic. As Figure 17(a) shows there is only ashort run gain without any long run advantage. Better bandwidth contributiondoes not change the steady state because in the long run, loop B2 is not limitingdue to the natural growth of the bandwidth of an average node. Even though

258 System Dynamics Review Volume 20 Number 3 Fall 2004
Fig. 16. Improvements to content contribution
Fig. 17. Bandwidth experiment

Oleg V. Pavlov and Khalid Saeed: Analysis of Peer-to-Peer Technology 259
utilization is improved in the short run (Figure 17b), in the long run the changeis not significant to alter system’s behavior.
Discussion
The operation of a peer-to-peer (P2P) network depends on the privateprovision of common resources, which is plagued by free riding. Free ridingtypically worsens as the number of participants in an activity rises. The inter-play between network usage, contribution of shared resources, and networkperformance forms reinforcing loops that drive network growth until the limit-ing feedbacks due to resource inadequacy become important and reverse theupward trend. To explain the dynamics we draw on the limits-to-growtharchetype and build a system dynamics model of an online file-sharing net-work. Our model integrates findings from measurement studies, technologicalfactors, and elements of the network and economic theories. It replicates thebehavior observed in real P2P networks under normal and extreme conditions.In the absence of outside disturbances, the base system displays dampeningoscillations in the long run. The fluctuations occur due to time delays withinthe adaptive reputation mechanisms.
Our work tests three strategies for boosting the growth of P2P networks.They are:
• reduce overhead traffic;• improve content contribution;• improve bandwidth contribution.
Table 2 compares the effectiveness of the three policies in terms of themembership elasticity. Membership elasticity is the percentage change inusage over the percentage change in the parameter. To allow enough timefor the system to respond to the policy, the short-run measurements are madeτn periods after a policy is implemented, which is the longest decision delaywithin the model. The long-run figures are from the end of the simulations att = 3000.
The highly dynamic nature of peer-to-peer networks and the inefficien-cies of algorithms result in voluminous maintenance traffic. The first policy(Policy OT in Table 2) reduces the traffic through software improvements.Doing this leads to better network performance and faster growth in the shortrun (see positive short-term elasticity in Table 2), but this in turn intensifiesthe limiting free riding tendencies. In the long run, the strategy produces a verylimited improvement (see the low long-term elasticity in Table 2) because theintrinsic growth of available bandwidth—users upgrade from dial-up to DSLconnections—weakens the negative effect of the network traffic even in theabsence of the algorithmic improvements. Analogous results are achieved

260 System Dynamics Review Volume 20 Number 3 Fall 2004
Policy Parameter Short term effect Long term effect
change (t = 452) (t = 3000)
Network users Elasticity Network users Elasticity
Base case 20,558.5 32,395.8
Overhead traffic (OT) tb −50% 23,291.4 0.2659 32,421.7 0.0016
File contribution (FC) +10% 21,867.5 0.6367 39,506.8 2.195
κC +15% 22,557.7 0.6483 43,880.7 2.3635+20% 23,268.9 0.6592 124,682.0 14.244
Bandwidth +20% 21,270.3 0.1731 32,410.4 0.0023contribution (BC) κB +40% 21,769.3 0.1472 32,413.2 0.0013
+60% 22,125 0.127 32,416.4 0.0011
Table 2. Summary of
policy experiments
when bandwidth contributions are raised (Policy BC in Table 2). Policy BCachieves some short-term gains, which are eroded in the long run: the long-term elasticity is lower than the short-term elasticity. Again, the policy fails toproduce a long-term improvement because it targets a feedback effect thatwanes in importance over time. Experiments demonstrate that the policy thattargets content free riders (Policy FC in Table 2) is the most effective one in theshort and long runs: membership elasticities for the policy are the highest.
The experiments underscore two lessons from the limits to growth arche-type: additional growth can be achieved by weakening the balancing forces ofsecondary feedbacks, and removing one limiting process may encourage morevigorous resistance from other constraining sources (Senge 1990). The com-parison of simulation results also suggests that, to have a strong long-termeffect, a policy must target a feedback that remains influential over time.
References
Adar E, Huberman BA. 2000. Free riding on Gnutella. First Monday 5(10). Availableonline at http://www.firstmonday.dk/issues/issue5_10/adar
Asvanund A, Krishnan R, Clay K, Smith MD. 2002. An empirical analysis of networkexternalities in peer-to-peer music-sharing networks. Proceedings of the Inter-national Conference on Information Systems 2002 (ICIS 2002). Available at: http://aisel.isworld.org/Proceedings/ICIS/2002/home.asp [22 August 2004].
Bhagwan R, Savage S, Voelker GM. 2003. Understanding availability. Proceedings ofthe 2nd International Workshop on Peer-to-Peer Systems (IPTPS ’03), 20–21 February2003, Claremont Hotel, Berkeley, CA, USA.
Bolcer GA. 2000. Bandwidth barriers to Gnutella network scalability. FoRKed. Availableat http://xent.com/FoRK-archive/sept00/0657.html [22 August 2004].

Oleg V. Pavlov and Khalid Saeed: Analysis of Peer-to-Peer Technology 261
CNN Money. 2002. Napster sold to Roxio for $5.3 million. CNN. Available at http://money.cnn.com/2002/11/27/news/deals/napster/index.htm [22 August 2004].
Cornell 2003. Available at http://www.cdt.cornell.edu/computers/students/bandwidth/charts.htm.
Cornes R, Sandler T. 1984. Easy riders, joint production, and public goods. EconomicJournal 94: 580–598.
Dutta A, Hsu V. 2001. Cellular network design: site selection and frequency planning.Annals of Operations Research 106(1): 287–306.
Elkin N. 2002. The future of the P2P transaction market. Available athttp://www.entrepreneur.com/Your_Business/YB.SegArticle/φ,4621,296007,00.html[22 August 2004].
Gaube T. 2001. Group size and free riding when private and public goods are grosssubstitutes. Economics Letters 70(1): 127–132.
Golle P, Leyton-Brown K, Mironov I, Lillibridge M. 2001. Incentives for sharing in peer-to-peer networks. Proceedings of the 3rd ACM conference on Electronic Commerce,2001, Tampa, Florida, USA. ACM Press: New York.
Isaac RM, Walker JM. 1988. Group size effects in public goods provision: the volunt-ary contributions mechanism. The Quarterly Journal of Economics 103: 180–199.
Jovanovic MA, Annexstein FS, Berman KA. 2001. Scalability issues in large peer-to-peer networks—a case study of Gnutella. Available at http://www.ececs.uc.edu/~mjovanov/Research/paper.html.
Kabanov M. 2001. In defence of Gnutella. Editor’s Column. At http://gnutellameter.com[26 March 2003].
Kan G. 2001. Gnutella. In Peer-to-Peer: Harnessing the Benefits of a Disruptive Tech-nology, Oram A, ed. O’Reilly: Cambridge, MA.
Kitz D, Essien K. 2002. Analysis of a campus-wide wireless network. MOBICOM ’02,23–28 September 2002, Atlanta, Georgia, USA.
Lee J. 2003. An end-user perspective on file-sharing systems. Communications of theACM 46(2): 49–53.
Lenhart A, Horrigan J, Rainie L, Allen K, Boyce A, Madden M, O’Grady E.2003. The Ever-Shifting Internet Population: A New Look at Internet Access andthe Digital Divide. The Pew Internet & American Life Project. Available athttp://www.pewinternet.org/pdfs/PIP_Shifting_Net_Pop_Report.pdf [22 August2004].
Leuf B. 2002. Peer to Peer: Collaboration and Sharing over the Internet. Addison-Wesley: Boston, MA.
LimeWire 2003. Limewire Inc. Available at http://www.limewire.com/index.jsp/net_improvements [1 April 2003].
Maron MJ, Lopez RJ. 1991. Numerical Analysis: A Practical Approach. Wadsworth:Belmont, CA.
Marwell G, Ames RE. 1979. Experiments on the provision of public goods. I. Resources,interest, group size, and the free-rider problem. American Journal of Sociology 84(6):1335–1360.
Moxnes E. 1998. Not only the tragedy of the commons: misperceptions of bioeconomics.Management Science 44(9): 1234–1248.
Non SG. 2000. Does the peer-to-peer model make business sense? ZDNet UK. Availableat http://news.zdnet.co.uk [11 February 2002].

262 System Dynamics Review Volume 20 Number 3 Fall 2004
Park ES. 2000. Warm-glow versus cold-prickle: a further experimental study of framingeffects on free-riding. Journal of Economic Behavior and Organization 43(4): 405–421.
Pecar JA, Garbin DA. 2000. The New McGraw-Hill Telecom Factbook. McGraw-Hill:New York.
PR Newswire. 2002. Limewire Sees Usage Surge as Morpheus Falters. [March 6].Available through LexisNexis [22 August 2004].
Rincon P. 2002. Battle of file-sharing services heats up. Available at http://www.cnn.com/2002/TECH/internet/03/06/p2p.battle.idg/index.html [22 August 2004].
Ripeanu M, Foster I, Iamnitchi A. 2002. Mapping the Gnutella network. IEEE InternetComputing 6(1): 50–57.
Ritter J. 2001. Why Gnutella can’t scale. no, really. Available at http://www.darkridge.com/~jpr5/doc/gnutella.html [6 January 2002].
Saroiu S, Gummadi PK, Gribble SD. 2001. A measurement study of peer-to-peer filesharing systems. University of Washington Department of Computer Science andEngineering Technical Report UW-CSE, July.
Senge PM. 1990. The Fifth Discipline: The Art and Practice of the Learning Organiza-tion. Doubleday/Currency: New York.
Shirky C. 2000. In praise of freeloaders. Available at http://www.openp2p.com/pub/a/p2p/2000/12/01/shirky_freeloading.html [22 August 2004].
Sterman JD. 2000. Business Dynamics. McGraw-Hill: New York.Tanenbaum AS. 2003. Computer Networks. Prentice Hall: Upper Saddle River, NJ.Warren K. 2003. Strategy Dynamics Masterclass. International System Dynamics
Conference, New York City, NY, July 2003.Yang B, Garcia-Molina H. 2002a. Designing a Super-Peer Network. Mimeo, Computer
Science Department, Stanford University.—— 2002b. Efficient search in peer-to-peer networks. Mimeo, Computer Science
Department, Stanford University.Zeinalipour-Yazti D, Folias T. 2002. A quantitative analysis of the Gnutella network
traffic. Available at http://www.cs.ucr.edu/%7Ecsyiazti/courses/cs204/project/gnuDC.pdf [22 August 2004].