Embed Size (px)
Citation preview

A Quantitative Analysis of the Distribution of Ganglion Cells in the Cat's Retina
JONATHAN STONE Braiit Research Unit , Drpurtnzc7zt of Phyaiology, Universi ty of Sydney, Australia
ABSTRACT Ganglion cell density maps of the cat's retina have been constructed from whole-mounts of the retina stained with mcthylene blue. The main features of the maps are first, a great increase in density at the specialized central area, and second, a horizontally orientated "arm" of relatively high density extending from the central area into nasal and temporal retinae. The variation of ganglion cell size with density has been examined in the same preparations. This analysis showed that the cells are smallest at the central area, and increase in size as ganglion cell density de- creases. Whole-mount preparations have also been made of the monkey's retina, al- lowing comparison between the central areas of cat and monkey retinae.
Recent electrophysiological studies of the activity of single cells in the visual centers of the cat (Kuffler, '53; Barlow, Fitzhugh and Kuffler, '57a, b; Brown and Wiesel, '59; Hubel and Wiesel, '59, '60; Wiesel, ' G O ) and monkey (Hubel and Wiesel, '60) have shown the need for more detailed anatomical knowledge of these centers.
Early investigators of the comparative anatomy of the retina (Miiller, 1861; Ganser, 1882; Chievitz, 1889, 1891; Dogiel, 1891, 1893, 1894; Slonaker, 1897; Ziirn, ' 02 ) described the general structure of the cell layers of the retina, and the structural specialization of certain parts of the retina, such as the fovea centralis in the monkey and the area centralis in the cat. Later workers (Cajal, 1893, '11; Polyak, '41), using analytical techniques of staining, de- scribed the synaptic connections of retinal cells, and Polyak described the specialized intraretinal synaptic arrangement of the monkey's fovea. The early studies of the structure of the retina established, in addi- tion, that the ganglion cell is the cell body of the optic nerve fiber. In functional terms therefore, the ganglion cell is the neuron in which the output of the retina is formed and ganglion cell density can be regarded as the number of paths of output per unit area of retina (Cajal, '1 1 ; Lashley, '32; Weymouth, '58).
Quantitative observations of the distribu- tion of ganglion cells in the retina, and
J. COMP. NEUR., 124: 337-352
the ratio between ganglion, bipolar and receptor cells have been reported by Chie- vitz (1889) for a number of vertebrates, including man, cat and reptiles, Lashley ('32) for the rat, Vilter ('49) for man, Wey- mouth ('58) for the monkey, Oehme ('61) for the owl, Jacobson ('62) for the frog, and van Buren ('63) for the macaque monkey. chimpanzee and man. Only Lashley and van Buren were able to make estimates of ganglion cell density, Lashley from serial normal sections of the retina, van Buren from tangential sections. There are, however, considerable difficulties in making these estimations (Agduhr, '41 ; Abercrombic, '46; Marrable, '62).
In this study, a whole-mount prepara- tion of the cat's retina was developed which allowed direct measurement of ganglion cell density over the whole of the retina. From these measurements it has been pos- sible to construct ganglion cell density maps and the centro-peripheral ganglion cell density gradient of the cat's retina. In the same preparations the variation of ganglion cell size with density has been examined. Whole-mount preparations of the monkey's retina have also been made using the same technique. It has not been possible to quantitate the concentration of ganglion cells in the region of the fovea, but the preparations have provided an in- teresting comparison with the central area of the cat's retina.
337

7 6 0
8 7 6 5
I I 7 0
Fig. 1 ( a ) Map of the central area of a left retina showing the blood vessels and cell counts. The arrow points to the optic disc.
1 : : : : i 0 & O M
Fig. 1 ( b ) Map of the same central area as in ( a ) with the counts replaced by isodensity lines. For all maps (figs. 1 and 2 ) , the isodensity lines are labeled as follows: a - 6,000/mm2, b - 5,000,’
mm2, c - 4,000/mm2, d - 3,00O/mm2, e - 2,000/mm2, f - l,OOO/mmz, g - 5@0/mm2, h - 250/ mm2, J - 125/mm2.

\
Fig. 1 (c) and ( d ) Maps of the right and left central areas of one animal. The maximum counts in these preparations were 57 and 59 respectively.

340 JONATHAN STONE
METHODS
Preparation of whole-mounts Direct measurement of ganglion cell
density was possible on whole-mounts o l the cat’s retina stained with methylene blue in the following way.
The animal was perfused first with warm (38’C) saline and then with 10% Iormol-saline. The eyeball was quickly enucleated and cleaned of attached tissue. The anterior portion, including lens, cornea and iris, was cut away and discarded. The vitreous humour was removed from the posterior portion which was then placed in 10% formol-saline for 15 minutes. The posterior portion was then removed to fresh saline solution and cut into appropri- ate pieces, according to the area of retina required for study. The corresponding pieces of retina were dissected off using either small pads of cotton wool held in forceps, or the tip of a scalpel blade. Be- fore a whole retina was mounted flat it was cut into a number of pieces. Each piece of retina was laid, fiber layer uppermost, on a freshly gelatiniLed slide and gently pressed flat with moist filter paper. The preparation was then placed in hot (60°C) formalin vapour for 30 minutes, so that the retina became firmly adherent to the slide and was, in addition, fully fixed. The preparation was then washed with saline and covered for 15 to 20 minutes with a freshly prepared, filtered, 1,’2000 solution of methylene blue (G. T. Gurr, London). Staining was easily monitored under a microscope. When the depth of staining was satisfactory, excess stain was washed off and the stain was fixed by covering the preparation for five minutes with 5% ammonium molybdate solution containing a few crystals of thymol per 100 mls. Excess ammonium molybdate was washed off and the preparation was mounted in freshly prepared Apathy’s gum syrup. In this medium the methylene blue may slowly fade. The preparations could be made quite permanent by dehydration in ascending concentrations of alcohol (10, 30, 50, 70, 90 and 100% solutions for one and one-half minutes each), washing briefly in xylol, and mounting in Depex. If the retina is firmly stuck to the slide, no shrinkage of tissue length results, al-
though the individual cells shrink notice- ably. If the retina is loosely adherent con- siderable shrinkage results, up to 20% of length, and dehydration has been avoided wherever possible in the present study.
Whole-mount preparations of the retina of the macaque monkey (weight 7.5-12 lbs) were made using the same technique. It was found necessary to leave the eyes in 10% formol saline for one day before dis- secting. This allows the retina to become tougher and less likely to tear at the fovea where it is mechanically weak.
Shrinkage estimation Except for figures 2 and 3 the quantita-
tive data presented was taken from non- dehydrated preparations, in which shrink- age is presumed negligible. Because of the time necessary to collect the data €or fig- ures 2 and 3 a dehydrated preparation was used. The maximum density in this prep- aration was greater than the mean maxi- mum of five non-dehydrated preparations by a factor of 1.5, indicating a shrinkage of 33% of area, and 19% of length. It was assumed that this was due to shrink- age during dehydration and the density measurements and millimeter scale have been adjusted accordingly.
Counting of ganglion cells in. the cat’s retina
The criteria used for the recognition of ganglion cells are discussed later. In the central area, where density was greater than 2,000 cells/mm*: ganglion cell den- sity was measured on composite photo- graphs of the central area and surrounding retina, containing up to 50 separate photo- graphs at approximately 300 diameters. A Leitz apochromatic 12.5 X objective was used for photography. This had sufficient magnification to pick up cell detail and sufficient depth of focus for the full thick- ness of the ganglion cell layer to be in focus. A grating of squares with sides cor- responding to 0.1 mm and area to 0.01 mm2 was ruled on plastic sheet and laid over the composite picture, and the num- ber of cells in each square was counted. Thus a count of 25 indicates a density of 2,500 cells/mm2. Density maps of the central area were constructed on which the

RETINAL GANGLION CELL DENSITY 34 1
counts, blood vessels and the direction of the optic disc were plotted (fig. l a ) . On these maps isodensity lines were drawn as in figures lb-d. The 3,000 'mm' isoden- sity line, for instance, is a smooth curve drawn to include, as accurately as possible, all areas in which the count was greater, and no areas where the count was less, than 30 cells per square.
The density of ganglion cells in periph- eral areas of retina was measured under a microscope, using a calibrated eyepiece graticle. Density was measured in 0.5 mm X 0.5 mm squares covering the whole of a retina mounted in three pieces (fig. 2 ) , the cells in one quarter of each square being counted. Blood vessel landmarks were used to check the accuracy of stage movements. Isodensity lines were drawn, giving the map shown in figure 2. The ganglion cell density gradient shown in figure 3 was constructed from the counts in the map of figure 2.
Vakkur, Bishop and Kozak ('63) have shown that the line joining the optic disc and central area makes an angle of ap- proximately 22' with the horizontal when the extraocular muscles have been para- lysed. The maps presented in figures 1 and 2 have been aligned using this result.
Cell size measurement Ganglion cell diameter was measured oil
X 480 magnification microphotographs of whole-mount preparations of one retina. Samples of 350-400 cells were measured in seven areas of retina chosen such that their ganglion cell density fell in selected ranges. The ranges of density chosen were 0-250/mm2, 250-500/mmz, 500-750/ mm2, 750-1,000/mm2, 1-2,000/mmz, 2- 4,000/mm2 and 4-6,000/mm2. The cells were classed in five groups of arbitrarily chosen diameter range, viz. 8-10 LI, 11- 15 1-1. 16-20 1-1, 21-25 u and > 25 diam- eter. Generally the sample chosen from an
.-______- ---- y-1 - 0 Snm
Fig. 2 Map of the whole of a left retina mounted in three pieces. The filled circle shows the position of the optic disc. The isodensity lines are labeled as in figure 1. Near the optic disc the ganglion cell layer was obscured by the thick fiber layer (see fig. 8) and density could not be measured. The course of the isodensity lines has been estimated over this area, where they are represented by fine dotted lines.

342 JONATHAN STONE
area of given density range included cells from all densities within that range. How- ever: no systematic attempt was made to selected equal numbers of cells from each subdivision of the range. In figures 4 and 5, the median values of the density ranges have been used to fix the position of points dong the abscissa.
"'1 700 I
RESULTS
Appearance of the gunglion cell layer in the cat's retina
Photomicrographs of areas of high and low ganglion cell density are shown in figures 6 and 7. In figure 6 the deeply stained cells of various sizes labeled g are
- : TZnpor.3 ..
= * . . . . ,
2 m m I E Ib I4 12 10 8 b 4 2 0 2 4 b 0 10 l 2 M r -
do' 8;' ;O' do. ;Om $' 33' 20' I@ be 10' 20" 30' 400 So"
DISTANCE FROM CENTRAL A A t A
Fig. 3 Centro-peripheral ganglion cell density gradient of the cat's retina constructed from the data of the map in figure 2. This is the gradient along the horizontal axis of the retina through the central area. The gap in the curve betwcen 2 m m and 6 m m nasal to the cei-tral area corresponds to the region near the optic disc wherc ganglion cell density could not be measured.
bo 1 I.. -
CELLS I MM*
Fig. 4 Graph showing the percentage frequency of the five cell diameter groups at A 8-10 p diameter, A 11-15 /A diameter, 0 16-20 p diameter, (> 21-25 different densities.
p diameter, x > 25 ,u diameter.

2-1
1500 1 i
RETINAL GANGLAON C F L L D E N S I ~ Y
. . . .
. .
343
. . 0 . . -J _1
Y 01 ' ' ' ' 7 ' ' ' ' ' ' ' *
. . . . I .
0' I I I
>25y dlameter
5 0
m- I DISTANCE FROM T M CENTRAL P E A Tempoml
Fig. 5 Graph showing the density of different cell size groups along the horizontal axis through the central area, constructed from the data of figures 3 and 4.
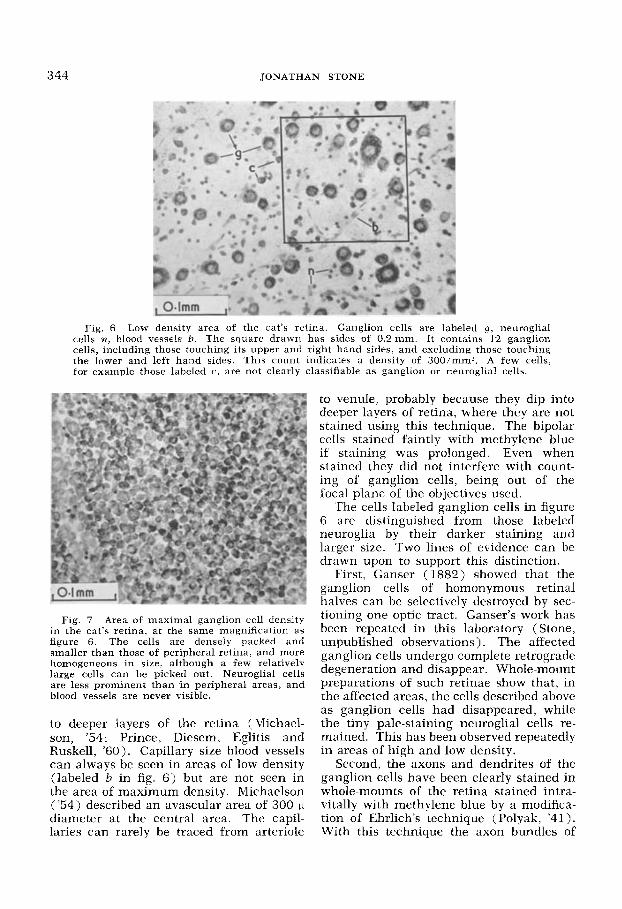
ganglion cells. They are well separated. apparently not in any pattern. Figure 7 shows the cells at the area of maximum density. The ganglion cells are small, densely packed and fairly homogeneous in size. The tiny pale-staining cells labeled n in figure 6 are neuroglial cells. They are also present where ganglion cell density is high, but are less prominent. In low power photographs of the central area and surrounding retina (fig. 8 ) a class of giant dark-staining cells appears to be scattered among more numerous paler-staining small ganglion cells, This was first noted
by Bishop, KoLak and Vakkur ('62) in methylene blue stained whole-mounts. These giant cells are prominent in periph- eral and pericentral areas, but are not present in the area of maximum density.
The blood vessel pattern of the retina is clearly seen in whole-mount preparations, and the convergence of blood vessels on the central area noted by earlier workers (Michaelson, '54; Wiesel, '60; Bishop, Kozak and Vakkur. '62) is clear in figure 8. The blood vessels forming this conver- gence disappear abruptly as they approach the central area, presumably passing
344 JONATHAN STONE
Fig. 6 Low density area of the cat's retina. Ganglion cells are labeled g , neuroglial cells n, blood vessels 0. The square drawn has sidcs of 0.2 mm. It contains 12 ganglion cells, including those touching its upper and right hand sides, and excluding those touching the lower and left hand sides. This count indicates a density of 300imm'. A few cells: for cxample those laheled c, are not clearly classifiable as ganglion or neuroglial cells.
Fig. 7 Area of maximal ganglion cell density in the cat's retina, at the same magnification as figure 6. The cells are densely packed and smaller than those of peripheral retina, and more homogeneous in size, although a few relatively large cells can be picked out. Neuroglial cells are less prominent than in peripheral areas, and blood vessels are never visible.
to deeper layers of the retina (Michael- son, '54; Prince, Diesem, Eglitis and Ruskell, '60). Capillary size blood vessels can always be seen in areas of low density (labeled b in fig. 6 ) but are not seen in the area of maximum density. hlichaelson ('54) described an avascular area of 300 11 diameter at the central area. The capil- laries can rarely be traced from arteriole
to venule, probably because they dip into deeper layers of retina, where they are not stained using this technique. The bipolar cells stained faintly with methylene blue if staining was prolonged. Even when stained they did not interfere with count- ing of' ganglion cells, being out of the focal plane of the objectives used.
The cells labeled ganglion cells in figure 6 are distinguished from those labeled rieuroglia by their darker staining and larger size. Two lines of evidence can be drawn upon to support this distinction.
First, Ganser (1882) showed that the ganglion cells of homonymous retinal halves can be selectively destroyed by sec- tioning one optic tract. Gamer's work has been repeated in this laboratory (Stone, unpublished observations). The affected ganglion cells undergo complete retrograde degeneration and disappear. Whole-mount preparations of such retinae show that, in the affected areas, the cells described above as ganglion cells had disappeared, while the tiny pale-staining neuroglial cells re- mained. This has been observed repeatedly in areas of high and low density.
Second, the axons and dendrites of the ganglion cells have been clearly stained in whole-mounts of the retina stained intra- vitally with methylene blue by a modifica- tion of Ehrlich's technique ( Polyak, '41). With this technique the axon bundles of

KETlNAL GANGLION CELL DENSITY 345
Fig. 8 Central part of' a right retina. The upper and lower borders of the picture are approximately horizontal on the preparation. The optic disc is in the lower right hand corner of thc picture. The ganglion cell layer immediately around the disc is obscured by the thick fiber layer in this area. The central area is made prominent by the increased density of cells and the convergence of blood vessels on it. Within the area of maximum density there are few large, dark staining cells, but immediately outside this area the large cells are very prominent. This is part of a dehydrated preparation of a ten-week-old kitten, and the millimeter scale is only approximate. However except in dimensions the prepara- tion is indistinguishable from a normal adult. The preparation was torn temporal to the central area while being flattened.
the fiber layer stain deeply and the in- dividual axons of ganglion cells can often be seen where the overlying bundles are sparse (fig. 9a). This is in contrast with the supravital staining technique described above. Here the fiber layer does not stain but becomes cloudy, and where the layer is thick near the optic disc it is almost opaque (fig. 8). This cloudiness is con- siderably reduced by dehydration. The ganglion cells do not stain evenly in in- travital preparations, many cells being stained only in outline while nearby cells stain darkly. In selected areas of these preparations the dendritic processes of the ganglion cells may be clearly stained (fig. 9b). Neither axons nor dendrites have been observed on the cells called neuroglia.
Although the great majority of cells can be clearly classified as neuroglia or gan- glion cells by using the above criteria, a perrentage, such as those labeled c in fig- ure 6, are intermediate in size and depth of staining and cannot be clearly classified. The corresponding uncertainty which enters into the density estimation is diffi- cult to quantitate, but is probably of the order of 2 10% .
The appeararice of the qanglion cell layer in the monkey's retina
The foveal area of a methylene blue stained whole-mount is shown in figure 10. The ganglion cells form a very consider- able pile around the foveola, which is clear of all but a scattering of cells. The cells of this pile are small, 8-10 in diameter. and quite homogeneous. Each has a pale, circular nucleus surrounded by a crescent of dark-staining cytoplasm. This pile of ganglion cells is up to seven layers deep (Polyak, '41; van Buren, '63) which makes it impracticable to measure their density on whole-mount preparations. It is clear, howcver, that these cells are very numer- ous and that there are far more ganglion cells serving the central square millimeter of retina in the monkey than in the cat. Van Buren ('63) estimated that their den- sity in man reaches 800 100 uz (80,000/ mm') using tangential sections of the fovea.
The ganglion cells lie in double or mul- tiple layers up to 7.0 mm from the edge of the foveola (van Buren, '63). The cells increase slightly in size as density de- creases. and in peripheral areas the cells

346 JONATHAN STONE
Fig. 9 Areas of the ganglion cell and fiber layers of the retina stained intravitally with inethylene blue.
( a ) Shows an area of low density with fiber bundles, ganglion cells and small blood vessels clearly stained. The axons of a few cells can he traced from the cell body to a nearby fiber bundle.
( b ) Shows the wide dendritic spread of a single giant ganglion cell in peripheral retina
are quite scattered and fairly large, up to 20 1.1 in diameter. No cells comparable to the giant cells of the cat's retina are ap- parent, and the gangIion cells appear gen- erally more homogeneous in size and stain- ing than in the cat.
The foveola in figure 10 is a vertically elongated oval. 0.6 mm in diameter ver- tically, and 0.4 mm horizontally. The pos- terior nodal distance of the eye was 11 .O
mm (G. J . Vakkur, personal communica- tion), compared with 12.4 mm for the cat (Vakkur and Bishop, '63). From this fig- ure the vertical diameter of the foveola subtended 3.1" and the horizontal diam- eter 2.1". In a second animal the right and left foveolae were much smaller but were identical in size and shape, being 0.35 mm (1.8") in vertical diameter and 0.3 mm (1.6') in horizontal diameter.

R E T I N A L G A N G L I O N C E L L DENSITY 347
Fig. 10 ’The fovcal area of a inethylene blue stained whole-mount of a monkey’s retina. ( a ) Is a low power photomicrograph of the Pcvea. The ganglion cells form a very considerable
pile around the foveola, a few remaining scattercd over it. ( b ) Shows the edge of the foveola at higher power. The ganglion cells are small, 8-10~ in diam-
eter, quite homogeneous in size and very numerous. Each has a circular. pale staining nucleus, surrounded by a crescent of dark-staining cytoplasm.
Gaiiglion cell density m a p s of the cut’s retina
Density maps of the central areas of three retinae are presented in figure 1. Figure l a shows the mosaic of counts from which the map in figure l b was con- structed. Figures l c and Id are the maps of right and left retinae of one animal. Each central area has a small area of maximum density, from which density falls off rapidly in all directions, aiid which is situated approximately in the center o i a radial arrangement of blood vessels. The isodensity lines generally form horizontally elongated ellipsoids which extend further nasally from the point of maximum den- sity than temporally. The maximum count varied in five retinae from 54 to 62 cells per square. The blood vessels form a char- acteristic convergent pattern around the central area, but the details of this pattern vary markedly between animals, and be- tween the two eyes of one animal Most of the vessels forming this pattern disappear
between the 3.000 mm’ and 4,000’mm’ isodensity lines, but in each map one or two vessels cross the 4,000/mm2 line. Table 1 gives some quantitative details taken from the maps of figure 1 which give some indication of the variation in shape and extent of the central area. For the purposes of this table two alternative definitions of the central area have been considered. In the first instance i t has been defined as the area in which density is greater than 3,000 mm’, in the second as the area in which density is greater than 5,000 mm‘.
A ganglion cell density map of the whole of a left retina is presented in figure 2. The map was constructed from a total of approximately 2,500 counts of 31,500 cells. Estimated from these counts the total num- ber of ganglion cells in the retina is ap- proximately 90,000. This figure is within the range of estimates of the number of fibers in the cat’s optic nerve (Bishop, Jeremy and Lance, ’53 : 120,000; Breusch

348 JONATHAN STONE
TABLE 1
Area of density > 3,000imm2 -~
Map
Figure l b Area 0.9 mm2 Number of cells 3710 Horizontal axis 1.4 mm (6.4") Vertical axis 1.0 mm (4.6")
Number of cclls 3580 Horizontal axis 1.6 mm (7.4") Vertical axis 1.0 rnm (4.6")
Number of cells 3249 IIorizontal axis 1.3 mm (6.0") Vertical axis 0.9 mm (4.1")
Figure l c Area 0.92 mm2
Figure Id Area 0.92 mm2
_ - ~~
Area of density > 5,000,mm2
Area 0.22 mmz Number of cells 1150 Horizontal axis 0.7 mm (3.2') Vertical axis 0.5 mm (2.3')
Area 0.16 mm2 Number of cells 830 Horizontal axis 0.5 mm (2.3 ' ) Vertical axis 0.4mm (1.9")
0.075 mm2 Area Number of cells 397 Horizontal axis 0.3 mm (1.4" ) Vertical axis 0.3 mm ( 1 . 4 " )
Measurements taken from the maps presented in figure 1, showing the variations in the shape and ex- tent of the central area. For the purpose of this analysis two alternative definitions of the central area have been used. In the first instance the central area has been defined as the area in which density is greater than 3,00O/mmz, in the second as the area in which density is greater than 5000/mm2. These areas gen- erally form horizontally elongatcd ovals, whose shape is indicated in the table by 'the length of their horizontal and vertical axes.
and Arey, '42: 119,000; van Crevel and Verhaart, '63: 64,500; Ann Childs, per- sonal communication : 76,000). The most prominent feature of the map is the sharp increase in ganglion cell density at the central area, above and temporal to the optic disc. An "arm" of relatively high ganglion cell density extends approxi- mately horizontally from the central area into nasal and temporal retinae. The area, estimated from figure 2, of retina nasal to the central area is 510 mm', and is larger than the area temporal to the central area, 220 mm2. The total area of the retina is thus approximately 730 mmL. This compares with van Buren's ('63) estimate of 943 mm' for the area of hu- man retina. Estimated from the data of Vakkur and Bishop ('63) for the sche- matic eye of the cat, the area of the cat's retina is 750-800 mm'.
Qualitative observation of the whole- mounts prepared in this study strongly sug- gests that an "arm" of relatively high gan- glion cell density also exists in the mon- key's retina, extending horizontally from the fovea. Indication of this has been noted in the monkey, chimpanzee and hu- man retinae by van Buren ('63), who mapped the areas of retina in which the ganglion cell layer was 5 cells, 4 cells, 3, 2 and 1 cell thick. These areas generally formed horizontally elongated ellipsoids.
Care was taken in dissecting the prep- aration used for figure 2 to remove the retina right up to its edge. This edge is
easily seen after the retina is fixed by for- malin while in situ in the posterior portion of the eyeball. It forms a smooth line which, in the upper half of the eyeball runs approximately parallel to the edge of the tapetum. It runs a wider course than the tapetum, which is therefore totally covered by retina. It runs approximately 1.0 mm temporal to the temporal edge of the tapetum, but is somewhat further, ap- proximately 5.0 mm, nasal to the nasal edge of the tapetum. The inferior edge of the tapetum runs horizontally a little un- der the optic disc (Chievitz, 1889; Camp- bell, '61; Bishop, Kozak and Vakkur, '62) but the edge of the retina runs approxi- mately around the equator of the eyeball, su that the inferior half of the posterior portion of the eyeball is covered by retina lying directly on choroid. There is no ap- parent correlation between the shape of the isodensity lines and the shape of the tapetum.
There are three possible sources of error in the preparation of these maps. First an error of confusion of ganglion and neuro- glial cells must be allowed (see above). Second, where they are densest the gan- glion cells form a partial double layer over a small area of radius 0.5 mm and area approximately 0.8 mm2. This area was described by Ganser (1882) and Chievitz (1889) from sections of the retina. Both described a 3-4 deep hillock of ganglion cells at the central area, but careful in- spection of serial sections of 8 eyes in this

RETINAL GANGLION CELL DENSITY 349
study revealed only a doubling of the gan- glion cell layer. When counting on whole- mount preparations. the deeper cells may be obscured by the more superficial cells, rcducing the counts made in this area. To minimise this error the objective used for photomicrography had sufficient depth of focus for the deeper and more superficial cells to be in focus simultaneously. Thirdly, the flattening of a piece of retina inevitably produces some slight distortions of shape. These are probably quite negli- gible in maps of the central area, which cover only about 6 mm’, but presumably have produced slight distortions in the map presented in figure 2.
One assumption made in the interpreta- tion of the ganglion cell density maps pre- sented is that the ganglion cells are situ- ated immediately vitread from the area of the receptor layer which they serve, ex- cept for slight displacements by large blood vessels. This assumption seems safe for peripheral areas of retina. However, Chie- vitz (1889) produced evidence that the area of ganglion cell concentration is dis- placed towards the optic disc from the area of the receptor layer which it serves. In particular, Chievitz noted that an area of thinning of the outer nuclear layer, which he considered to be an area of receptor specialization, lay slightly temporal to the concentration of ganglion cells. In this study a comparable, slight (approximately 10% ) thinning of the outer nuclear layer was noted in sections of the retina through the central area, but it was situated di- rectly sclerad from the area of ganglion cell concentration. In addition, Ganser (1882) could find no evidence in sections of the retina through the central area of obliquely running fibers in either plexi- form layer, which would allow this dis- placement. Similar sections prepared in this study also showed no evidence of ob- liquely running fibers. Consequently it is felt that the density maps presented re- late ganglion cell density to the underly- ing receptors without serious error.
In an early part of this study ganglion cell density maps of the cat’s retina were prepared from serial horizontal sections of the eye, using a technique of reconstruct- ing the retina similar to that described by van Buren (’63), the criteria used for
recognition of ganglion cells being those of Arey and Gore (’42). The maps showed the main features of the maps made from whole-mounts just described, including the increase in density at the central area and the horimntally orientated “arm” of rela- tively high ganglion cell density in periph- eral retina. In general however density figures were lower than those obtained by direct measurement from whole-mounts, varying from one-fifth of the direct count at the central area to approximately one- half in peripheral areas. The counts made from serial sections were both less direct and less consistent, and it was clear that the accuracy of these maps was very limited.
The cent ro-peripherul gunglion cell density gradient of the cat’s
retina The gradient of density along the hori-
zontal axis of retina through the central area is shown in figure 3 . The angular scale of eccentricity and the density unit, cells Imillisteradian, were calculated as- suming that the posterior nodal distance of the cat’s eye is 12.4 mm (Vakkur, Bishop and Kozak, ’63). These units (de- grees, cells millisteradian) will allow com- parison of this gradient with that of the retinae of other species. The form of the gradient along any axis of the retina would be similar to this, but would differ slightly as indicated by the course of the isoden- sity lines of figures 1 and 2.
Cell size analysis The results of the cell size analysis are
presented in figures 4 and 5 . The seven density ranges chosen are represcnted in these figures by their median values. A total of 2,778 cells was measured. Gen- erally it was found that the cells are small- est at the central area and increase in size as density decreases. As shown in figure 4 the percentage frequency of different cell size groups varies characteristically with density, the group containing the smallest cells being predominant in areas of high density, the group containing larger cells in areas of low density. Some idea of the distribution in the retina of the different cell siie groups is obtained from figure 5, which combines the density gradient of

3 50 JONATHAN STONE
figure 3 and the data of figure 4. It was assumed here that the percentage frequen- cies of the cell size groups at a given den- sity were the same €or all areas of that density. This figure shows that the 8-10 I-I diameter group is confined very largely to the central area where it includes 45% of the total population. The 11-15 II diameter group is similarly confined, but spreads somewhat more widely. The larger cell size groups have a relatively flat distribu- tion. Remarkably their density drops sharply at the central area, showing that the cells of this area are almost all smaller than 16 in diameter.
Histograms of the frequency of cell sizes at a given density were always unimodal. Consistent with the data presented above, the modal and maximal diameters in the histograms increased as density decreased. The giant ganglion cells did not form a second mode in these histograms despite the fact that inspection of whole-mount preparations strongly suggests that they form a separate class. The largest cells measured were 35 CI in diameter. and are comparable with the giant ganglion cells described by Rushton (’50) from silver stained whole-mounts of the cat’s retina.
DISCUSSION
The specialized central area of the cat’s retina
The most prominent feature of the gan- glion cell density map of the cat‘s retina (fig. 2 ) is the sharp increase in density at the central area, which is situated above and temporal to the optic disc. This area is characterized anatomically by a radial arrangement of blood vessels which con- verges on an area of densely packed gan- glion cells, which are smaller than else- where in the retina. This collection of cells was described by Ganser (1882) and Chie- vitz (1889) from sections of the retina. Chievitz noted in addition that at the cen- tral area the bipolar cell layer is relatively thick, the layer of receptor nuclei becomes thin, and the axon bundles of the fiber layer run an arcuate course around the collection of ganglion cells. Bishop, Kozak and Vakkur (’62) gave a more detailed description of the fiber layer and the col- lection of small ganglion cells, using meth-
ylene blue stained whole-mounts. The ophthalmoscopic view of the convergence of blood vessels on the central area was described by Wiesel (’60) and Bishop. Kozak and Vakkur (’62). The same con- vergence was described by Michaelson (’54) from whole-mounts of the retina, with the bood vessels injected with ink.
Ganser and Chievitz arrived at different estimates of the extent of the central area, defining it as the area over which the ganglion cell layer was more than one cell thick. Chievitz described a circular area of radius 1.2 mm, Ganser a circular area of diameter 1.4 mm. The area of doubling of the ganglion cell layer noted in this study had a radius of 0.5 mm. Perhaps the best way of defining the limits of the central area would be in terms of ganglion cell density, choosing a particular isodensity line. However, the curve of ganglion cell density through the central area (fig. 3 ) is smooth (except at its peak) and the choice of isodensity lines is necessarily arbitrary. Considering the two isodensity lines used in table 1, the area of retina and number of cells within the 5,000/mm” isodensity line vary considerably, even between the retinae of one animal. More consistent figures ob- tain for the 3,000 mm’ line which may therefore be more usefully considered as the limit of the central area. However, the central area so defined is not sharply marked off from surrounding retina.
Comparison of the ganglion cell layers at the central areas of the monkey and cat retinae has suggested that the mon- key’s retina is considerably the more spe- cialized. In addition to the possession of a fovea, the central area of the monkey’s retina contains many more ganglion cells, and the individual cells are more homoge- neous in size and possibly more special- ized than in the cat. In view of this it is surprising that the visual performance of the cat is comparable with that of the monkey, in certain tests at least. Smith (’36) found that the line visual acuity of the cat is of the same order as that of the monkey measured by a comparable test.
Polyak (’41) also noted that the gan- glion cells of the monkey’s fovea are smaller than elsewhere in the retina. Van Buren (’63) confirmed this for the mon-

RETINAL GANGLION CELL DENSITY 351
key, chimpanzee and man. Polyak con- sidered that these small cells form a specialized class of “midget‘ ganglion cells which have only a single dendritic process. The small ganglion cells of the cat’s retina, which are largely confined to the central area, may well be specialized in a manner analagous to the midget gan- glion cell of monkey and man.
Although no accurate quantitative com- parison is possible, the centro-peripheral ganglion cell density gradient of figure 3 is very similar to the gradient of visual acuity across the human visual field (for example, Mandelbaum and Sloan, ’47) and to the gradient of cortical representa- tion of the visual field in the monkey (Daniel and Whitteridge, ’61). It can be considered to be a gradient of specializa- tion of structure and function of the cat’s retina, and by reference to it the degree of specialization of a given area of retina under study can be estimated from its ganglion cell density.
The horizontal “arm” of high densety
The “arm” of relatively high ganglion cell density which extends approximately horizontally from the central area across the retina of the cat has been observed in qualitative terms in the retinae of many vertebrates (Chievitz, 1891; Slonaker, 1897) and in more quantitative terms in the retinae of the frog (Jacobson, ’62) and of the macaque monkey, the chim- panzee and man (van Buren, ’63). Van Buren noted that the isopter lines of the human visual field also form horizontally elongated ellipsoids, suggesting that gan- glion cell density and acuity are corre- lated. However he remarked that the ganglion cell density of the fovea may vary widely between humans with no accompanying change in the acuity of central vision.
The degree of elongation of the isoden- sity ellipsoids which make up the arm increases as density decreases (figs. 1 and 2) . Whereas the 5,000/mm2 isoden- sity line may be circular, or even vertically elongated as in figure l c , subsequent lines are all horizontally elongated, becoming increasingly so as density decreases. The ratio between horizontal and vertical axes
of the ellipsoid formed by the 250/mm’ line is 3 : l . A very similar change in ganglion cell distribution was observed in monkey, chimpanzee and human retina by van Buren (’63). This change from approximately circular distribution of gan- glion cells in the central area to the marked ellipsoid distribution in peripheral retina is quite continuous. It suggests that there is a continuous qualitative change in organization between the central area and periphery, in addition to the continu- ous quantitative changes suggested by the centroperipheral gradients of cell density and size (figs. 3 and 4 ) .
ACKNOWLEDGMENTS
This study was aided by grants from the National Health and Medical Research Council of Australia, and from the Oph- thalmic Research Institute of Australia. I am very grateful to Professor P. 0. Bishop for his kind advice and help in the preparation of this paper. I am very grateful also for the skilled assistance given by the technical staff of the Physiol- ogy Department, particularly Mr. B. McGee and Mr. W. Mears, and for the secretarial assistance given by Miss S. Johnson.
LITERATURE CITED Abercrombie, M. 1946 Estimation of nuclear
population from microtome sections. Anat. Rec., 94: 239.
Agduhr, E. 1941 A contribution to the tech- nique of determining the number of nerve cells per unit volume of tissue. Anat. Rec., 80: 191-202.
Arey, L. B., and M. Gore 1942 The numerical relation between the ganglion cells of the retina and the fibers of the optic nerve of the dog. J. Comp. Neur., 77: 609-619.
Barlow, H. B., R. Fitzhugh and S . W. Kuffler 1957a Dark adaptation, absolute threshold and Purkinje shift in single units of the cat’s retina. J. Physiol., 137: 327-337.
1957b Change of organization in thc receptive fields of the cat’s retina during dark adaptation. J. Physiol., 137: 338-354.
Bishop, P. O., D. Jeremy and J. W. Lance 1953 The optic nerve, properties of a central tract. J. Physiol., 121: 415-432.
1962 Some quantitative aspects of the cat’s eye: axis and plane of reference, visual field co- ordinates and optics. J. Physiol., 163: 466-501.
Brcusch, S. R., and L. B. Arey 1942 The num- ber of mvelinated and unmvelinated fibers in
Bishop, P. O., W. Kozak and G. J. Vakkur
the optic nerve of vertebrates. J . Comp. Neur., 77: 631-656.

352 JONATHAN STONE
Brown, K. T., and T. N. Wiesel 1959 Intra- retinal recording with micropipctte electrodes in the intact eye. J. Physiol., 149: 537-562.
Cajal. S. R. 1893 La RBline des VertebrCs. Cellule: 9: 119-258.
-~ 1911 Histologie du Systeme nerveux de I’homme et des vertebres. Tome II? A. Maloine: Paris.
Campbell, F. P. 1961 The eye of the cat in ophthalmic research. Arch. Ophthal.; 65: 11-15.
Chievitz, J. H. 1889 Untersuchungen uber die Area centralis retinae. Arch. Anat. Physiol.. Lpz., Anat. Abtheil., Suppl., 139-396, Append.
1891 uber das Vorkommen der Area centralis retinae i n den vier hijhereri Wirbel- thierklassen. Arch. f . Anat. u. Physiol., 15: 311-334, Suppl.
Daniel, P. M., and D. Whitteridge 1961 The representation of the visual field on the cere- bral cortex in monkeys. J . Physiol., 159: 203-22 1.
Dogiel, A. S. 1891 ubcr der nervosen Elemente in der Retina des Menschen. Arch. 1. mikro- skop. Anat., 38: 317-344.
1893 tiber der nerviisen Elemcnte in der Retina des Menschen. Arch. f . mikroskop. Anat., 40: 29-38.
1894 Neuroglia der Retina des Men- schen. Arch. f . mikroskop. Anat., 41: 612-623.
Ganser, S. 1882 Uber die periphere und zen- trale Anordnung der Sehnervenfasern und uber das Corpus bigeminum anterius. Arch. Psy- chiat. Nervenkr. Bd., 13: 341-381.
Hubel, D. €I., and T. N. Wiesel 1959 Receptive fields of single neurones in the cat’s striate cortex. J. Physiol., 148: 574-591.
1960 Receptive fields of optic nerve fibers in the spider monkey. J. Physiol., 154: 572-580.
Jacobson, M. 1962 The representation of the retina on the optic tectum of the frog. Corre- lation between retino-tectal magnification fac- tor and rctinal ganglion cell count. Quart. J. Exp. Physiol., 47: 170-178.
Kuffler, S. W. 1953 Discharge patterns and functional organisation of mammalian retina. J. Neurophysiol., 16: 37-68.
Lashley, K. S . 1932 The mechanism of vision. V. The structure and image forming power of the rat’s eye. J. Comp. Psychol., 13: 173-200.
Mandelbaum. J., and L. L. Sloan 1941 Periph- eral visual acuity. Amer. J. Ophthal., 30: 581-588.
Marrable, A. W. 1962 The counting of cells Y
and nuclei in microtorne sections. Quart. J. Micr. Sci., 103: 331 347.
Michaelson, I. C. 1954 Retinal Circulation in Man and Animals. Charles C Thomas, Spring- field, Illinois.
Muller, H. 1861 Report of the British Associa- tion for the Advancement of Science 1862. Cited by Chievitz, 1889.
Oehme, H. 1961 Vergleichend - histologische Untersuchungen an der Retina van Eulen. Zool. Jb. Anat. Bd.. 79: 439-478.
Polyak, S. 1941 The Retina. University Chi- cago Press.
Prince, J. H., C. D. Diesem, I. Eglitis and G. L. Ruskell 1960 Anatomy and Histology of the Eye and Orbit in Domestic Animals. Charles C Thomas, Springfield, Illinois.
Rushton, W. A. H. 1950 Giant ganglion cells in the cat’s retina. J. Physiol., 1 1 1 : 26-27P.
Slonaker, J . R. 1897 A comparative study 01 the area of acute vision in vertebrates. J. Morph., 13: 445-500.
Smith, K. U. 1936 Visual discriniination in the cat. IV. The visual acuity of the cat in rela- tion to stimulus distance. J. Genet. Psychol., 49: 297-313.
Van Buren, J. M. 1963 The Retinal Ganglion Cell Layer. Charles C Thomas, Springfield, Illinois.
Van Crevel, H., and W. J. C. Verhaart 1963 The rate of secondary degeneration in the nervous system 11. The optic nerve of the cat. J. Anat., Lond., 97: 451-464.
Vakkur, G. J., and P. 0. Bishop 1963 The schematic eye in the cat. Vision Res., 3 : 357-381.
1963 Visual optics in the cat, including posterior nodal distance and retinal landmarks. Vision Res., 3: 289-314.
Vilter, V. 0. 1949 Recherches biometriques sur l’organisation synaptique de la retine humaine. C. R. des Seances SOC. Biol. (Paris), 143: 831.
Weymouth, F. W. 1958 Visual sensory units and the minimum angle of resolution. Amer. J. Ophthal., 46: 102-113.
Wiesel, T. N. 1960 Keceptive fields of ganglion cells in the cat’s retina. J. Physiol., 153: 583-594.
Ziirn. J. 1902 Vergleichend histologische Unter- suchungen uber die Retina und die Area cen- tralis retinae der Haussaugethiere. Arch. Anat. Physiol., Axat. Abtheil., Suppl. Bd., 99-144.
Vakkur, G. J., P. 0. Bishop and W. Kozak


![Diversity of Retinal Ganglion Cells Identified by ... · of retinal ganglion cells [3,4,5,6]. Even in the monkey retina, Dacey and other researchers showed morphological diversity](https://img.dokumen.tips/doc/110x75/60fabf5bff27e94d36249fb0/diversity-of-retinal-ganglion-cells-identified-by-of-retinal-ganglion-cells.jpg)