Embed Size (px)
Citation preview
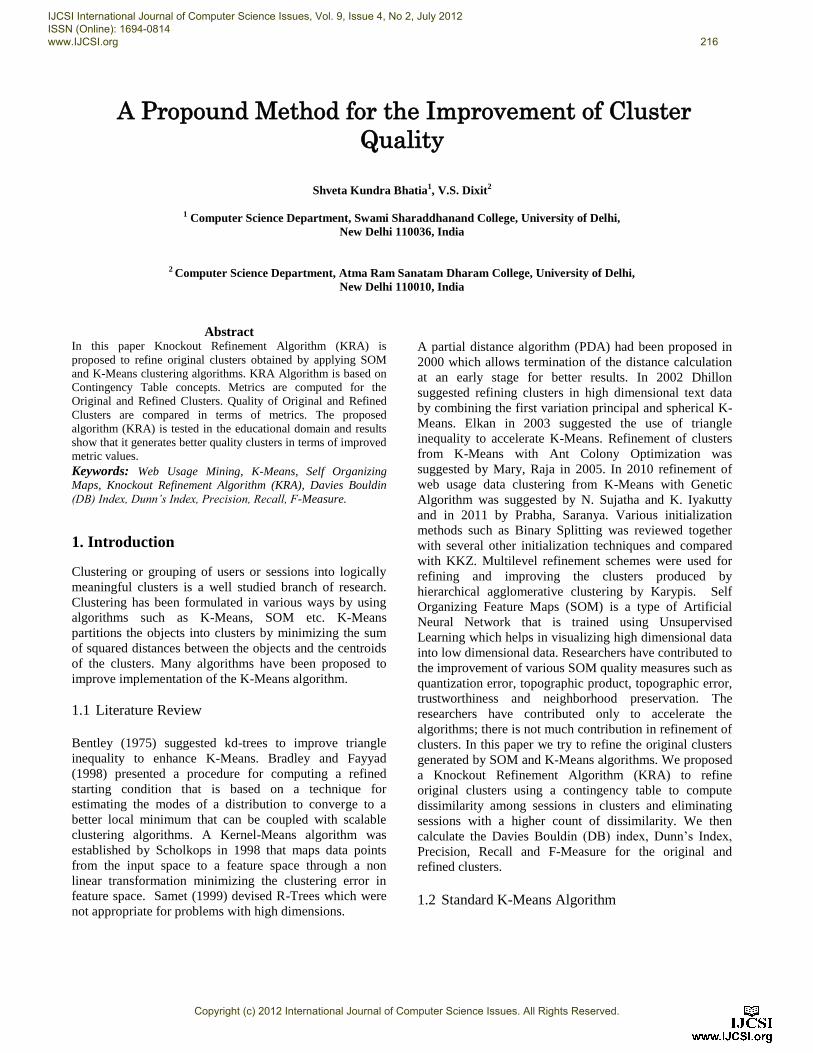
A Propound Method for the Improvement of Cluster
Quality
Shveta Kundra Bhatia1, V.S. Dixit2
1 Computer Science Department, Swami Sharaddhanand College, University of Delhi,
New Delhi 110036, India
2 Computer Science Department, Atma Ram Sanatam Dharam College, University of Delhi,
New Delhi 110010, India
Abstract In this paper Knockout Refinement Algorithm (KRA) is
proposed to refine original clusters obtained by applying SOM
and K-Means clustering algorithms. KRA Algorithm is based on
Contingency Table concepts. Metrics are computed for the
Original and Refined Clusters. Quality of Original and Refined
Clusters are compared in terms of metrics. The proposed
algorithm (KRA) is tested in the educational domain and results
show that it generates better quality clusters in terms of improved
metric values.
Keywords: Web Usage Mining, K-Means, Self Organizing
Maps, Knockout Refinement Algorithm (KRA), Davies Bouldin
(DB) Index, Dunn’s Index, Precision, Recall, F-Measure.
1. Introduction
Clustering or grouping of users or sessions into logically
meaningful clusters is a well studied branch of research.
Clustering has been formulated in various ways by using
algorithms such as K-Means, SOM etc. K-Means
partitions the objects into clusters by minimizing the sum
of squared distances between the objects and the centroids
of the clusters. Many algorithms have been proposed to
improve implementation of the K-Means algorithm.
1.1 Literature Review
Bentley (1975) suggested kd-trees to improve triangle
inequality to enhance K-Means. Bradley and Fayyad
(1998) presented a procedure for computing a refined
starting condition that is based on a technique for
estimating the modes of a distribution to converge to a
better local minimum that can be coupled with scalable
clustering algorithms. A Kernel-Means algorithm was
established by Scholkops in 1998 that maps data points
from the input space to a feature space through a non
linear transformation minimizing the clustering error in
feature space. Samet (1999) devised R-Trees which were
not appropriate for problems with high dimensions.
A partial distance algorithm (PDA) had been proposed in
2000 which allows termination of the distance calculation
at an early stage for better results. In 2002 Dhillon
suggested refining clusters in high dimensional text data
by combining the first variation principal and spherical K-
Means. Elkan in 2003 suggested the use of triangle
inequality to accelerate K-Means. Refinement of clusters
from K-Means with Ant Colony Optimization was
suggested by Mary, Raja in 2005. In 2010 refinement of
web usage data clustering from K-Means with Genetic
Algorithm was suggested by N. Sujatha and K. Iyakutty
and in 2011 by Prabha, Saranya. Various initialization
methods such as Binary Splitting was reviewed together
with several other initialization techniques and compared
with KKZ. Multilevel refinement schemes were used for
refining and improving the clusters produced by
hierarchical agglomerative clustering by Karypis. Self
Organizing Feature Maps (SOM) is a type of Artificial
Neural Network that is trained using Unsupervised
Learning which helps in visualizing high dimensional data
into low dimensional data. Researchers have contributed to
the improvement of various SOM quality measures such as
quantization error, topographic product, topographic error,
trustworthiness and neighborhood preservation. The
researchers have contributed only to accelerate the
algorithms; there is not much contribution in refinement of
clusters. In this paper we try to refine the original clusters
generated by SOM and K-Means algorithms. We proposed
a Knockout Refinement Algorithm (KRA) to refine
original clusters using a contingency table to compute
dissimilarity among sessions in clusters and eliminating
sessions with a higher count of dissimilarity. We then
calculate the Davies Bouldin (DB) index, Dunn’s Index,
Precision, Recall and F-Measure for the original and
refined clusters.
1.2 Standard K-Means Algorithm
IJCSI International Journal of Computer Science Issues, Vol. 9, Issue 4, No 2, July 2012 ISSN (Online): 1694-0814 www.IJCSI.org 216
Copyright (c) 2012 International Journal of Computer Science Issues. All Rights Reserved.

K-means works using the following steps:
1. Place K objects points into the space that are to be
clustered by choosing the initial value of K. Object
points represent centroids of initial groups chosen.
2. Assign each object point to the group that has the
closest Centroids.
3. Re-compute the positions of the K centroids and
continue till all object points have been assigned.
4. Repeat steps 2 and 3 until the centroids do not change.
This produces a separation of the object points into
groups from which the metric to be minimized can be
calculated.
The algorithm aims to minimize an objective function as
in Eq. (1)
∑ ∑
(1)
Where,
is a chosen distance measure
between a data point and the cluster centre. It indicates the
distance of the n data points from their respective cluster
center.
1.3 Standard SOM Algorithm
1. Assign random values to the weight vectors of a neuron.
2. Provide an input vector to the network.
3. Traverse each node in the network
a) Find similarity between the input vector and the
network’s node’s weight vector using Euclidean
Distance.
b) Find the node that produces the smallest distance
which is assigned as the Best Matching Unit (BMU).
4. Update the nodes in the neighborhood of the BMU by
changing the weights using Eq. (2):
(2)
Where,
t keeps an account of the iteration number
λ is the iteration range
Wv is the current weight vector
D is the target input
Θ(t) is the Gaussian neighborhood function
α(t) is learning rate due to time
5. Increment t and repeat from step 2 while t< λ.
1.4 Metrics
1.4.1 Davies Bouldin Index
This index aims to identify sets of clusters that are
compact and well separated. The Davies-Bouldin index is
defined as in Eq. (3):
∑
(3)
Were K denotes the number of clusters, 𝑖, 𝑗 are cluster
labels, 𝑑iam(C𝑖) and 𝑑iam(C𝑗) are the diameters of the
clusters C𝑖 and C𝑗 , 𝑑(C𝑖, C𝑗) is the average distance
between the clusters. Smaller values of average similarity
between each cluster and its most similar one indicate a
“better” clustering solution.
1.4.2 Dunn’s Index This index aims at expecting a large distance between the
clusters and an expected small diameter of the cluster. The
index is defined as in Eq. (4):
{ {𝑑 | 𝑑𝑖 } | } (4)
Here 𝑑 is to compute the dissimilarity between two
clusters defined as in Eq. (5):
𝑑 𝑑 (5)
And diam(c) is the diameter of the cluster that defines the
maximum distance between two points in a cluster. A
large value of Dunn’s index indicates compact and well
separated clusters.
1.4.3 F-Measure, Precision And Recall
F-measure combines the precision and recall concepts
from information retrieval. We then calculate the recall
and precision of that cluster for each class as:
𝑅𝑒 ll(𝑖, 𝑗) = x𝑖𝑗 / x𝑖
And
𝑃𝑟𝑒 𝑖𝑠𝑖on(𝑖, 𝑗) = x𝑖𝑗 / x𝑗
Were x𝑖𝑗 is the number of objects of class 𝑖 that are in
cluster 𝑗, x𝑗 is the number of objects in cluster 𝑗, and x𝑖, is
the number of objects in class 𝑖. Precision and Recall are
measures that help to evaluate the quality of a set of
retrieved documents. The 𝐹 – 𝑀𝑒 𝑠𝑢𝑟𝑒 of cluster 𝑗 and
class 𝑖 is given by the following Eq. (6):
F (𝑖, 𝑗) = 2 *𝑅𝑒 ll(𝑖, 𝑗)𝑃𝑟𝑒 𝑖𝑠𝑖𝑜𝑛(𝑖, 𝑗) / 𝑃𝑟𝑒 𝑖𝑠𝑖𝑜𝑛(𝑖, 𝑗) +
𝑅𝑒 𝑙𝑙(𝑖, 𝑗) (6)
IJCSI International Journal of Computer Science Issues, Vol. 9, Issue 4, No 2, July 2012 ISSN (Online): 1694-0814 www.IJCSI.org 217
Copyright (c) 2012 International Journal of Computer Science Issues. All Rights Reserved.

The 𝐹 – 𝑀𝑒 𝑠𝑢𝑟𝑒 values are within the interval [0, 1] and
larger values indicate higher clustering quality.
2. Process Description and Experiments
The raw web log file we used for the experiment contained
5999 web requests that can be found at
http://www.vtsns.edu.rs/maja/vtsnsNov16 containing
information like date/time of request, hit type, page,
hostname, referrer, server domain, authenticated user,
server response, page views, size etc. For preparing the
web log data for the mining process, it needs to be cleared
of irrelevant requests; and transformed to a format that can
be fed into the clustering algorithm. For Pre-Processing
and creation of sessions a tool called Sawmill (Version
7.0), developed by Flower fire Inc. has been used. Sawmill
computes session information by tracking the page,
date/time, and visitor id for each page view. When a
session view is requested, it processes all of these page
views at the time of the request. Sawmill groups the hits
into initial sessions based on the visitor id by assuming
that each visitor contributes to a session. In the next step
sorting by time is performed for a click-by-click record of
each visitor. A session timeout interval of 30 minutes is
considered for generating final sessions and sessions
longer than 2 hours are eliminated. Using the Sawmill tool
on our web log data led to the creation of sessions and 110
unique URLs. 72.9% of the total sessions were exported
into a .csv format with the help of scripts in tcl language as
rest of the sessions had only either one or two page views.
Further we optimized our matrix and 59.1% of the sessions
and 43 unique URLs were used for experimentation. The
optimization was performed on the basis of sessions
having less than 3 page views and pages that were viewed
5 or less than 5 times have been removed. The optimized
matrix was used for clustering using the Self-Organizing
Feature Maps and K-Means algorithms. We used the
Spice-SOM tool and SPSS software for implementation of
the respective algorithms. Applying the two algorithms we
can see that clusters with similarity among sessions have
been obtained and can be used for prediction of pages to a
user of similar interests. Clusters of sizes 10, 15 and 20
were generated using both the techniques of K-Means and
SOM. Apply KRA to refine the original clusters. The
quality of obtained clusters is evaluated using the Davies
Bouldin and Dunn’s quality measures along with external
quality measures such as Precision, Recall and F-Measure.
The clusters are listed as Original Clusters (OC) on which
we shall apply our proposed Knockout Refinement
Algorithm (KRA).
Web Log
Data Pre-Processing
Pre-Processed Web Log
Data
Apply K-Means
Algorithm
Apply SOM
Algorithm
Calculate DB and
Dunn’s Index,
Precision, Recall,
F-Measure
Generate
Original
Clusters
Cluster Refinement (KRA in Matlab)
Create Contingency
Table for every cluster
Dissimilarity count for every
session in every cluster
Refined
Clusters
Results
Generate
Original
Clusters
Calculate DB and
Dunn’s Index,
Precision, Recall,
F-Measure
Results
Fig 1: Architecture of proposed refinement algorithm
IJCSI International Journal of Computer Science Issues, Vol. 9, Issue 4, No 2, July 2012 ISSN (Online): 1694-0814 www.IJCSI.org 218
Copyright (c) 2012 International Journal of Computer Science Issues. All Rights Reserved.

3. Proposed Knockout Refinement Algorithm
(KRA)
Fig 2: Proposed KRA Algorithm
Where, Dissimilarity can be computed using contingency
table which is a 2 by 2 matrix between two sessions.
Where q is the number of variables that equal 1 for both i
and j sessions, r is the number of variables that equal 1 for
session i but that are equal to 0 for session j, s is the
number of variables that equal 0 for session i and equal 1
for session j and t is the number of variables that equal 0
for sessions i and j. In this case the factor t is unimportant
and is ignored to compute the dissimilarity. The
dissimilarity for all sessions is computed as in equation 7:
𝑑 (𝑠 𝑠 ) ∑𝑟 𝑠
𝑟 𝑠 ⁄
(7)
The above computation is applied to every pair of sessions
that generates a Symmetric Dissimilarity Matrix (SDM) as
follows:
S1 S2 S3 S4
S1 0 d(S1, S2) d(S1,S3) d(S1,S4)
S2 d(S2, S1) 0 d(S2, S3) d(S2,S4)
S3 d(S3, S1) d(S3,S2) 0 d(S3,S4)
S4 d(S4, S1) d(S4, S2) d(S4, S3) 0
For refinement using the above Symmetric Dissimilarity
Matrix (SDM) and using a threshold value of 0.3 session
pairs are counted and those sessions are removed from the
cluster whose count values are greater than 2. Performing
the above computation we get refined clusters.
4. Outcome
4.1 Results for Davies Bouldin Index
The results for comparison of DB index for original and
refined clusters are as follows:
Table 1: Comparison of DB Index for K-Means Algorithm
DAVIES BOULDIN INDEX (K-MEANS)
ORIGINAL
CLUSTERS
REFINED
CLUSTERS
10 Clusters 1.6868 1.6338
15 Clusters 1.8329 1.6315
20 Clusters 1.5459 1.5486
Fig 3: Comparison of DB Index for K-Means Algorithm
Table 2: Comparison of DB index for SOM Algorithm
DAVIES BOULDIN INDEX (SOM)
ORIGINAL
CLUSTERS
REFINED
CLUSTERS
10 Clusters 2.5719 2.4217
15 Clusters 2.4185 1.3263
20 Clusters 1.9049 1.7203
1.4
1.5
1.6
1.7
1.8
1.9
10 15 20
DB
In
dex
Number Of Clusters
ORIGINAL
CLUSTERS
REFINED
CLUSTERS
Session i
Session j
1 0 Sum
1 q r q + r
0 s t s + t
Sum q + s r + t
Input: Set of Original Clusters (OC).
Process: Step 1: Do
Pick up the first cluster (Ck)
Step 2: Generate contingency table for every pair of
sessions C (Si, Sj) in the cluster.
Step 3: Evaluate dissimilarity between all sessions using
the following equation:
𝑑 (𝑠 𝑠 ) ∑𝑟 𝑠
𝑟 𝑠 ⁄
Step 4: Generate a Symmetric Dissimilarity Matrix
(SDM)
If Threshold > 0.3 for d(Si,Sj)
Count++
If (Count>2)
Eliminate Si and Sj from the cluster Ck
End If
End If
Generate Refined Clusters (RC)
End Do
Repeat for all the clusters
Output: Refined Clusters (RC)
IJCSI International Journal of Computer Science Issues, Vol. 9, Issue 4, No 2, July 2012 ISSN (Online): 1694-0814 www.IJCSI.org 219
Copyright (c) 2012 International Journal of Computer Science Issues. All Rights Reserved.
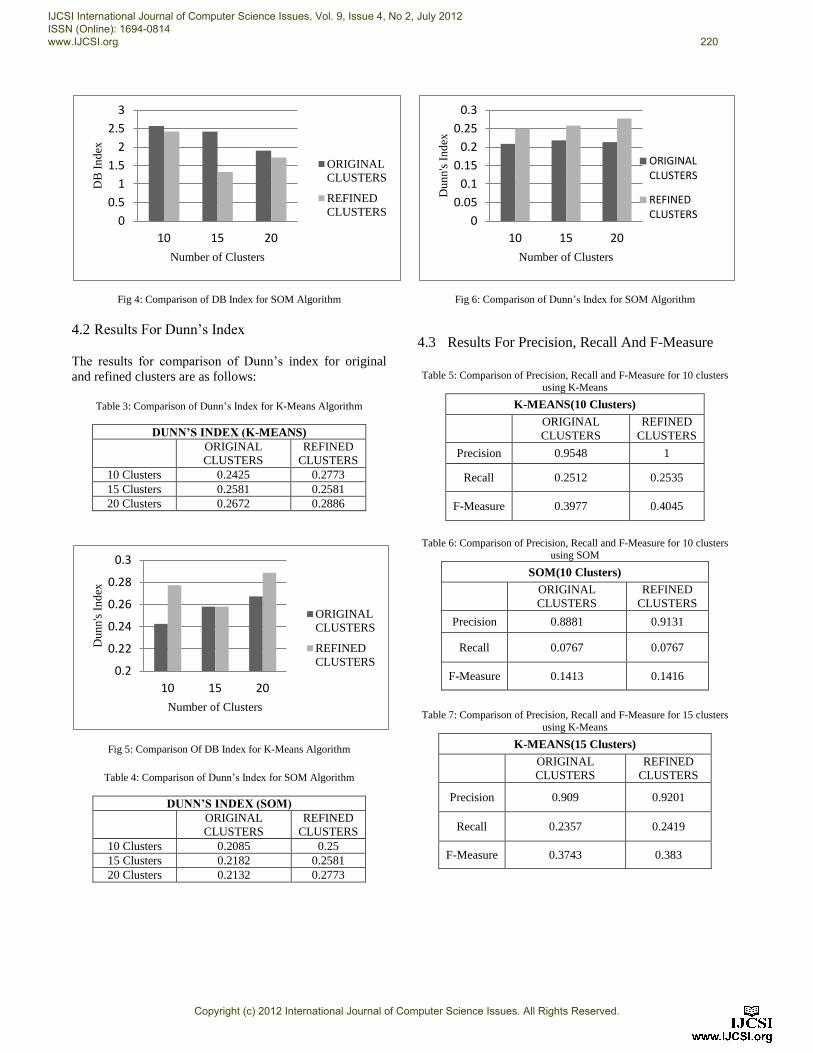
Fig 4: Comparison of DB Index for SOM Algorithm
4.2 Results For Dunn’s Index
The results for comparison of Dunn’s index for original
and refined clusters are as follows:
Table 3: Comparison of Dunn’s Index for K-Means Algorithm
DUNN’S INDEX (K-MEANS)
ORIGINAL
CLUSTERS
REFINED
CLUSTERS
10 Clusters 0.2425 0.2773
15 Clusters 0.2581 0.2581
20 Clusters 0.2672 0.2886
Fig 5: Comparison Of DB Index for K-Means Algorithm
Table 4: Comparison of Dunn’s Index for SOM Algorithm
DUNN’S INDEX (SOM)
ORIGINAL
CLUSTERS
REFINED
CLUSTERS
10 Clusters 0.2085 0.25
15 Clusters 0.2182 0.2581
20 Clusters 0.2132 0.2773
Fig 6: Comparison of Dunn’s Index for SOM Algorithm
4.3 Results For Precision, Recall And F-Measure
Table 5: Comparison of Precision, Recall and F-Measure for 10 clusters using K-Means
K-MEANS(10 Clusters)
ORIGINAL
CLUSTERS
REFINED
CLUSTERS
Precision 0.9548 1
Recall 0.2512 0.2535
F-Measure 0.3977 0.4045
Table 6: Comparison of Precision, Recall and F-Measure for 10 clusters using SOM
SOM(10 Clusters)
ORIGINAL
CLUSTERS
REFINED
CLUSTERS
Precision 0.8881 0.9131
Recall 0.0767 0.0767
F-Measure 0.1413 0.1416
Table 7: Comparison of Precision, Recall and F-Measure for 15 clusters
using K-Means
K-MEANS(15 Clusters)
ORIGINAL
CLUSTERS
REFINED
CLUSTERS
Precision 0.909 0.9201
Recall 0.2357 0.2419
F-Measure 0.3743 0.383
0
0.5
1
1.5
2
2.5
3
10 15 20
DB
In
dex
Number of Clusters
ORIGINAL
CLUSTERS
REFINED
CLUSTERS
0.2
0.22
0.24
0.26
0.28
0.3
10 15 20
Du
nn
's I
nd
ex
Number of Clusters
ORIGINAL
CLUSTERS
REFINED
CLUSTERS
0
0.05
0.1
0.15
0.2
0.25
0.3
10 15 20
Du
nn
's I
nd
ex
Number of Clusters
ORIGINALCLUSTERS
REFINEDCLUSTERS
IJCSI International Journal of Computer Science Issues, Vol. 9, Issue 4, No 2, July 2012 ISSN (Online): 1694-0814 www.IJCSI.org 220
Copyright (c) 2012 International Journal of Computer Science Issues. All Rights Reserved.

Table 8: Comparison of Precision, Recall and F-Measure for 15 clusters
using SOM
SOM(15 Clusters)
ORIGINAL
CLUSTERS
REFINED
CLUSTERS
Precision 0.6679 0.6846
Recall 0.0915 0.0992
F-Measure 0.1609 0.1733
Table 9: Comparison of Precision, Recall and F-Measure for 20 clusters
using K-Means
K-MEANS(20 Clusters)
ORIGINAL
CLUSTERS
REFINED
CLUSTERS
Precision 0.9125 0.9208
Recall 0.2116 0.2116
F-Measure 0.3436 0.3442
Table 10: Comparison of Precision, Recall and F-Measure for 20 clusters
using SOM
SOM(20 Clusters)
ORIGINAL
CLUSTERS
REFINED
CLUSTERS
Precision 0.7437 0.777
Recall 0.0919 0.093
F-Measure 0.1635 0.1662
5. CONCLUSION
The proposed algorithm tested on the web log data shows
that refined clusters lead to an improved Davies Bouldin
and Dunn’s Index values; external quality measures such
as Precision, Recall and F-Measure have improved for
refined clusters as compared to the original clusters. The
proposed algorithm is scalable and can be coupled with
clustering algorithms to address any other web log data
sets. Note that the performances of clustering algorithms
are found to be data dependent.
REFERENCES
[1] Arun Prabha K., R.Saranya. Refinement of K-Means
Clustering Using Genetic Algorithm; Journal of Computer
Applications (JCA)ISSN: 0974-1925, Volume IV, Issue 2, 2011.
[2] Bei C., and Gray, R., An Improvement of the Minimum
Distortion Encoding Algorithm for Vector Quantization. IEEE
Transactions on Communications, 33 (10): 1132-1133, 1985.
[3] Bentley J., Multidimensional Binary Search Trees Used for
Associative Searching. ACM, 18 (9): 509-517, 1975.
[4] Bradley, P.S., U. Fayyad, and C. Reina, “Scaling Clustering
Algorithms to Large Databases”, Proc. 4th International Conf.
on Knowledge Discovery and Data Mining (KDD-98). AAAI
Press, Aug. 1998.
[5] Britos, P., Damián Martinelli, Hernan Merlino, Ramón
García-Martínez Web Usage Mining Using Self Organized
Maps. IJCSNS International Journal of Computer Science and
Network Security, VOL.7 No.6, June 2007.
[6] Cheng D., Gersho B., Ramamurthi Y., and Shoham Y., 1984.
Fast Search Algorithms for Vector Quantization and Pattern
Recognition. Proceeding of the IEEE International Conference
on Acoustics, Speech and Signal Processing, 1, pp:1-9, 1984.
[7] Dhillon, I.S., Y. Guan, and J. Kogan. Refining Clusters in
High-dimensional Text Data.UTCS Technical Report #TR-02-
03, January 2002.
[8] Dhillon,I.S., J. Fan, and Y. Guan. Efficient clustering of very
large document collections. In R. Grossman, C. Kamath, P.
Kegelmeyer, V. Kumar, and R. Namburu, editors, Data Mining
for Scientific and Engineering Applications, pages 357–381.
Kluwer Academic Publishers, 2001.
[9] Elkan, C., Using the Triangle Inequality to Accelerate k-
Means. Proceedings of the Twentieth International Conference
on Machine Learning (ICML-2003), pp. 609-616, 2003.
[10] Fayyad, U., D. Haussler, and P. Stolorz. “Mining Science
Data.” Communications of the ACM 39(11) 1996.
[11] Greenacre, M., Clustering the Rows and Columns of a
Contingency Table. Journal of Classification, 5(1):39–51, 1988.
[12] Hanan Ettaher Dagez &Mhd Sapiyan Baba, “Applying
Neural Network Technology in Qualitative Research for
Extracting Learning Style to Improve E-Learning Environment,
The IEEE International Conference, 978-1-4244-2328-6/08 2008.
[13] Hjaltason, R. and Samet H., Distance Browsing in Spatial
Databases. ACM Transactions on Database Systems, 24 (2): 26-
42, 1999.
[14] Hossain, M.S., S. Tadepalli, L. T. Watson, I. Davidson, R.
F. Helm, and N. Ramakrishnan. Unifying Dependent Clustering
and Disparate Clustering for Non homogeneous Data. In KDD
’10, pages 593–602, 2010.
[15] Immaculate Mary C., Dr. S.V. Kasmir Raja; Refinement Of
Clusters from K-Means With Ant Colony Optimization; Journal
of Theoretical and Applied Information Technology 2005 - 2009
JATIT.
[16] Jain, A. K. and R. C. Dubes. Algorithms for Clustering
Data. Prentice-Hall, Englewood Cliffs, NJ, 1988.
[17] Jain, A.K., Murty, M.N., and Flynn, P.J. 1999. Data
clustering: A review. ACM Computing Surveys, 31(3):264–323.
IJCSI International Journal of Computer Science Issues, Vol. 9, Issue 4, No 2, July 2012 ISSN (Online): 1694-0814 www.IJCSI.org 221
Copyright (c) 2012 International Journal of Computer Science Issues. All Rights Reserved.

[18] Karypis George, Eui-Hong (Sam) Han, and Vipin Kumar;
Multilevel Refinement for Hierarchical Clustering. Department
of Computer Science & Engineering Army HPC Research
Center.
[19] Kate A. Smith and Alan Ng. Web page clustering using a
Self-organizing map of user navigation patterns. Decision
Support Systems, 35(2):245–256, 2003.
[20] Katsavounidis, I.; Jay Kuo, C.-C.; Zhen Zhang; A new
initialization technique for generalized Lloyd iteration; Signal
Processing Letters, IEEE , Oct. 1994, Volume: 1 Issue: 10 , 144 –
146.
[21] Kohonen, T., S. Kaski, K. Lagus, J. Salojarvi, J. Honkela, V.
Paatero and A. Saarela. Self-organization of a massive document
collection. IEEE Transactions on Neural Networks, 11(3):574–
585, 2000.
[22] Kosala, R., H. Blockeel, Web Mining Research: A Survey,
ACM SIGKKD Explorations, vol. 2(1), July 2000.
[23] Linde, Y.; Buzo, A.; Gray, R.; An Algorithm for Vector
Quantizer Design ; Communications, IEEE Transactions on ;Jan
1980 ;Volume: 28 Issue:1,84 – 95.
[24] Nadif, M., and G. Govaert. Block Clustering of Contingency
Table and Mixture Model. In IDA ’05, pages 249–259, 2005.
[25] Pelleg D., and Moore A., Accelerating exact k-means
algorithm with geometric reasoning. Proceedings of the fifth
ACM SIGKDD International Conference on Knowledge
Discovery and Data Mining, New York, pp. 727-734, 1999.
[26] Proietti, G. and Faloutsos C., Analysis of Range Queries and
Self-spatial Join Queries on Real Region Datasets Stored using
an R-tree. IEEE Transactions on Knowledge and Data
Engineering, 5 (12): 751-762, 2000.
[27] Scholkopf B., Smola J., and Muller R., Nonlinear
component analysis as a kernel eigenvalue problem,” Neural
Comput., 10(5):1299–1319, 1998.
[28] Shveta Kundra Bhatia, Harita Mehta and Veer Sain Dixit;
Aggregate Profiling for Recommendation of web pages using
SOM and K-Means Clustering Techniques; International Journal
of Computer Applications. Volume 36 - Number 9 Year of
Publication: 2011.
[29] Sinkkonen, J., S. Kaski, and J. Nikkil¨a. Discriminative
Clustering: Optimal Contingency Tables by Learning Metrics. In
ECML ’02, pages 418–430, 2002.
[30] Sujatha, N., K. Iyakutty; Refinement of Web usage Data
Clustering from K-means with Genetic Algorithm; European
Journal of Scientific Research ISSN 1450-216X Vol.42 No.3
(2010), pp.478-490.
[31] Tsuyoshi Murata and Kota Saito “Extracting Users Interests
from Web Log Data”, Proceedings of the 2006
IEEE/WIC/ACM International Conference of Web Intelligence
(WI 2006 Main Conference Proceedings) (WI’06) 2006 IEEE.
[32] Xu R., and Wunsch D., Survey of clustering algorithms.
IEEE Trans. Neural Networks, 16 (3):645-678, 2005.
[33] Han and Kamber, Concepts of Data Mining; Elsevier
Publication.2006
[34] Written by Cao Thang in Soft Intelligent Laboratory,
Ritsumeikan University, 2003
[35] http://www.sawmill.net
Shveta Kundra Bhatia is working as an Assistant Professor in the Department Of Computer Science, Swami Sharaddhanand College, University of Delhi. Her research area is Web Usage Mining and is currently pursuing PhD under Dr. V.S. Dixit from Department of Computer Science, University of Delhi. Dr. V. S. Dixit is working in the Department Of Computer Science, Atma Ram Sanatan Dharam College, University of Delhi. His research area is Queuing theory, Peer to Peer systems, Web Usage Mining and Web Recommender Systems. He is currently engaged in doing the research. He is Life member of IETE.
IJCSI International Journal of Computer Science Issues, Vol. 9, Issue 4, No 2, July 2012 ISSN (Online): 1694-0814 www.IJCSI.org 222
Copyright (c) 2012 International Journal of Computer Science Issues. All Rights Reserved.