Embed Size (px)
Citation preview
Advances in Forest Fire Research 2018 - D. X. Viegas (Ed.)
Chapter 3 – Fire Management
https://doi.org/10.14195/978-989-26-16-506_33
Advances in Forest Fire Research 2018 – Page 308
A project to measure and model pyrolysis to improve prediction of
prescribed fire behavior
David R. Weise1*; Thomas H. Fletcher2, Timothy J. Johnson3, WeiMin Hao4, Mark Dietenberger5,
Marko Princevac6, Bret Butler4, Sara McAllister4, Joseph O’Brien7, Louise Loudermilk7, Roger
Ottmar8, Andrew Hudak4, Akira Kato9, Babak Shotorban10, Shankar Mahalingam10, William E.
Mell8 1USDA Forest Service, PSW Research Station. 4955 Canyon Crest Drive, Riverside, California,
USA 92507, {[email protected]*} 2 Chemical Engineering Dept., Brigham Young University. Provo, Utah, USA,
{[email protected]} 3 Pacific Northwest National Laboratory. Richland, Washington, USA,
{[email protected]} 4 USDA Forest Service, Rocky Mountain Research Station, {[email protected]},
{[email protected]}, {[email protected], [email protected]} 5 USDA Forest Service, Forest Products Laboratory, Madison, Wisconsin, USA,
{[email protected]} 6 Mechanical Engineering Dept., University of California-Riverside, Riverside, California, USA,
{[email protected]} 7 USDA Forest Service, Southern Research Station, Athens, Georgia, USA, {[email protected]},
{[email protected]} 8 USDA Forest Service, Pacific Northwest Research Station, Seattle, Washington, USA,
{[email protected], [email protected]} 9 Graduate School of Horticulture, Chiba University, Chiba, Japan, {[email protected]} 10 The University of Alabama in Huntsville, Huntsville, Alabama, USA,
{[email protected], [email protected]}
Abstract
Laboratory and field experiments focused on pyrolysis and ignition coupled with sufficient description of
fuel characteristics and physics-based modeling are being used to improve our understanding of combustion
processes in mixed (heterogeneous) fuel beds managed with prescribed fire in the southern United States.
Previous pyrolysis work has typically used ground-up samples, thus eliminating any effects caused by
moisture content, fuel particle shape, or heating mode. We are measuring pyrolysis at bench, laboratory and
field-scale using intact fuels from living plants. Pyrolysis products being measured include light gases and
tars using off-line and real-time spectroscopic instruments. 3-D fuel description, heat transfer to the fuels,
and air flow around the fuels are being determined using a variety of intrusive and nonintrusive methods. The
ability of high fidelity physics-based FDS, WFDS, and GPYRO3D to reproduce experimental results and to
study conditions outside the range of the experimental data is being examined. This presentation will present
an overview of the project and the questions being addressed. Preliminary results from initial attempts to
measure pyrolysis at field-scale and results from early modeling of pyrolysis of live leaves using coupled
GPYRO3D and FDS models are presented.
Keywords: FTIR spectroscopy, gas sampling, pyrolysis, convection, gas chromatography, flaming, smoldering, wildland fuels

Advances in Forest Fire Research 2018 - D. X. Viegas (Ed.)
Chapter 3 – Fire Management
Advances in Forest Fire Research 2018 – Page 309
Wildland fire is an important component of many North American ecosystems and has been used
by humans to accomplish various objectives for several thousand years. Prescribed burning in the
southern United States is an important tool used by the Department of Defense and other land managers
to accomplish several objectives including hazardous fuel reduction, wildlife habitat management,
critical training area maintenance, ecological forestry and infrastructure protection. Vegetation is
heterogeneous unlike the homogeneous fuel beds assumed by current operational fire spread models.
These models do not contain fundamental descriptions of chemical reactions and heat transfer
processes necessary to predict fire spread and energy release needed for process-based fire effects
models. To improve prescribed fire application, an improved understanding is needed of the
fundamental processes related to pyrolysis and ignition in heterogeneous fuel beds. The objective of
this project is to address several fundamental questions to improve our understanding and modeling
capability of fire propagation in natural fuel beds including 1) detailed description of pyrolysis and the
evolution of its products for a greater variety of southern fuels than is currently known, 2) how
convective and radiative heat transfer from flames to live fuel particles influences pyrolysis and
ignition at laboratory and field scales, and 3) more detailed insight into pyrolysis, combustion and heat
transfer processes in wildland fire spread through the use of high-fidelity physics-based models. The
questions are being tested with data derived from three activities: 1) characterization of pyrolysis
products by measurement for a variety of live and dead foliar fuel particles in laboratory and small-
scale field experiments, 2) determination of the effects of convection and radiation heat transfer on
pyrolysis, and 3) performance of high-fidelity physics-based modeling of pyrolysis and ignition for
bench-scale, wind tunnel and small-scale field experiments. This paper describes the overall project.
Laboratory and field experiments focused on pyrolysis and ignition coupled with sufficient
description of fuel characteristics and physics-based modeling are being used to improve our
understanding of combustion processes in mixed (heterogeneous) fuel beds managed with prescribed
fire on DoD installations. Previous pyrolysis work has typically used ground-up samples, thus
eliminating any effects caused by moisture content, fuel particle shape, or heating mode. Thermal
gravimetric analysis (TGA) coupled with gas chromatography-mass spectrometry (GC-MS) and
evolved gas analysis (EGA) have been used for decades to describe the composition and energy content
of pyrolysis products. We are measuring pyrolysis at three scales – bench-scale measurements at BYU
and the Forest Products Laboratory (FPL), laboratory burn-scale in a wind tunnel at RFL, and small
field-scale burns (1600 m2) at Fort Jackson in South Carolina using intact fuels from living plants in
natural fuelbeds beneath southern pine forests. 14 plant species were selected (Table 7). One of the
dominant shrub species in the pine stands at Ft. Jackson is sparkleberry. Since this plant is deciduous,
it causes a significant change to prescribed fire behavior when its foliage is present during the growing
season. Sparkleberry was chosen to be the live plant species to link bench-scale measurements to field-
scale measurements.

Advances in Forest Fire Research 2018 - D. X. Viegas (Ed.)
Chapter 3 – Fire Management
Advances in Forest Fire Research 2018 – Page 310
Table 1 - Southern plant species used in pyrolysis experiments.
Common name Scientific name1 Experiment2
Wiregrass Aristida stricta Michx. B
Little bluestem Schizachyrium scoparium (Michx.) Nash B
Inkberry Ilex glabra (L.) A. Gray B,W
Yaupon Ilex vomitoria Aiton ‘Schelling Dwarf’ B
Fetterbush Lyonia lucida (Lam.) K. Koch B,W
Wax myrtle Morella cerifera (L.) Small B
Swamp bay Persea palustris (Raf.) Sarg. B
Sparkleberry Vaccinium arboreum Marshall B,W,F
Darrow’s blueberry Vaccinium darrowii Camp “Rosa’s Blush” B,W
Longleaf pine foliage Pinus palustris Mill. B
Longleaf pine litter Pinus palustris Mill. B,W,F
Water oak Quercus nigra L. B
Live oak Quercus virginiana Mill. B
Dwarf palmetto Sabal minor (Jacq.) Pers. B
Saw palmetto Serenoa repens (W. Bartram) Small B 1. USDA, NRCS. 2018. The PLANTS Database (http://plants.usda.gov, 10 January 2018). National Plant Data Team, Greensboro,
NC 27401-4901 USA; Radford, A.E., Ahles, H.E., Bell, C.R. 1968. Manual of the vascular flora of the Carolinas, University of North
Carolina Press, Chapel Hill, NC
2. B – bench, W – wind tunnel, F – field
In order to perform calculations related to gas and tar composition as well as modeling the plants
with physical fire behavior models, many chemical and physical properties of the plant material in
Table 7 were determined using a variety of methods . Because some live leaves will undergo enzymatic
hydrolysis when plucked and some live leaves will emit significant combustible volatiles at elevated
temperatures below the usual oven dry temperatures of 105 °C, samples were collected and
immediately vacuum dried at 45 °C. Proximate and ultimate analysis, and compositional content of
live leaves were determined by various standard methods. A special holder equipped with fine
thermocouples is being used in the cone calorimeter to determine properties such as thermal
conductivity (Figure 53).
Figure 1 - Specialized holder used for foliage samples in cone calorimeter.

Advances in Forest Fire Research 2018 - D. X. Viegas (Ed.)
Chapter 3 – Fire Management
Advances in Forest Fire Research 2018 – Page 311
A flat-flame burner (FFB) apparatus was used to study pyrolysis of foliar samples from the plants
in Table 7. (Details of the apparatus and initial results of the tests will be presented by Fletcher et al.
(2018) in this conference.) The interested reader is referred to Safdari et al. (2018). In addition to the
offline analysis associated with the FFB, a nitrogen purged Bruker Tensor 37 FTIR spectrometer1 was
deployed to provide real-time measurement of gaseous pyrolysis products by collecting a gas sample
every 1.46 seconds (Figure 54). The spectrometer was equipped with a glow bar source, potassium
bromide (KBr) beamsplitter and a liquid nitrogen cooled mercury cadmium telluride (MCT) detector.
The spectral resolution was 1 cm–1 with the number of scans set to 1 for flowing measurements and
1024 for static measurements. The acquisition mode was set to double-sided, forward-backward. For
the Fourier transform, the apodization function was Blackman-Harris 3-Term with a zerofilling factor
of 4, and the phase correction mode was Mertz (Mertz 1967). The gas sample was pumped into a White
cell (Bruker Optics, A136/2-L) with an effective path length of 8 m. FTIR spectroscopy has been used
extensively to characterize smoke emissions from wildland fuels (e.g. Yokelson et al. 1996). Briefly,
spectra analysis was carried out using the program Malt5 (Griffith 1996) with 50°C reference spectra
from the PNNL database (Johnson et al. 2006) and absorption lines from HITRAN. The FTIR method
allows for the simultaneous quantification of multiple analytes at the same time; up to two dozen
species can have their absolute concentration (and hence fluxes) quantified.
Figure 2 - FTIR spectrometer setup used in conjunction with flat-flame burner to provide real-time measurement of
gaseous pyrolysis products.
Seventy-three experimental fires have been burned in a low speed wind tunnel located at the
Riverside Fire Laboratory (Cobian-Iñiguez et al. 2017). Fuel beds 2 m long and approximately 1 m
wide composed of longleaf pine needles and various combinations of fetterbush, sparkleberry, and
inkberry (Table 7) were burned with nominal wind speeds of 0 or 1 m s-1. Pyrolysis gases are sampled
in real-time using a variety of methods and instruments (Figure 55, Figure 56). Note that the Bruker
Tensor 37 (T37) is the same device used to determine composition of gases at BYU. For Riverside
experiments, the resolution was set to 4 cm–1, the acquisition mode was set to double sided, forward-
backward, the apodization function was Blackman-Harris 3-Term, and phase correction mode was
Mertz (1967) with a zerofilling factor of 2. In order to increase temporal resolution, the number of
1 The use of trade or firm names in this publication is for reader information and does not imply endorsement by
the U.S. Department of Agriculture of any product or service.

Advances in Forest Fire Research 2018 - D. X. Viegas (Ed.)
Chapter 3 – Fire Management
Advances in Forest Fire Research 2018 – Page 312
scans was set to 1 with continuous measurements to obtain a spectral time resolution of 0.2 seconds.
This instrument configuration analyzed gases extracted with a 3/8” metal tubing probe above a plant
during measurements (Figure 56).
The other FTIR instrument used for gas phase measurements was the Bruker OPAG-22, which is
an open path gas analyzer. The OPAG was mounted on a tripod on one side of the wind tunnel with
the glow bar IR source on the opposite side. The path in between the OPAG and the source was 1.2
meters and it was directly in line with a row of plants (Figure 55). The OPAG is equipped with a KBr
beamsplitter and a Stirling-cycle cooled mercury cadmium telluride (MCT) detector. Interferograms
were collected in the range of 4000 to 0 cm–1 at a resolution of 2 cm–1 and at an acquisition mode set
to double-sided forward-backward. The number of scans per measurement was set to 1 and the
measurements were repeatedly collected to obtain a time profile with a resolution (time between
spectra) of 0.53 seconds. Gas samples were pumped into canisters for offline analysis using gas
chromatography. An array of 9 stainless steel tubes were inserted vertically into the fuel bed. A sample
of the flaming gases was collected in one canister initially from one tube and a sample of pyrolysis
gases was collected from the other 6 tubes sequentially as the flame front moved horizontally along
the fuel bed.
Figure 3 - Setup of 3 instruments used to measure composition of gaseous pyrolysis products in mixed fuel beds of
longleaf pine needles and small shrubs.
Mass of a single plant, air temperature and relative humidity within the wind tunnel and in the larger
combustion room were sampled at 1 hz during each experimental fire. While we have used a variety
of techniques previously to describe the flow field around experimental laboratory fires, the use of
smoke tracers and introduced particles was precluded by the gas sampling objective. The TPIV
technique (Zhou et al. 2003) could not be used because the large glass windows in the wind tunnel are
opaque to the infrared spectrum. The backgound-oriented Schlieren (BOS) approach was selected to
determine the flow field in the flame and surrounding the plants (Raffel 2015). The BOS setup (Figure
) was located upwind of the PNNL gas sampling instruments (Figure 55). Total and radiant heat fluxes
at the top of the fuel bed were measured using a Schmidt-Boelter type of sensor. A stereo pair of
vertical photographs of each fuel bed were taken before and after each experimental fire to develop 3-

Advances in Forest Fire Research 2018 - D. X. Viegas (Ed.)
Chapter 3 – Fire Management
Advances in Forest Fire Research 2018 – Page 313
D images of the fuel bed. A longwave infrared (LWIR) camera provided a nadir view of the fuel bed
and measured radiance from the fuel bed will be converted into temperature.
A trial deployment was performed in May 2017 at Ft. Jackson (Figure ). The forest structure was
characterized from Ft. Jackson’s existing airborne LiDAR data using a canopy height model (Silva et
al. 2016) for the tree overstory and rasterized metrics for the shrub understory (Hudak, Dickinson, et
al. 2016; Hudak, Bright, et al. 2016). Destructive fuel sampling methods, 3D measurement of forest
and understory vegetation structure using an unmanned autonomous system (UAS), heat flux
measurement, and pyrolysis gas sampling were tested during the trial deployment. Burn plots were
characterized non-destructively in 3D using terrestrial lidar scans (TLS) and UAS remote sensing tools
and destructively in adjacent small fuel sample plots to describe the spatial distribution of fuel
elements. TLS of the small fuel plots were collected from multiple view perspectives to characterize
3D fuel distributions in 10-cm voxels (volumetric pixels), before and after burning. A digital camera
mounted on a UAS collected stereo color imagery from overhead perspectives. These metrics serve as
independent variables for predicting fuel loads measured in the traditional destructive sample plots
pre- and post-fire in units of kg m-2.
Figure 4 - Fuel bed composed of longleaf pine needles and Lyonia lucida plants. Sample probe to collect pyrolysis
gases for the Bruker Tensor 37 is indicated by the arrow.
As pyrolysis gases have never been measured to our knowledge in a field setting, we used a metal
probe to sample emitted pyrolysis products very close to the fire. The probe is a variable length (1-4
m) stainless steel tube connected by flexible stainless steel hose to a manifold, from which a canister
system, real time gas sensors, and particulate matter (PM) filter samplers draw pyrolysis emissions
downstream from the flame. CO2 and CO were measured in-situ at a 1 Hz sample rate by their
respective sensors. Hydrogen, methane and C2 – C6 alkanes, alkenes and aromatic compounds of
smoke samples collected in canisters will be measured by gas chromatography. For the trial
deployment, the focus was determining how close personnel could get to the fire in personal protective
equipment to capture samples of pyrolysis gases (Figure 57).
Prior work by the modeling team has examined the ability of the Fire Dynamics Simulator (FDS)
coupled with the GPyro pyrolysis model to simulate pyrolysis, ignition and burning of single leaf
particles (Yashwanth et al. 2015, 2016) and the ability of the Wildland Urban Interface extension of
FDS (WFDS) to model ignition of many leaf particles (Anand et al. 2017). Significant improvements
have been made to the modeling of convective ignition of leaves in the BYU flat-flame burner by
Gpyro3D-FDS (Shotorban et al. 2018). One of the improvements included a new rigorous formulation
for the calculation of the mean porosities in the computational cells of Gpyro to account for the net

Advances in Forest Fire Research 2018 - D. X. Viegas (Ed.)
Chapter 3 – Fire Management
Advances in Forest Fire Research 2018 – Page 314
volume reduction that the condensed (solid) phase experiences within the computational cells during
moisture evaporation and pyrolysis. Another improvement was the use of a more advanced pyrolysis
mechanism in Gpyro to include the main constituents of biomass, i.e., cellulose, hemicellulose and
lignin at virgin and active states in the dry mass. In addition, the modeled leaf now matches the
measured manzanita leaf dimensions much better than in the previous modeling work (Yashwanth et
al. 2016). These improvements were necessary in order to model the pyrolysis experiments that are
being performed at BYU.
Figure 5 - Simple schematic of background-oriented Schlieren configuration used to nonintrusively estimate the flow
field surrounding pyrolyzing plants. 𝒁𝑫 is the distance of the flame from the background noise pattern, 𝒁𝑩 is the
distance of the camera lens from the background, 𝝐𝒚 represents the deflection angle caused by the flame-generated
distortion, 𝑳 is the flame zone width, 𝒇 is the focal length of the camera, 𝜟𝒚′ represents displacement in the camera
sensor plane and 𝜟𝒚 represents displacement in the background plane.
The computational configuration resembles the experimental setup of (Pickett et al. 2010). The
burner and the gas phase combustion within the burner was not modeled; the convective heating effect
is modeled through the introduction of heated air at 1100 °C which reduces to around 1000 °C at 5 cm
above the burner which is consistent with experimental measurements. As the initial condition, the
leaf was assumed to consist of moisture and dry mass with standard air in the pores. The initial mass
fraction of moisture was determined by the fuel moisture content. Initial dry mass consisted of 33%
cellulose, 33% hemicellulose and 34% lignin which differ by 1% from the experiments. These slight
differences had barely observable effect on the simulation results. The initial temperature was set to
an ambient temperature of 300 K. A 10-step reaction mechanism (Miller and Bellan 1997) was used
for the dry fuel; each of the dry species underwent three primary reactions of conversion from a virgin
state to an active state, from the active state to char and pyrolyzate gases, and from the active state to
tar, and a secondary reaction for breakdown of tar to pyrolyzate. A single step reaction was used for
moisture evaporation (Bryden and Hagge 2003). A stoichiometric reaction between methane and air
was used to model the combustion of the pyrolyzate gas in FDS.
As previously stated, details of the fast pyrolysis experiments are presented elsewhere. Preliminary
results from the wind tunnel experiments are presented as a poster in this conference (Weise et al.
2018). From the pilot field experiment, fuel loading was dominated by litter and duff ranging from 2.8
to 8.7 and from 3.2 to 10.2 Mg ha-1, respectively. The consumption of the fuel bed categories followed

Advances in Forest Fire Research 2018 - D. X. Viegas (Ed.)
Chapter 3 – Fire Management
Advances in Forest Fire Research 2018 – Page 315
similar trends with the most consumption occurring in the litter and duff categories. Fuel moisture
content ranged from 8.6% for the litter to 175.2% for the shrub fuels bed categories just prior to
ignition. It was a challenge in the field to sample the point and time of pyrolysis – the flame is not an
even front when it hits the plant but a matrix of different branches catching fire (Figure 58). Also the
time of capture for the pyrolysis emissions is short so the actual volume of a good sample is very small.
Some of the pyrolysis samples collected had very high H2 and CO levels indicating that we probably
did measure some pyrolysis emissions. These measurements will be compared with the regular smoke
samples of flaming combustion that were collected.
Figure 6 - Individual tree crowns in and around the May 2017 trial deployment plots derived from airborne LiDAR
data.
Figure 7 - Rigid tubing (“fishing pole”) used to sample pyrolysis gases produced by heated sparkleberry during May
2017 trial deployment at Ft. Jackson, South Carolina, USA.
Advances in Forest Fire Research 2018 - D. X. Viegas (Ed.)
Chapter 3 – Fire Management
Advances in Forest Fire Research 2018 – Page 316
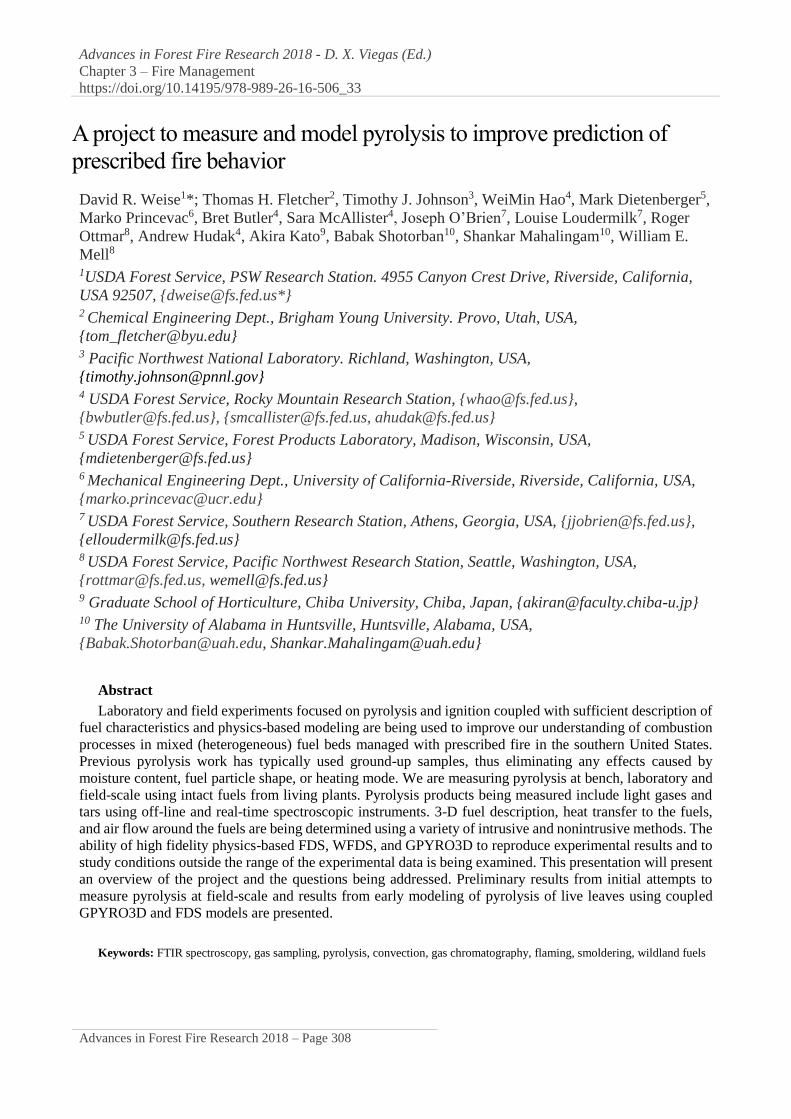
Figure 8 - Typical range in fire behavior observed on low density plot burned May 2017 at Ft. Jackson, SC.
The pyrolysis mechanism included in Gpyro was initially validated against published experimental
and computational TGA results. The burning of leaf-like fuels with three initial fuel moisture content
(FMC) of 40%, 76%, and 120% was modeled. The time evolutions of the normalized mass were good
for the modeled fuels with 76% and 120% FMCs and fair for the one with a 40% FMC when compared
to the experimental burning results of four manzanita leaves with unspecified FMCs. The computed
ignition time was also in good agreement with the measurement. The computed burnout time was
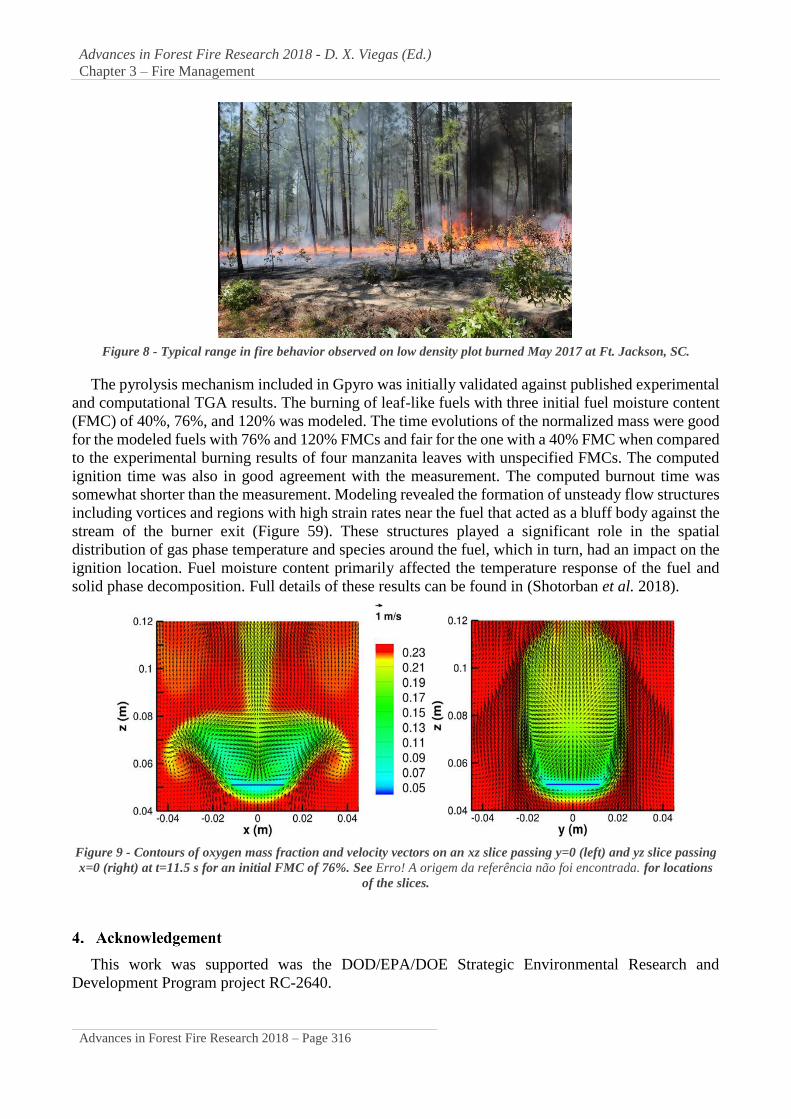
somewhat shorter than the measurement. Modeling revealed the formation of unsteady flow structures
including vortices and regions with high strain rates near the fuel that acted as a bluff body against the
stream of the burner exit (Figure 59). These structures played a significant role in the spatial
distribution of gas phase temperature and species around the fuel, which in turn, had an impact on the
ignition location. Fuel moisture content primarily affected the temperature response of the fuel and
solid phase decomposition. Full details of these results can be found in (Shotorban et al. 2018).
Figure 9 - Contours of oxygen mass fraction and velocity vectors on an xz slice passing y=0 (left) and yz slice passing
x=0 (right) at t=11.5 s for an initial FMC of 76%. See Erro! A origem da referência não foi encontrada. for locations
of the slices.
This work was supported was the DOD/EPA/DOE Strategic Environmental Research and
Development Program project RC-2640.

Advances in Forest Fire Research 2018 - D. X. Viegas (Ed.)
Chapter 3 – Fire Management
Advances in Forest Fire Research 2018 – Page 317
Anand C, Shotorban B, Mahalingam S, McAllister S, Weise DR (2017) Physics-based modeling of
live wildland fuel ignition experiments in the forced ignition and flame spread test apparatus.
Combustion Science and Technology 189, 1551–1570. doi:10.1080/00102202.2017.1308357.
Bryden KM, Hagge MJ (2003) Modeling the combined impact of moisture and char shrinkage on the
pyrolysis of a biomass particle☆. Fuel 82, 1633–1644. doi:10.1016/S0016-2361(03)00108-X.
Cobian-Iñiguez J, Aminfar A, Chong J, Burke G, Zuniga A, Weise DR, Princevac M (2017) Wind
tunnel experiments to study chaparral crown fires. Journal of Visualized Experiments 1–14.
doi:10.3791/56591.
Fletcher TH, Safdari M-S, Amini E, Weise DR (2018) Bench-scale measurement of pyrolysis products
from intact live fuels. In ‘Adv. For. Fire Res. 2018’, Coimbra, Portugal. 3. (Coimbra University
Press: Coimbra, Portugal)
Griffith DWT (1996) Synthetic calibration and quantitative analysis of gas-phase FT-IR spectra.
Applied Spectroscopy 50, 59–70. doi:10.1366/0003702963906627.
Hudak AT, Bright BC, Pokswinski SM, Loudermilk EL, O’Brien JJ, Hornsby BS, Klauberg C, Silva
CA (2016) Mapping Forest Structure and Composition from Low-Density LiDAR for Informed
Forest, Fuel, and Fire Management at Eglin Air Force Base, Florida, USA. Canadian Journal of
Remote Sensing 42, 411–427. doi:10.1080/07038992.2016.1217482.
Hudak AT, Dickinson MB, Bright BC, Kremens RL, Loudermilk EL, O’Brien JJ, Hornsby BS, Ottmar
RD (2016) Measurements relating fire radiative energy density and surface fuel consumption –
RxCADRE 2011 and 2012. International Journal of Wildland Fire 25, 25–37.
Johnson TJ, Sharpe SW, Covert MA (2006) Disseminator for rapid, selectable, and quantitative
delivery of low and semivolatile liquid species to the vapor phase. Review of Scientific Instruments
77, 094103. doi:10.1063/1.2349298.
Mertz L (1967) Auxiliary computation for Fourier spectrometry. Infrared Physics 7, 17–23.
doi:10.1016/0020-0891(67)90026-7.
Miller RS, Bellan J (1997) A generalized biomass pyrolysis model based on superimposed cellulose,
hemicellulose and liqnin kinetics. Combustion Science and Technology 126, 97–137.
doi:10.1080/00102209708935670.
Pickett BM, Isackson C, Wunder R, Fletcher TH, Butler BW, Weise DR (2010) Experimental
measurements during combustion of moist individual foliage samples. International Journal of
Wildland Fire 19, 153–162. doi:10.1071/WF07121.
Raffel M (2015) Background-oriented schlieren (BOS) techniques. Experiments in Fluids 56,.
doi:10.1007/s00348-015-1927-5.
Safdari M-S, Rahmati M, Amini E, Howarth JE, Berryhill JP, Dietenberger M, Weise DR, Fletcher
TH (2018) Characterization of pyrolysis products from fast pyrolysis of live and dead vegetation
native to the Southern United States. Fuel 229, 151–166. doi:10.1016/j.fuel.2018.04.166.
Shotorban B, Yashwanth BL, Mahalingam S, Haring DJ (2018) An investigation of pyrolysis and
ignition of moist leaf-like fuel subject to convective heating. Combustion and Flame 190, 25–35.
doi:10.1016/j.combustflame.2017.11.008.
Silva CA, Hudak AT, Vierling LA, Loudermilk EL, O’Brien JJ, Hiers JK, Jack SB, Gonzalez-Benecke
C, Lee H, Falkowski MJ, Khosravipour A (2016) Imputation of individual longleaf pine ( Pinus
palustris Mill.) tree attributes from field and LiDAR data. Canadian Journal of Remote Sensing 42,
554–573. doi:10.1080/07038992.2016.1196582.
Weise DR, Johnson TJ, Hao WM, Princevac M, Scharko N, Oeck A, Myers TL, Baker S, Lincoln E,
Aminfar AH (2018) Measurement of pyrolysis products from mixed fuel beds during fires in a wind

Advances in Forest Fire Research 2018 - D. X. Viegas (Ed.)
Chapter 3 – Fire Management
Advances in Forest Fire Research 2018 – Page 318
tunnel. In ‘Adv. For. Fire Res. 2018’, Coimbra, Portugal.(Coimbra University Press: Coimbra,
Portugal)
Yashwanth BL, Shotorban B, Mahalingam S, Lautenberger CW, Weise DR (2016) A numerical
investigation of the influence of radiation and moisture content on pyrolysis and ignition of a leaf-
like fuel element. Combustion and Flame 163, 301–316. doi:10.1016/j.combustflame.2015.10.006.
Yashwanth BL, Shotorban B, Mahalingam S, Weise DR (2015) An investigation of the influence of
heating modes on ignition and pyrolysis of woody wildland fuel. Combustion Science and
Technology 187, 780–796. doi:10.1080/00102202.2014.973948.
Yokelson RJ, Griffith DWT, Ward DE (1996) Open-path Fourier transform infrared studies of large-
scale laboratory biomass fires. Journal of Geophysical Research 101, 21067.
doi:10.1029/96JD01800.
Zhou X, Sun L, Mahalingam S, Weise DR (2003) Thermal particle image velocity estimation of fire
plume flow. Combustion Science and Technology 175, 1293–1316. doi:10.1080/00102200302376.


![How to Measure & Improve Quality of Hire [Webcast]](https://img.dokumen.tips/doc/110x75/58aa778b1a28abbc1e8b6139/how-to-measure-improve-quality-of-hire-webcast.jpg)