Embed Size (px)
Citation preview

A PROFILE OF THE SOUTH AFRICAN HIDES, SKINS AND LEATHER MARKET VALUE CHAIN
2016
Directorate Marketing Tel: 012 319 8455 Private Bag X 15 Fax: 012 319 8131 Arcadia E-mail:[email protected] 0007 www.daff.gov.za

2
Table of Contents 1. DESCRIPTION OF THE INDUSTRY. 3
2. PRODUCTION, PRICES AND CHANGES IN EMPLOYMENT IN HIDES, SKINS AND LEATHER
INDUSTRY 4
2.1 Production bovine (cattle) hides 4
2.2 Prices of skins, hides and leather (2014) 4
3. EXPORTS VOLUMES 5
3.1 Share Analysis 29
4. IMPORTS VOLUMES OF RAW HIDES & SKINS 34
4. IMPORT VOLUMES OF LEATHER (FURTHER PREPARED) 38
5. SKINS, HIDES AND LEATHER VALUE CHAIN 43
6. BLACK ECONOMIC EMPOWERMENT 45
7. MARKET ACCESS 45
7.1. Export tariffs of hides and skins during 2014 45
7.2 Non–tariff barriers (NTB) 45
7.2.1 European Union 46
7.2.2. Japan 47
7.2.3 China 47
7.2.4 United States of America 48
7.3 Import tariffs of raw skins, hides and leather 48
8. MARKET INTELLIGENCE 50
9. GOVERNMENT SUPPORT 73
10. APPENDIX A: GOODS AND FOOTWEAR LEATHER 74
11. APPENDIX B: AUTOMOTIVE LEATHER 74
13. APPENDIX C: SOUTH AFRICAN TANNARIES 75
14. APPENDIX D: INDUSTRY ASSOCIATIONS 76
15. ACKNOWLEDGEMENTS 78

1. DESCRIPTION OF THE INDUSTRY. Hides, skins and leather are by-products of farming stock and wild animals bred primarily for meat consumption. Thus, hides and skins are mainly recovered from slaughterhouses and farms. Because the leather industry depends on the recovery of hides and skins of the farming stock and wild animals, availability of raw material directly depends on the size of the animal population, the take-off ratio and the weight/size of the hide/skin recovered. The quality of South African hides has been positively influenced by the rise in the number of feedlots operating in the meat industry, with animals thus spending less time in the open veldt. These hides are rated to be superior to other sub-Saharan African and most Asian hides, but inferior to most hides from Australia, Argentina, the US and Europe. Their relatively small size compared with the last two origins (3.5 to 4m2) and the use of non-hump breeds that produce large panels renders them just marginally suited for upholstery and automotive leather. Over 65% of South African hides are regarded as suitable for automotive leather. In South Africa skins and hides are given the following status types when they leave the abattoir:
a. Gold status. This is the skin or hide that had been sourced from an approved registered abattoir where ante– and
post–mortem examinations are routinely performed. These skins and hides must not originate from OIE recognized foot and mouth disease controlled areas of the Limpopo, Mpumalanga, KwaZulu– Natal or the Kruger National Park
b. Silver status. This is the skin or hide that had been sourced from an approved registered abattoir anywhere in
South Africa where ante– and post–mortem examinations are routinely performed. c. Bronze status. This is the skin or hide that had been sourced from an unapproved or unregistered abattoir without
veterinary health certificate and/or original status has been compromised and/or exposed to contagion.
Skins and hides are derived mainly from livestock and to a lesser extent from wild animals and reptiles. The following are the main categories of skins or hides according to species. Bovine (cattle) hide. Bovine hides dominate the supply of leather in South Africa. They are mainly by-product of meat production supplied by feedlots. Sheep skin. It is produced with or without wool mainly for export market. Pig skin. South Africa does not have significant supply of pig skin as this tends to be part of the meat. Goat and kid skin leather. The supply of goat and kid skins is low as the majority of goats are slaughtered outside the abattoirs. Ostrich skins.

4
Unlike bovine, ostrich is bred primarily for its skin; and ostrich meat becomes a by-product. Ostrich leather is unique with its feather quill pattern. This gives it extra strength and durability which is 7 times stronger than bovine (cattle) hide. Ostrich leather is used to produce handbags, wallets, shoes, clothing etc. Skins of wild animals. Many wild animals including elephants and buffalo are main sources of leather. Skin of reptiles. Crocodiles and snakes are bred for their skins.
2. PRODUCTION, PRICES AND CHANGES IN EMPLOYMENT IN HIDES, SKINS AND LEATHER INDUSTRY Hides and skins are inputs to the leather industry. The bulk of hides and skins are recovered from abattoirs. South Africa slaughters over 2 million cattle and over 4 million sheep every year. The availability of these products depends on the size of the slaughter facility and the species involved. Ostrich skins are mainly produced in Western Cape. Prices of hides are higher in South Africa than in other countries. This is because of the increase in demand of local hides caused by the Motor Industry Development Program (MIDP) which was introduced in 1995 and it was scheduled to come to an end in 2012. The key component of the MIDP with regards to automotive upholstery is that it contained an import-export complementation scheme that gave credits to component manufacturers and assemblers for any exported goods. These credits, which are transferable, could then be used by assemblers to offset the duty on parts or vehicles that they wanted to import. Export of stitched leather seat covers responded positively to this incentive and increased the demand for local hides and skins. 2.1 Production bovine (cattle) hides Hides are by-products of the livestock (cattle) industry. The availability of hides and skins depends on the number of cattle slaughtered. Both in beef and dairy businesses, hides and skins are recovered and taken to firms for further processing. Interestingly Eastern Cape is the biggest producer of livestock but the bulk of the hides come from Mpumalanga, Gauteng, Free State and Kwazulu–Natal as they have big abattoirs. 2.2 Prices of skins, hides and leather (2015) Table 1 below indicates different types of skins, hides and leather and unit prices of different products as indicated in the first column and second column. The prices indicates the 2014 and 2015 marketing season but are subject to change due to the fluctuations in terms of the rand, demand and supply forces. Table 1: Prices of skins, hides and leather (2015 marketing season)
Type of Skins, Hides & Leather Prices per skin
Merino dry sheep skin R15.00 – R20.00 /skin
Short wool skin R10.00 – R15.00/skin
Sheared wool skin R25.00 - 30.00/skin
Cattle dry skin R7.00 - R8.50 per kilogram
Ostrich skins R1000-R1500 / kilogram
Goat dry skin R15.00 – R20.00/skin
Goat skin after tanning R40.00 / skin
Impala (grade 1) R15.00 – R20.00/skin
Bless Bok / Springbok (grade 1) R15.00 – R20.00/skin Sources: Skin, Hides & Leather Council, Klein Karoo International Ltd, IMPEC (Integrated Meat Processors of the Eastern Cape)

5
3. EXPORT VOLUMES OF RAW HIDES AND SKINS The raw skins, hides and leather industry are also an important earner of foreign exchange through the export of raw leather and tanned leather. The industry exports mainly to Europe (Italy, Turkey and Germany) and to Asia (Japan, Republic of Korea, Hong Kong and China. Leather articles are classified as a luxury goods and thus by definition it follows that consumers’ demand for leather products is related to their disposable income. This implies that the absolute demand for leather products is greater, but also, the market for leather products is broader based in developed compared to developing countries. The developing nations mainly produce under license from developed countries’ retailers/ buyers in accordance to their specifications. Figure 1 below shows some trends in raw hides and skins exports to the world over a ten year period. Figure 1 below indicates export volumes of raw hides and skins from South Africa to various regions of the world between 2006 and 2015.
Source: Quantec EasyData
The graph further indicates that during the period under scrutiny, the major export market for raw hides and skins from South Africa to the world was Asia, followed by Europe. Africa and Americas experienced very low levels of exports of raw hides and skins from South Africa to low levels of between 1 and 65 tons per annum. The graph also indicates that on average, South Africa exported 1 590 tons to the world over the past decade. The graph further indicates that export volumes of raw hides and skins from South Africa to Asia started to increase substantially in 2009 until a peak was attained in 2010 at an export quantity of approximately 2 651 tons. The figure also indicates that export volumes of raw hides and skins from South Africa to Europe started to increase substantially in 2007 and at the same time attained a peak at an export quantity of approximately 873 tons. It is evident that export volumes of raw hides and skins from South Africa to Asia experienced a dramatic decline between 2006 and 2008 to lower levels of approximately 100 tons in 2006. The graph further indicates that there was a 7.3% increase in export volumes of raw hides and skins from South Africa to Asia in 2015 as compared to 2014 marketing season. Figure 2 below depicts export volumes of raw hides and skins from South Africa to Africa between 2006 and 2015.
2006 2007 2008 2009 2010 2011 2012 2013 2014 2015
Africa 0 0 11 4 0 0 21 15 65 71
Americas 0 0 0 10 0 1 0 2 1 1
Asia 100 528 553 1932 2651 312 906 1297 1846 1710
Europe 373 873 59 253 545 214 239 353 384 491
Oceania 0 0 0 0 0 0 0 0 0 74
0
500
1000
1500
2000
2500
3000
Exp
ort
qu
anti
ty(t
on
s)
Period (Years)
Figure 1: Export volumes of raw hides and skins to the world

6
Source: Quantec EasyData
The graph further depicts that most of raw hides and skins exports from South Africa to Africa went to the SACU region excluding RSA over the past decade. The graph also depicts that export volumes of raw hides and skins from South Africa to SACU region excluding RSA started to increase substantially in 2014 to 2015 and at the same time attained a peak at an export quantity of about 65 tons. It is further evident that between 2006 and 2011, there were no exports of raw hides and skins from South Africa to SACU region excluding RSA, while there were no export volumes of raw hides and skins from South Africa to SADC between 2006 and 2007 and again between 2010 and 2011 of the period under examination. Export volumes of raw hides and skins from South Africa to SADC were not more than 20 tons per annum. The graph further depicts that there was no growth (0.00%) in export volumes of raw hides and skins from South Africa to SACU region excluding RSA in 2015 as compared to 2014 marketing season. Figure 3 below illustrates export volumes of raw hides and skins from South Africa to the Americas between 2006 and 2015.
Source: Quantec EasyData
The figure further illustrates that most of raw hides and skins exports from South Africa to Americas went to NAFTA, followed by very intermittent volumes from South America over the past ten years. The figure also
2006 2007 2008 2009 2010 2011 2012 2013 2014 2015
SADC (excluding SACU) 0 0 11 4 0 0 20 0 0 6
SACU (Excluding RSA) 0 0 0 0 0 0 1 15 65 65
0
10
20
30
40
50
60
70
Exp
ort
qu
anti
ty (
ton
s)
Period (Years)
Figure 2: Export volumes of raw hides and skins to Africa
2006 2007 2008 2009 2010 2011 2012 2013 2014 2015
NAFTA 0 0 0 10 0 1 0 2 1 1
0
2
4
6
8
10
12
Exp
ort
qu
anti
ty (
ton
s)
Period (Years)
Figure 3: Export volumes of raw hides and skins to Americas

7
illustrates that export volumes of raw hides and skins from South Africa to NAFTA started to increase substantially in 2010 and at the same time attained a peak at an export volume of about 10 tons. It is also evident that in 2011 and 2015, exports of raw hides and skins to NAFTA declined dramatically to levels of about 1 ton per annum. Between 2006 and 2008 and again in 2010 and 2012, there were no export volumes of raw hides and skins from South Africa to NAFTA. The figure further illustrates that South America experienced very low or minimal export volumes of raw hides and skins from South Africa during the period under examination of not more than 1 ton per annum. The figure also illustrates that there was no growth (0.00%) in export volumes of raw hides and skins from South Africa to NAFTA in 2015 as compared to 2014 marketing season. Figure 4 below shows export volumes of raw hides and skins from South Africa to Asia between 2006 and 2015.
Source: Quantec EasyData
The figure further shows that the major export market for raw hides and skins from South Africa to Asia was Eastern Asia, followed by South-eastern Asia over the past decade. South-central Asia and Western Asia had very low / intermittent exports of raw hides and skins from South Africa between 2006 and 2015. The figure also shows that export volumes of raw hides and skins from South Africa to Eastern Asia were from a high base during the second half of the ten year period (2011-2015) attaining a peak in 2014 at approximately 1 585 tons. The figure further shows that export volumes of raw hides and skins from South Africa to South-eastern Asia attained a peak in 2010 at an export quantity of about 2 396 tons. The figure further shows that there was 8.39% decrease in export volumes of raw hides and skins from South Africa to Eastern Asia in 2015 as compared to 2014 marketing season. Figure 5 below depicts export volumes of raw hides and skins from South Africa to Eastern Asia between 2006 and 2015.
2006 2007 2008 2009 2010 2011 2012 2013 2014 2015
Eastern Asia 87 125 185 833 237 123 815 1054 1585 1452
South-central Asia 11 33 51 177 18 128 83 122 124 73
South-eastern Asia 2 292 317 919 2396 0 0 100 109 159
Western Asia 0 78 0 4 0 61 8 20 28 26
0
500
1000
1500
2000
2500
3000
Exp
ort
qu
anti
ty (
ton
s)
Period (Years)
Figure 4: Export volumes of raw hides and skins to Asia

8
Source: Quantec EasyData
The figure further depicts that most of raw hides and skins exports from South Africa to Eastern Asia went to Hong Kong Region of China, followed by very low or minimal levels of exports of raw hides and skins from South Africa to China over the past decade. The figure also depicts that exports of raw hides and skins from South Africa to Hong Kong Region of China were from a high base during the second half of the ten year period (2011-2015) attaining a peak in 2013 at approximately 861 tons. The figure further depicts that exports of raw hides and skins from South Africa to China were from a high base during the second half of the ten year period (2011-2015) attaining a peak in 2015 at approximately 1 234 tons. The figure also depicts that there was an increase of 29.7% in export volumes of raw hides and skins from South Africa to Hong Kong Region of China in 2015 as compared to 2014 marketing season. The figure further depicts that there was a 29.7% increase in export volumes of raw hides and skins from South Africa to China in 2015 as compared to 2014 marketing season. Figure 6 below indicates export volumes of raw hides and skins from South Africa to Europe between 2006 and 2015.
Source: Quantec EasyData
2006 2007 2008 2009 2010 2011 2012 2013 2014 2015
China 84 125 61 519 21 0 106 193 951 1234
Hong Kong Special AdministrativeRegion of China
0 0 104 313 130 123 708 861 634 140
0
200
400
600
800
1000
1200
1400
Exp
ort
qu
anti
ty (
ton
s)
Period (Years)
Figure 5: Export volumes of raw hide and skins to Eastern Asia
2006 2007 2008 2009 2010 2011 2012 2013 2014 2015
European Union 373 873 59 253 545 214 239 353 384 491
0
100
200
300
400
500
600
700
800
900
1000
Exp
ort
qu
anti
ty (
ton
s)
Period (Years)
Figure 6: Export volumes of raw hides and skins to Europe

9
The figure further indicates that during the period under observation, most of raw hides and skins exports from South Africa to Europe went mainly to the European Union with no competition from other European regions. The figure also indicates that export volumes of raw hides and skins from South Africa to the European Union started to increase substantially in 2007 and at the same time attained a peak at an export quantity of 873 tons. During the ten year period under review, export volumes of raw hides and skins from South Africa to the European Union experienced a dramatic decline to lower levels of about 59 tons in 2008. Although exports of raw hides and skins from South Africa to the European Union were declining, there was a notable increase in 2010 of about 545 tons. The figure also indicates that there was 27.8% increase in export volumes of raw hides and skins from South Africa to the European Union in 2015 as compared to 2014 marketing season. Graph 7 below depicts export volumes of raw hides and skins from South Africa to the European Union over a ten year period.
Source: Quantec EasyData
The graph further depicts that the major export destinations for raw hides and skins from South Africa to the European Union was mainly Italy, followed by Greece and United Kingdom over the past ten years. It is clear and evident in the graph that between 2005 and 2006, exports of raw hides and skins from South Africa to Italy experienced an increase of about 275 tons until a peak was attained in 2007 at approximately 818 tons. The graph also depicts that between 2008 and 2015, exports of raw hides and skins from South Africa to Italy dropped to below 369 tons per annum. The graph further depicts that there was a slight increase of about 29.6% in export volumes of raw hides and skins from South Africa to Italy in 2015 as compared to 2014 marketing season. Figure 8 below clearly shows export volumes of raw hides and skins from South Africa to Oceania between 2006 and 2015.
2006 2007 2008 2009 2010 2011 2012 2013 2014 2015
Germany 0 1 0 0 0 0 0 0 0 0
United Kingdom 98 0 0 0 0 0 0 0 0 0
Greece 0 0 0 10 177 169 186 280 292 344
Italy 275 818 59 243 368 46 52 72 81 105
Netherlands 0 0 0 0 0 0 0 0 0 0
0
100
200
300
400
500
600
700
800
900
Exp
ort
qu
anti
ty (
ton
s)
Period (Years)
Figure 7: Export volumes of raw hides and skins to Europen Union

10
Source: Quantec EasyData
The figure further shows that most of raw hides and skins exports from South Africa to Oceania went mainly to Australia and New Zealand with no competition from other Oceania regions. The figure also shows that export volumes of raw hides and skins from South Africa to Australia and New Zealand were from a high base during the second half of the ten year period (2011-2015) attaining a peak in 2013 at approximately 0.2 tons. The figure further shows that between 2006 and 2014, there were no export volumes of raw hides and skins from South Africa to Australia and New Zealand. The figure shows that the export volumes of raw hides and skins started in 2015 and at the same time attained a peak of approximately 74 tons. The figure also shows that there was 100% increase in export volumes of raw hides and skins from South Africa to Australia and New Zealand in 2015 as compared to 2006 marketing season. Figure 9 below clearly illustrates export values of raw hides and skins by Provinces of South Africa to the world between 2006 and 2015.
Source: Quantec EasyData
2006 2007 2008 2009 2010 2011 2012 2013 2014 2015
Australia and New Zealand 0 0 0 0 0 0 0 0 0 74
0
10
20
30
40
50
60
70
80
Exp
ort
qu
anti
ty (
ton
s)
Period (Years)
Figure 8: Export volumes of raw hides and skins to Oceania
2006 2007 2008 2009 2010 2011 2012 2013 2014 2015
Western Cape 3930603 13837173 9570838 2480129 10425637 28748297 35739715 50684785 84136056 128756218
Eastern Cape 58544463 76903571 65401913 61891080 105715941 116752086 181537809 345280079 331270316 357989068
Northern Cape 0 0 0 0 0 0 0 4240 0 0
Free State 2602249 1972578 2291132 0 2051036 0 0 1203773 55923999 16688343
KwaZulu-Natal 7539860 21459400 6896482 14729843 22225310 29560223 50159365 105465912 81779054 62413787
North West 11235612 8207483 25162833 41035801 43224909 5018521 13683891 26652168 18357514 12822251
Gauteng 10121254 11018648 20045184 15682563 11268975 6850694 6261167 6469996 5995268 34283486
Mpumalanga 18088 0 12042 2250263 0 0 0 3975 0 0
Limpopo 969149 3413346 207597 4724831 174122 0 0 164 0 0
0
50000000
100000000
150000000
200000000
250000000
300000000
350000000
400000000
Exp
ort
val
ue
(Ran
ds)
Period (Years)
Figure 9: Value of raw hides and skins exports by Provinces

11
The figure further illustrates that over the past decade, most of raw hides and skins exports in value from South Africa to the world were from the Eastern Cape Province, followed by KwaZulu-Natal, Western Cape and North West Provinces. The figure also illustrates that export values of raw hides and skins from the Eastern Cape Province to the world started to increase in 2012 at about R181 million until a peak was attained in 2015 at an export value of R357 million. The figure further illustrates that export values of raw hides and skins from KwaZulu-Natal Province to the world attained a peak also in 2013 at an export value of R105 million, while Western Cape Province attained a peak in 2015 at an export value of approximately R128 million. Export values of raw hides and skins from North West Province to the world attained a peak also in 2010 at an export value of R43.2 million. All the other remaining provinces had very low or minimal levels of exports of raw hides and skins from South Africa to the world of not more than R58 million per annum during the same period under scrutiny. The figure also illustrates that there was an increase of 8% in exports value of raw hides and skins from Eastern Cape Province to the world in 2015 as compared to 2014 marketing season. Figure 10 below indicates export values of raw hides and skins from Eastern Cape Province to the world between 2006 and 2015.
Source: Quantec EasyData
The graph further indicates that most of raw hides and skins exports in value from Eastern Cape Province to the world were mainly from Nelson Mandela Metropolitan Municipality during the period under examination, with very intermittent exports from Cacadu District and Buffalo City Metropolitan Municipalities. It is also evident that during the period under observation, exports of raw hides and skins from the Nelson Mandela Metropolitan municipality to the world were from a high base during the second half of the ten year period (2011-2015) attaining a peak in 2015 at approximately R353 million. The graph also indicates that between 2005 and 2012, export values of raw hides and skins from the Nelson Mandela Metropolitan Municipality to the world experienced a down-turn and were not more than R178 million per annum. The graph further indicates that there was a decline of 9.2% in exports value of raw hides and skins from Nelson Mandela Metropolitan Municipality to the world in 2015 as compared to 2014 marketing season. Figure 11 below clearly depicts export values of raw hides and skins from North West Province to the world between 2006 and 2015.
2006 2007 2008 2009 2010 2011 2012 2013 2014 2015
Cacadu 766417 7375 41787 0 337098 0 0 0 161000 0
Nelson Mandela Bay 57550061 76896196 65360126 61732849 102236290 109962420 178490958 336301378 324227003 353949025
Buffalo City 227985 0 0 158231 3142553 6789666 3046851 8978701 6882313 4040043
0
50000000
100000000
150000000
200000000
250000000
300000000
350000000
400000000
Exp
ort
val
ue
(Ran
ds)
Period (Years)
Figure 10: Value raw hides and skins exports by Eastern Cape Province

12
Source: Quantec EasyData
The graph further depicts that during the period under examination, Bojanala District Municipality was the main exporter of raw hides and skins in value from North West Province to the world, followed by Dr. Ruth Segomotsi Mompati District Municipality. The graph also depicts that export values of raw hides and skins from Bojanala District Municipality to the world were generally high throughout the period under scrutiny attaining a peak in 2015 at an export value of approximately R38.1 million. The graph further depicts that export values of raw hides and skins from Dr. Ruth Segomotsi Mompati District Municipality to the world started to increase in 2009 at about 17.8 tons until a peak was attained in 2010 at an export value of about R23.7 million. The graph also depicts that in 2011, there were no export values for raw hides and skins from Bojanala District Municipality to the world, while between 2006 and 2007 and again between 2013 and 2015, there were no exports of raw hides and skins from Dr. Ruth Segomotsi Mompati District Municipality to the world. The graph further depicts that there was an increase of 197% in exports of raw hides and skins from Bojanala District Municipality to the world in 2015 as compared to 2014 marketing season.
Figure 12 clearly reflects export values of raw hides and skins from Gauteng Province to the world between 2006 and 2015.
Source: Quantec EasyData
2006 2007 2008 2009 2010 2011 2012 2013 2014 2015 2016
Bojanala 11235612 8207483 25162009 23174471 19512071 0 12913711 26652168 18357514 12822251 38116446
Dr Ruth SegomotsiMompati
0 0 824 17861330 23712838 5018521 770180 0 0 0 0
0
5000000
10000000
15000000
20000000
25000000
30000000
35000000
40000000
45000000E
xpo
rt v
alu
e(R
and
s)
Period (Years)
Figure 11: Value of raw hides and skins exporta by North West Province
2006 2007 2008 2009 2010 2011 2012 2013 2014 2015
Sedibeng 0 432421 0 688826 1161686 0 0 0 0 0
West Rand 15536 0 52814 9990 65743 20127 51458 54997 52353 0
Ekurhuleni 37685 4200659 2338510 392960 477496 5250237 91897 43634 364378 1933478
City of Johannesburg 5171980 6339549 17653860 14527279 9403558 1141187 6054472 5393068 5068988 7521089
City of Tshwane 4896053 46020 0 63508 160492 439143 63340 978297 509549 24828919
0
5000000
10000000
15000000
20000000
25000000
30000000
Exp
ort
val
ue
(Ran
ds)
Period (Years)
Figure 12: Value of raw hides and skins exports by Gauteng Province

13
The figure further reflects that during the period under observation, most of raw hides and skins exports in value from Gauteng Province to the world were mainly from the City of Johannesburg Metropolitan Municipality, followed by Ekurhuleni and City of Tshwane Metropolitan municipalities. The figure also reflects that over the past decade, export values of raw hides and skins from the City of Johannesburg Metropolitan municipality to the world attained a peak in 2008 at an export value of approximately R17.7 million, while export values of raw hides and skins from Ekurhuleni Metropolitan municipality attained a peak in R4.2 million and the City of Tshwane Metropolitan municipality to the world attained a peak in 2015 at export values of about R24 million. The figure further reflects that export values of raw hides and skins from other districts (Sedibeng and West Rand) to the world were very low and not more than R1.2 million per annum. The figure also reflects that there was an increase of 50% in exports of raw hides and skins from the City of Johannesburg Metropolitan Municipality to the world in 2015 as compared to 2014 marketing season. Figure 13 clearly indicates export values of raw hides and skins from Western Cape Province to the world between 2006 and 2015.
Source: Quantec EasyData
The graph further indicates that during the period under examination, the main exporter of raw hides and skins in value from Western Cape Province to the world was the City of Cape Town Metropolitan Municipality, followed by very low or minimal levels of exports from the West Coast, Cape Winelands and Eden District municipalities. It is evident in the graph that during the period under observation, exports of raw hides and skins from the City of Cape Town Metro municipality to the world started to increase substantially in 2011 with a consistent increase in 2012 and 2013 until a peak was attained in 2015 at an export value of approximately R128 million. The graph also indicates that between 2006 and 2014, exports of raw hides and skins from Eden, West Coast and Cape Winelands District municipalities were from a low base throughout the ten year period under review and not more than R 1.5 million per annum. The graph further indicates that there was an increase of 52% in export value of raw hides and skins from the City of Cape Town Metropolitan Municipality to the world in 2015 as compared to 2014 marketing season. Figure 14 clearly shows export values of raw hides and skins from the Northern Cape Province to the world between 2006 and 2015.
2006 2007 2008 2009 2010 2011 2012 2013 2014 2015
City of Cape Town 2775988 10255146 9507085 2171381 9418623 28619608 35716613 50412629 84127276 128656200
West Coast 922277 1459735 0 260374 0 51000 0 0 0 0
Cape Winelands 7040 10995 39860 48375 17322 55336 2532 54027 8780 40575
Eden 225298 2111297 0 0 989692 22353 20570 218129 0 59443
0
20000000
40000000
60000000
80000000
100000000
120000000
140000000
Exp
ort
Val
ue
(Ran
ds)
Period (Years)
Figure 13: Value of raw hides and skins exports by Western Cape Province

14
Source: Quantec EasyData
The graph further shows that during the period under examination, most of raw hides and skins exports in value from Northern Cape Province to the world were mainly from Frances Baard District Municipality, with no competition from other district municipalities. The graph also shows that exports of raw hides and skins from Frances Baard District Municipality to the world started to increase substantially in 2013 and at the same time attained a peak at an export value of approximately R4 240. The graph further shows that between 2006 and 2012, and again in 2014, there were no exports of raw hides and skins from Frances Baard District to the world. The graph also shows that there was 100% decline in exports of raw hides and skins from Frances Baard District Municipality to the world in 2015 as compared to 2013 marketing season. Figure 15 illustrates export values of raw hides and skins from Mpumalanga Province to the world between 2006 and 2015.
Source: Quantec EasyData
The figure further illustrates that over the past decade, most of raw hides and skins exports in value from Mpumalanga province to the world were mainly from Gert Sibande District Municipality, followed by low or intermittent exports from Ehlanzeni District Municipalities. The figure also illustrates that exports of raw hides and skins from Gert Sibande District Municipality to the world started to increase substantially in 2009 and at the same time attained a peak at an export value of approximately R2.2 million. The figure further illustrates
2006 2007 2008 2009 2010 2011 2012 2013 2014 2015
Frances Baard 0 0 0 0 0 0 0 4320 0 0
0
500
1000
1500
2000
2500
3000
3500
4000
4500
5000E
xpo
rt v
alu
e (R
and
s)
Period (Years)
Figure 14: Value of raw hides and skins exports by Northern Cape Province
2006 2007 2008 2009 2010 2011 2012 2013 2014 2015
Gert Sibande 0 0 0 2203333 0 0 0 0 0 0
Ehlanzeni 18088 0 12042 46930 0 0 0 3975 0 0
0
500000
1000000
1500000
2000000
2500000
Exp
ort
Val
ue
(Ran
ds)
Period (Years)
Figure 15: Value of raw hides and skins by Mpumalanga Province

15
that between 2006 and 2015, there were no exports of raw hides and skins from Nkangala District municipality to the world. It is also evident from the figure that exports of raw hides and skins from Gert Sibande District municipality to the world attained a peak in 2009 at an export value of about R46 930. The figure further illustrates that there was no growth (0.00%) in exports of raw hides and skins from Gert Sibande District Municipality to the world in 2015 as compared to 2013 marketing season. Figure 16 below depicts export values of raw hides and skins from Limpopo province to the world between 2005 and 2015.
Source: Quantec EasyData
The figure further depicts that the major exporter of raw hides and skins from Limpopo province to the world was mainly Waterberg District Municipality, followed by very low levels of exports from Capricorn District Municipality over the past ten years. It is evident that during the period under scrutiny, exports of raw hides and skins from Waterberg District municipality to the world were from a high base during the first half of the ten year period (2006-2010) attaining a peak in 2009 at export values of approximately R4.7 million. The figure also depicts that between 2011 and 2015, there were no exports of raw hides and skins from Waterberg District Municipality to the world. The figure further depicts that there was no growth (0.00%) in exports of raw hides and skins from Waterberg District Municipality to the world in 2015 as compared to 2014 marketing season. Figure 17 illustrates export values of raw hides and skins from KwaZulu-Natal province to the world between 2006 and 2015.
2006 2007 2008 2009 2010 2011 2012 2013 2014 2015
Capricorn 44172 13398 0 0 0 0 0 0 0 0
Waterberg 924977 3399948 207597 4724831 174122 0 0 0 0 0
0
500000
1000000
1500000
2000000
2500000
3000000
3500000
4000000
4500000
5000000
Exp
ort
val
ue
(Ran
ds)
Period (Years)
Figure 16: Value of raw hides and skins by Limpopo Province

16
Source: Quantec EasyData
The graph further illustrates that most of raw hides and skins exports in value from KwaZulu-Natal province to the world were mainly from UMgungundlovu District Municipality, followed by intermittent exports from Zululand, UThukela District Municipalities and eThekwini Metropolitan Municipality. The graph also illustrates that export values of raw hides and skins from UMgungundlovu District Municipality to the world were from a high base during the second half of the ten year period (2011-2015) attaining a peak in 2013 at an export value of approximately R105 million. The graph further illustrates that exports of raw hides and skins from Zululand District to the world attained a small peak in 2009 at approximately R5.0 million. The graph also illustrates that there was 24.1% decline in exports of raw hides and skins from UMgungundlovu District Municipality to the world in 2015 as compared to 2014 marketing season. Figure 18 clearly shows export values of raw hides and skins from the Free State Province to the world between 2006 and 2015.
Source: Quantec EasyData
2006 2007 2008 2009 2010 2011 2012 2013 2014 2015
UMgungundlovu 6610085 20316809 6831203 9643886 20234138 29520099 49787311 105465912 81747339 62045855
Uthukela 0 761519 51966 6435 0 0 0 0 0 0
Umzinyathi 0 0 0 0 0 40124 0 0 0 355513
Zululand 929503 0 0 5076941 1626957 0 0 0 0 0
eThekwini 272 381072 13006 2581 364215 0 372054 0 2631 12419
0
20000000
40000000
60000000
80000000
100000000
120000000E
xpo
rt v
alu
e(R
and
s)
Period (Years)
Figure 17: Value of raw hides and skins exports by KwaZulu Natal Province
2006 2007 2008 2009 2010 2011 2012 2013 2014 2015
Lejweleputswa 0 0 0 0 0 0 0 0 2767539 49500
Thabo Mofutsanyane 0 0 0 0 0 0 0 1203773 3466624 13506234
Fezile Dabi 2602249 1744681 2289932 0 2051036 0 0 0 49689836 3132609
Mangaung 0 227897 1200 0 0 0 0 0 0 0
0
10000000
20000000
30000000
40000000
50000000
60000000
Exp
ort
Val
ue
(Ran
ds)
Period (Years)
Figure 18: Value of raw hides and skins exports by Free State Province

17
The graph further shows that most of raw hides and skins exports in value from Free State Province to the world were mainly from Fezile Dabi District Municipality, followed by very low or intermittent exports from Lejweleputswa, Mangaung and Thabo Mofutsanyane District Municipalities over the past decade. The graph also shows that exports of raw hides and skins from Fezile Dabi District Municipality to the world were from a high base during the second half of the ten year period (2011-2015) attaining a peak in 2014 at approximately R49.6 million. It is further evident in the graph that in 2009, and again between 2011 and 2013, there were no exports of raw hides and skins from Fezile Dabi District Municipality to the world due to the shortfall from producers of livestock domestically. The graph further shows that Lejweleputswa, Mangaung and Thabo Mofutsanyane District Municipalities had very low or intermittent levels of exports of raw hides and skins of not more than R3.4 million per annum. The graph also shows that there was a substantial decline of 93.7% in exports of raw hides and skins from Fezile Dabi District Municipality to the world in 2015 as compared to 2014 marketing season. Figure 19 below depicts export volumes of leather (further prepared) from South Africa to various regions of the world between 2006 and 2015.
Source: Quantec EasyData
The figure further depicts that most of leather (further prepared) from South Africa to the world went mainly to Africa, followed by Americas, Europe and Asia during the past decade. The figure also depicts that export volumes of leather (further prepared) from South Africa to Africa were from a low base during the first half of the ten year period (2006-2010) reaching a maximum of about 17 tons in 2009. The figure further depicts that during the second half of the same ten year period under scrutiny, export volumes of leather (further prepared) from South Africa to Africa were from a high base attaining a peak in 2015 at approximately 158 tons. Export volumes of leather (further prepared) from South Africa to Americas attained a peak also in 2013 at approximately 106 tons. The figure also depicts that export volumes of leather (further prepared) from South Africa to Europe attained a peak in 2015 at approximately 172 tons, while export volumes of leather (further prepared) from South Africa to Asia attained a peak in 2015 at approximately 145 tons. The figure further depicts that there was a growth of 236% in export volumes of leather (further prepared) from South Africa to Africa in 2015 as compared to 2014 marketing season. Figure 20 below illustrates export volumes of leather (further prepared) from South Africa to Africa between 2006 and 2015.
2006 2007 2008 2009 2010 2011 2012 2013 2014 2015
Africa 0 10 13 17 14 84 75 74 47 158
Americas 22 51 15 1 1 1 60 106 33 1
Asia 47 1 2 0 0 134 44 6 52 145
Europe 5 1 1 14 31 16 54 83 90 172
Oceania 0 0 1 1 5 3 19 1 0 0
020406080
100120140160180200
Exp
ort
qu
anti
ty (
ton
s)
Period (Years)
Figure 19: Export volumes of leather (further prepared) to the world

18
Source: Quantec EasyData
The graph further illustrates that export volumes of leather (further prepared) from South Africa to Africa went mainly to SADC excluding SACU, followed by very intermittent exports to SACU excluding RSA. The graph also illustrates that export volumes of leather (further prepared) from South Africa to SADC excluding SACU attained a peak in 2015 at an export quantity of about 158 tons over the past decade. Between 2006 and 2010, export quantities of leather (further prepared) from South Africa to SADC excluding SACU were very low and not more than 17 tons per annum. Export volumes of leather (further prepared) from South Africa to SACU excluding RSA attained a peak in 2013 at an export quantity of about 8 tons over the past decade. The graph further illustrates that there was an increase of 243% in export volumes of leather (further prepared) from South Africa to SADC excluding SACU in 2015 as compared to 2014 marketing season. Figure 21 below shows export volumes of leather (further prepared) from South Africa to Americas between 2006 and 2015.
Source: Quantec EasyData
The figure further shows that export volumes of leather (further prepared) from South Africa to Americas went mainly to NAFTA, followed by very low of exports to Central America over the past decade. The figure also shows that export volumes of leather (further prepared) from South Africa to NAFTA started to increase substantially in 2007, and then a decline occurred between 2009 and 2011 to lower levels of about 1 ton per annum. The figure further shows that export volumes of leather (further prepared) from South Africa to NAFTA
2006 2007 2008 2009 2010 2011 2012 2013 2014 2015
SADC (excluding SACU) 0 10 13 17 13 79 71 66 46 158
SACU (Excluding RSA) 0 0 0 0 1 5 4 8 1 0
0
20
40
60
80
100
120
140
160
180
Exp
ort
qu
anti
ty (
ton
s)
Period (Years)
Figure 20: Export volumes of leather (further prepared) to Africa
2006 2007 2008 2009 2010 2011 2012 2013 2014 2015
NAFTA 20 51 15 1 1 1 60 106 33 1
0
20
40
60
80
100
120
Exp
ort
qu
anti
ty (
ton
s)
Period (Years)
Figure 21: Export volumes of leather (further prepared) to Americas
19
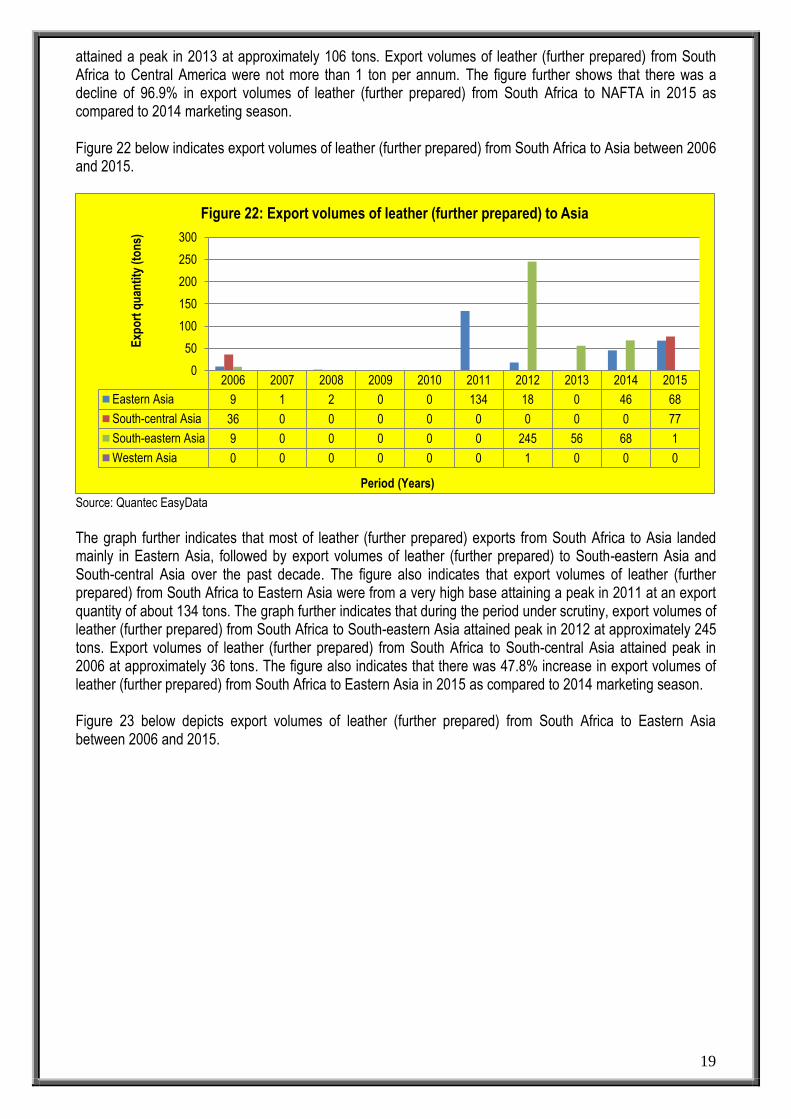
attained a peak in 2013 at approximately 106 tons. Export volumes of leather (further prepared) from South Africa to Central America were not more than 1 ton per annum. The figure further shows that there was a decline of 96.9% in export volumes of leather (further prepared) from South Africa to NAFTA in 2015 as compared to 2014 marketing season. Figure 22 below indicates export volumes of leather (further prepared) from South Africa to Asia between 2006 and 2015.
Source: Quantec EasyData
The graph further indicates that most of leather (further prepared) exports from South Africa to Asia landed mainly in Eastern Asia, followed by export volumes of leather (further prepared) to South-eastern Asia and South-central Asia over the past decade. The figure also indicates that export volumes of leather (further prepared) from South Africa to Eastern Asia were from a very high base attaining a peak in 2011 at an export quantity of about 134 tons. The graph further indicates that during the period under scrutiny, export volumes of leather (further prepared) from South Africa to South-eastern Asia attained peak in 2012 at approximately 245 tons. Export volumes of leather (further prepared) from South Africa to South-central Asia attained peak in 2006 at approximately 36 tons. The figure also indicates that there was 47.8% increase in export volumes of leather (further prepared) from South Africa to Eastern Asia in 2015 as compared to 2014 marketing season. Figure 23 below depicts export volumes of leather (further prepared) from South Africa to Eastern Asia between 2006 and 2015.
2006 2007 2008 2009 2010 2011 2012 2013 2014 2015
Eastern Asia 9 1 2 0 0 134 18 0 46 68
South-central Asia 36 0 0 0 0 0 0 0 0 77
South-eastern Asia 9 0 0 0 0 0 245 56 68 1
Western Asia 0 0 0 0 0 0 1 0 0 0
0
50
100
150
200
250
300
Exp
ort
qu
anti
ty (
ton
s)
Period (Years)
Figure 22: Export volumes of leather (further prepared) to Asia

20
Source: Quantec EasyData
The figure further depicts that Hong Kong Special Administrative Region of China commanded the greatest share of leather (further prepared) from South Africa to Eastern Asia, followed by low volumes of leather to Japan and Republic of Korea over the past ten years. The figure also depicts that export volumes of leather from South Africa to Hong Kong Special Administrative Region of China started to increase substantially in 2011, and at the same time a peak was attained at approximately 134 tons. The figure further depicts that between 2006 and 2010, export volumes of leather (further prepared) from South Africa to Hong Kong Special Administrative Region of China experienced very low exports of not more than 4 tons per annum. The figure also depicts that there was a decline of 65.2% in export volumes of leather (further prepared) from South Africa to Hong Kong Special Administrative Region of China in 2015 as compared to 2014 marketing season. Figure 24 shows export volumes of leather (further prepared) from South Africa to Europe between 2006 and 2015.
Source: Quantec EasyData
The graph further shows that European Union commanded the greatest market share of leather (further prepared) from South Africa to Europe over the past decade. The graph also shows that exports of leather from South Africa to the European Union were from a low base during the first half of the ten year period (2006-2010) reaching not more than 32 tons per annum. The graph further shows that exports of leather from
2006 2007 2008 2009 2010 2011 2012 2013 2014 2015
China 0 0 0 0 0 0 0 0 0 52
Hong Kong Special AdministrativeRegion of China
4 0 0 0 0 134 18 0 46 16
Japan 6 1 1 0 0 0 0 0 0 0
0
20
40
60
80
100
120
140
160
Exp
ort
qu
anti
ty (
ton
s)
Period (Years)
Figure 23: Export volumes of leather (prepared) to Eastern Asia
2006 2007 2008 2009 2010 2011 2012 2013 2014 2015
European Union 5 1 1 14 31 16 53 83 90 172
0
20
40
60
80
100
120
140
160
180
200
Exp
ort
qu
anti
ty (
ton
s)
Period (Years)
Figure 24: Export volumes of leather (further prepared) to Europe

21
South Africa to European Union were from a high base during the second half of the ten year period (2011-2015) under review, until a peak was attained in 2015 at about 172 tons. The graph also shows that there was an increase of 91.1% in export volumes of leather (further prepared) from South Africa to the European Union in 2015 as compared to 2014 marketing season. Figure 25 below illustrates export volumes of leather (further prepared) from South Africa to Oceania between 2006 and 2015.
Source: Quantec EasyData
The graph further illustrates that export volumes of leather (further prepared) from South Africa to Oceania landed mainly in Australia and New Zealand over the past decade. The graph also illustrates that export volumes of leather (further prepared) from South Africa to Australia and New Zealand were very low during the first half of the ten year period (2006-2010) and not more than 1 ton per annum. During the second half of the ten year period (2011-2015), export volumes of leather (further prepared) from South Africa to Australia and New Zealand were from a high base attaining a peak in 2012 at approximately 19 tons. The graph further illustrates that there was no growth (0.00%) in export volumes of leather (further prepared) from South Africa to Australia and New Zealand in 2015 as compared to 2014 marketing season.
2006 2007 2008 2009 2010 2011 2012 2013 2014 2015
Australia and New Zealand 0 0 1 1 5 3 19 1 0 0
0
5
10
15
20
25
Exp
ort
qu
anti
ty (
ton
s)
Period (Years)
Figure 25: Export volumes of leather (further prepared) to Oceania

Figure 2 below depicts value of leather (further prepared) exports by Provinces of South Africa to the world between 2006 and 2015.
Source: Quantec EasyData
2006 2007 2008 2009 2010 2011 2012 2013 2014 2015
Western Cape 4070407 2434258 2492041 3495269 2919441 4682040 5577855 5806745 5571948 10031071
Eastern Cape 34336252 34103970 10181951 3879353 858195 36882 4797 1267977 207863 409866
Northern Cape 12738 0 0 0 0 0 230 14243 27952 64945
Free State 0 0 0 0 2070 282345 0 64433 90450 92827
KwaZulu-Natal 2092729 5582614 22085116 4424882 8055644 1927280 224166 616490 10737859 12161533
North West 0 0 2276000 0 3144 1976602 3028862 11314 99834 4326
Gauteng 38881400 42521158 62986757 79591996 112844758 78693571 71519226 189793714 322208604 207581952
Mpumalanga 0 77160 166640 136964 124890 104168 76886 64254 245918 473518
Limpopo 0 35464 50258 42354 29639 29253 13380 79738 73490 175792
0
50000000
100000000
150000000
200000000
250000000
300000000
350000000
Exp
ort
Val
ue
(Ran
ds)
Period (Years)
Figure 26: Value of leather (further prepared) exports by Provinces

The figure further depicts that exports of leather (further prepared) in value from South Africa to the world originated mainly from Gauteng Province, followed by Eastern Cape, Western Cape and KwaZulu-Natal over the past decade. Mpumalanga, Northern Cape, Free State, North West and Limpopo provinces had very low or intermittent exports of leather to the world of not more than R3.1 million per annum. One of the reasons why Gauteng Province was the biggest exporter of leather (further prepared) is because most processing factories are located in Johannesburg over the same period. The figure also depicts that exports of leather from Gauteng Province to the world were from a low base during the first half of the ten year period (2006-2010) under scrutiny reaching a maximum of R112.8 million in 2010. The figure further depicts that exports of leather from Gauteng Province to the world were from a high base during the second half of the ten year period (2011-2015) under scrutiny attaining a peak in 2014 at approximately R322 million. The figure also depicts that there was 35.7% decrease in exports of leather (further prepared) from Gauteng Province to the world in 2015 as compared to 2014 marketing season.

Figure 27 indicates value of leather (further prepared) exports by Western Cape Province between 2006 and 2015.
Source: Quantec EasyData
2006 2007 2008 2009 2010 2011 2012 2013 2014 2015
City of Cape Town 1546139 960426 452834 329700 204843 2863473 1043322 741333 1214621 2871322
Cape Winelands 2399842 975735 974546 3020038 2335523 1584316 4417103 4937084 4357327 2851564
Eden 111747 498098 1064660 145531 379075 234251 117430 128328 0 4308185
0
1000000
2000000
3000000
4000000
5000000
6000000
Exp
ort
Val
ue
(Ran
ds)
Period (Years)
Figure 27: Value of leather (further prepared) by Western Cape Province

The figure further indicates that exports of leather (further prepared) in value from Western Cape Province to the world were mainly from Cape Winelands District Municipality, followed by very low volumes of leather from the City of Cape Town Metropolitan Municipality and Eden District Municipality over the past ten years under observation. The figure also indicates that exports of leather (further prepared) from Cape Winelands District Municipality to the world were from a low base during the first half of the ten year period (2006-2010) under scrutiny attaining a peak in 2009 at approximately R3.0 million. The figure further indicates that exports of leather (further prepared) from Cape Winelands District Municipality to the world were from a high base during the second half of the ten year period (2011-2015) under scrutiny attaining a peak in 2013 at approximately R4.9 million. Furthermore, exports of leather (further prepared) from City of Cape Town Metropolitan Municipality to the world attained a peak in 2015 at approximately R2.8 million. The figure further indicates that there was a decline of 34.5% in exports of leather (further prepared) from the Cape Winelands District Municipality to the world in 2015 as compared to 2014 marketing season. Figure 28 below shows export values of leather (further prepared) from Eastern Cape Province to the world between 2006 and 2015.
Source: Quantec EasyData
The graph further shows that Nelson Mandela Metropolitan Municipality commanded the greatest market share of leather (further prepared) exports in value from the Eastern Cape province, followed by Cacadu and Chris Hani District municipalities and very low or intermittent exports from Buffalo City Metropolitan Municipality to the world over the past decade. It is also evident in the graph that exports of leather (further prepared) from Nelson Mandela Metropolitan Municipality to the world were from a high base during the first half of the ten year period (2006-2010) under review attaining a peak in 2006 and 2007 at approximately R3.4 and R3.3 million respectively. During the second half of the same ten year period (2011-2015), exports of leather (further prepared) from Nelson Mandela Metropolitan Municipality to the world were from a low base reaching a maximum of R1.2 million in 2013. It is further evident in the graph that exports of leather (further prepared) from Cacadu District Municipality to the world attained a peak in 2007 at approximately R359 276. Exports of leather (further prepared) from Chris Hani District and Buffalo City Metropolitan Municipalities were low and not more than R13 000 and R9 302 per annum respectively. The graph also shows that there was an increase of 97.8% in exports of leather (further prepared) from Nelson Mandela Metropolitan Municipality to the world in 2015 as compared to 2014 marketing season. Figure 29 below illustrates export values of leather (further prepared) from KwaZulu-Natal Province to the world between 2006 and 2015.
2006 2007 2008 2009 2010 2011 2012 2013 2014 2015
Cacadu 0 359276 0 0 0 4724 4797 347 4951 7027
Chris Hani 0 0 0 0 0 0 0 0 13000 8635
Nelson Mandela Bay 34326951 33744694 10181951 3879353 858195 32158 0 1267630 189912 375710
Buffalo City 9302 0 0 0 0 0 0 0 0 18494
0
5000000
10000000
15000000
20000000
25000000
30000000
35000000
40000000
Exp
ort
val
ue
(Ran
ds)
Period (Years)
Figure 28: Value of leather (further prepared) exports by Eastern Cape Province

26
Source: Quantec EasyData
The figure further illustrates that UThukela District municipality commanded the greatest market share of exports of leather (further prepared) from KwaZulu-Natal province to the world, followed by eThekwini Metropolitan Municipality and UMgungundlovu District municipality. The figure also illustrates that exports of leather (further prepared) from UThukela District municipality to the world started to increase substantially in 2007 until a peak was attained in 2009 at approximately R3.9 million, while exports of leather (further prepared) from eThekwini Metropolitan municipality to the world attained a peak in 2015 at approximately R12.5 million. It is further evident in the figure that exports of leather (further prepared) from UMgungundlovu District municipality to the world attained a peak in 2008 at approximately R6.4 million. The figure further illustrates that there was no growth (0.00%) in exports of leather (further prepared) from UThukela District Municipality to the world in 2015 as compared to 2014 marketing season. Figure 30 below depicts export values of leather (further prepared) from North West Province to the world between 2006 and 2015.
Source: Quantec EasyData
The graph further depicts that exports of leather (further prepared) from North West Province to the world were mainly from Bojanala District Municipality, followed by Dr. Ruth Segomotsi Mompati District municipality and very low or intermittent levels of leather exports from Dr. Kenneth Kaunda District Municipality over the past decade. The graph also depicts that exports of leather (further prepared) from Bojanala District municipality to
2006 2007 2008 2009 2010 2011 2012 2013 2014 2015
UMgungundlovu 774290 19435 6451923 150768 456723 822847 183031 464681 1724 424050
Uthukela 153254 5473145 15429927 3963760 0 0 0 0 0 0
eThekwini 1165185 40256 196484 294134 7595061 483392 37801 144709 10707515 11670383
0
2000000
4000000
6000000
8000000
10000000
12000000
14000000
16000000
18000000E
xpo
rt v
alu
e in
Ran
ds
Period (Years)
Figure : Value of leather (further prepared) exports by KwaZulu-Natal Province
2006 2007 2008 2009 2010 2011 2012 2013 2014 2015
Bojanala 0 0 0 0 0 1976602 3017870 11314 99834 0
Dr Ruth Segomotsi Mompati 0 0 2276000 0 0 0 0 0 0 0
Dr Kenneth Kaunda 0 0 0 0 3144 0 10992 0 0 4326
0
500000
1000000
1500000
2000000
2500000
3000000
3500000
Exp
ort
val
ue
(Ran
ds)
Period (Years)
Figure 30: Value of leather (further prepared) by North West Province

27
the world were from a high base during the second half of the ten year period (2011-2015) under review, attaining a peak in 2012 at an export value of R3.0 million. Exports of leather (further prepared) from Dr. Ruth Segomotsi Mompati District municipality to the world attained a peak in 2008 an export value of R2.2 million. The graph also depicts that there was a 100% decline in exports of leather (further prepared) from Bojanala District Municipality to the world in 2015 as compared to 2014 marketing season. Figure 30 indicates export values of leather (further prepared) by Gauteng Province to the world between 2006 and 2015.
Source: Quantec EasyData
The figure further indicates that leather exported by Gauteng Province to the world originated mainly from Ekurhuleni Metropolitan Municipality, followed by the City of Tshwane Metropolitan and City of Johannesburg Metropolitan Municipalities over the past ten years under observation. The figure also indicates that exports of leather (further prepared) from Ekurhuleni Metropolitan Municipality to the world were from a high base during the second half of the ten year period (2011-2015) under review, attaining a peak in 2014 at an export value of approximately R227 million. The figure further indicates that exports of leather (further prepared) from the City of Tshwane Metropolitan Municipality to the world attained a peak also in 2015 at an export value of approximately R102 million. Exports of leather (further prepared) from the City of Johannesburg Metropolitan Municipality to the world attained a peak in 2007 at an export value of R28.6 million. The figure also indicates that there was a decline of 10.3% in exports of leather (further prepared) from Ekurhuleni Metropolitan Municipality to the world in 2015 as compared to 2014 marketing season. Figure 32 shows export values of leather (further prepared) from Limpopo Province to the world between 2006 and 2015.
2006 2007 2008 2009 2010 2011 2012 2013 2014 2015
Sedibeng 0 13830 207510 40095 1992 0 0 3052 59464 52
West Rand 0 202654 374096 19979 5332 18425 497964 353117 26508 7731821
Ekurhuleni 15189759 11053285 42941958 75860172 75374012 26502755 13183159 83849668 226506414 94473067
City of Johannesburg 12874932 28631941 2057161 1826671 22565101 20656422 24911787 26253914 3089477 3683807
City of Tshwane 10816708 2619449 17406033 1845079 14898321 31515969 32926316 79333963 92526741 101693205
0
50000000
100000000
150000000
200000000
250000000
Exp
ort
Val
ue
(Ran
ds)
Period (Years)
Figure 30: Value of leather (further prepared) exports by Gauteng Province
28
Source: Quantec EasyData
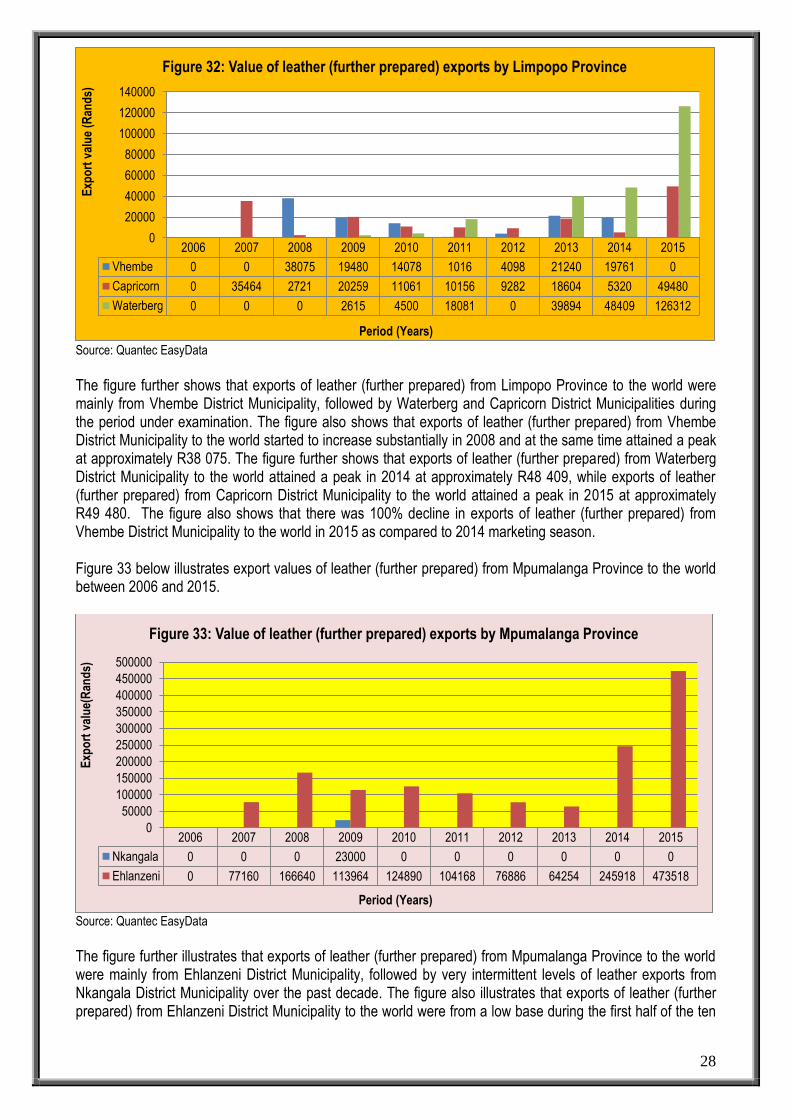
The figure further shows that exports of leather (further prepared) from Limpopo Province to the world were mainly from Vhembe District Municipality, followed by Waterberg and Capricorn District Municipalities during the period under examination. The figure also shows that exports of leather (further prepared) from Vhembe District Municipality to the world started to increase substantially in 2008 and at the same time attained a peak at approximately R38 075. The figure further shows that exports of leather (further prepared) from Waterberg District Municipality to the world attained a peak in 2014 at approximately R48 409, while exports of leather (further prepared) from Capricorn District Municipality to the world attained a peak in 2015 at approximately R49 480. The figure also shows that there was 100% decline in exports of leather (further prepared) from Vhembe District Municipality to the world in 2015 as compared to 2014 marketing season. Figure 33 below illustrates export values of leather (further prepared) from Mpumalanga Province to the world between 2006 and 2015.
Source: Quantec EasyData
The figure further illustrates that exports of leather (further prepared) from Mpumalanga Province to the world were mainly from Ehlanzeni District Municipality, followed by very intermittent levels of leather exports from Nkangala District Municipality over the past decade. The figure also illustrates that exports of leather (further prepared) from Ehlanzeni District Municipality to the world were from a low base during the first half of the ten
2006 2007 2008 2009 2010 2011 2012 2013 2014 2015
Vhembe 0 0 38075 19480 14078 1016 4098 21240 19761 0
Capricorn 0 35464 2721 20259 11061 10156 9282 18604 5320 49480
Waterberg 0 0 0 2615 4500 18081 0 39894 48409 126312
0
20000
40000
60000
80000
100000
120000
140000E
xpo
rt v
alu
e (R
and
s)
Period (Years)
Figure 32: Value of leather (further prepared) exports by Limpopo Province
2006 2007 2008 2009 2010 2011 2012 2013 2014 2015
Nkangala 0 0 0 23000 0 0 0 0 0 0
Ehlanzeni 0 77160 166640 113964 124890 104168 76886 64254 245918 473518
0
50000
100000
150000
200000
250000
300000
350000
400000
450000
500000
Exp
ort
val
ue(
Ran
ds)
Period (Years)
Figure 33: Value of leather (further prepared) exports by Mpumalanga Province
29
year period (2006-2010) under review, reaching a maximum of R166 640 in 2008. Exports of leather (further prepared) from Ehlanzeni District Municipality to the world were from a high base during the second half of the ten year period (2011-2015) attaining a peak in 2015 at approximately R473 518. The figure further illustrates that exports of leather (further prepared) from Nkangala District Municipality to the world attained a peak in 2009 at approximately R23 000. The figure also illustrates that there was 92.5% increase in exports of leather (further prepared) from Ehlanzeni District Municipality to the world in 2015 as compared to 2014 marketing season.
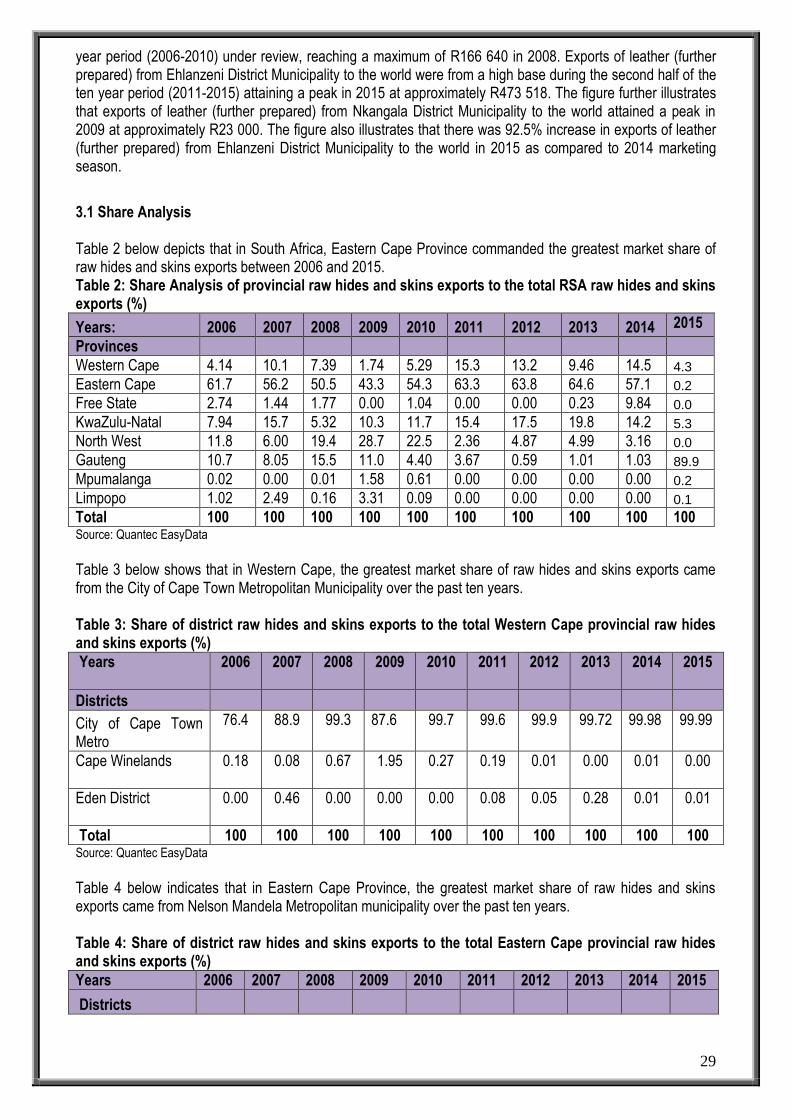
3.1 Share Analysis Table 2 below depicts that in South Africa, Eastern Cape Province commanded the greatest market share of raw hides and skins exports between 2006 and 2015. Table 2: Share Analysis of provincial raw hides and skins exports to the total RSA raw hides and skins exports (%)
Years: 2006 2007 2008 2009 2010 2011 2012 2013 2014 2015
Provinces
Western Cape 4.14 10.1 7.39 1.74 5.29 15.3 13.2 9.46 14.5 4.3 Eastern Cape 61.7 56.2 50.5 43.3 54.3 63.3 63.8 64.6 57.1 0.2 Free State 2.74 1.44 1.77 0.00 1.04 0.00 0.00 0.23 9.84 0.0 KwaZulu-Natal 7.94 15.7 5.32 10.3 11.7 15.4 17.5 19.8 14.2 5.3 North West 11.8 6.00 19.4 28.7 22.5 2.36 4.87 4.99 3.16 0.0 Gauteng 10.7 8.05 15.5 11.0 4.40 3.67 0.59 1.01 1.03 89.9 Mpumalanga 0.02 0.00 0.01 1.58 0.61 0.00 0.00 0.00 0.00 0.2 Limpopo 1.02 2.49 0.16 3.31 0.09 0.00 0.00 0.00 0.00 0.1 Total 100 100 100 100 100 100 100 100 100 100 Source: Quantec EasyData
Table 3 below shows that in Western Cape, the greatest market share of raw hides and skins exports came from the City of Cape Town Metropolitan Municipality over the past ten years. Table 3: Share of district raw hides and skins exports to the total Western Cape provincial raw hides and skins exports (%)
Years
2006
2007
2008 2009
2010 2011
2012
2013 2014
2015
Districts
City of Cape Town Metro
76.4
88.9
99.3
87.6
99.7
99.6
99.9
99.72
99.98
99.99
Cape Winelands
0.18
0.08
0.67
1.95 0.27
0.19
0.01
0.00
0.01
0.00
Eden District
0.00
0.46
0.00
0.00 0.00
0.08
0.05
0.28
0.01 0.01
Total 100 100 100 100 100 100 100 100 100 100 Source: Quantec EasyData
Table 4 below indicates that in Eastern Cape Province, the greatest market share of raw hides and skins exports came from Nelson Mandela Metropolitan municipality over the past ten years. Table 4: Share of district raw hides and skins exports to the total Eastern Cape provincial raw hides and skins exports (%)
Years 2006 2007 2008 2009 2010 2011 2012 2013 2014 2015
Districts

30
Years 2006 2007 2008 2009 2010 2011 2012 2013 2014 2015
Cacadu District 3.52 0.01 0.06 0.00 0.00 0.00 0.00 0.00 0.04 0.0 Buffalo City 2.71 0.00 0.00 0.00 0.00 0.00 0.00 0.00 2.08 98.9 Nelson Mandela 96.1 99.99 99.9 98.6 96.9 94.1 98.3 21.65 97.87 1.1 Total 100 100 100 100 100 0.00 100 100 100 100 Source: Quantec EasyData
Table 5 below illustrates that in Free State Province, the greatest market share of raw hides and skins exports was mainly from Fezile Dabi District Municipality during the period under review. Table 5: Share of district raw hides and skins exports to the total Free State provincial raw hides and skins exports (%)
Years 2006
2007
2008
2009
2010
2011
2012
2013
2014
2015
Districts
Lejweleputswa
0.00
0.00
0.00
0.00
0.00
97.99
0.00
0.00
4.85 0.3
Thabo Mofutsanyane
0.00 0.00
0.00
0.00
0.00
0.00
0.00
100
6.08 80.9
Fezile Dabi
0.00 0.00
0.00
0.00
0.00
0.00
0.00
69.83
89.06 18.8
Mangaung District
0.00 0.00
0.00
0.00
0.00
0.46
0.00
2.76
0.00 0.0
Total 100 100 100 0.00 0.00 100 0.00 100 100 100 Source: Quantec EasyData
Table 6 below shows that in KwaZulu-Natal Province, the greatest market share of raw hides and skins exports was mainly from UMgungundlovu District Municipality during the period under scrutiny. Table 6: Share of district raw hides and skins exports to the total KwaZulu-Natal provincial raw hides and skins exports (%)
Years
2006
2007
2008
2009
2010
2011
2012
2013
2014
2015
Districts
UMgungundlovu
87.7 94.7 99.1 65.5 91.2 100 100 100 100
100
Uthukela District
0.00
3.55
0.75
0.06
0.00
0.00
0.00
0.00
0.00
0
eThekwini Metro
0.00 1.78 0.19 0.00 1.61 0.00 0.00 0.00 0.00
0
Total 100 100 100 100 100 100 100 100 100 100 Source: Quantec EasyData
Table 7 below depicts that in North West Province, the greatest market share of raw hides and skins exports was mainly from Bojanala District Municipality during the period under review.

31
Table 7: Share of district raw hides and skins exports to the total North West provincial raw hides and skins exports (%)
Years 2006
2007
2008
2009
2010
2011
2012
2013
2014
2015
Districts
Bojanala District
100 100
99.99
56.5
45.4
7.01
94.4
100
100
100
Dr. Mompati
0.00 0.00
100
0.00
0.00
0.00
0.00
0.00
0.00
0.00
Total 100 100 100 100 100 100 100 100 100 100 Source: Quantec EasyData
Table 8 illustrates that in Gauteng Province, the greatest market share of raw hides and skins exports was mainly from the City of Johannesburg Metropolitan Municipality during the period under review. Table 8: Share of district raw hides and skins exports to the total Gauteng provincial raw hides and skins exports (%)
Years 2006 2007 2008 2009 2010 2011 2012 2013 2014 2015
Districts
Sedibeng District
0.00 41.6 11.1 4.39 0.04 0.00 0.13 0.00 0.00 0.0
West Rand District
48.1 0.01 0.26 0.06 0.95 2.54 22.9 15.62 0.87 0.0
Ekurhuleni Metro
0.37 0.42 0.59 2.48 5.53 72.7 27.6 0.81 5.98 5.6
City of Joburg
51.1 57.5 88.1 92.7 93.3 24.6 49.3 80.09 84.67 21.9
City of Tshwane
0.36 0.41 0.00 0.40 0.13 0.10 0.12 0.00 8.47 72.4
Total 100 100 100 100 100 100 100 100 100 100 Source: Quantec EasyData
Table 9 below shows that in Mpumalanga Province, the greatest market share of raw hides and skins exports was mainly from Ehlanzeni District municipality during the ten year period. Table 9: Share of district raw hides and skins exports to the total Mpumalanga provincial raw hides and skins exports (%)
Years 2006
2007
2008
2009
2010
2011
2012
2013
2014
2015
Districts
Gert Sibande 0.00 0.00 0.00 97.9 100 0.00 0.00 0.00 0.00 0.00
Nkangala District
100 0.00 0.00 2.09 0.00 0.00 0.00 0.00 0.00
0.00
Ehlanzeni District
0.00 0.00 100 0.00 0.00 0.00 0.00 100 0.00
0.00
Total 100 0.00 100 100 0.00 0.00 0.00 100 0.00 0.00 Source: Quantec EasyData
Table below 10 reflects that in Limpopo Province, the greatest market share of raw hides and skins exports came from Waterberg District Municipality during the period under examination.

32
Table 10: Share of district raw hides and skins exports to the total Limpopo provincial raw hides and skins exports (%)
Years 2006 2007 2008 2009 2010 2011 2012 2013 2014 2015
Districts
Capricorn District
4.56
0.39 0.00 0.00 0.00 0.00 0.00 0.00 0.00
0.00
Waterberg District
95.4
99.6 100 100 100 0.00 0.00 0.00 0.00
0.00
Total 100 100 100 100 100 0.00 0.00 0.00 0.00 0.00 Source: Quantec EasyData
Table 11 below shows that in South Africa, Gauteng Province commanded the largest market share of leather (further prepared) exports from South Africa between 2006 and 2015 under observation. Table 11: Share Analysis of provincial leather (further prepared) exports to the total RSA leather exports (%)
Years 2006 2007 2008 2009 2010 2011 2012 2013 2014 2015
Provinces
Western Cape 5.05 2.87 2.49 3.82 3.11 6.66 10.3 3.50 1.59 4.3 Eastern Cape 43.3 40.2 10.2 4.24 0.83 0.06 0.04 0.75 0.06 0.2 Kwazulu-Natal 2.46 6.59 22.0 4.83 8.17 2.76 0.44 0.37 3.15 5.3 North West 0.00 0.00 2.27 0.00 0.00 2.90 5.39 0.01 0.03 0.0 Gauteng 49.1 50.2 62.8 86.9 87.7 86.6 83.7 95.24 95.04 89.9 Mpumalanga 0.00 0.09 0.17 0.15 0.12 0.14 0.15 0.04 0.07 0.2 Limpopo 0.00 0.04 0.004 0.04 0.03 0.51 0.03 0.05 0.02 0.1 Total 100 100 100 100 100 100 100 100 100 100 Source: Quantec EasyData
Table 12 below depicts that in Western Cape Province, the greatest market share of leather (further prepared) exports originated mainly from the City of Cape Town Metropolitan over the past ten years. Table 12: Share of district leather (further prepared) exports to the total Western Cape provincial leather exports (%)
Years
2006
2007
2008
2009
2010
2011
2012
2013
2014
2015
Districts
City of Cape Town Metro 96.8 77.7 53.8 89.8 85.2 93.7 97.5 97.58 19.38 28.6 Cape Winelands District 0.32 1.85 3.52 4.16 12.0 1.67 0.58 0.29 80.62 28.4 Eden District Municipality 2.89 20.5 42.7 4.16 12.0 4.67 1.92 2.13 0.00 42.9 Total 0.00 100 100 100 100 100 100 100 100 100 Source: Quantec EasyData
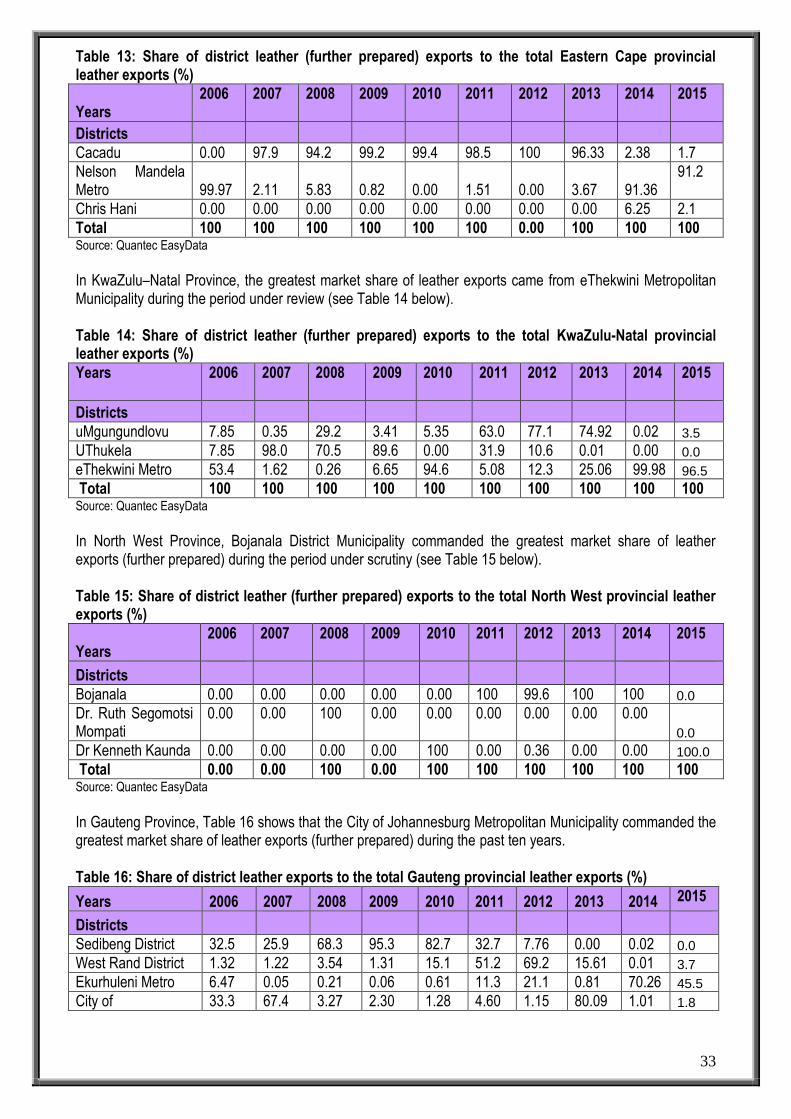
In Eastern Cape Province, the greatest market share of the export came from Cacadu District Municipality during the ten year period under examination (see Table 13 below).
33
Table 13: Share of district leather (further prepared) exports to the total Eastern Cape provincial leather exports (%)
Years
2006
2007
2008
2009
2010
2011
2012
2013
2014
2015
Districts
Cacadu 0.00 97.9 94.2 99.2 99.4 98.5 100 96.33 2.38 1.7
Nelson Mandela Metro 99.97 2.11 5.83 0.82 0.00 1.51 0.00 3.67 91.36
91.2
Chris Hani 0.00 0.00 0.00 0.00 0.00 0.00 0.00 0.00 6.25 2.1
Total 100 100 100 100 100 100 0.00 100 100 100 Source: Quantec EasyData
In KwaZulu–Natal Province, the greatest market share of leather exports came from eThekwini Metropolitan Municipality during the period under review (see Table 14 below). Table 14: Share of district leather (further prepared) exports to the total KwaZulu-Natal provincial leather exports (%)
Years
2006
2007
2008
2009
2010
2011
2012
2013
2014
2015
Districts
uMgungundlovu 7.85 0.35 29.2 3.41 5.35 63.0 77.1 74.92 0.02 3.5 UThukela 7.85 98.0 70.5 89.6 0.00 31.9 10.6 0.01 0.00 0.0 eThekwini Metro 53.4 1.62 0.26 6.65 94.6 5.08 12.3 25.06 99.98 96.5 Total 100 100 100 100 100 100 100 100 100 100 Source: Quantec EasyData
In North West Province, Bojanala District Municipality commanded the greatest market share of leather exports (further prepared) during the period under scrutiny (see Table 15 below). Table 15: Share of district leather (further prepared) exports to the total North West provincial leather exports (%)
Years 2006
2007
2008
2009
2010
2011 2012 2013 2014 2015
Districts
Bojanala 0.00 0.00 0.00 0.00 0.00 100 99.6 100 100 0.0 Dr. Ruth Segomotsi Mompati
0.00
0.00
100
0.00
0.00 0.00 0.00 0.00 0.00
0.0 Dr Kenneth Kaunda 0.00 0.00 0.00 0.00 100 0.00 0.36 0.00 0.00 100.0 Total 0.00 0.00 100 0.00 100 100 100 100 100 100 Source: Quantec EasyData
In Gauteng Province, Table 16 shows that the City of Johannesburg Metropolitan Municipality commanded the greatest market share of leather exports (further prepared) during the past ten years. Table 16: Share of district leather exports to the total Gauteng provincial leather exports (%)
Years 2006 2007 2008 2009 2010 2011 2012 2013 2014 2015
Districts
Sedibeng District 32.5 25.9 68.3 95.3 82.7 32.7 7.76 0.00 0.02 0.0 West Rand District 1.32 1.22 3.54 1.31 15.1 51.2 69.2 15.61 0.01 3.7 Ekurhuleni Metro 6.47 0.05 0.21 0.06 0.61 11.3 21.1 0.81 70.26 45.5 City of 33.3 67.4 3.27 2.30 1.28 4.60 1.15 80.09 1.01 1.8

34
Years 2006 2007 2008 2009 2010 2011 2012 2013 2014 2015
Districts
Johannesburg
City of Tshwane Metro 26.4 5.42 24.7 1.04 0.31 0.26 0.78 0.00 28.7 49.0 Total 100 100 100 100 100 100 100 100 100 100 Source: Quantec EasyData
Table 17 below shows that in Mpumalanga Province, the greatest market share of leather (further prepared) exports originated mainly from Nkangala District Municipality between 2006 and 2015. Table 17: Share of district leather (further prepared) exports to the total Mpumalanga provincial leather exports (%)
Years
2006
2007
2008
2009
2010 2011
2012
2013
2014
2015
Districts
Nkangala District 0.00 99.7 100 100 99.8 100 100 98.75 0.00 0.00
Ehlanzeni District 0.00 0.34 0.00 0.00 0.20 0.00 0.00 1.25 100 100
Total 0.00 100 100 100 100 100 100 100 100 100 Source: Quantec EasyData
Table 18 below depicts that in Limpopo province, the greatest market share of leather (further prepared) exports originated mainly from Vhembe District Municipality over the past ten years. Table 18: Share of district leather (further prepared) exports to the total Limpopo provincial leather exports (%)
Years Districts
2006
2007
2008
2009
2010 2011 2012 2013 2014 2015
Mopani District 0.00 0.00 0.00 0.00 0.00 0.00 0.00 50.03 0.00 0.00
Vhembe District 0.00 0.00 93.3 46.0 47.1 0.29 30.0 26.64 26.9 0.0 Capricorn District 0.00 100 6.67 47.8 37.6 0.00 70.0 23.33 7.2 28.1 Waterberg District 0.00 0.00 0.00 6.17 15.3 96.8 0.00 0.00 65.9 71.9 Total 0.00 100 100 100 100 100 100 100 100 100 Source: Quantec EasyData
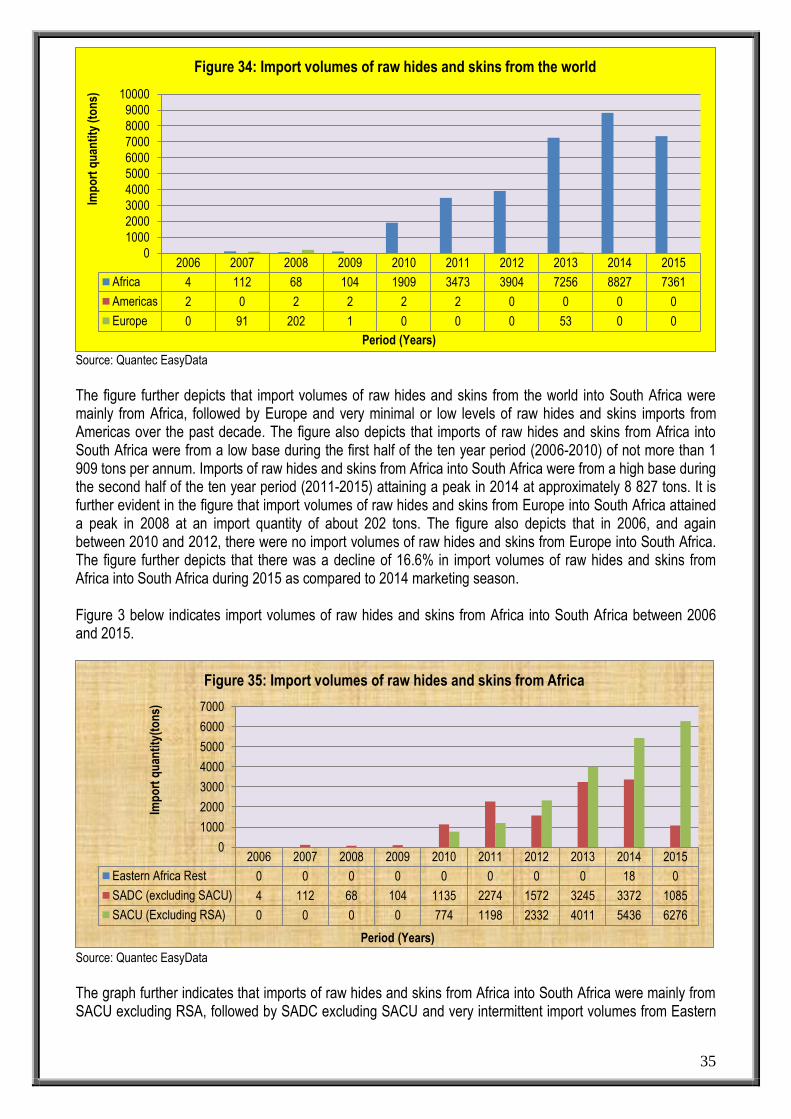
4. IMPORT VOLUMES OF RAW HIDES & SKINS The demand for hides by the automotive sector out-strips the number of cattle slaughtered locally and 60-70% of the hides produced are suitable for use in automotive upholstery. Yet this is inadequate for automotive needs, which is why the shortfall of high quality wet-blues has to be imported (Ballard, 2001). South Africa imports hides and skins from all over the world, in particular Brazil, India and Argentina are processed into value added products. Figure 34 below depicts import volumes of raw hides and skins from various regions into South Africa between 2006 and 2015.
35
Source: Quantec EasyData
The figure further depicts that import volumes of raw hides and skins from the world into South Africa were mainly from Africa, followed by Europe and very minimal or low levels of raw hides and skins imports from Americas over the past decade. The figure also depicts that imports of raw hides and skins from Africa into South Africa were from a low base during the first half of the ten year period (2006-2010) of not more than 1 909 tons per annum. Imports of raw hides and skins from Africa into South Africa were from a high base during the second half of the ten year period (2011-2015) attaining a peak in 2014 at approximately 8 827 tons. It is further evident in the figure that import volumes of raw hides and skins from Europe into South Africa attained a peak in 2008 at an import quantity of about 202 tons. The figure also depicts that in 2006, and again between 2010 and 2012, there were no import volumes of raw hides and skins from Europe into South Africa. The figure further depicts that there was a decline of 16.6% in import volumes of raw hides and skins from Africa into South Africa during 2015 as compared to 2014 marketing season. Figure 3 below indicates import volumes of raw hides and skins from Africa into South Africa between 2006 and 2015.
Source: Quantec EasyData
The graph further indicates that imports of raw hides and skins from Africa into South Africa were mainly from SACU excluding RSA, followed by SADC excluding SACU and very intermittent import volumes from Eastern
2006 2007 2008 2009 2010 2011 2012 2013 2014 2015
Africa 4 112 68 104 1909 3473 3904 7256 8827 7361
Americas 2 0 2 2 2 2 0 0 0 0
Europe 0 91 202 1 0 0 0 53 0 0
0
1000
2000
3000
4000
5000
6000
7000
8000
9000
10000Im
po
rt q
uan
tity
(to
ns)
Period (Years)
Figure 34: Import volumes of raw hides and skins from the world
2006 2007 2008 2009 2010 2011 2012 2013 2014 2015
Eastern Africa Rest 0 0 0 0 0 0 0 0 18 0
SADC (excluding SACU) 4 112 68 104 1135 2274 1572 3245 3372 1085
SACU (Excluding RSA) 0 0 0 0 774 1198 2332 4011 5436 6276
0
1000
2000
3000
4000
5000
6000
7000
Imp
ort
qu
anti
ty(t
on
s)
Period (Years)
Figure 35: Import volumes of raw hides and skins from Africa

36
Africa over the past decade. The graph also indicates that imports of raw hides and skins from SACU excluding RSA into South Africa started to increase substantially during the second half of the ten year period (2011-2015) attaining a peak in 2015 at an import quantity of approximately 6 276 tons. It is also evident in the graph that import volumes of raw hides and skins from SADC into South Africa attained a peak also in 2014 at approximately 3 372 tons. The graph further depicts that between 2006 and 2009, there were no imports of raw hides and skins from SACU into South Africa during the period under review. The graph also indicates that there was an increase of 15.4% in import volumes of raw hides and skins from SACU excluding RSA into South Africa during 2015 as compared to 2014 marketing season. Figure 36 below illustrates import volumes of raw hides and skins from SACU region into South Africa between 2006 and 2015.
Source: Quantec EasyData
The figure further illustrates that imports of raw hides and skins from SADC into South Africa originated mainly from Zimbabwe, followed by Zambia and very low volumes from Mozambique into South Africa over the past decade. The figure also depicts that imports of raw hides and skins from Zimbabwe into South Africa were from a high base during the second half of the ten year period (2011-2015) attaining a peak in 2011 and 2013 at about 2 270 and 2 777 tons respectively. Between 2005 and 2008, imports volumes of raw hides and skins from Zimbabwe into South Africa were low and ranged between 0 and 1 114 tons per annum. The figure further illustrates that import volumes of raw hides and skins from Zambia attained a peak in 201 at about 1 478 tons during the period under review. The figure also illustrates that there was 76.5% decline in import volumes of raw hides and skins from Zimbabwe into South Africa during 2015 as compared to 2014 marketing season. Figure 37 below shows import volumes of raw hides and skins from the Americas into South Africa between 2006 and 2015.
2006 2007 2008 2009 2010 2011 2012 2013 2014 2015
Mozambique 0 108 64 0 21 4 0 0 25 78
Zambia 0 0 0 0 0 0 46 468 1478 568
Zimbabwe 0 0 0 104 1114 2270 1526 2777 1869 438
0
500
1000
1500
2000
2500
3000
Imp
ort
qu
anti
ty (
ton
s)
Period (Years)
Figure 36: Import volumes of raw hides and skins from SADC
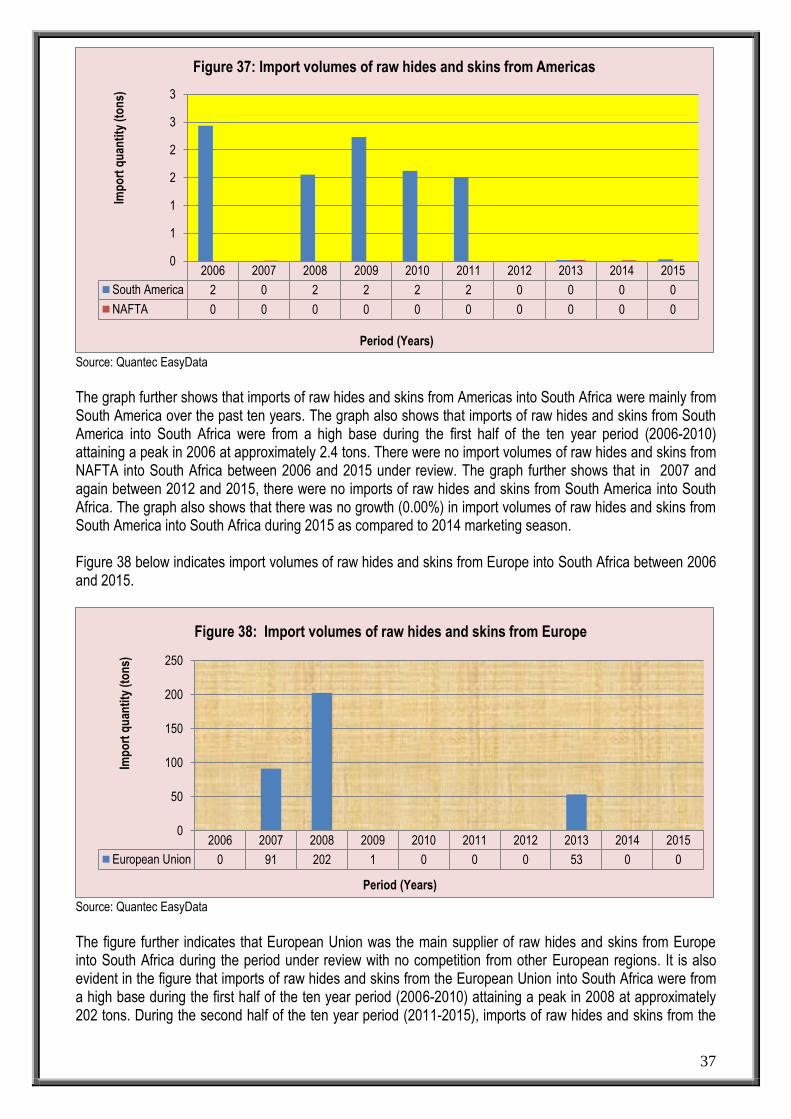
37
Source: Quantec EasyData
The graph further shows that imports of raw hides and skins from Americas into South Africa were mainly from South America over the past ten years. The graph also shows that imports of raw hides and skins from South America into South Africa were from a high base during the first half of the ten year period (2006-2010) attaining a peak in 2006 at approximately 2.4 tons. There were no import volumes of raw hides and skins from NAFTA into South Africa between 2006 and 2015 under review. The graph further shows that in 2007 and again between 2012 and 2015, there were no imports of raw hides and skins from South America into South Africa. The graph also shows that there was no growth (0.00%) in import volumes of raw hides and skins from South America into South Africa during 2015 as compared to 2014 marketing season. Figure 38 below indicates import volumes of raw hides and skins from Europe into South Africa between 2006 and 2015.
Source: Quantec EasyData
The figure further indicates that European Union was the main supplier of raw hides and skins from Europe into South Africa during the period under review with no competition from other European regions. It is also evident in the figure that imports of raw hides and skins from the European Union into South Africa were from a high base during the first half of the ten year period (2006-2010) attaining a peak in 2008 at approximately 202 tons. During the second half of the ten year period (2011-2015), imports of raw hides and skins from the
2006 2007 2008 2009 2010 2011 2012 2013 2014 2015
South America 2 0 2 2 2 2 0 0 0 0
NAFTA 0 0 0 0 0 0 0 0 0 0
0
1
1
2
2
3
3
Imp
ort
qu
anti
ty (
ton
s)
Period (Years)
Figure 37: Import volumes of raw hides and skins from Americas
2006 2007 2008 2009 2010 2011 2012 2013 2014 2015
European Union 0 91 202 1 0 0 0 53 0 0
0
50
100
150
200
250
Imp
ort
qu
anti
ty (
ton
s)
Period (Years)
Figure 38: Import volumes of raw hides and skins from Europe

38
European Union into South Africa were from a low base attaining a maximum of approximately 53 tons in 2013. The figure further indicates that in 2006 and again between 2010 and 2012, there were no import volumes of raw hides and skins from the European Union into South Africa. The figure also indicates that there was no growth (0.00%) in import volumes of raw hides and skins from European Union into South Africa during 2015 as compared to 2014 marketing season. Figure 38 below shows import volumes of raw hides and skins from Oceania into South Africa between 2006 and 2015.
Source: Quantec EasyData
The graph further shows that most import volumes of raw hides and skins from Oceania into South Africa originated mainly from Australia and New Zealand during the period under observation. The graph also shows that imports of raw hides and skins from Australia and New Zealand into South Africa started to increase substantially in 2007 until a peak was attained in 2009 at approximately 0.08 tons. The graph also shows that in 2006 and again between 2010 and 2015, there were no import volumes of raw hides and skins from Australia and New Zealand into South Africa. The graph further shows that there was no growth (0.00%) in imports of raw hides and skins from Australia and New Zealand into South Africa in 2015 as compared to 2014 marketing season.
4. IMPORT VOLUMES OF LEATHER (FURTHER PREPARED) INTO SOUTH AFRICA
Figure 40 below depicts import volumes of leather (further prepared) from various regions of the world into South Africa between 2006 and 2015.
2006 2007 2008 2009 2010 2011 2012 2013 2014 2015
Australia and New Zealand 0 0.068 0 0.08 0 0 0 0 0 0
0
0.01
0.02
0.03
0.04
0.05
0.06
0.07
0.08
0.09
Imp
ort
qu
anti
ty (
ton
s)
Period (Years)
Figure 39: Import volumes of raw hides and skins from Oceania
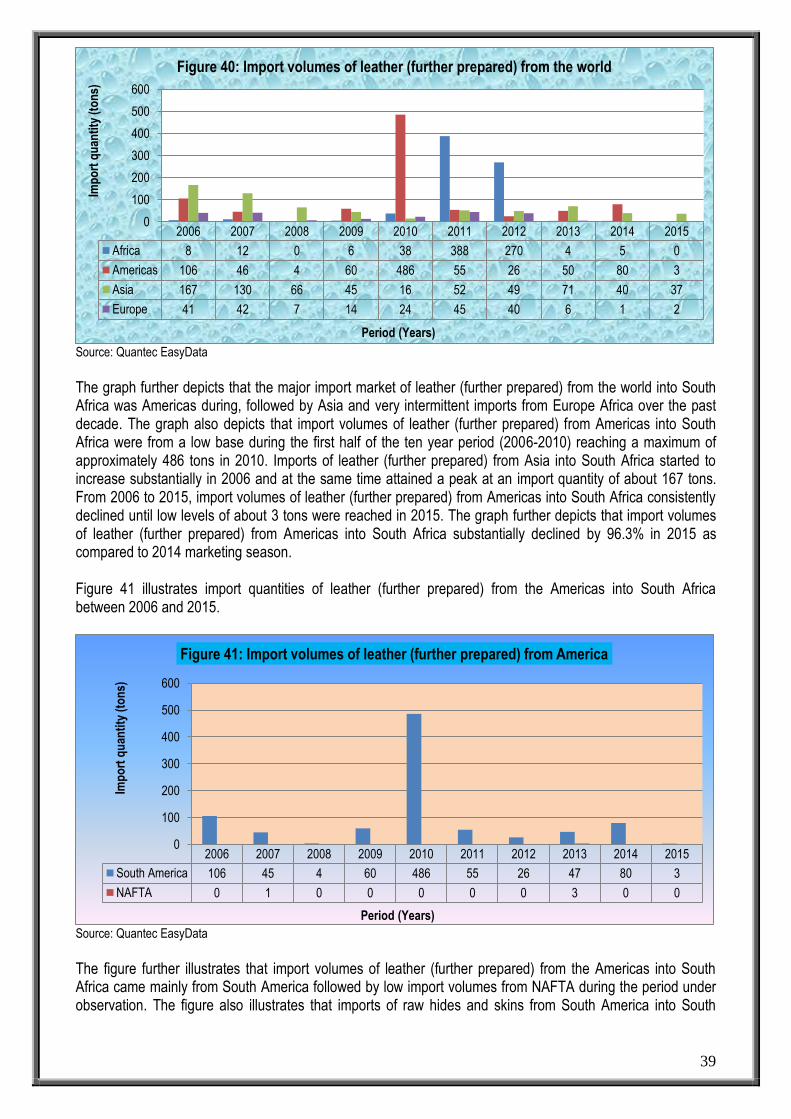
39
Source: Quantec EasyData
The graph further depicts that the major import market of leather (further prepared) from the world into South Africa was Americas during, followed by Asia and very intermittent imports from Europe Africa over the past decade. The graph also depicts that import volumes of leather (further prepared) from Americas into South Africa were from a low base during the first half of the ten year period (2006-2010) reaching a maximum of approximately 486 tons in 2010. Imports of leather (further prepared) from Asia into South Africa started to increase substantially in 2006 and at the same time attained a peak at an import quantity of about 167 tons. From 2006 to 2015, import volumes of leather (further prepared) from Americas into South Africa consistently declined until low levels of about 3 tons were reached in 2015. The graph further depicts that import volumes of leather (further prepared) from Americas into South Africa substantially declined by 96.3% in 2015 as compared to 2014 marketing season. Figure 41 illustrates import quantities of leather (further prepared) from the Americas into South Africa between 2006 and 2015.
Source: Quantec EasyData
The figure further illustrates that import volumes of leather (further prepared) from the Americas into South Africa came mainly from South America followed by low import volumes from NAFTA during the period under observation. The figure also illustrates that imports of raw hides and skins from South America into South
2006 2007 2008 2009 2010 2011 2012 2013 2014 2015
Africa 8 12 0 6 38 388 270 4 5 0
Americas 106 46 4 60 486 55 26 50 80 3
Asia 167 130 66 45 16 52 49 71 40 37
Europe 41 42 7 14 24 45 40 6 1 2
0
100
200
300
400
500
600Im
po
rt q
uan
tity
(to
ns)
Period (Years)
Figure 40: Import volumes of leather (further prepared) from the world
2006 2007 2008 2009 2010 2011 2012 2013 2014 2015
South America 106 45 4 60 486 55 26 47 80 3
NAFTA 0 1 0 0 0 0 0 3 0 0
0
100
200
300
400
500
600
Imp
ort
qu
anti
ty (
ton
s)
Period (Years)
Figure 41: Import volumes of leather (further prepared) from America
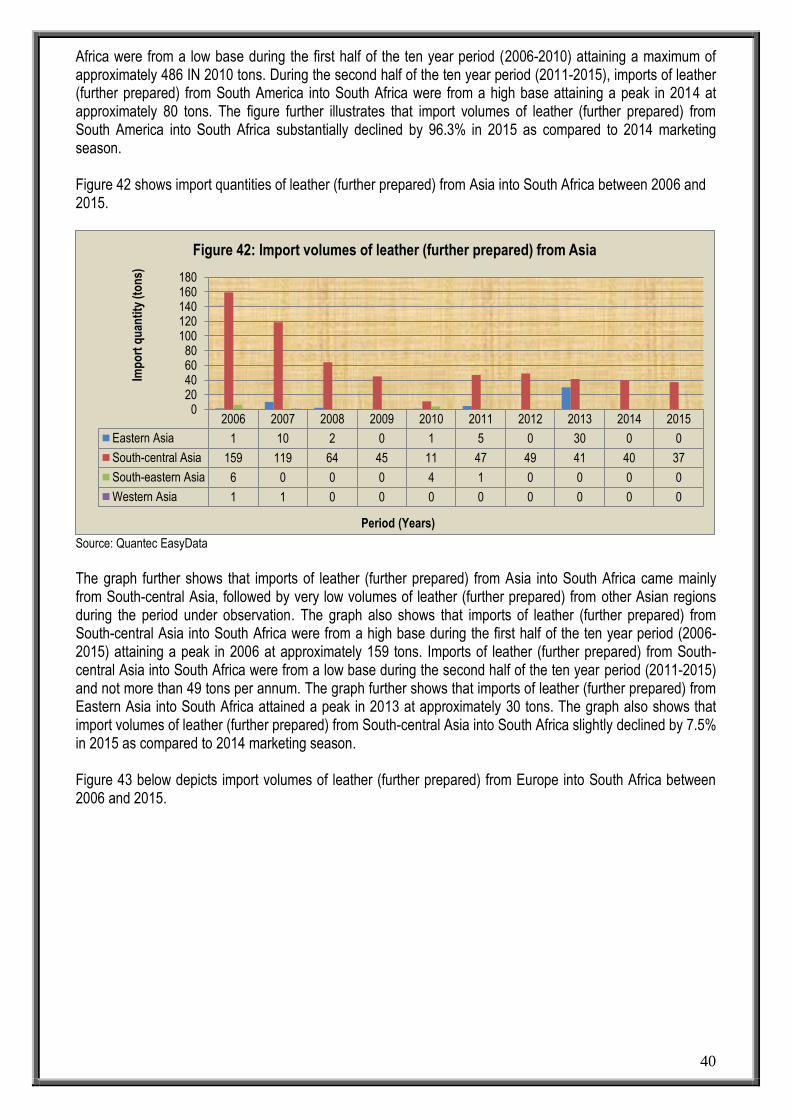
40
Africa were from a low base during the first half of the ten year period (2006-2010) attaining a maximum of approximately 486 IN 2010 tons. During the second half of the ten year period (2011-2015), imports of leather (further prepared) from South America into South Africa were from a high base attaining a peak in 2014 at approximately 80 tons. The figure further illustrates that import volumes of leather (further prepared) from South America into South Africa substantially declined by 96.3% in 2015 as compared to 2014 marketing season. Figure 42 shows import quantities of leather (further prepared) from Asia into South Africa between 2006 and 2015.
Source: Quantec EasyData
The graph further shows that imports of leather (further prepared) from Asia into South Africa came mainly from South-central Asia, followed by very low volumes of leather (further prepared) from other Asian regions during the period under observation. The graph also shows that imports of leather (further prepared) from South-central Asia into South Africa were from a high base during the first half of the ten year period (2006-2015) attaining a peak in 2006 at approximately 159 tons. Imports of leather (further prepared) from South-central Asia into South Africa were from a low base during the second half of the ten year period (2011-2015) and not more than 49 tons per annum. The graph further shows that imports of leather (further prepared) from Eastern Asia into South Africa attained a peak in 2013 at approximately 30 tons. The graph also shows that import volumes of leather (further prepared) from South-central Asia into South Africa slightly declined by 7.5% in 2015 as compared to 2014 marketing season. Figure 43 below depicts import volumes of leather (further prepared) from Europe into South Africa between 2006 and 2015.
2006 2007 2008 2009 2010 2011 2012 2013 2014 2015
Eastern Asia 1 10 2 0 1 5 0 30 0 0
South-central Asia 159 119 64 45 11 47 49 41 40 37
South-eastern Asia 6 0 0 0 4 1 0 0 0 0
Western Asia 1 1 0 0 0 0 0 0 0 0
020406080
100120140160180
Imp
ort
qu
anti
ty (
ton
s)
Period (Years)
Figure 42: Import volumes of leather (further prepared) from Asia
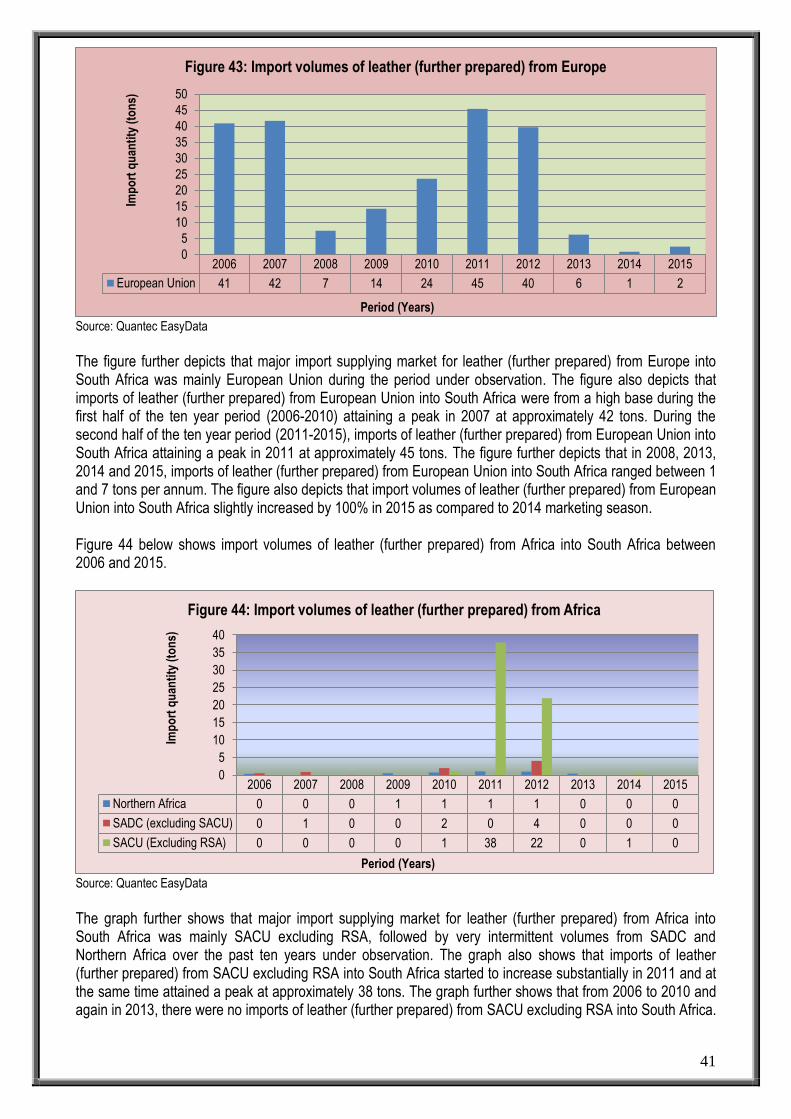
41
Source: Quantec EasyData
The figure further depicts that major import supplying market for leather (further prepared) from Europe into South Africa was mainly European Union during the period under observation. The figure also depicts that imports of leather (further prepared) from European Union into South Africa were from a high base during the first half of the ten year period (2006-2010) attaining a peak in 2007 at approximately 42 tons. During the second half of the ten year period (2011-2015), imports of leather (further prepared) from European Union into South Africa attaining a peak in 2011 at approximately 45 tons. The figure further depicts that in 2008, 2013, 2014 and 2015, imports of leather (further prepared) from European Union into South Africa ranged between 1 and 7 tons per annum. The figure also depicts that import volumes of leather (further prepared) from European Union into South Africa slightly increased by 100% in 2015 as compared to 2014 marketing season. Figure 44 below shows import volumes of leather (further prepared) from Africa into South Africa between 2006 and 2015.
Source: Quantec EasyData
The graph further shows that major import supplying market for leather (further prepared) from Africa into South Africa was mainly SACU excluding RSA, followed by very intermittent volumes from SADC and Northern Africa over the past ten years under observation. The graph also shows that imports of leather (further prepared) from SACU excluding RSA into South Africa started to increase substantially in 2011 and at the same time attained a peak at approximately 38 tons. The graph further shows that from 2006 to 2010 and again in 2013, there were no imports of leather (further prepared) from SACU excluding RSA into South Africa.
2006 2007 2008 2009 2010 2011 2012 2013 2014 2015
European Union 41 42 7 14 24 45 40 6 1 2
0
5
10
15
20
25
30
35
40
45
50
Imp
ort
qu
anti
ty (
ton
s)
Period (Years)
Figure 43: Import volumes of leather (further prepared) from Europe
2006 2007 2008 2009 2010 2011 2012 2013 2014 2015
Northern Africa 0 0 0 1 1 1 1 0 0 0
SADC (excluding SACU) 0 1 0 0 2 0 4 0 0 0
SACU (Excluding RSA) 0 0 0 0 1 38 22 0 1 0
0
5
10
15
20
25
30
35
40
Imp
ort
qu
anti
ty (
ton
s)
Period (Years)
Figure 44: Import volumes of leather (further prepared) from Africa

42
Imports of leather (further prepared) from Northern Africa and SADC excluding SACU into South Africa ranged between 1 and 4 tons per annum. The graph also shows that import volumes of leather (further prepared) from SACU excluding RSA into South Africa decreased by 100% in 2015 as compared to 2014 marketing season.

43
5. SKINS, HIDES AND LEATHER VALUE CHAIN Figure 45: Skins, Hides and Leather value chain
Source: Richard Ballard (UKZN)
Farmers, Feedlots and Abattoirs
(Exports of hides and skins)
Wet Blues and Wet
White (Appendix A)
(Appendix C)
Footweat and General
Goods Manufacturers.
(Appendix A)
Footwear and General
Goods Leather (Appendix A)
Domestic Footwear
and General Goods
Market (Minor exports)
Automotive Leather
(Exports of splits, splits
for domestic use)
Cut and Stitch Auto
Upholstery (Exports of
car assembler’s esp.
Germany & Japan)
Small Domestic Market
1. Skins and Hides
Supply
2. Semi Processed
3. Finished Leather
4. Finished Product
5. Market

44
Figure 48 shows that the value chain is divided into five stages: Skin & hide supply, Semi – processed leather, Finished leather, Finished products; and The market.
The various operations are linked by a series of arrows showing imports, exports and transfers down the value chain in South Africa. Stage 1 in the diagram is skins and hides supply. This stage involves the recovery of hides and skins from farming stock bred primarily for meat consumption. Thus, hides and skins are mainly recovered from slaughterhouses and farms. Because the leather industry depends on the recovery of hides and skins of the farming stock, availability of raw material directly depends on the size of the animal population, the take-off ratio and the weight/size of the hide/skin recovered. The bulk of the skins and hides go onto the next stage of processing and a small percent do get exported. Many of the feedlots / abattoirs have structural links with hide traders and primary tanneries. Exports consist of hand–flayed dry salted and sun dried produced in rural areas outside of official abattoirs. Exporters argue that the reason to be exported is that they are low grade hides and have little use here at home. Some abattoirs export good quality hides rather than channelling them into domestic processing. Stage 2 is the production of semi–processed skins and hides. Majority of the skins and hides are locally sourced and minority is imported. At this stage the skins and hides undergo the first stage of tanning which preserves the skins and hides as a semi– processed leather. This stage is also called the ‘wet blue’ because of the wet and a pale blue colour which comes from the chromium salt used to tan the skin or hide. Some tanneries use tannins from sources such as wattle trees to preserve the leather. This process is named vegetable tanning and the stage labelled ‘wet white’. It is interesting to note that several ‘wet blue, and ‘wet white’ processors are owned by local feedlots/abattoirs. From this stage the skin or hide can travel in one of the three directions: footwear and general goods tanning automotive tanning and exports. The better quality wet-blues are sold to automotive-tanners and the lower quality ones to tanneries that manufacture other leather products. Stage 3 is the finished leather. At this stage of the leather chain the collected raw hides are converted into what consumers recognise as leather. The semi – processed leather that stay in the country either travel to automotive re-tanning or footwear / general goods re-tanning. Automotive re-tanners get access to the bulk of skins / hides (mainly high quality); automotive upholstery only uses part of the skin/hide. The part that they use is the outer layer of the skin / hide (called grain). The inner layer of the skin / hide (called the flesh or second split) is made available to footwear re-tanners or get exported. Stage 4 is the finished product. In this stage there are factories involved in cut and stitching operations that manufacture leather seat covers for the automotive industry; and footwear and general leather products including fashion items like belts, leather clothing, wallets, handbags, filo-faxes, luggage, furniture gun accessories, sport goods, footwear and industrial protective clothing. Stage 5 is the market. The automotive industry is export focused mainly to luxury car manufacturing assemblers in Germany and Japan. This is due to Motor Industry Development Programme (MIDP) of the Department of Trade and Industry. The MIDP contains an import-export complementation scheme that gives credits to car component manufacturers for any exported goods. These credits are used to offset duty on car components that are imported. Export of stitched leather seat covers responded positively to this incentive and increased the demand for local hides and skins.

45
The footwear and general goods sector is domestically focused and their continued inward focus lent themselves to extensive penetration of cheap imports from China. 6. BLACK ECONOMIC EMPOWERMENT 6.1. In August, 2007 automotive upholstery sewing company Allied Trim Components (Pty Ltd) sold a 50% share in its business to a black-owned company, Isibizo Investments (Pty) Ltd. This is considered to be the first BEE deal of its kind in the automotive industry. The BEE deal was quickly followed by a joint venture with Mario Levi SPA to form a separate automotive upholstery sewing company, Mia Automotive (Pty) Ltd, in Uitenhage near Port Elizabeth. 7. MARKET ACCESS 7.1. Export tariffs of hides and skins during 2015 Table 19: Export tariffs of raw hides and skins of bovine originating from RSA during 2015
No. Country Trade regime description
Applied tariffs
Total ad valorem equivalent tariff (estimated)
1 Angola MFN duties (Applied) 2.00% 2.00%
2 Mozambique MFN duties (Applied) 2.50% 2.50%
Preferential tariff for RSA 0.00% 0.00%
3 Mauritius MFN duties (Applied) 0.00% 0.00%
4 Zimbabwe MFN duties (Applied) 5.00% 5.00%
Preferential tariff for (SADC) countries including South Africa
0.00% 0.00%
6 Canada MFN duties (Applied) 0.00% 0.00%
7 Hong Kong MFN duties (Applied) 0.00% 0.00%
8 China MFN duties (Applied) 8.00% 8.00% Source: Market Access Map
As can be seen in Table 19 that in 2015, exports of skins, hides from South Africa received preferential treatment because of the free trade agreements between South Africa and SADC. Skins, hides and leather get free entry into many lucrative markets in some of Asian countries such as Hong Kong and SADC except in China. Zimbabwe and China have high tariffs that range between 5% and 80.00% to protect their domestic production. Skins, hides and leather from South Africa enjoy duty free access to the EU’s market under African, Caribbean and Pacific Countries Trade Agreement (ACP); to the US market under the African Growth and Opportunity Act (AGOA) and receive preferential access in Turkey under Generalized System of Preferences (GSP). 7.2 Non–tariff barriers (NTB) Non-tariff barriers take the form of strict sanitary and phyto-sanitary measures or adherence to stringent, certification measures such as 1SO 9000 certification. These measures span a product’s lifecycle: the raw material a product is made from, the manner the product is fabricated, the management of production process, labelling standards and packaging requirements.

46
Developed countries argue that NTBs are applied to products to ensure that imported products satisfy environmental, consumer health, consumer safely and social concerns. NTB can either be statutory obligations or determined by the market. Market related NTBs are not compulsory but are growing in importance as consumers become more discerning about the impact their purchases have on society and the environment. Non–tariff barriers potential to hinder exporters’ ability to sell their products into foreign markets is greater than tariff barriers. Non–tariff barriers increase a producer’s costs throughout the supply chain due to the complexity of the processes that s/he must adhere to and the bureaucratic cost of ensuring that procedures are documented. In summary the following countries, which are the world’s largest importers of skin, hides and leather place the following Non– tariffs barriers. 7.2.1 European Union The exporter must satisfy the following standards in order for his/her product to be accepted in the EU. Table 20: European Union Directives
No Directive Description
1 Directive (2002/61/EC) Limits the use of dangerous substances and preparations (azocolourants) in textile and leather products. It should be noted that Germany and The Netherlands have stricter regulation pertaining to the usage of azo dyes Pentachlorophenol (PCP), chromium and disperse dyes.
2 Directive (94/27/EEC ) Restricts nickel and nickel compounds for metal products in direct contact with the skin.
3 Regulation (338/97 EC Streamlines the implementation of CITES in the EU. CITES contains provisions to protect endangered species through controlling international trade in these species.
4 Directive (85/374/EEC) Assigns liability to a manufacturer, or his representative in the EU, for compensation to person and property caused by a product that turns out to be not as safe as expected.
5 Social Market Requirements
Certification schemes have been developed for social management systems. Examples of such schemes are SA8000 which includes basic labour standards based on international ILO Conventions.
6 Environmental Market Requirements
Although countries have developed their own standards it would be simpler for an exporter to satisfy two general standards: BS 7750 and ISO 14001. These standards are based on the ISO 9000 series and stipulate the requirements for an environmental management system. Environmental issues pertaining to the production of leather occur in cleaning, tanning, finishing and waste treatment processes.
7 Quality Market Requirements
The most important quality management systems are those under the ISO 9000:2000 series. The SG label or Schadstoffgeprüfft label stands for “tested for dangerous substances”.
8 Directive 94/62/EC Establishes common objectives for member countries regarding the recovery and the recycling of packaging. Also the maximum concentrations of lead, cadmium, mercury, and chromium allowed in packaging are set at 250 ppm and 100 ppm, respectively. Given these regulations, exporters should package goods in re-usable and recyclable materials.
9 Directive 2004/102/EC Lies down requirements for wooden packaging material that is imported in its function of packaging material or dunnage with the import of goods, must be
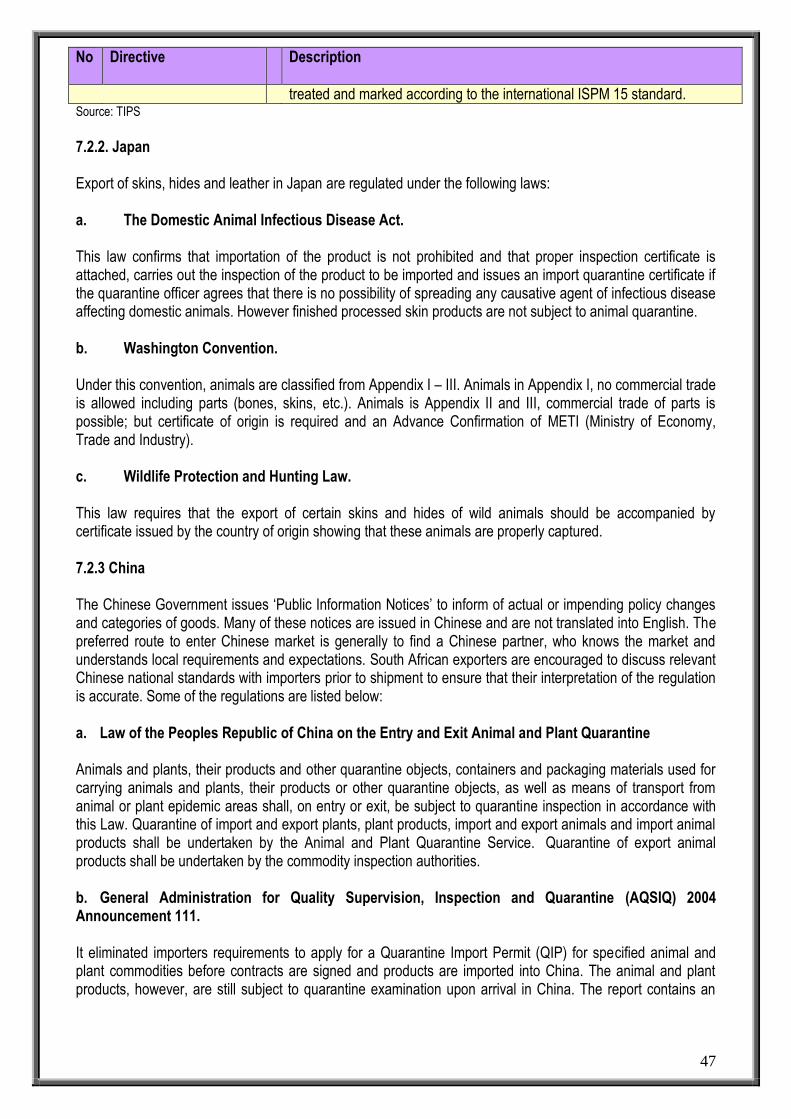
47
No Directive Description
treated and marked according to the international ISPM 15 standard. Source: TIPS
7.2.2. Japan Export of skins, hides and leather in Japan are regulated under the following laws: a. The Domestic Animal Infectious Disease Act. This law confirms that importation of the product is not prohibited and that proper inspection certificate is attached, carries out the inspection of the product to be imported and issues an import quarantine certificate if the quarantine officer agrees that there is no possibility of spreading any causative agent of infectious disease affecting domestic animals. However finished processed skin products are not subject to animal quarantine. b. Washington Convention. Under this convention, animals are classified from Appendix I – III. Animals in Appendix I, no commercial trade is allowed including parts (bones, skins, etc.). Animals is Appendix II and III, commercial trade of parts is possible; but certificate of origin is required and an Advance Confirmation of METI (Ministry of Economy, Trade and Industry). c. Wildlife Protection and Hunting Law. This law requires that the export of certain skins and hides of wild animals should be accompanied by certificate issued by the country of origin showing that these animals are properly captured. 7.2.3 China The Chinese Government issues ‘Public Information Notices’ to inform of actual or impending policy changes and categories of goods. Many of these notices are issued in Chinese and are not translated into English. The preferred route to enter Chinese market is generally to find a Chinese partner, who knows the market and understands local requirements and expectations. South African exporters are encouraged to discuss relevant Chinese national standards with importers prior to shipment to ensure that their interpretation of the regulation is accurate. Some of the regulations are listed below: a. Law of the Peoples Republic of China on the Entry and Exit Animal and Plant Quarantine Animals and plants, their products and other quarantine objects, containers and packaging materials used for carrying animals and plants, their products or other quarantine objects, as well as means of transport from animal or plant epidemic areas shall, on entry or exit, be subject to quarantine inspection in accordance with this Law. Quarantine of import and export plants, plant products, import and export animals and import animal products shall be undertaken by the Animal and Plant Quarantine Service. Quarantine of export animal products shall be undertaken by the commodity inspection authorities. b. General Administration for Quality Supervision, Inspection and Quarantine (AQSIQ) 2004 Announcement 111. It eliminated importers requirements to apply for a Quarantine Import Permit (QIP) for specified animal and plant commodities before contracts are signed and products are imported into China. The animal and plant products, however, are still subject to quarantine examination upon arrival in China. The report contains an

48
UNOFFICIAL translation of the announcement along with the list of designated commodities no longer requiring a QIP. c. AQSIQ 2002 Decree No. 40, the Provisions for the Administration of Risk Analysis on Entry of Animals and Animal Products, was adopted on October 18, 2002 and approved on December 31, 2002 for implementation from February 1, 2003. d. AQSIQ 2002 Announcement Number 34, The Administrative Rules on Agencies Applying for Import and Export Inspection and Quarantine, was published on the AQSIQ website on November 6, 2002 for enforcement from January 1, 2003. The "Rules" were published in Issue 17 of the China Foreign Trade and Economic Cooperation Gazette on March 18, 2003, also. The Announcement provides guidelines and requirements for agencies/business enterprises that use agents for importing and exporting commodities. e. Regulation on Animal Origin Feed Products - CH3093 This Announcement regulates the importation of animal and animal products from BSE affected countries. 7.2.4 United States of America If the product is derived from exotic wildlife or endangered species, it must comply with Fish and Wildlife
(FWS) and Convention on International Trade in Endangered Species of Wild Fauna and Flora (CITES) license, permit, country of origin, import documentation and record keeping requirements.
If the product is derived from domestic animals, it must comply with USDA Animal and Plant Health Inspection Service (APHIS) import, quarantine and permit and certification requirements.
A veterinary certificate issued by a salaried veterinarian of the country of origin stating that the animal products is free from applicable animal diseases must accompany each consignment. The specific information required varies depending on the species.
7.3 Import tariffs of raw skins, hides and leather Table 21: Import tariffs of raw hides and skins originating from various countries of the world during 2015
No. Country Trade regime description Applied tariffs Total ad valorem equivalent tariff (estimated)
1 Malawi
MFN duties (Applied) 10.00% 10.00%
Preferential tariff for SADC countries
0.00% 0.00%
2 Zambia
MFN duties (Applied) 10.00% 10.00%
Preferential tariff for SADC countries
0.00% 0.00%
3 Zimbabwe
MFN duties (Applied 10.00% 10.00%
Preferential tariff for SADC countries
0.00% 0.00%
4 Brazil
MFN duties (Applied) 10.00% 10.00%
5 Germany
MFN duties (Applied) 10.00% 10.00%
Preferential tariff for SADC countries
0.00% 0.00%
6 Mauritius
MFN duties (Applied) 10.00% 10.00%
Preferential tariff for SADC countries
0.00% 0.00%

49
No. Country Trade regime description Applied tariffs Total ad valorem equivalent tariff (estimated)
7
Mozambique
MFN duties (Applied) 10.00% 10.00%
Preferential tariff for SADC countries
0.00% 0.00%
8 USA
MFN duties (Applied) 10.00% 10.00%
9 India MFN duties (Applied) 10.00% 10.00%
10 Pakistan MFN duties (Applied) 10.00% 10.00% Source: Market Access Map
Table 21 above indicates that world countries/ markets importing hides and skins into South Africa are charged between 1% and 10% respectively during 2015. Those countries with trade agreements with South Africa export their product free of charge during 2015 at 0.00%, (Most Favoured Nations). The table further indicates that South Africa has a preferential trading agreement (PTAs) with SADC countries and that means SADC countries export hides and skins to South Africa free of charge during 20154. 7.3.1 Non – tariff barriers South Africa formulated non–tariff barriers for the purpose of preventing infectious or parasitic diseases of animals and other harmful from spreading into or out of the country, protecting the production of agriculture, animal husbandry and fishery as well as human health, and promoting the development of foreign economic relations and trade. The following is a summary of some of the requirements: All facilities (abattoirs, tannery, intermediate stores and export stores) must be approved annually and a
notice prominently displayed at all entrances and exits stating “Approved Animal Health Export Store”. All premises should be properly fenced to prevent access of any livestock and must have secure
lockable gates at all entrances and be locked when not manned to prevent access of unauthorized persons.
Original Health Attestation certificate signed by a salaried veterinarian in the country of origin indicating that all the necessary inspections, certification and record keeping required to ensure the validity and traceability of these hides/skins and are sourced from the approved abattoir, and animals were not slaughtered to eliminate any epizootic disease must accompany the consignment.
Original Veterinary Import permit must accompany the consignment. The hides/skins in the consignment should at all the time, be transported, handled and stored in such a
manner so as to ensure that they are not exposed to hides / skins of a lower disease status. Hygiene status of premises and equipments must be maintained at all times. A complete register must be kept for all hides/skins that enter and leave the tannery. There must be one-way flow of production so that raw materials should not contaminate processed
products. This includes between raw and salted material and material that is freshly salted and salted in excess of 14 days.
Hides/skins must not leave the tannery for any further processes. The hides and skins should undergo all precautions to avoid recontamination with pathogenic agents
and should not be in contact with any animal products or live animals presenting a risk of spreading a serious transmissible disease.
Any other documentation specified, e.g. Rabies Vaccination Certificate, etc. If the product is derived from exotic wildlife or endangered species, the consignment must be
accompanied by CITES permit from Conservation Authority in the country of origin.
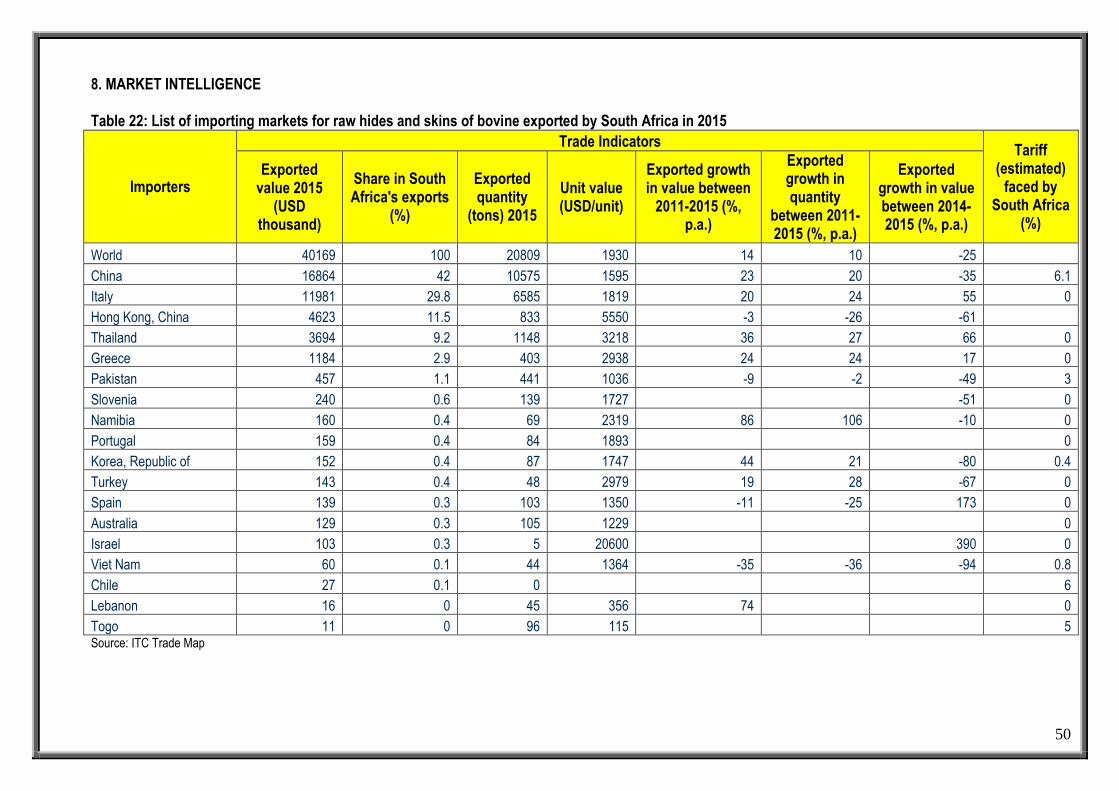
50
8. MARKET INTELLIGENCE Table 22: List of importing markets for raw hides and skins of bovine exported by South Africa in 2015
Importers
Trade Indicators Tariff
(estimated) faced by
South Africa (%)
Exported value 2015
(USD thousand)
Share in South Africa's exports
(%)
Exported quantity
(tons) 2015
Unit value (USD/unit)
Exported growth in value between
2011-2015 (%, p.a.)
Exported growth in quantity
between 2011-2015 (%, p.a.)
Exported growth in value between 2014-2015 (%, p.a.)
World 40169 100 20809 1930 14 10 -25
China 16864 42 10575 1595 23 20 -35 6.1
Italy 11981 29.8 6585 1819 20 24 55 0
Hong Kong, China 4623 11.5 833 5550 -3 -26 -61
Thailand 3694 9.2 1148 3218 36 27 66 0
Greece 1184 2.9 403 2938 24 24 17 0
Pakistan 457 1.1 441 1036 -9 -2 -49 3
Slovenia 240 0.6 139 1727 -51 0
Namibia 160 0.4 69 2319 86 106 -10 0
Portugal 159 0.4 84 1893 0
Korea, Republic of 152 0.4 87 1747 44 21 -80 0.4
Turkey 143 0.4 48 2979 19 28 -67 0
Spain 139 0.3 103 1350 -11 -25 173 0
Australia 129 0.3 105 1229 0
Israel 103 0.3 5 20600 390 0
Viet Nam 60 0.1 44 1364 -35 -36 -94 0.8
Chile 27 0.1 0 6
Lebanon 16 0 45 356 74 0
Togo 11 0 96 115 5 Source: ITC Trade Map

51
Table 22 shows the list of importing markets for raw hides and skins of bovine exported by South Africa during 2015. Table 22 further shows that during 2015, South Africa exported a total of 20 809 tons of raw hides and skins of bovine to the world. The table also shows that South Africa was a net exporter of raw hides and skins of bovine to the world, as the country imported only 11 695 tons during 2015. The table further shows that in world terms exports of raw hides and skins of bovine from South Africa to the world have increased by 14% in value and by 10% in quantity between 2011 and 2015. The major export destination for raw hides and skins of bovine originating from South Africa was mainly China, followed by Hong Kong of China and Italy. The table also shows that China alone have absorbed 42% of the total raw hides and skins of bovine exports originating from South Africa, followed by Italy at 29.8% and Hong Kong of China at 11.5%. The table further show that South Africa’s raw hides and skins of bovine exports to China increased by 23% in value and increased by 20% in volume between 2011 and 2015. The table also shows that South Africa’s raw hides and skins of bovine exports to Hong Kong decreased by 3% in value and 26% in volume between 2011 and 2015. The table also shows that South Africa’s raw hides and skins of bovine exports to Italy also increased by 20% in value and increased by 24% in volume between 2011 and 2015. In terms of access to various international markets for South African raw hides and skins of bovine, countries such as China protect their raw hides and skins of bovine industries with higher tariffs of 6.1% ad valorem.
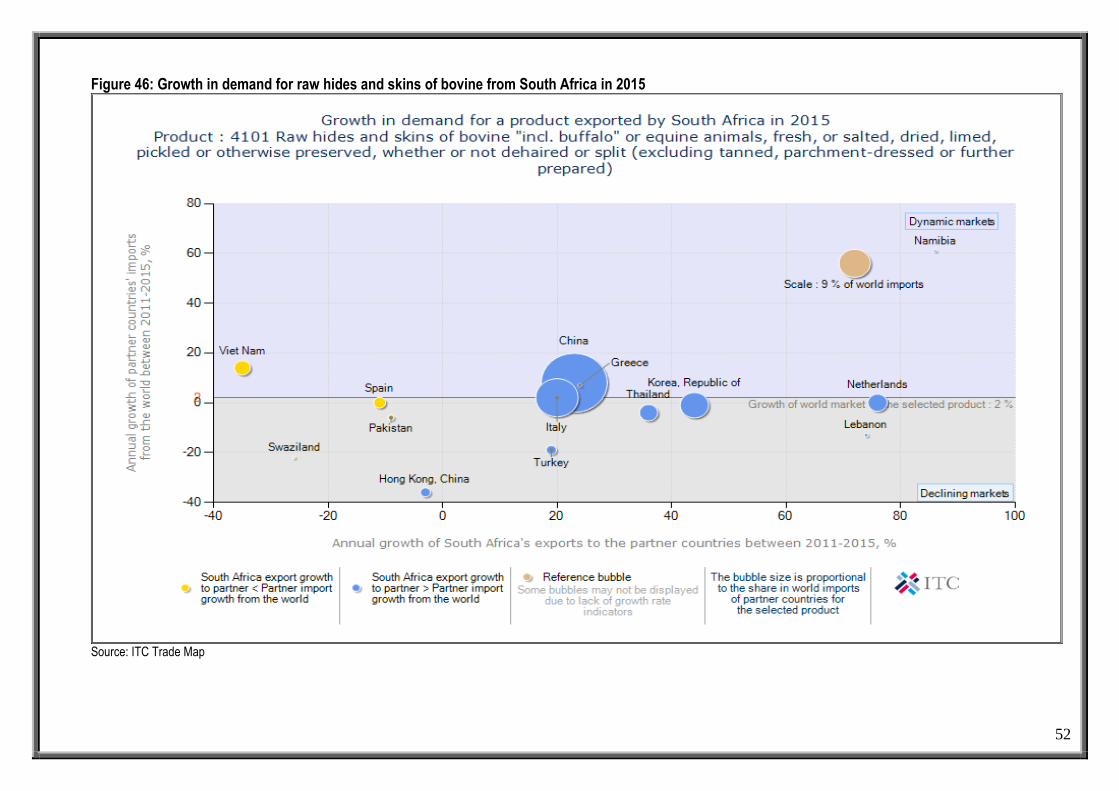
52
Figure 46: Growth in demand for raw hides and skins of bovine from South Africa in 2015
Source: ITC Trade Map

53
Figure 46 above indicates growth in demand for raw hides and skins of bovine from South Africa to the world during 2015. The bubble graph further indicates that China and Italy were the largest import markets of raw hides and skins of bovine from South Africa to the world during 2015. However, South Africa’s exports of raw hides and skins of bovine to China increased by 23%, while the China’s imports from the world also increased by 8% to 20% between 2011 and 2015. The bubble graph further indicates that South Africa has increased its exports of raw hides and skins of bovine to Namibia between 2011 and 2015 by 87%, as compared to Namibia’s imports from the world of about 35% during the same period under scrutiny. The bubble graph also indicates that South Africa’s raw hides and skins of bovine exports to the above-mentioned country have outgrown the major countries’ growth in imports from the world between 2011 and 2015. Furthermore, South Africa has increased its raw hides and skins of bovine exports to declining markets of Netherlands and has decreased its raw hides and skins of bovine exports to declining markets of Korea Republic, China by approximately between 0% and 40% between 2011 and 2015.
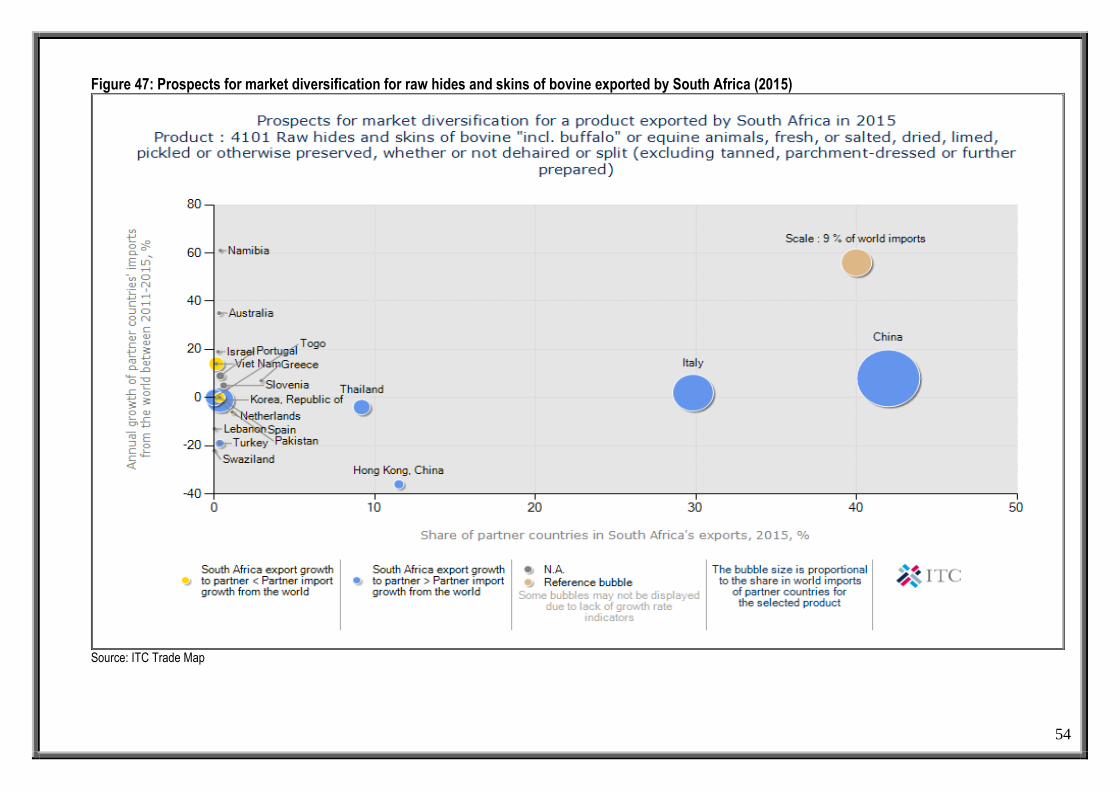
54
Figure 47: Prospects for market diversification for raw hides and skins of bovine exported by South Africa (2015)
Source: ITC Trade Map

55
Figure 47 depicts prospects for market diversification for raw hides and skins of bovine exported by South Africa to the world during 2015. The bubble graph further depicts that China and Italy were the biggest import markets for raw hides and skins of bovine from South Africa during the period under observation. The figure also depicts that if South Africa was to diversify its exports of raw hides and skins of bovine, small but attractive markets exist in Thailand, Hong Kong and Italy because these countries have increased their annual growth of partner countries imports from the world between 2011 and 2015 from 0% to 40%. The figure further depicts that other markets exist in Hong Kong during this period under review. Over the same period, China alone managed to obtain a share 42% of South Africa’s raw hides and skins of bovine exports, followed by Italy at 29.8%, and Hong Kong at 11.5% during the period under examination.

56
Table 23: List of supplying markets for raw hides and skins of bovine imported by South Africa in 2015
Exporters
Trade Indicators Tariff
(estimated) applied by
South Africa (%)
Imported value 2015 (USD thousand)
Share in South
Africa's imports (%)
Imported quantity
(tons) 2015
Unit value (USD/unit)
Imported growth in
value between 2011- 2015
(%, p.a.)
Imported growth in quantity
between 2011-2015 (%, p.a.)
Imported growth in value between 2014-2015 (%, p.a.)
World 9049 100 11695 774 16 17 -34 0
Botswana 5667 62.6 5985 947 28 25 -14
Area Nes 685 7.6 617 1110 360 0
Zambia 549 6.1 724 758 156 -56 0
Mozambique 527 5.8 456 1156 128 207 28 5
Australia 286 3.2 1575 182 400 140 5
Argentina 272 3 493 552 -7 5
Uganda 245 2.7 551 445 384 -18 0
Zimbabwe 243 2.7 163 1491 -29 -41 -92 5
Kenya 193 2.1 542 356 84 0
Swaziland 149 1.6 123 1211 -24 -21 -69 5
New Zealand 119 1.3 347 343 341 0
Namibia 45 0.5 51 882 -52 -41 -73 0
Italy 31 0.3 48 646 73 -14 0
Lesotho 23 0.3 18 1278 -5 -18 5
Brazil 12 0.1 0 -20 -92 5
China 5 Source: ITC Trade Map

57
Table 23 above illustrates the list of supplying markets for raw hides and skins of bovine imported by South Africa during 2015. The table further illustrates that South Africa is a net exporter of raw hides and skins of bovine from the world into South Africa. During 2015, the country imported a total of 11 695 tons of raw hides and skins of bovine versus its exports of 20 809 tons over the same period. In world terms imports of raw hides and skins of bovine into South Africa have increased by an average of 16% in value and increased by 17% in volume terms between 2011 and 2015. Raw hides and skins of bovine imports originates mainly from Botswana, followed by Zambia, with Botswana commanding 62.6% share in South Africa’s imports, while Zambia was at approximately 6.1% over the same period. Other small markets for raw hides and skins of bovine imports into South Africa are Uganda, Argentina and Namibia. Of importance to note is that imports of raw hides and skins of bovine originating from Swaziland have decreased by 2% in value and 2% in volume terms between 2011 and 2015, while those originating from Mozambique have increased in value by 128% and in quantity by 207% during the same period under review.

58
Figure 48: Competitiveness of suppliers to South Africa for raw hides and skins imports (2015)
Source: ITC Trade Map

59
Figure 48 above shows competitiveness of suppliers to South Africa for raw hides and skins of bovine imports during 2015. The bubble graph further shows that during the period between 2011 and 2015, Swaziland and Brazil were the biggest markets for raw hides and skins of bovine during 2015. The bubble graph also shows that Mozambique was the most competitive import market in terms of imports of raw hides and skins of bovine into South Africa in 2015 with an annual growth of South Africa’s imports of about 100%. Imports of raw hides and skins of bovine from Australia, Botswana and Italy into South Africa grew at an increasing rate of 0.00% and 100% respectively which is less than the other countries exports to the rest of the world.

60
Figure 49: Prospects for diversification of suppliers for raw hides and skins imported by South Africa 2015
Source: ITC Trade Map

61
Figure 49 depicts prospects for diversification of suppliers for raw hides and skins of bovine imported by South Africa in 2015. The figure further depicts that Italy was the biggest supplying market for raw hides and skins imported by South Africa in 2015. The bubble graph also depicts that over the same period, Botswana commanded the greatest market share in South Africa’s raw hides and skins of bovine imports at approximately 62.6%, followed by Zambia at approximately 6.1%. The figure further depicts that if South Africa has to diversify its suppliers of raw hides and skins of bovine, small but attractive markets exist in Botswana and Mozambique during 2015.

62
Table 24: List of importing markets for leather of other animals exported by South Africa in 2015
Importers
Trade Indicators Tariff
(estimated) faced by
South Africa (%)
Exported value
2015(USD thousand)
Share in South
Africa's exports (%)
Exported quantity
(tons) 2015
Unit value (USD/unit)
Exported growth in value between 2011-2015 (%, p.a.)
Exported growth in quantity between
2011-2015 (%, p.a.)
Exported growth in value between 2014-2015 (%, p.a.)
World 13969 100 1721 8117 16 28 -55
Germany 5209 37.3 215 24228 87 89 -9 0
Poland 3200 22.9 86 37209 1063 -28 0
Romania 1194 8.5 44 27136 -79 0
Lesotho 1084 7.8 85 12753 -19 -18 -12 0
Zimbabwe 1064 7.6 248 4290 -14 16 -14 0
Hungary 773 5.5 19 40684 474 -92 0
Korea, Republic of 350 2.5 4 87500 33 7 5
Hong Kong, China 342 2.4 526 650 -12 32 -57
Brazil 264 1.9 15 17600 86 9.6
Cambodia 193 1.4 12 16083 40 7
China 145 1 309 469 38 201 -48 5.8 United States of America 31 0.2 2 15500 19 35 -60 0
Botswana 24 0.2 8 3000 -24 0 -48 0
Pakistan 14 0.1 36 389 173 367 3
Malaysia 11 0.1 0 -92 0
Thailand 9 0.1 0 26 -95 5
Austria 9 0.1 1 9000 0 Source: ITC Trade Map

63
Table 24 illustrates the list of importing markets for leather of other animals exported by South Africa to the world during 2015. The table further illustrates that South Africa exported a total of 1 721 tons of leather of other animals to the world as compared to 1 936 tons that South Africa imported over the same period. The comparison above clearly illustrates that South Africa is a net importer of leather of other animals from the world during the period under observation. In world terms exports of leather of other animals from South Africa to the world have increased by 16% in value and by 28% in quantity between 2011 and 2015. The major export destinations for leather of other animals originating from South Africa during 2015 were Germany, Poland and Romania. During 2015 marketing season, Germany alone experienced a market share of 37.3% of the total leather of other animal’s exports originating from South Africa, followed by Poland at 22.9% and Romania at 8.5% respectively. The South African leather of other animals exports to Germany increased by 87% in value and 89% in volume between 2011 and 2015. In terms of access to various international markets for South African leather of other animals, countries such as China, Thailand, Cambodia and Brazil protect their leather of other animals industries with higher tariffs ranging from 5% ad valorem to 10% ad valorem.
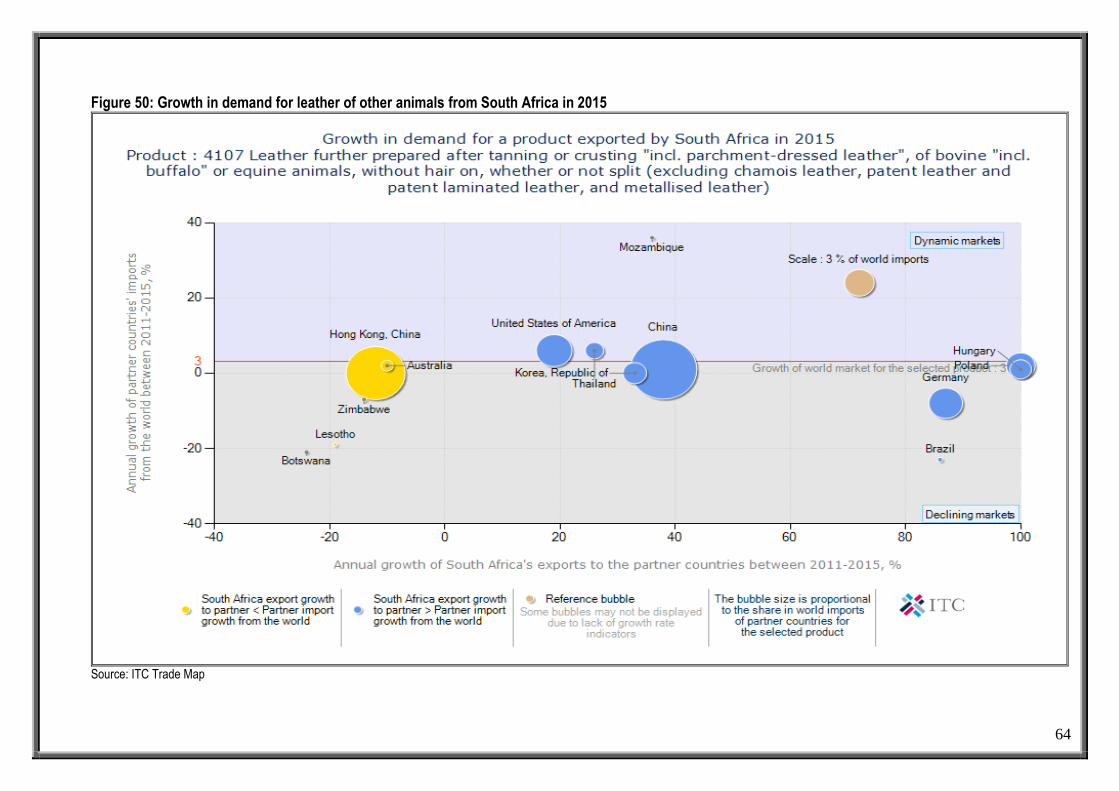
64
Figure 50: Growth in demand for leather of other animals from South Africa in 2015
Source: ITC Trade Map

65
Figure 50 indicates growth in demand for leather of other animals from South Africa to the world during 2015. The bubble graph further indicates that Australia, Thailand and Hong Kong, China were the biggest import markets for leather of other animals from South Africa over the same period. However, South Africa’s exports of leather of other animals to the Hong Kong, China decreased by 12% while USA’s imports from the world also increased by 16% between 2011 and 2015. Germany was in a dynamic market for leather of other animals from South Africa, South Africa has increased its exports of leather to Germany between 2011 and 2015 by 87%. South Africa’s leather of other animals exports to Hungary have increased and outgrown both South Africa’s and the world’s annual growth between 2011 and 2015 by 87% and 89% respectively. Furthermore, South Africa has decreased its leather of other animal’s exports to a declining market of Hungary, Germany and Poland by negative 0.00% to 100% respectively over the past five years.

66
Figure 51: Prospects for market diversification for leather of other animals exported by South Africa in 2015
Source: ITC Trade Map

67
Figure 51 illustrates prospects for market diversification for leather of other animals exported by South Africa during 2015. The bubble graph further illustrates that Hong Kong, China was the biggest import markets for leather of other animals from South Africa during the period under observation. The bubble graph also illustrates that if South Africa is to diversify its exports of leather of other animals, small but attractive markets exist in Hungary, Germany, and Poland during the period under examination. Other small markets exist in Republic of Korea. The bubble graph further illustrates that during 2015, Germany alone experienced a market share of 37.3%, followed by 22.9% from Poland and Romania at 8.5% during the period under review. The bubble graph also illustrates that Germany’s market share of partner countries in South Africa’s leather of other animal’s exports has also increased by 37.29% between 2010 and 2015.
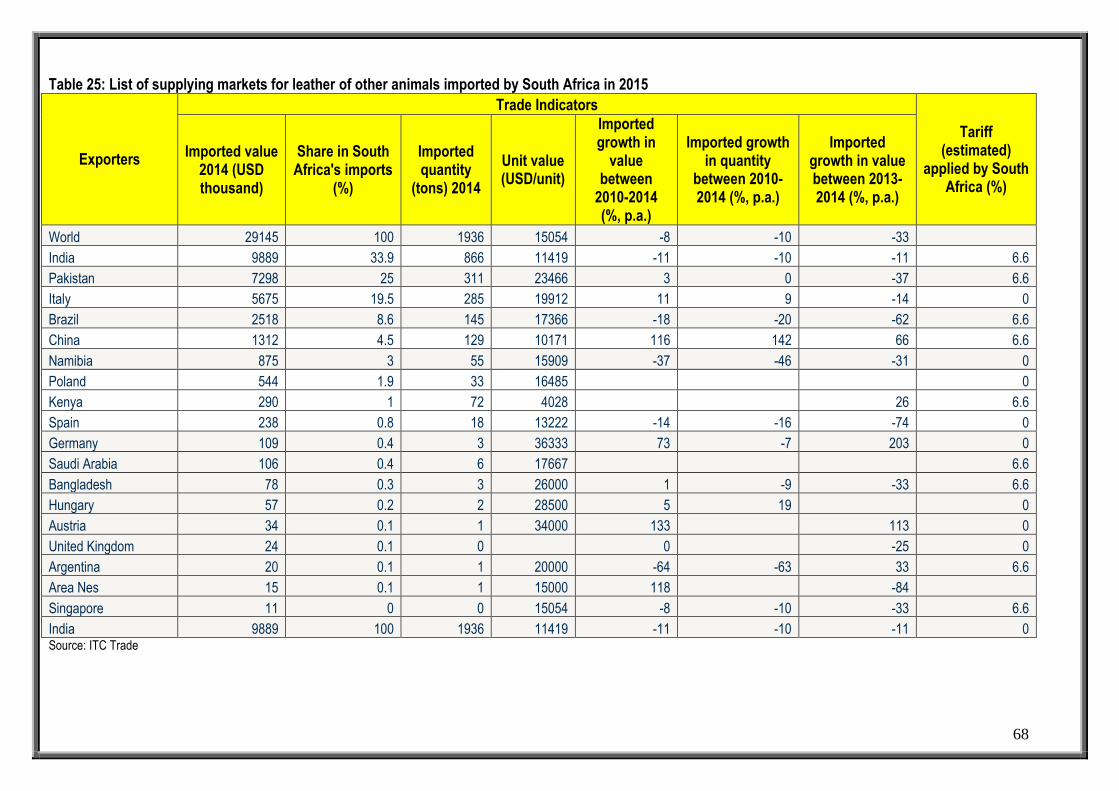
68
Table 25: List of supplying markets for leather of other animals imported by South Africa in 2015
Exporters
Trade Indicators
Tariff (estimated)
applied by South Africa (%)
Imported value 2014 (USD thousand)
Share in South Africa's imports
(%)
Imported quantity
(tons) 2014
Unit value (USD/unit)
Imported growth in
value between
2010-2014 (%, p.a.)
Imported growth in quantity
between 2010-2014 (%, p.a.)
Imported growth in value between 2013-2014 (%, p.a.)
World 29145 100 1936 15054 -8 -10 -33
India 9889 33.9 866 11419 -11 -10 -11 6.6
Pakistan 7298 25 311 23466 3 0 -37 6.6
Italy 5675 19.5 285 19912 11 9 -14 0
Brazil 2518 8.6 145 17366 -18 -20 -62 6.6
China 1312 4.5 129 10171 116 142 66 6.6
Namibia 875 3 55 15909 -37 -46 -31 0
Poland 544 1.9 33 16485 0
Kenya 290 1 72 4028 26 6.6
Spain 238 0.8 18 13222 -14 -16 -74 0
Germany 109 0.4 3 36333 73 -7 203 0
Saudi Arabia 106 0.4 6 17667 6.6
Bangladesh 78 0.3 3 26000 1 -9 -33 6.6
Hungary 57 0.2 2 28500 5 19 0
Austria 34 0.1 1 34000 133 113 0
United Kingdom 24 0.1 0 0 -25 0
Argentina 20 0.1 1 20000 -64 -63 33 6.6
Area Nes 15 0.1 1 15000 118 -84
Singapore 11 0 0 15054 -8 -10 -33 6.6
India 9889 100 1936 11419 -11 -10 -11 0 Source: ITC Trade

69
Table 25 depicts the list of supplying markets for leather of other animals imported by South Africa during 2015. The table further depicts that South Africa is a net importer of leather from the world as the country imported a total of 1 936 tons of leather of other animals versus its exports of 1 721 tons. In world terms imports of leather of other animals from the world into South Africa have decreased by an average of 8% in value and 10% in volume terms between 2011 and 2015. The table also depicts that leather of other animals imports originated mainly from India, Pakistan, Italy and Brazil. India command 33.9% market share in South Africa’s imports, while Pakistan commanded 25%, Italy 19.5% and Brazil at 8.6%. Other small markets for leather of other animal’s imports are Namibia, Poland and China over the same period. Of importance to note is that imports of leather of other animals originating from China have increased by 11% in value and 9% in volume terms between 2011 and 2015, while those originating from China have also increased by 116 in value and 142% in volume terms during the same period under review. The table further depicts that although India exported more leather of other animals (866 tons) compared to Pakistan at (311 tons), the unit value (USD) for India was less at 9 889 USD than the unit value for Pakistan at 7 298 USD. Also interesting to note is that China and Korea, Austria of were more competitive in terms of their imports of leather of other animals with high import growth in value and volume terms of 116% and 133% respectively, while in volume terms were at 115% and 0% respectively during 2015. India, Pakistan, Singapore, China, Brazil, Australia and Indonesia apply higher tariff rates to South African leather of other animals market at an ad valorem tariff of 6.6% respectively.

70
Figure 52: Competitiveness of suppliers to South Africa for leather of other animals imports 2015
Source: ITC Trade Map

71
Figure 52 indicates competitiveness of suppliers to South Africa for leather of other animals imports from the world during 2015. The bubble graph further indicates that Pakistan, Brazil and India were the biggest suppliers for leather of other animals into South Africa during the period under scrutiny. Between 2011 and 2015, China and Austria were the most competitive suppliers of imports of leather of other animals into South Africa during the period under observation; their imports grew at a rate that is faster than these countries exports to the rest of the world at 100%. Conversely imports of leather of other animals from Brazil and India into South Africa have slightly declined while these countries exports of leather to the rest of the world experienced an increase of between 0% and 10% during 2011 to 2015. Imports of leather of other animals originating from Italy (one of the biggest suppliers of leather of other animals) into South Africa have increase by 11% in value and 9% in volume terms between 2011 and 2015.

72
Figure 53: Prospects for diversification of suppliers for leather of other animals imported by South Africa 2015
Source: ITC Trade Map

73
Figure 53 shows prospects for diversification of suppliers for leather of other animals during 2015. The bubble graph further shows that India Pakistan, Italy and Brazil were the biggest suppliers for leather of other animals into South Africa during the period under scrutiny. The bubble graph also shows that India commanded the greatest market share of 33.9% in South Africa’s leather imports, followed by Pakistan at 25%, Italy at 19.5% and Brazil at 8.6% respectively. The bubble graph also shows that South Africa applies a 6.6% tariff to leather of other animal’s imports originating from India, Pakistan, Brazil, Singapore, China, Korea Republic, Kenya, Bangladesh and United States of America during 2015. The bubble graph also shows that if South Africa had to diversify its suppliers of leather of other animals from the world, small and attractive markets exist in China, Italy, and Austria during the period under review. 9. GOVERNMENT SUPPORT Awareness: On the survey that was conducted, many respondents confirmed that they were inadequately informed about available schemes and programmes. It was also indicated that as firms run increasingly lean operations they have less time to spend investigating possible programmes which they qualify. Competitiveness fund One firm stated that it had made use of the competitiveness fund to support its Rural and Developmental activities. The amount awarded was only 16.6% of the amount the firm spent on product development. Therefore, while the amount was welcome, it did not make a fundamental difference to the firm’s ability to undertake this kind of activity. Trade fairs Along with the use of South Africans living abroad, trade fairs appear to be a critical method of finding buyers for export contracts. The Dusseldorf and Manchester Fairs have both been responsible for a number of contracts which lead to exports. A firm that went to South America in August 2001 as part of the Department of Trade and Industry stand still had not been paid the agreed amount by March 2002. Export promotion Several firms suggested that a duty credit certificate type scheme would be worth investigating. This issue was raised and well debated in the footwear strategy workshop in Cape Town on the 07 March 2002 to a positive reception by the representatives of the industry. Elsewhere firms indicated that it would be a concrete contribution that the government could make to the sector.
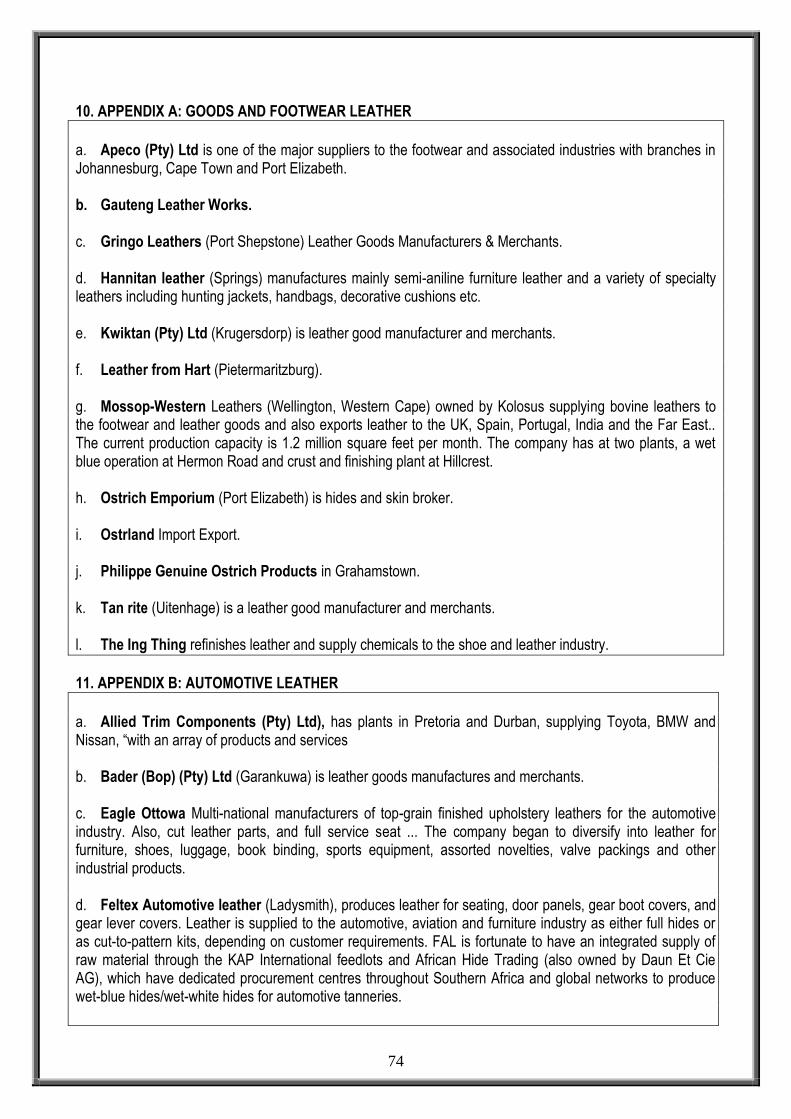
74
10. APPENDIX A: GOODS AND FOOTWEAR LEATHER
a. Apeco (Pty) Ltd is one of the major suppliers to the footwear and associated industries with branches in Johannesburg, Cape Town and Port Elizabeth. b. Gauteng Leather Works. c. Gringo Leathers (Port Shepstone) Leather Goods Manufacturers & Merchants. d. Hannitan leather (Springs) manufactures mainly semi-aniline furniture leather and a variety of specialty leathers including hunting jackets, handbags, decorative cushions etc. e. Kwiktan (Pty) Ltd (Krugersdorp) is leather good manufacturer and merchants. f. Leather from Hart (Pietermaritzburg). g. Mossop-Western Leathers (Wellington, Western Cape) owned by Kolosus supplying bovine leathers to the footwear and leather goods and also exports leather to the UK, Spain, Portugal, India and the Far East.. The current production capacity is 1.2 million square feet per month. The company has at two plants, a wet blue operation at Hermon Road and crust and finishing plant at Hillcrest. h. Ostrich Emporium (Port Elizabeth) is hides and skin broker. i. Ostrland Import Export. j. Philippe Genuine Ostrich Products in Grahamstown. k. Tan rite (Uitenhage) is a leather good manufacturer and merchants. l. The Ing Thing refinishes leather and supply chemicals to the shoe and leather industry.
11. APPENDIX B: AUTOMOTIVE LEATHER
a. Allied Trim Components (Pty) Ltd), has plants in Pretoria and Durban, supplying Toyota, BMW and Nissan, “with an array of products and services b. Bader (Bop) (Pty) Ltd (Garankuwa) is leather goods manufactures and merchants. c. Eagle Ottowa Multi-national manufacturers of top-grain finished upholstery leathers for the automotive industry. Also, cut leather parts, and full service seat ... The company began to diversify into leather for furniture, shoes, luggage, book binding, sports equipment, assorted novelties, valve packings and other industrial products. d. Feltex Automotive leather (Ladysmith), produces leather for seating, door panels, gear boot covers, and gear lever covers. Leather is supplied to the automotive, aviation and furniture industry as either full hides or as cut-to-pattern kits, depending on customer requirements. FAL is fortunate to have an integrated supply of raw material through the KAP International feedlots and African Hide Trading (also owned by Daun Et Cie AG), which have dedicated procurement centres throughout Southern Africa and global networks to produce wet-blue hides/wet-white hides for automotive tanneries.
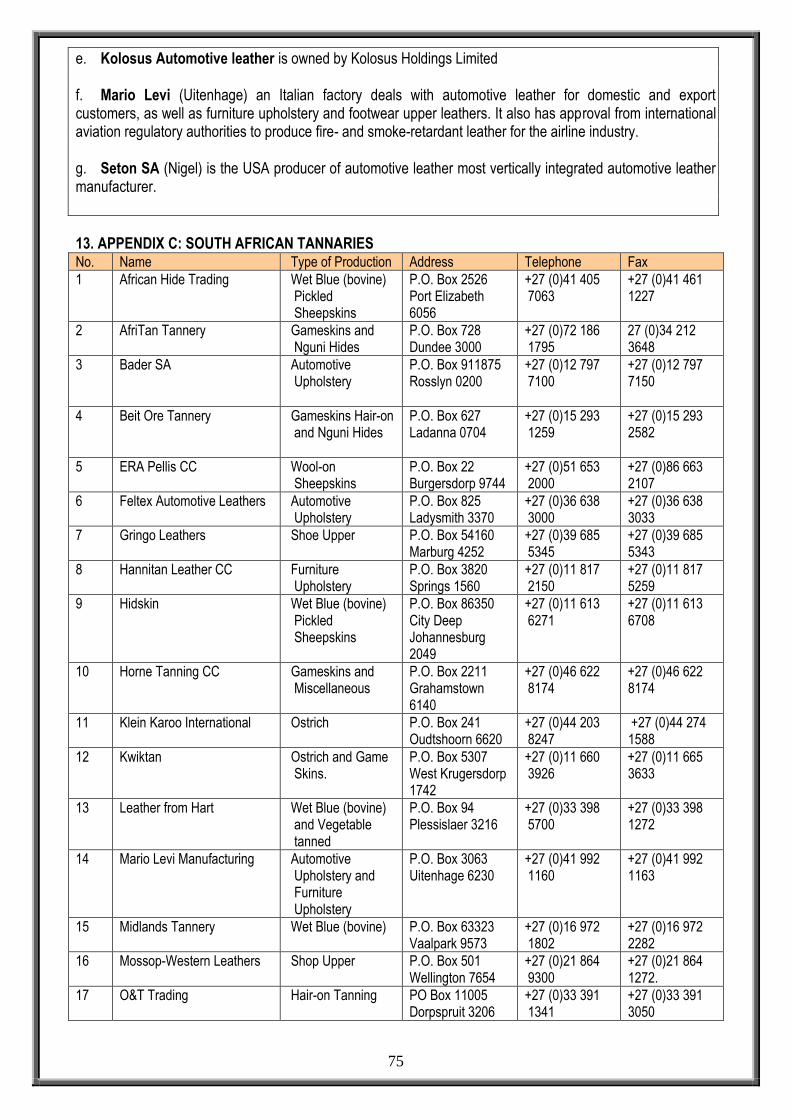
75
e. Kolosus Automotive leather is owned by Kolosus Holdings Limited f. Mario Levi (Uitenhage) an Italian factory deals with automotive leather for domestic and export customers, as well as furniture upholstery and footwear upper leathers. It also has approval from international aviation regulatory authorities to produce fire- and smoke-retardant leather for the airline industry. g. Seton SA (Nigel) is the USA producer of automotive leather most vertically integrated automotive leather manufacturer.
13. APPENDIX C: SOUTH AFRICAN TANNARIES No. Name Type of Production Address Telephone Fax
1 African Hide Trading Wet Blue (bovine) Pickled Sheepskins
P.O. Box 2526 Port Elizabeth 6056
+27 (0)41 405 7063
+27 (0)41 461 1227
2 AfriTan Tannery Gameskins and Nguni Hides
P.O. Box 728 Dundee 3000
+27 (0)72 186 1795
27 (0)34 212 3648
3 Bader SA Automotive Upholstery
P.O. Box 911875 Rosslyn 0200
+27 (0)12 797 7100
+27 (0)12 797 7150
4 Beit Ore Tannery Gameskins Hair-on and Nguni Hides
P.O. Box 627 Ladanna 0704
+27 (0)15 293 1259
+27 (0)15 293 2582
5 ERA Pellis CC Wool-on Sheepskins
P.O. Box 22 Burgersdorp 9744
+27 (0)51 653 2000
+27 (0)86 663 2107
6 Feltex Automotive Leathers Automotive Upholstery
P.O. Box 825 Ladysmith 3370
+27 (0)36 638 3000
+27 (0)36 638 3033
7 Gringo Leathers Shoe Upper P.O. Box 54160 Marburg 4252
+27 (0)39 685 5345
+27 (0)39 685 5343
8 Hannitan Leather CC Furniture Upholstery
P.O. Box 3820 Springs 1560
+27 (0)11 817 2150
+27 (0)11 817 5259
9 Hidskin Wet Blue (bovine) Pickled Sheepskins
P.O. Box 86350 City Deep Johannesburg 2049
+27 (0)11 613 6271
+27 (0)11 613 6708
10 Horne Tanning CC Gameskins and Miscellaneous
P.O. Box 2211 Grahamstown 6140
+27 (0)46 622 8174
+27 (0)46 622 8174
11 Klein Karoo International Ostrich P.O. Box 241 Oudtshoorn 6620
+27 (0)44 203 8247
+27 (0)44 274 1588
12 Kwiktan Ostrich and Game Skins.
P.O. Box 5307 West Krugersdorp 1742
+27 (0)11 660 3926
+27 (0)11 665 3633
13 Leather from Hart Wet Blue (bovine) and Vegetable tanned
P.O. Box 94 Plessislaer 3216
+27 (0)33 398 5700
+27 (0)33 398 1272
14 Mario Levi Manufacturing Automotive Upholstery and Furniture Upholstery
P.O. Box 3063 Uitenhage 6230
+27 (0)41 992 1160
+27 (0)41 992 1163
15 Midlands Tannery Wet Blue (bovine) P.O. Box 63323 Vaalpark 9573
+27 (0)16 972 1802
+27 (0)16 972 2282
16 Mossop-Western Leathers Shop Upper P.O. Box 501 Wellington 7654
+27 (0)21 864 9300
+27 (0)21 864 1272.
17 O&T Trading Hair-on Tanning PO Box 11005 Dorpspruit 3206
+27 (0)33 391 1341
+27 (0)33 391 3050

76
No. Name Type of Production Address Telephone Fax
18 Oasis Tanning Company Ostrich and Gameskins
P.O. Box 5577 Krugersdorp 1742
+27 (0)11 416 2270
+27 (0)11 416 2265
19 Ostriland Import Export Ostrich and Gameskins
P.O. Box 345 Citrusdal 7340
+27 (0)22 921 2177
+27 (0)22 921 2157
20 Ostrimark SA (Pty) Ltd Ostrich P.O. Box 7074 Grahamstown
+27 (0)46 603 5300
+27 (0)46 603 5301
21 Pelts Products Wet Blue (bovine) and Pickled Sheepskins
P.O. Box 323 Port Elizabeth 6000
+27 (0)41 461 1515
+27 (0)41 461 1203
22 Philippe Genuine Ostrich Products
Ostrich and Furniture Upholstery
P.O. Box 52 Grahamstown 6140
+27 (0)41 461 1515
+27 (0)41 461 1203
23 Prince Albert Tannery
Ostrich and Gameskins
PO Box 103 Prince Albert 6930
+27 (0)23 541 1411
+27 (0)23 541 1255
24 Rein Tanning
Ostrich and Miscellaneous
P.O. Box 10409 Dana Bay 6510
+27 (0)44 697 7041
+27 (0)44 697 7866
25 Richard Kane & Co
Wet Blue Pickled Sheepskins Wool-on Sheepskins Chamois
P.O. Box 222 Maitland 7404
+27 (0)21 535 1122
+27 (0)21 535 2244
26 Seton SA Automotive Upholstery
P.O. Box 537 Nigel 1490
+27 (0)11 360 7500
+27 (0)11 814 6005
27 Skhumba Skins of Africa Hair-on Tanning P.O. Box 11005 Dorpspruit 3206
+27 (0)33 391 1341
+27 (0)33 391 3050
28 Southern Cape Ostrich Tannery
Ostrich P.O. Box 2629 Mossel Bay 6500
+27 (0)44 606 4500
+27 (0)44 697 7105
29 Swartland Tanning Ostrich and Miscellaneous
P.O. Box 849 Wellington 7654
+27 (0)21 868 2426
+27 (0)21 868 2499
30 The ING Thing cc Shoe Upper and Miscellaneous
P.O. Box 264 Hilton 3245
+27 (0)33 330 7575
+27 (0)33 343 1445
31 Woods Tanning cc Ostrich and Gameskins
PO Box 1603 Uitenhage 6230
+27 (0)41 992 2179
+27 (0)41 992 2144
32 Zenda SA Automotive Leather PO Box 158 La Montagne 0184
+27 (0)12 810 3500
+27 (0)12 810 3501
14. APPENDIX D: INDUSTRY ASSOCIATIONS
ORGANIZATION CORE BUSINESS CONTACTS
The Skins, Hides and Leather Council (SHALC):
A body representing all sectors of the South African leather industry from raw hides procurement to finished leather.
Chairman: Mr. van Niekerk Tel. 041 365 3131 or Email: [email protected] for more info.
The SA Footwear and Leather Export Council (SAFLEC)
Paul Theron (Executive Director) Tel. 031- 701 4206 [email protected] www.saflec.co.za
The International School of An institution whose core business P.O Box 2085

77
Tanning Technology (I.S.T.T.) activities are focused on the provision of world class training to the tanning industry. It offers courses from basic tanning (NQF level 2) to Advanced training (NQF level 5).
Grahamstown 6140 SOUTH AFRICA Tel: 046 – 622 7310 Fax: 086 545 2723
78
15. ACKNOWLEDGEMENTS Acknowledgement is given to the following sources: 1. Agriworld www.agriworldsa.com. 2. Competition Commission www.comptrib.co.za. 3. Department of Agriculture (Veterinary services) www.daff.gov.za. 4. Department of Trade and Industry. (2008) Sector Development Strategy: Footwear and Leather Goods www.thedti.gov.za. 5. FAO www.fao.org. 6. Market Access Map www.macmap.org. 7. Quantec www.easydata.co.za. 8. Richard Ballard (2001). A preliminary study on the bovine leather value chain in South Africa http://sds.ukzn.ac.za. 9. SAMIC www.samic.co.za. 10. Trade Map www.trademap.org 11. Klein Karoo International Ltd Tel. 044-203 5234 12. IMPEC (Integrated Meat Processors of the Eastern Cape Tel. 046-622 6567 Disclaimer: This document and its contents have been compiled by the Directorate: Marketing of the Department of Agriculture, Forestry and Fisheries for the purpose of detailing the hides, skins and leather industry. Anyone who uses the information as contained in this document does so at his/her own risk. The views expressed in this document are those of the Department of Agriculture, Forestry and Fisheries with regard to the industry, unless otherwise stated. The Department of Agriculture, Forestry and Fisheries, therefore accepts no liability that can be incurred resulting from the use of this information.