Embed Size (px)
Citation preview

Department of Physics, Chemistry and Biology
MASTER THESIS
A Printed Biosensor Based on an Organic Electrochemical
Transistor with Mediated Gate Electrode
Performed at Acreo AB, Norrköping
Julia Hedborg
2012-06-20
LITH-IFM-A-EX--12/2688--SE
Linköpings University, Department of physics, chemistry and biology
SE-581 83 Linköping

Department of Physics, Chemistry and Biology
A Printed Biosensor Based on an Organic Electrochemical
Transistor with Mediated Gate Electrode
Performed at Acreo AB, Norrköping
Julia Hedborg
2012-06-04
Supervisors
David Nilsson, Acreo AB
Petronella Norberg, Acreo AB
Gunnar Bergström, IFM
Examiner
Carl-Fredrik Mandenius

Datum
Date
2012-06-20
Avdelning, institution Division, Department
Department of Physics, Chemistry and Biology
Linköping University
URL för elektronisk version
ISBN
ISRN: LITH-IFM-A-EX--12/2688--SE _________________________________________________________________
Serietitel och serienummer ISSN Title of series, numbering ______________________________
Språk Language
Svenska/Swedish
Engelska/English
________________
Rapporttyp Report category
Licentiatavhandling
Examensarbete
C-uppsats
D-uppsats
Övrig rapport
_____________
Titel
Title
A Printed Biosensor Based on an Organic Electrochemical Transistor with Mediated Gate Electrode
Författare Author
Julia Hedborg
Nyckelord Keyword
Biosensors, printed electronics, enzymes, electrochemical transistor, glucose, redox mediators
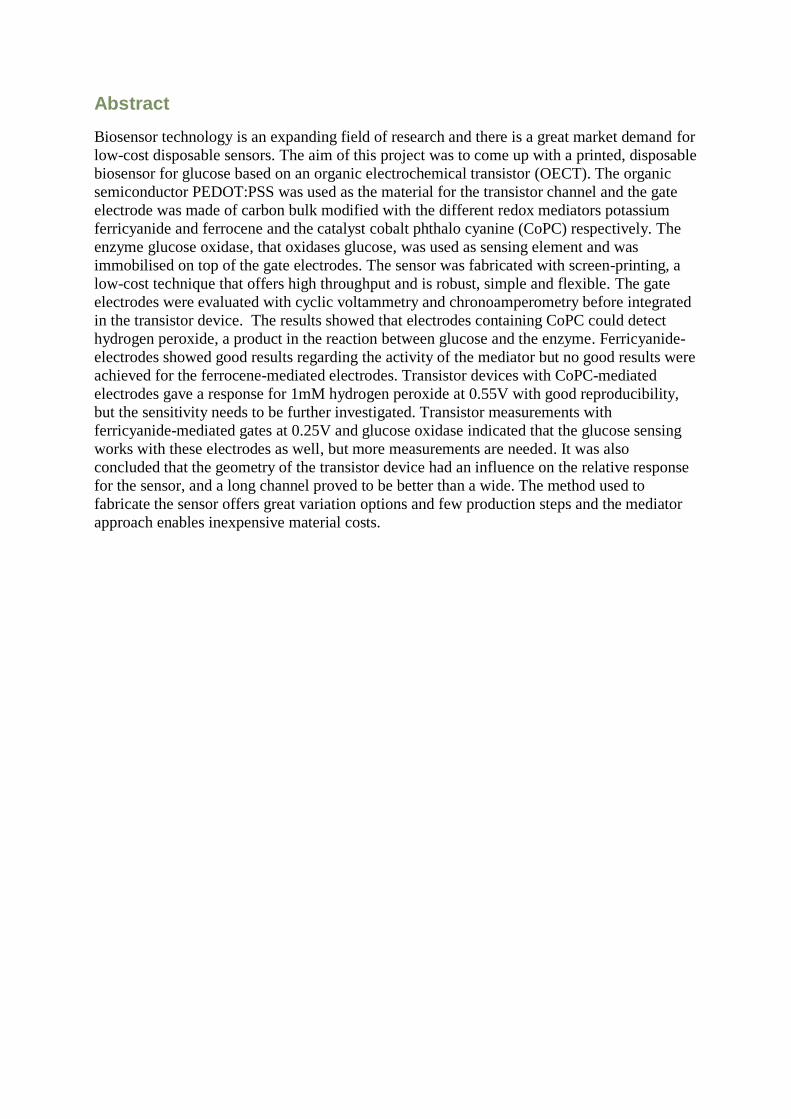
Sammanfattning Abstract
Biosensor technology is an expanding field of research and there is a great market demand for low-cost disposable
sensors. The aim of this project was to come up with a printed, disposable biosensor for glucose based on an organic
electrochemical transistor (OECT). The organic semiconductor PEDOT:PSS was used as the material for the transistor
channel and the gate electrode was made of carbon bulk modified with the different redox mediators potassium
ferricyanide and ferrocene and the catalyst cobalt phthalo cyanine (CoPC) respectively. The enzyme glucose oxidase,
that oxidases glucose, was used as sensing element and was immobilised on top of the gate electrodes. The sensor was
fabricated with screen-printing, a low-cost technique that offers high throughput and is robust, simple and flexible.
The gate electrodes were evaluated with cyclic voltammetry and chronoamperometry before integrated in the
transistor device. The results showed that electrodes containing CoPC could detect hydrogen peroxide, a product in
the reaction between glucose and the enzyme. Ferricyanide-electrodes showed good results regarding the activity of
the mediator but no good results were achieved for the ferrocene-mediated electrodes. Transistor devices with CoPC-
mediated electrodes gave a response for 1mM hydrogen peroxide at 0.55V with good reproducibility, but the
sensitivity needs to be further investigated. Transistor measurements with ferricyanide-mediated gates at 0.25V and
glucose oxidase indicated that the glucose sensing works with these electrodes as well, but more measurements are
needed. It was also concluded that the geometry of the transistor device had an influence on the relative response for
the sensor, and a long channel proved to be better than a wide. The method used to fabricate the sensor offers great
variation options and few production steps and the mediator approach enables inexpensive material costs.
Abstract
Biosensor technology is an expanding field of research and there is a great market demand for
low-cost disposable sensors. The aim of this project was to come up with a printed, disposable
biosensor for glucose based on an organic electrochemical transistor (OECT). The organic
semiconductor PEDOT:PSS was used as the material for the transistor channel and the gate
electrode was made of carbon bulk modified with the different redox mediators potassium
ferricyanide and ferrocene and the catalyst cobalt phthalo cyanine (CoPC) respectively. The
enzyme glucose oxidase, that oxidases glucose, was used as sensing element and was
immobilised on top of the gate electrodes. The sensor was fabricated with screen-printing, a
low-cost technique that offers high throughput and is robust, simple and flexible. The gate
electrodes were evaluated with cyclic voltammetry and chronoamperometry before integrated
in the transistor device. The results showed that electrodes containing CoPC could detect
hydrogen peroxide, a product in the reaction between glucose and the enzyme. Ferricyanide-
electrodes showed good results regarding the activity of the mediator but no good results were
achieved for the ferrocene-mediated electrodes. Transistor devices with CoPC-mediated
electrodes gave a response for 1mM hydrogen peroxide at 0.55V with good reproducibility,
but the sensitivity needs to be further investigated. Transistor measurements with
ferricyanide-mediated gates at 0.25V and glucose oxidase indicated that the glucose sensing
works with these electrodes as well, but more measurements are needed. It was also
concluded that the geometry of the transistor device had an influence on the relative response
for the sensor, and a long channel proved to be better than a wide. The method used to
fabricate the sensor offers great variation options and few production steps and the mediator
approach enables inexpensive material costs.

Sammanfattning
Biosensorteknik är ett växande forskningsområde och det finns en stor efterfrågan på
marknaden efter billiga engångssensorer. Målet med detta projekt var att ta fram en tryckt
engångssensor för glukos baserad på en organisk elektrokemisk transistor (OECT). Den
organiska halvledaren PEDOT:PSS användes som material för transistorkanalen och gate-
elektroden tillverkades av kolbläck med tillsatts av redoxmediatorerna kalium ferricyanid
respektive ferrocen samt väteperoxidkatalysatorn kobolt ftalocyanin (CoPC). Enzymet
glukosoxidas, som oxiderar glukos, användes som sensorelement och immobiliserades på
gate-elektroderna. Sensorn tillverkades med screentryckteknik som erbjuder storskalig,
robust, enkel och billig tillverkning. Gate-elektroderna karakteriserades med metoderna
cyklisk voltammetri och kronoamperometri innan de integrerades i transistorn. Resultaten
visade att elektroder innehållande CoPC kunde detektera väteperoxid, som är en produkt i
reaktionen mellan glukos och enzymet. Elektroder innehållande ferricyanid visade goda
resultat gällande redoxaktivitet, men inga bra resultat uppnåddes för elektroder innehållande
ferrocen. Transistorer med CoPC-elektroder gav tydligt utslag för 1mM väteperoxid vid
0,55V med god reproducerbarhet, men sensitiviteten behöver undersökas vidare.
Transistormätningar med ferricyanid-elektroder och glukosoxidas vid 0.25V indikerade att
glukosdetektionen fungerade med dessa elektroder men fler mätningar behövs för att kunna
fastställa detta. Resultaten visade också att transistorns geometri inverkar på sensorns respons
och en lång kanal gav bättre resultat än en bred. Metoden som användes för att ta fram
sensorn erbjuder många variationsmöjligheter, få produktionssteg och användandet av
mediatorer möjliggör relativt låga materialkostnader.

Acknowledgements
First, I would like to thank my supervisors at Acreo AB, where this project was situated,
David Nilsson and Petronella Norberg for the inspiration, help and support throughout the
project. It has been very fun, interesting and challenging.
Also great thanks to my examiner Carl-Fredrik Mandenius and Gunnar Bergström, my
supervisor at IFM for the advice during the project and to my opponent Alexander Vastesson.
I would also like to thank all employees at Acreo AB in Norrköping and especially the
following persons, for great advice and help during the work: Raeann Gifford, for all advice
concerning biosensors and measurements and for interesting discussions, Marie Nilsson, for
all help with the screen-printing of the transistors, Mats Sandberg, for advice concerning use
of chemicals, Xin Wang, for help with the lab instruments.
I would also like to thank Valerio Beni, IFM, for great help with interpretation of
electrochemical measurements and Kristin Persson, Henrik Toss and Loïg Kergoat at Organic
Electronics group, ITN, for advice and help with the lab equipment and for letting me use
their chemicals.
At last, thanks to my boyfriend, family and friends for love and support in life.
Thank you all!
Julia Hedborg, Linköping, June 2012

Contents
Introduction ........................................................................................................................ 1 1
1.1 Background .................................................................................................................. 1
1.2 Aim .............................................................................................................................. 2
Theory and pervious work .................................................................................................. 3 2
2.1 What is a biosensor? .................................................................................................... 3
2.2 Printing techniques ...................................................................................................... 4
2.2.1 Screen-printing ..................................................................................................... 4
2.2.2 Ink-jet ................................................................................................................... 5
2.3 Enzymes as sensing element ........................................................................................ 5
2.3.1 Oxidases ............................................................................................................... 5
2.3.2 Dehydrogenases ................................................................................................... 6
2.3.3 Glucose oxidase .................................................................................................... 6
2.3.4 Immobilisation ..................................................................................................... 7
2.3.5 Glucose sensing with GOx ................................................................................... 7
2.4 Mediators and mediated electrodes ............................................................................. 8
2.4.1 Ferrocene .............................................................................................................. 9
2.4.2 Ferricyanide ........................................................................................................ 10
2.4.3 Cobalt phthalocyanine ........................................................................................ 11
2.4.4 Prussian Blue ...................................................................................................... 11
2.4.5 Manganese dioxide ............................................................................................. 11
2.4.6 Summary ............................................................................................................ 12
2.5 OECT – the transducer .............................................................................................. 13
2.5.1 Materials ............................................................................................................. 13
2.5.2 Operation ............................................................................................................ 14
2.5.3 Transistor design ................................................................................................ 15
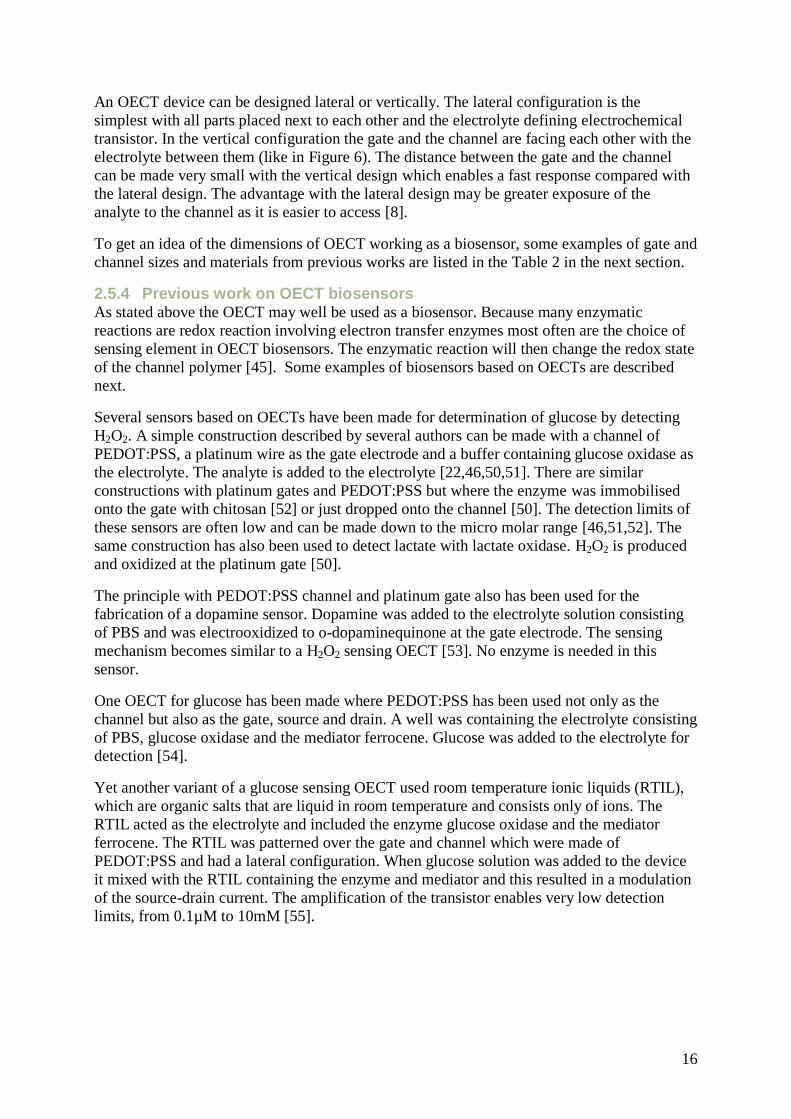
2.5.4 Previous work on OECT biosensors .................................................................. 16
Technological approach ................................................................................................... 18 3
3.1 Procedure ................................................................................................................... 18
3.1.1 Mediator choice .................................................................................................. 18
3.1.2 Electrode fabrication .......................................................................................... 18
3.1.3 Enzyme application ............................................................................................ 18
3.1.4 Transistor fabrication ......................................................................................... 18
3.2 Analytical methods and instrumentation ................................................................... 19
3.2.1 Cyclic voltammetry ............................................................................................ 19
3.2.2 Chronoamperometry ........................................................................................... 20
3.2.3 Transistor characteristics .................................................................................... 21

Experimental .................................................................................................................... 22 4
4.1 Chemicals and reagents ............................................................................................. 22
4.2 Instrumentation .......................................................................................................... 22
4.3 Solution preparation .................................................................................................. 22
4.4 Preparation of mediated carbon inks ......................................................................... 23
4.4.1 Ferrocene-mediated ink ...................................................................................... 23
4.4.2 Ferricyanide-mediated ink .................................................................................. 23
4.4.3 CoPC-mediated ink ............................................................................................ 23
4.5 Fabrication of gate electrodes for characterization with potentiostat ........................ 23
4.6 Characterization of gate electrodes with potentiostat ................................................ 24
4.7 Transistor fabrication and measurements .................................................................. 25
Results and discussion ...................................................................................................... 28 5
5.1 Ink preparation ........................................................................................................... 28
5.2 Characterization of gate electrodes without enzyme ................................................. 28
5.2.1 Ferrocene-mediated electrodes in PBS............................................................... 29
5.2.2 Ferricyanide-mediated electrodes in PBS .......................................................... 30
5.2.3 CoPC- mediated electrodes in PBS and H2O2 .................................................... 32
5.3 Characterization of electrodes with immobilized enzyme......................................... 34
5.3.1 Ferrocene-mediated electrodes with 10µl GOx/BSA/GA solution .................... 34
5.3.2 Ferricyanide-mediated electrodes with 10µl GOx/BSA/GA solution................ 35
5.3.3 CoPC-mediated electrodes with 5µl GOx/BSA/GA solution ............................ 36
5.4 Transistor fabrication ................................................................................................. 37
5.5 Transistor measurements ........................................................................................... 37
5.5.1 CoPC-mediated gate electrodes.......................................................................... 38
5.5.2 Ferricyanide-mediated gate electrodes with 5µl GOx........................................ 42
Conclusion ........................................................................................................................ 43 6
Further perspectives ......................................................................................................... 44 7
7.1 Further characterization and considerations regarding the gate electrodes ............... 44
7.2 Further characterization of the transistor as a sensor................................................. 44
7.3 Measurements ............................................................................................................ 44
7.4 Ink .............................................................................................................................. 45
7.5 Deposition of the enzyme .......................................................................................... 45
References ........................................................................................................................ 46 8
Appendix A ................................................................................................................................. i

Abbreviations
Frequently occuring abbreviations are listed here.
BSA Bovine serum albumin
CA Chronoamperometry/chronoamperogram
CoPC Cobalt phthalocyanine
CV Cyclic voltammetry/cyclic voltammogram
FAD Flavine adenine dinucleotide (cofactor to glucose oxidase)
FET Field effect transistor
GA Glutaraldehyde
GOx Glucose oxidase
NAD+ Nicotinamide adenine dinucleotide (cofactor for dehydrogenases)
OECT Organic electrochemical transistor
PBS Phosphate buffered saline
PEDOT:PSS Poly(3,4-etylendioxythiophene) doped with poly(styrenesulfonate)

1
Introduction 1A short background to the project and the project aims will be presented in this chapter.
1.1 Background Ever since L.C. Clark developed the first enzyme electrode in 1962 [1] the biosensor
technology has grown and spread to a wide range of fields [2]. Biosensor devices are used as
tools in the fields of medicine, biotechnology, agriculture and the food industry to mention
some. Today measurement of blood glucose levels is the major application of biosensor
because of the great demand from the market. However the potential for commercialisation of
other biosensors is large, but the process is slow due to technical problems like contamination
that can occur when biomaterials come in contact with semiconductor material [3]. Especially
in medical analysis the contamination is an issue and therefor there is a need for inexpensive
disposable sensors. The demand for low-cost sensors or sensor system is in general big but
especially in the medical and food analysis applications [4].
In order to fabricate a low-cost sensor both the materials and the fabrication techniques must
be inexpensive. Organic conducting or semi-conducting polymers and molecules have shown
great performance as the material in many electronic devices, including thin film transistors,
light emitting diodes, solar cells, light weight batteries, capacitors etc. [5,6]. They have been
very well studied during the last years and a lot of progress has been made since they were
discovered in the late 1970’s. For sensor applications, especially organic thin film transistors
have been investigated because they offer high sensitivity, high throughput and can be
miniaturized. Some of the other advantages with organic materials for electronics are that they
are inexpensive, flexible, biocompatible and easy to fabricate [5]. Another property of the
organic materials useful for sensors is that not only electrons but also ions can be used as
charge carriers. Because they can be solved in common solvents it is possible to print them on
plastics or paper, or process them with other low-cost processes [4].
Acreo is a Swedish research institute with location in Kista, Hudiksvall, Göteborg and
Norrköping. Acreo works within the field of electronics, optics and communication
technology with the aim to turn research into commercial products collaborating with both
industry and academia. In Norrköping where this project is situated, the main area is printed
electronics. In this area electronic components are printed onto paper and plastics with
traditional printing equipment. Conducting polymers or organic semiconductors are the base
for the printed electronics and together with printable insulators and metals many devices can
be printed. Examples of printed devices developed at Acreo are transistors, antennas,
batteries, sensors and displays [7]. A future goal is to create a biosensor all made of printed
devices developed at Acreo; a battery providing the power, a display showing the readout and
a transistor functioning as a sensor transducer. This project will aim at developing a transistor
functioning as a biosensor.

2
1.2 Aim The aim of this project is to come up with a biosensor based on one of Acreo’s printable
devices, an organic electrochemical transistor (OECT), functioning as the transducer element.
The biosensor should be disposable and therefore inexpensive and easy to produce with few
fabrication steps. Therefore, it is desired that the biosensor will be printable with the printing
techniques available at Acreo.
The objectives of the project will be as follows:
A literature study to summarise what have been done in the fields of biosensors based on organic electrochemical transistors and other printed biosensors for glucose
recognition.
Based on the literature study, develop a method for fabrication of a printed biosensor
with an OECT as the transducer.
Fabrication and evaluation of the working electrode.
Fabrication and evaluation of the transistor including the working electrode.
The focus will be to make a sensor that works and is printable and gives a predicted response.
At this point, the final application is not determined and therefore a sensor for glucose
detection is made in this study. Glucose sensing with glucose oxidase is one of the most
common biosensors and the mechanism of detection is therefore very well studied. Glucose
oxidase is also a relatively stable enzyme and it is commercially available [8,9]. Therefore it
is appropriate to make a sensor for glucose recognition in this project. No literature have been
found on a completely printable biosensor based on an OECT this far.

3
Theory and pervious work 2In this chapter the background theory behind sensors and printing techniques will be given.
Previous work in the area of OECT sensors and printed sensors is also summarised.
2.1 What is a biosensor? There is no general definition of the term sensor, but often it can be viewed as a technical
sensing organ that detect or respond to something in the environment. Often, a sensor
converts non-electrical information to an electrical signal that is proportional to the magnitude
of the measured substance [10].
A biosensor is a sensor with a biological sensing element, meaning that the element that
recognizes the analyte to be measured is biological in nature. In general, chemical analytes are
measured with biosensors but analytes with biological character may be measured as well.
The sensing element needs to be connected to a transducer that converts the physical or
chemical change that takes place when the analyte comes in contact with the sensing element
to a measurable signal, often an electric signal, so that the response can be recorded [2]. A
typical layout for a biosensor is shown in Figure 1.
Figure 1 Schematic sketch of a biosensor. The analyte affects the sensing element resulting in a physical or chemical signal
that is converted to an electrical signal by the transducer. The electrical signal may then be processed to a user-friendly
readout.
Examples of biological sensing elements are enzymes, antibodies, nucleic acids, microbes or
tissue [3]. Enzymes are proteins that catalyses reactions and they bind to specific substrates as
they do so. Many enzyme reactions involve oxidation or reduction (redox reactions) and can
be detected electrochemically because electrons are transferred in these reactions. A typical
enzyme catalysis reaction is shown below.
Substrate + Enzyme ↔ Substrate/Enzyme-complex → Enzyme + Product
Enzymes are the most commonly used biological sensing elements in biosensors. Their
advantages are that they bind to the analyte (substrate) with high selectivity and they react
quickly. Also, the catalytic effect improves the sensitivity. The main drawback is the loss of
activity that happens when the enzyme is immobilized or stored for a long period of time [2].
In this work, only enzymes will be considered as the sensing element as the transducer used
will be electrochemical in nature and enzymes are suitable for this.
Examples of transducers are electrochemical transducers, optical transducers, field effect
transistors (FET), piezoelectric devices or thermal devices. Electrochemical transducers
include amperometric, potentiometric and conductometric where current, potential or
conductance in measured respectively. Electroactive species can be detected with
electrochemical transducers. FETs are mainly used as potentiometric sensors but can be
amperometric or conductometric as well. Piezoelectric devices detect changes in mass while
thermal devices sense temperature variations [2]. Among the transducers, amperometric

4
devices are the most common for biosensors. These have much shorter response time than the
potentiometric sensors. The principle for an amperometric sensor is that a potential is applied
to an electrode containing the sensing element and the current is measured relative a reference
electrode with a well-defined potential. The current is due to oxidation of a product of a
biochemical reaction at the electrode surface, generating electrons. The current is proportional
to the concentration of the analyte measured [10,11].
2.2 Printing techniques The printing techniques that are available and could be appropriate for the printing of the
biosensor is screen-printing and inkjet printing. These will be presented in this section.
2.2.1 Screen-printing With the screen-printing technique, an ink is forced through a screen or mesh, often consisting
of a fabric made of plastics, silk or metal threads. A stencil covers the part of the screen where
no ink is to come through and thus defines the pattern or image to be printed. The fineness of
the fabric in the screen is determined by the number of threads or fibers per cm. This number
can vary from 10 to 200 fibers/cm but most common are screens with 90-120 fibers/cm. There
are some different methods for screen-printing but the methods used in this work will be the
flat-to-flat method. Both the substrate and the
screen are flat and the ink is forced through
the screen with a squeegee that moves over the
stencil (see Figure 2). The layers of ink can be
made thick with screen-printing compared
with other printing techniques and are usually
20-100µm, but for some materials the
thickness may be made as thin as 200nm. The
supply of inks for screen-printing is very large
and screen-printed products ranges from t-
shirts to printed circuit boards [12].
The screen-printing technique can also be used
for printing organic electronic materials, like
PEDOT:PSS [8]. There are also commercial
inks of carbon, silver, dielectric and other materials that can be used to print conducting paths
and circuits for printed electronics [13].
Screen-printing is widely used for high-throughput biosensor fabrication and there is no
method as fast or as large-scale and the technique is robust, simple and flexible. Many
commercial biosensors are manufactured with screen-printing [14]. The options are many and
carbon ink for electrodes can be bulk modified with metal particles (like platinum), mediators
(see section 2.4) and biocomponents or the printed electrodes may be coated with additional
layers of inks or other compounds [14,15]. The drawbacks are that the resolution is not very
high and that the surfaces become very rough [10].
Examples of screen-printed sensors will be given in section 2.4.
Figure 2 The principle of screen-printing with the important parts marked.

5
2.2.2 Ink-jet With the ink-jet printing technique, small droplets of ink are jetted out from a nozzle to a
substrate. There are several different variant of ink-jet printers, using different techniques to
accomplish the small droplets. The two main variants are continuous ink jet and drop on
demand inkjet. In the continuous variant a stream of droplets are generated. The charges of
the droplets are different and only uncharged droplets are transferred to the paper according to
the pattern. The drop on demand variant of ink jet only produces a droplet when the picture
requires it. Piezo ink jet and thermal inkjet are examples of drop on demand techniques. The
type available at Acreo is a piezoelectric ink jet printer. The walls of the small chamber
containing the ink are made of a piezoelectric material that will deform when an electric field
is applied to it. The deformation of the chamber mechanically squeezes a droplet through the
nozzle. The drop volume of a piezo ink jet is 4-30 pl and the printed layer is less than 0.5µm
thick [12]. The structures can be made smaller than with for example screen-printing and
therefore inkjet offers better pattern resolution and reproducibility. Also no mask is required
and there is no contact between printer head and substrate and this facilitates the process [14].
The inks used have low viscosity (1-30mPa∙s) and are based for example on water, oil or
melted waxes. Particles easily block the small nozzle so the inks must be well filtered. The
low viscosity makes the properties of the substrate surface important. The wrong surface can
cause bleeding or formation of marbles [12]. However there are many possibilities when it
comes to the choice of the substrate, for example paper or plastic [16].
There are some examples of OECTs fabricated with ink jet printing. Basiricò et al. [16] have
made an OECT all out of PEDOT:PSS (see section 2.5.1) printed with a piezoelectric inkjet
printer. They conclude that the method is robust and that the components printed are
reproducible enough for fabrication of biosensors and other low-cost applications. Wang et al.
[17] have used piezoelectric inkjet to print the enzyme glucose oxidase onto screen-printed
carbon electrodes. The enzyme solved in PBS and mixed with glycerol as a stabilizer and. A
surfactant was used to reduce the contact angle to the surface. The activity and structure of the
enzyme was only slightly affected after the printing. They conclude that the method is
promising for fabrication of low-cost single use enzymatic sensors.
2.3 Enzymes as sensing element As described in the section about biosensors, enzymes are proteins that catalyses chemical
reactions and bind specifically to an analyte as they do so. Enzymatic reactions that involve
redox reactions can be detected with electrochemical methods. All redox enzymes however
depend on a cofactor for the electron transfer. Examples of enzymes that catalyse redox
reactions are the groups oxidases and dehydrogenases.
2.3.1 Oxidases There are approx. 50 to 60 known oxidases and they are characterized by redox active
cofactors that are strongly bond to the enzyme structure. The cofactors are required for the
enzymes functionality. Among the cofactors, FAD (flavine adenine dinucleotide) and FMN
(flavine mononucleotide) are the most common. These can be present alone or combined with
a metal ion like Fe or Mo. The oxidases oxidize their substrates while they are reduced
themselves. The charge released from the substrate is picked up by the cofactor. For the
reoxidation of the enzyme to its oxidized form, molecular oxygen is required and either
hydrogen peroxide (H2O2) or water is produced depending on the enzyme. The over-all
reaction from oxidation of the substrate to the product is irreversible because oxygen is such a
strong oxidizing agent, though the enzyme itself is not consumed and can be reused [18].
Substrate + O2 → Product + H2O2

6
2.3.2 Dehydrogenases Dehydrogenases are the largest group of redox enzymes, but they are not the most frequently
used in biosensors. The dehydrogenases often have the cofactor NAD+ (nicotinamide adenine
dinucleotide) which is soluble and not tightly bound to the enzyme. This makes it more
complicated to construct sensor devices. When a dehydrogenase catalyses a reaction, NAD+ is
reduced to NADH. NAD+ is not as strong oxidizing agent as oxygen and also shows
irreversible behaviour [18].
Substrate + NAD+ → Product + NADH
To follow a reaction with a dehydrogenase, NADH can be detected. Direct oxidation of
NADH requires high potentials but a redox mediator can be used to oxidize NADH and lower
the required potential [11].
2.3.3 Glucose oxidase In this study, the enzyme glucose oxidase, belonging to the group of oxidases, will be used as
the sensing element.
Glucose-1-oxidase (GOx) catalyses the reaction where glucose is oxidized to gluconic acid. In
the reaction, oxygen is required as an electron acceptor and H2O2 is a product. GOx is a
flavoprotein containing flavine adenine dinucleotide (FAD) as a cofactor which is reduced to
FADH2 as glucose is oxidized and then oxidized back to FAD as H2O2 is produced. All steps
are shown in the reaction below [9].
β-ᴅ-glucose + GOx-FAD(ox) → ᴅ-glucono-δ-lactone + GOx-FADH2(red)
ᴅ-glucono-δ-lactone + H2O → Gluconic acid
GOx-FADH2(red) + O2 → GOx-FAD(ox) + H2O2
There are different forms of glucose, but the natural occurring form is called ᴅ-glucose and
has an open chain structure. In solution, different cyclic isomers are formed, among these β-ᴅ-
glucose and α-ᴅ-glucose. This conversion of the different forms of glucose is called
mutarotation and is catalysed by phosphate anions. The most effective substrate for GOx is β-
ᴅ-glucose, but other forms of glucose and other compounds as well can react with GOx and
reduce it. Especially α-ᴅ-glucose is a good substrate but the reaction rate is only 0.63% of that
with the β-ᴅ-glucose form and the specificity for β-ᴅ-glucose is considered high [19]. Glucose
is oxidized by FAD at a rate of about 5000 glucose molecules per second [20].
The molecular weight of GOx varies from approximately 130 – 175 kDa (1 Da = 1 Dalton = 1
g/mol). For GOx from the fungus Aspergillus niger the weight is 152 kDa. Aspergillus niger
is the most common source of commercial GOx. A. niger is grown for the production of
gluconic acid or gluconate salts and thus GOx is obtained as a by-product [9]. GOx that
comes from ascomycetes, like A.niger, is a dimeric protein consisting of two identical
subunits covalently bond to each other. Both subunits contain one FAD-molecule making it
two active sites per enzyme [9].
The stability of glucose oxidase depends of the environment. Lyophilized GOx is very stable
and stored in -15oC it can last for several years. In solution the pH determines the stability
[19]. The optimum pH varies around pH 5-7 depending on the source [9]. Below pH 2 or
above pH 8 the activity of the enzyme is rapidly lost. Also high temperatures, above 40oC,
will destabilize GOx. However, addition of polyhydric alcohols like glycerol can to some

7
degree prevent thermal denaturation. The isoelectric point of GOx is 4.2 implying that the
enzyme is negatively charged at physiological pH [19].
Amount or activity of an enzyme is defined by the enzymatic unit (U). 1U corresponds to the
amount of the enzyme that oxidases 1 µmol of its substrate per minute at 25oC in pH 7 [21].
2.3.4 Immobilisation For sensor applications, the enzyme has to be immobilised in some way to the electrode.
There are several ways to do this with endless variation possibilities. Some of the most
common techniques are adsorption, encapsulation with a membrane, entrapment in e.g. a gel,
crosslinking and covalent bonding. Immobilisation may stabilize or protect the enzyme but it
can also decrease its activity and prevent the analyte to reach the enzyme [2].
For a disposable sensor, no other immobilisation step than adsorption of the enzyme to the
electrode surface would be necessary. Adsorption is a simple method and requires very little
preparation. One drawback is that the enzyme still can be sensitive for factors like pH and
temperature [2]. Previous work shows that the enzyme may just be added to an electrolyte
[22] so diffusion of the enzyme from the electrode surface to the electrolyte should not be a
problem if the sample volume is very small.
There are examples of screen-printed sensors where the enzyme have been mixed in carbon
ink and printed (see section 2.4.6). However, many inks contain organic solvents that can
denature the enzyme. Also, the high curing temperatures of most inks will destroy the
enzyme. Therefore a water soluble ink with low curing temperature is to be preferred if an
enzyme should be mixed in it [23].
2.3.5 Glucose sensing with GOx There are a lot of applications for measurements of glucose with GOx. Examples are the
industries of chemistry, food, pharmaceutics and biotechnology [9]. Glucose biosensors
account for the largest part of the biosensor market (approximately 85% in 2004) and the
main reason for that is the occurrence of diabetes and the need for regular measurements of
blood glucose levels [24]. This makes glucose oxidase the enzymes most widely used for
sensor application [8]. Glucose oxidase is also a relatively inexpensive enzyme with very
good stability [9].
Glucose levels in blood for healthy people normally are 4-8mM. The level is lower when a
person is hungry and higher after a meal. For people suffering from diabetes, the levels vary
even more, from 2-30mM [20].
Many different transducers can be used for glucose biosensors but electrochemical are the
most frequently used as they have been the most successful both in terms of sensitivity and
reproducibility and they also have low manufacturing costs [24]. There are several ways of
measuring glucose level electrochemically with glucose oxidase [20]. Two options will be
described here. First, the glucose level can be measured via the oxidation of the H2O2 that is
produced in the enzymatic reaction, as described above. The concentration of H2O2 produced
is directly proportional to the glucose concentration [24]. The oxidation of H2O2 can be
catalysed by platinum and can thus be detected amperometrically at a platinum electrode at a
potential of approximately 0.6V vs. Ag/AgCl. This is a very common way of detecting
glucose [25]. Chemical compounds that catalyse oxidation of H2O2 can be used as well. The
oxidation of H2O2 is shown in the reaction below.
H2O2 → O2 + 2H+ + 2e
-

8
However, oxygen level in the sample is a limiting factor for a sensor measuring H2O2 and that
can decrease the sensor performance [24].
Alternatives are to measure oxygen depletion or changes in pH with an oxygen or pH
electrode respectively [25].
The other option is to detect the electron transfer between FADH2 and the electrode surface
with the help of an electron transfer agent. This agent will replace the oxygen in the reaction
described in section 2.3.3 above. The agent is called a mediator and will be further described
in the next section [20].
2.4 Mediators and mediated electrodes A mediator is an oxidizing agent that can transfer electrons as they switch oxidation state
reversibly [2]. The transfer of electrons from the active site of the reduced form of glucose
oxidase to the electrode surface is usually very slow or does not happens at all, because the
distance is very large for an electron. Here the mediator which is relatively small comes in
and facilitates the electron transfer working as an electron acceptor [19]. Figure 3 shows the
electron transfer from the enzyme to the electrode via the mediator.
Because a mediator can replace the oxygen otherwise needed to re-oxidise GOx, the problem
with oxygen level as a limiting factor at a measurement can be avoided. Another advantage
using mediators in enzymatic biosensors is their low redox potential. The working potential of
the sensor will be dependent on the oxidation potential of the mediator which is low for most
mediators used. Interfering signals from species other than the analyte will be avoided if the
working electrode potential (in this case the gate potential) is low [11]. At higher potentials
(like the potential required for the measurement of H2O2 with a platinum electrode) species
like ascorbic and uric acid are also electroactive and can interfere with the signal if present in
a sample. This will affect the selectivity of the sensor [26]. Also, platinum electrodes have
relatively poor selectivity and sensitivity and are thus not ideal for analytical applications.
Better sensitivity can be achieved with the use of a mediator [27]. Platinum is also very
expensive and a mediator would therefore be preferable for a disposable biosensor.
The redox potential is a term that is often mentioned when talking about mediators. The
mediator that is chosen should have an appropriate redox potential. The definition of the
redox potential according to IUPAC (International Union of Pure and Applied Chemistry)
reads [28]:
“Any oxidation-reduction (redox) reaction can be divided into two half reactions: one in
which a chemical species undergoes oxidation and one in which another chemical species
undergoes reduction. If a half-reaction is written as a reduction, the driving force is the
reduction potential. If the half-reaction is written as oxidation, the driving force is the
oxidation potential related to the reduction potential by a sign change. So the redox potential
Figure 3 Mediated electron transfer from the enzyme to the electrode.

9
is the reduction/oxidation potential of a compound measured under standards conditions
against a standard reference half-cell.”
The redox potential however depends on the environment, like pH and temperature, so it may
not be possible to predict the redox potential of a compound prior to an experiment.
Compounds that can catalyse the oxidation of H2O2 and can be used as alternatives to
platinum will be referred to as mediators as well in this report. The electron transfer then
happens through the H2O2, as shown in Figure 4.
There are plenty of different mediators with different properties. Some important
considerations for choice of mediator/mediators in this work are:
Which mediators can oxidize FADH2 or catalyse the degradation of H2O2?
Which mediators have been used in other works mixed with ink for screen-printed
electrodes, or used in similar ways?
In what potential ranges and pH values does the mediator function?
Does the mediator withstand the curing temperature of the ink used?
The mediators considered in this work are described below.
2.4.1 Ferrocene Iron ions and their complexes are often used as mediators. Ferrocene, an iron ion between two
cyklopentadiethyl anions (see Figure 5), and ferrocene derivatives have been
the most successful mediators for glucose oxidase. Ferrocene (Fc) operates
in the following way with glucose oxidase [2]:
Glucose + GOx(ox) ↔ gluconolactone + GOx(red) + 2H+ (GOx is
reduced as it oxidizes glucose)
GOx(red) + 2Fc+ ↔ GOx(ox) + 2Fc (As GOx is reoxidized, ferrocene is
reduced, picking up electrons)
2Fc ↔ 2Fc+ + 2e
- (Ferrocene is reoxidized to Fc
+ at the electrode
surface)
No oxygen is required in these reactions, and hence oxygen is no longer a limiting factor for
detection of glucose.
Figure 5 Ferrocene
Figure 4 Electron transfer with mediator that catalyses the oxidation of hydrogen peroxide.

10
Ferrocene is useful because its pH optimum with glucose oxidase is 7.5, close to the blood
pH. Also, ferrocene is insoluble in its reduced form in aqueous solution and can therefore be
adsorbed to a surface. The oxidized form is soluble, and as ferrocene is oxidized by the
electrode it becomes more soluble and diffuses to the glucose oxidase where the reaction can
take place [19]. The different derivatives have different properties when it comes to redox
potential, solubility and rate constants for electron transfer [2].
Ferrocene and its derivatives can be used with several other oxidases and some
dehydrogenases as well [11,18].
2.4.1.1 Electrodes with ferrocene Ferrocene is as mentioned above one of the most common mediators used in combination
with glucose oxidase [19]. For example, it has been used in amperometric glucose sensors
mixed in carbon paste electrodes. Nakabayashi et al.[29] have grinded ferrocene together with
carbon powder and paraffin liquid and used as an electrode with glucose oxidase immobilised
on its surface. Glucose was detected at a potential of 0.4V vs. Ag/AgCl reference electrode.
Yaghoubian et al.[30] and Wang et al. [31] have used similar methods to incorporate
ferrocene and dimethyl ferrocene respectively into carbon paste electrodes. Miao et al.[32]
have deposited ferrocene solved in methanol on top of a carbon paste electrode and detected
glucose at 0.4V vs. SCE (saturated calomel electrode). One report was found where ferrocene
has been mixed in carbon ink together with glucose oxidase for screen-printing. However the
ink was based on a sol-gel that is different from common screen-printing inks [33]. Otherwise
ferrocene has been immobilized on the surface of screen-printed carbon electrodes [34].
2.4.2 Ferricyanide Another oxidizing agent is the ferricyanide (also called hexacyanoferrate) ion [Fe(CN)
6]3−
. It
is one of the most common inorganic mediator used in biosensors [11,35]. It often comes as
potassium ferricyanide K3[Fe(CN)6] and can be used as the oxidizing agent for glucose
oxidase and other enzymes as well, like lactate dehydrogenase [11]. Potassium ferricyanide
operates in the same way as ferrocene, replacing oxygen as the oxidizing factor. The reaction
of ferricyanide and glucose oxidase is the following [35,36]:
GOx-FADH2(red) + 2[Fe(CN)6]3−
↔ GOx-FADH(ox) +2[Fe(CN)6]4−
+ 2H+
2[Fe(CN)6]4−
↔ 2[Fe(CN)6]3−
+ 2e- (at electrode surface)
Ferricyanide is an efficient electron transporter and shows a high degree of reversibility [35].
[Fe(CN)6]4−
is called ferrocyanide. Ferri- or ferrocyanide can be used with many other
oxidases and some dehydrogenases as well [11].
2.4.2.1 Electrodes with ferricyanide Ferricyanide has been used as a mediator for amperometric glucose biosensors. For example
drop coated onto screen-printed carbon electrodes together with glucose oxidase, with a
working potential around 0.3V [35,37]. Cupric ferricyanide has also been grinded and mixed
with carbon ink and printed to electrodes for a disposable amperometric glucose sensor [38].
Ferricyanid also have been used as the mediator in strips for home blood-glucose monitoring
[20,37].

11
2.4.3 Cobalt phthalocyanine Cobalt phthalocyanine (CoPC) is a compound that effectively catalyses the electrochemical
oxidation of H2O2 that is a product in many oxidase enzyme reactions, including the one
between glucose oxidase and glucose [23]. It is a well-studied inorganic mediator for glucose
sensors [20]. CoPC is insoluble in water and most organic solvents so it will not dissolve into
the sample that can be a problem in some cases. It can simply be mixed with carbon ink and
screen printed providing a simple fabrication for a H2O2 sensing device [23]. The reaction that
takes place in contact with H2O2 is the following [39]:
H2O2 + 2Co2+
→ O2 + 2Co+ + 2H
+
Co+ → Co
2+ + e
- (at electrode surface)
2.4.3.1 Electrodes with CoPC Crouch et al. [23] have developed water based carbon ink for screen-printing containing
CoPC and glucose oxidase in collaboration with Gwent Electronic Materials Ltd. This ink has
been used to print an amperometric glucose sensor with promising results, such as good
reproducibility. The same authors have in a later study used a similar ink from Gwent
Electronic Materials Ltd. and produce a reliable amperometric glucose biosensor. The
working potential for these sensors was 0.5V and they had a pH optimum of 8 [23,39].
Shimoura et al. [40] have developed a screen-printed amperometric sensor for ʟ-lactate using
CoPC-mediated carbon ink obtained from Gwent Electronic materials Ltd. Working electrode
(with CoPC), reference electrode (Ag/AgCl) and counter electrode were all printed and the
enzyme lactate oxidase (LOD) was immobilized on the surface covered by a Nafion film as a
protection against interfering species. Lactate was detected at 0.45V in pH 7.4. The sensor
showed good selectivity and reproducibility and the response was linear from 18.3µM to
1.5mM.
2.4.4 Prussian Blue Prussian blue (soluble form: K[Fe
IIIFe
II(CN)6]) is a chemical compound that in its reduced
form can catalyse the oxidation of H2O2. O’Halloran et al. [15] have synthesized Prussian
blue, grinded it, mixed with a commercial carbon ink and then screen-printed electrodes used
for amperometric detection of H2O2 with a reference electrode at a working potential of 0V.
At higher potentials the oxidized form of Prussian blue that has no catalytic effect on H2O2
dominates and over 0.15V no signal is observed. Glucose oxidase was deposited on the
surface of the electrodes for detection of glucose. Another study have mixed glucose oxidase
in the ink together with Prussian blue and screen-printed electrodes [41]. There are several
other examples of glucose sensors and other biosensors based on Prussian blue. It has been
used in combination with many different oxidase enzymes. However, one drawback is that
Prussian blue is unstable in pH higher than 7.0 [42]. The low working potential is an
advantage when it comes to selectivity as mentioned above, but in combination with an OECT
with a channel of PEDOT:PSS functioning at positive potentials, Prussian blue may not be a
good option.
2.4.5 Manganese dioxide Manganese dioxide (MnO2) is another compound that can catalyse the oxidation of H2O2.
Turkusic et al. [43] have constructed a screen-printed amperometric biosensor for bonded
glucose. Carbon ink was bulk-modified with MnO2 and glucose oxidase and used for printing
of a working electrode, which was dried for 1h in 40oC. A flow injection system has been
used to analyse the samples, consisting of beer, at a potential of 0.48V vs. Ag/AgCl. The
sensor works well in physiological pH as well.

12
2.4.6 Summary An overview of some mediated biosensors fabricated with screen-printing technique or
similar are listed in Table 1 below.
Analyte Type of
sensor
Mediator Working electrode Working
potential
Analysis
methods
*
pH Ref
Glucose/
H2O2
Ampero-
metric
CoCP 3x3mm. Screen-printed carbon bulk
modified with GOx and mediator.
0.5V vs.
SCE
A, HV 8 [23]
Glucose,
in
plasma
samples
Ampero-
metric
CoCP Screen-printed carbon bulk
modified with GOx and mediator.
0.5V CA 8 [39]
Lactate Ampero-
metric
CoPC Screen-printed carbon bulk-
modified with mediator. LOD
immobilized on electrode surface
covered by Nafion film.
0.45V vs.
Ag/AgCl
CV, A 7.4 [40]
Glucose Ampero-
metric
Ferrocene
Carbon paste. Mediator and GOx
immobilized with chitosan film and
glutaraldehyde
0.4V vs.
SCE
7 [32]
Amylase
(via
glucose)
Ampero-
metric
Ferrocene Screen-printed carbon electrode.
Mediator and GOx immobilized on
top of electrode with Nafion, BSA
and gelatin.
0.23V vs.
SCE
CV, CA 7 [34]
Glucose Ampero-
metric
Ferrocene Carbon paste electrode bulk
modified with mediator.
Immobilization of GOx with
electrochemical polymerization of
phenols.
0.4V CV 7 [29]
Glucose Ampero-
metric
Ferricyanide Screen-printed carbon electrode.
Mediator mixed with chitosan
oligomers dropped on surface. GOx
dropped on surface.
0.3V CV, A 7 [35]
Glucose
and
maltose
Ampero-
metric,
disposable
Potassium
ferricyanide
Screen-printed carbon electrode.
Mediator and enzyme dropped onto
the surface.
0.25V CA 4.4 [37]
H2O2/glu
cose
Ampero-
metric
Prussian
blue
Screen-printed carbon electrode
bulk modified with mediator. GOx
on top of electrode covered with
Nafion film.
0V vs.
Ag/AgCl
CV, A,
HV
7.4 [15]
Glucose Ampero-
metric
MnO2 Screen-printed carbon electrode
bulk modified with mediator and
GOx
0.48V vs.
Ag/AgCl
7.5 [43]
Table 1 Summary of mediated biosensors. *A:amperometry, CA: chronoamperometry, CV: cyclic voltammetry, HV:
hydrodynamic voltammetry.

13
2.5 OECT – the transducer Transistors are semiconductor devices that can act as switchers or amplifiers controlled by
current or potential. There are a great number of different transistors with different functions.
Field effect transistors (FET) are one big group. These have three connections; gate, source
and drain. The gate voltage determines the current between source and drain [44]. The organic
thin film transistors and organic electrochemical transistor are subclasses of FET.
The sensor in this project will be based on an organic electrochemical transistor (OECT), a
class of organic thin film transistor (OTFT). These transistors are good transducers because
they amplify the signal which enables small sample volumes. They are easy to incorporate
into circuits and they can be miniaturized. OECTs also have the ability to function in aqueous
environments, because they operate at low voltages, often below 1V, which limit the risk of
undesired redox reactions in water or in biomolecules. These properties make them very
suitable for biological applications. The OECT also has a simple construction. It consists of
channel made of a thin film of conducting polymer (also called organic semiconductor),
source and drain contacts, an electrolyte in direct contact with the channel and a gate
electrode immersed in the electrolyte [8,45,46]. Figure 6 shows a principal sketch of an
OECT.
2.5.1 Materials The material commonly used as the channel in an OECT is poly(3,4-
etylendioxythiophene) (PEDOT) doped with poly(styrenesulfonate)
(PSS). PEDOT (Figure 7) is an electrochemically active conjugated
polymer and can switch reversibly between redox states. The
advantages with PEDOT are that it is stable in a wide pH-range, and
has a high conductivity. The PSS stabilizes the PEDOT in its
oxidized form and makes it soluble, which enables easier processing
of the polymer. For example it can be made into thin films or printed
[8,45,47]. PEDOT:PSS is well studied and well characterized,
commercially available and biocompatible [27,45]. The good conductivity makes it possible
to use PEDOT:PSS as the material for the gate, source and drain as well [48]. Otherwise the
gate may be made of metals like silver, gold or platinum [8] or other materials.
Conjugated polymers can be either p-doped or n-doped. An oxidized polymer is said to be p-
doped while a reduced polymer is n-doped. P-doped polymers, meaning that electrons are
withdrawn from the polymer creating holes, are most common in devices. This is because
polymers that are n-dopable polymers are often unstable and reacts quickly with oxygen in the
air [47]. PEDOT however can only be p-doped. In p-doped PEDOT the holes are
compensated by SO-3-groups on the PSS, acting as acceptors [49]. The structure of
PEDOT:PSS is shown in Figure 8.
Figure 7 Structure of PEDOT.
Figure 6 Principal sketch of an OECT.

14
The oxidized state of PEDOT, PEDOT+, is highly conducting while the neutral form,
PEDOT0 is less conductive. The switching between the redox states (or the doping and de-
doping as this also is called) is described by following reaction:
PEDOT+:PSS
- + M
+ + e
- ↔ PEDOT
0 + M
+:PSS
highly conducting (ox) ↔ less conducting (neutral)
M+ is a cation from the electrolyte that migrates into the channel and the electron, e
-, comes
from the source and drain electrodes. When PEDOT is reduced, the cation needs to
compensate for the negative charge in PSS and the conductivity of the channel is changed
[8,47].
Transistors made with PEDOT have successfully been used for the development of biosensors
[8].
2.5.2 Operation In the conventional setup for measurement with an OECT a constant voltage is applied to the
gate electrode (Vg), the source electrode is grounded and a small fixed bias is applied to the
drain electrode (Vd). The output is the source-drain current that flows through the channel
[46]. No reference electrode is needed as can be seen in Figure 9.
When no gate voltage is applied to the OECT, the drain current is determined by the
conductance of the organic semiconductor of the channel [49]. When a small positive gate
voltage is applied cations from the electrolyte migrates into the polymer, reducing (de-doping)
it, according to the reaction above, hence lowering the conductivity (see Figure 9). The
current is then decreased with a degree determined by the extent of the de-doping of the
polymer [8,49].
Figure 8 Structure of p-doped PEDOT:PSS.
Figure 9 Working principle of an OECT. Ions are migrating into the channel when a
positive gate voltage is applied.

15
The drain current of an OECT for a fix drain voltage depends only on the potential of the
electrolyte. When the gate voltage is small enough not to induce any charge transfer between
the gate and the electrolyte the electrolyte potential is determined by the capacitances of
double layers that are formed at the gate and the channel [46]:
Vg: gate voltage, Cc: channel capacitance, Cg: gate capacitance
An OECT can operate in different ways, but the application here will be as an electrochemical
sensor. The gate electrode will then function as the working electrode. Reactions that include
charge transfer (like redox reactions) between the gate electrode and the analyte in the
electrolyte will change the potential of the electrolyte, as illustrated in Figure 10, when the gate voltage is held constant [48]. Because there is charge transfer involved, this contribution
to the potential is Faradic. The potential of the electrolyte is increased with a value Vanalyte
described by the Nernst equation:
[ ]
k: Boltzmann’s constant, T: absolute temperature, e: fundamental charge, C: concentration of the analyte,
constant: contains formal potential and other details.
This increase of the electrolyte potential as the result of addition of an electroactive analyte
will increase the potential drop between the electrolyte and the channel. This will increase the
number of cations migrating into the channel and decrease the source-drain current. The drain
current thus corresponds to the concentration of the analyte present in the electrolyte [46,48].
2.5.3 Transistor design The geometry of an electrochemical transistor has an influence on its performance. One
important factor is the relationship between the gate area and the channel area. Cicoira et al.
[27] have made planar OECTs with PEDOT:PSS channels and platinum gates and
investigated their response for H2O2. They have varied gate and channel sizes and conclude
that a small gate works best for detection of an analyte that interacts with the gate electrode.
The small gates gave lower background signals and higher sensitivity. Their results also
indicate that the ratio between the gate and channel areas is more important than their actual
sizes. However the ratio only affects the sensitivity and not the detection limits [27].
Yaghmazadeh et al. [48] have used numerical modelling to optimize the OECT geometry.
They also have found that OECT used as electrochemical sensors show higher sensitivity
when the gate is smaller than the channel. The optimal ratio depends on several parameters
like drain voltage and the capacitances of the gate and channel. If the channel width was
maximized and the length minimized, sensitivity was also improved [48].
Figure 10 The potential differences between
gate, electrolyte and channel. As the
electrolyte potential is increased by the presence of an analyte (according to Nernst
equation) the potential drop down to the
channel potential is increased resulting in
modification of the source-drain current.
16
An OECT device can be designed lateral or vertically. The lateral configuration is the
simplest with all parts placed next to each other and the electrolyte defining electrochemical
transistor. In the vertical configuration the gate and the channel are facing each other with the
electrolyte between them (like in Figure 6). The distance between the gate and the channel
can be made very small with the vertical design which enables a fast response compared with
the lateral design. The advantage with the lateral design may be greater exposure of the
analyte to the channel as it is easier to access [8].
To get an idea of the dimensions of OECT working as a biosensor, some examples of gate and
channel sizes and materials from previous works are listed in the Table 2 in the next section.
2.5.4 Previous work on OECT biosensors As stated above the OECT may well be used as a biosensor. Because many enzymatic
reactions are redox reaction involving electron transfer enzymes most often are the choice of
sensing element in OECT biosensors. The enzymatic reaction will then change the redox state
of the channel polymer [45]. Some examples of biosensors based on OECTs are described
next.
Several sensors based on OECTs have been made for determination of glucose by detecting
H2O2. A simple construction described by several authors can be made with a channel of
PEDOT:PSS, a platinum wire as the gate electrode and a buffer containing glucose oxidase as
the electrolyte. The analyte is added to the electrolyte [22,46,50,51]. There are similar
constructions with platinum gates and PEDOT:PSS but where the enzyme was immobilised
onto the gate with chitosan [52] or just dropped onto the channel [50]. The detection limits of
these sensors are often low and can be made down to the micro molar range [46,51,52]. The
same construction has also been used to detect lactate with lactate oxidase. H2O2 is produced
and oxidized at the platinum gate [50].
The principle with PEDOT:PSS channel and platinum gate also has been used for the
fabrication of a dopamine sensor. Dopamine was added to the electrolyte solution consisting
of PBS and was electrooxidized to o-dopaminequinone at the gate electrode. The sensing
mechanism becomes similar to a H2O2 sensing OECT [53]. No enzyme is needed in this
sensor.
One OECT for glucose has been made where PEDOT:PSS has been used not only as the
channel but also as the gate, source and drain. A well was containing the electrolyte consisting
of PBS, glucose oxidase and the mediator ferrocene. Glucose was added to the electrolyte for
detection [54].
Yet another variant of a glucose sensing OECT used room temperature ionic liquids (RTIL),
which are organic salts that are liquid in room temperature and consists only of ions. The
RTIL acted as the electrolyte and included the enzyme glucose oxidase and the mediator
ferrocene. The RTIL was patterned over the gate and channel which were made of
PEDOT:PSS and had a lateral configuration. When glucose solution was added to the device
it mixed with the RTIL containing the enzyme and mediator and this resulted in a modulation
of the source-drain current. The amplification of the transistor enables very low detection
limits, from 0.1µM to 10mM [55].

17
A summary of some OECT biosensors are listed in Table 2 below.
Sensor Comment Gate
material/Channel
material
Gate size Chanel size Potentials
Vg/Vd
Ref.
OECT for
glucose
GOx in
electrolyte
Pt wire/PEDOT:PSS Not stated 1x10mm 0 to 0.4V
/-0.2V
[46]
OECT for
glucose/
H2O2
GOx in
electrolyte
Pt wire/PEDOT:PSS Not stated 5mm wide,
25mm long
(including
source and
drain)
0.6V/
0.2V
[22]
OECT for
glucose and
lactate
Microfluidic
system for
multi analyze.
Pt/PEDOT:PSS 300µm wide
1.2mm long
300µm
wide, 1.2mm
long
0.3V/
-0.2V
[50]
OECT for
glucose
GOx in
electrolyte
Pt wire/PEDOT:PSS Not stated 4x1mm 0.1 to
0.6V/-0.2V
[51]
OECT for
glucose
GOx
immobilized
on elecreode
Pt + chitosan,
MWCNT,GOx or
Pt-NPs*/PEDOD:PSS
20mm2 0.2x6mm Not stated/
0.4V
[52]
OECT for
dopamine
No enzyme.
Different gate
electrodes
tried
Pt ect./PEDOT:PSS Not stated 6mm wide,
100µm long
0.6V/
-0.1V
[53]
OECT for
glucose
GOx +
ferrocene as
mediator in
electrolyte
PEDOT:PSS/
PEDOT:PSS
1x10mm
1x10mm 0.1 to
0.4V/
-0.2V
[54]
Table 2 Examples of OECT sensors with gate and channel materials and sizes. *MWCNT: multi-wall carbon nanotubes, NP:
nano particle.

18
Technological approach 3Based on the theory described above and the results of research done in the fields of
biosensors and printing techniques a method for fabrication of a glucose biosensor with an
OECT transducer was compiled. Some motivations and comments to the choice of methods
are given in this section. Also the measurement techniques are described.
3.1 Procedure Though most OECT glucose sensors that have been reported this far have used platinum for
the gate electrode, it is desirably to avoid platinum as it is very expensive and can be hard to
print. Therefore a mediated carbon electrode, often used for amperometric sensors, was tried
out instead. In short, the mediator was grinded and mixed with carbon ink for printing of gate
electrodes. Enzyme was deposited on top of the electrodes with a micro pipette. The gate
electrodes were first characterized with a potentiostat using voltammetry methods and then
the whole transistor was designed, fabricated and evaluated. The transistor was made with
screen-printing technique as all materials needed are possible to print with this technique and
it has been used for printing of mediated carbon electrodes before.
3.1.1 Mediator choice Ferrocene and ferricyanide was chosen for this project because they are very common
mediators for glucose oxidase and well characterized. Also, a mediated commercial ink
containing CoPC was purchased from Gwent Electronic Materials Inc. This ink is designed
for screen-printing applications and it should detect H2O2 at a potential of approx. 0.4V vs.
Ag/AgCl [56].
3.1.2 Electrode fabrication As ferrocene can be solved in organic solvents similar or miscible with those used in the
carbon ink, this was tried as well. By solving the mediator the possible problem with particles
stuck in the mesh could be avoided.
Electrodes for testing were fabricated by stencil printing because it is simpler and quicker
than screen-printing when many different inks is printed in small numbers (se section 4.5
further on). Also, no extra screen-printing frame was needed for testing of electrodes.
3.1.3 Enzyme application For this study it was more convenient to drop coat the enzyme on top of the electrode and let
it adsorb than mix it with the ink. This required less of the enzyme for a small number of
sensors and it was easier to control the amount of enzyme on the surface. Also there is a risk
of destroying the enzyme by grinding or heating it.
For characterization measurements on the working electrode, a more robust immobilisation
than adsorption was necessary because the sample volume was big, around 10ml, and the
enzyme becomes too diluted if it diffuses from the electrode. Therefore, immobilization in
bovine serum albumin (BSA) crosslinked with glutaraldehyde was chosen because it is a
commonly used method that should works well. The protocol followed for this
immobilization technique can be found in “Enzymes Biotechnology” by G. Tripathi [57].
3.1.4 Transistor fabrication As mentioned above, the transistor was fabricated with screen-printing technique. The
material used for the channel was PEDOT:PSS and for the gate electrode carbon bulk
modified with a mediator, with glucose oxidase deposited on the surface. The sample
functioned as the electrolyte that connected gate and channel.

19
The meshes that were chosen for the screen-printing are standard sizes used at Acreo, but for
the gate electrodes a mesh with fewer threads/cm was chosen so that the mediator particles in
the ink easier could pass through it.
3.2 Analytical methods and instrumentation The gate (or working) electrodes were characterized separately before the transistor was made
in order to make sure that they could sense glucose or H2O2. The methods used for this were
cyclic voltammetry and chronoamperometry and are described below. The transistor
measurements were then performed with a semiconductor parameter analyser, also described
below.
3.2.1 Cyclic voltammetry The term voltammetry includes methods based on evaluation of current-potential graphs. A
potential is applied between the working electrode and a reference electrode and is then varied
linearly with time. The measurement is performed in an electrochemical cell containing a
supporting electrolyte and an electroactive species that can be reduced or oxidized. The
electrolytic current that flows through the working electrode is recorded as a function of the
potential applied. The resulting graph is called a voltammogram [2,10].
In linear sweep voltammetry the potential is swept from one value to another with a constant
speed. When the potential gets close to the oxidation potential (if the sweep goes from a lower
potential to a higher) of the electroactive species, electron transfer is increasing and so is the
current until a peak value is reached (the oxidation peak or anodic peak). The reaction that
takes place is Re → Ox + e-. In cyclic
voltammetry, the potential sweep is then
reversed and when the redox potential is
reached the species that was oxidized in
the previous sweep is reduced again; Ox
+ e- → Re. The current is increased in the
negative direction and culminates in a
reduction peak or cathodic peak [2]. A
typical cyclic voltammogram (CV) and
the corresponding potential sweep are
shown in Figure 11.
Cyclic voltammetry is very useful method when information about an electrochemical system
is wanted. Cyclic voltammograms can be obtained very fast and contain a lot of information.
The separation between the potentials of the two peaks, ΔEp = Ep anode – Ep cathode, indicates if
the electrochemical reaction is reversible or not. For a completely reversible reaction, ΔEp =
0.57/n V where n is the number of electrons transferred in each reaction. Also the ratio
between the current values of the peaks should be one; Ip anode/Ip cathode=1 [10]. If the peaks are
separated more than 0.57V the electrode reaction is irreversible. An irreversible reaction has
slow or no electron transfer. However, the value corresponding to the average of the two peak
potentials still indicates the formal potential E0’= (Ep anode + Ep cathode)/2 [2]. There is also
something called a quasi-reversible reaction where the current is determined both by the
charge transfer and the mass transport to the electrode. The peak separation is larger than for a
reversible system but not as large as for an irreversible system [58]. Absence of a reverse peak
indicates that the reaction is completely irreversible [2]. If multiple peaks appear more than
one reaction take place where electrons are transferred [10]. Figure 12 shows the peaks of a
cyclic voltammogram with increasing potential in the forward scan.
Figure 11 Principle of cyclic voltammetry. A potential sweep is
applied and the current is measured.

20
The Randles-Sevcik equation describes the peak current for a reversible reaction and forward
scan at room temperature:
where n is the number of electrons transferred, A is the area of the working electrode, D the
diffusion coefficient, C the concentration of the electroactive species and v is the scan rate.
For an irreversible reaction the equation is:
As can be seen in these equations, reversible reaction or not, the peak current is directly
proportional to the concentration C of the electroactive species [2]. The peak current also
depends on the area of the working electrode and the scan rate.
The instrument used to generate a voltammogram is called a potentiostat and is an electronic
circuit with three electrodes in an electrochemical cell. A predetermined voltage is imposed
between the working electrode and the reference electrode and a function generator provides a
reference voltage as a function of time. The third electrode is a counter electrode [10].
3.2.2 Chronoamperometry The chronoamperometry (CA) technique is related to voltammetry, but the potential is
stepped like a square-wave to a certain value instead of swept. The current is registered as a
function of time (see Figure 13). The decay
in current is caused because the diffusion
layer of the analyte is spreading out,
decreasing the concentration of analyte to
be oxidized at the surface. The current also
depends on electrode area.
Chronoamperometry measurement can be
performed with the same equipment as for
the cyclic voltammetry; a potentiostat with
a three-electrode system. This method is
Figure 13 The principle of chronoamperometry. A potential is applied
and the current is measured.
Figure 12 A typical CV with the anodic and cathodic peaks marked. Here, the anodic current is defined as positive and the cathodic current
as negative.

21
useful for biosensors [2] and also commonly used for characterising commercial biosensors as
it is simple to perform [39].
3.2.3 Transistor characteristics To characterize a transistor IV-curves are often used to illustrate the output. For FET-
transistors, source-drain current (Ids) is plotted vs. drain voltage (Vd) for different gate
voltages (Vg), see Figure 14.
For an OECT with PEDOT:PSS as the channel, the current through the channel reaches its
highest value when Vg is zero and the transistor is said to be on. Ids is then decreasing with
increasing Vg as PEDOT:PSS becomes more de-doped and hence less conductive [8]. When
the gate voltage value is reached at which the drain current becomes zero the device is said to
be cut-off [44]. For a transistor in general, the modulation of Ids between the on and off states
should be large, but for a transistor working as a sensor with a small gate this ratio is smaller
[48].
According to measurements done by Nikolou et al. [8] for OECTs based on PEDOT:PSS, the
relationship between Ids and Vd is in general almost linear for all Vg applied at low negative or
positive Vd close to zero. At high positive Vd irreversible overoxidation of PEDOT:PSS may
occur. Greater negative Vd leads to saturation of Ids and almost flat curves.
For measurements of the transistor as a sensor the drain current is measured for a certain
applied gate voltage. As described in section 2.5.2 the current should decrease in presence of
an analyte.
Measurements are done with a semiconductor parameter analyser. The ordinary setup for a
measurement with an OECT is to connect the source to the ground and apply the drain voltage
to the drain contact relative the ground. The positive gate voltage is applied to the gate
electrode also relative to the ground [49].
Figure 14 Example of how an output characteristic can look
for an OECT.
22
Experimental 4Here, the details of the sensor fabrication process and experiments performed will be given.
4.1 Chemicals and reagents The chemicals used for the experiments are listed in Table 3 below.
Name Provider Comment
DuPont, carbon conductive
composition
DuPont (7102) Solvent: Dipropylene glycol monomethyl
ether. 36% solids
Gwent mediated carbon graphite
paste
Gwent (C203040P3) Contains cobalt phthalocyanine
Ferrocene (98%) Aldrich (F408)
Potassium hexacyanoferrate(III) Sigma (60299) Synonym: potassium ferricyanide(III)
Phosphate buffered saline (PBS) Sigma (P4417) 1 tablet in 200ml H2O gives 0,01M phosphate
buffer, 0,0027M potassium chloride and
0,137M sodium chloride with pH 7.4 at 25oC
Hydrogen peroxide, 30% Fluka (95321) 30% = 8.8M is used in calculations
Glucose oxidase, 211U/mg Fluka (49180) From Aspergillus niger
D-(+)-glucose, ≥99.5% Sigma (G8270)
Bovine serum albumin (BSA)
≥98%
Sigma (A7906)
Glutaraldehyde (GA), 50% wt Sigma-Aldrich (340855)
Methanol, 99.8% Sigma-Aldrich (322415)
Diethylene glycol monobuthyl
ether, ≥98%
Fluka (32250)
Table 3 Chemicals and reagents used for experiments.
4.2 Instrumentation The instruments used for fabrication and tests of the electrodes and transistors are listed in
Table 4 below.
Instrument Model
Light microscope Nikon OPTIPHOT 150
Sieve shaker Retsch AS 200
pH meter Metrohm 826 pH mobile
Ultrasonic bath
Potentiostat µAutolab type III
Plotter Graphtec FC2200-90Ex
Screen-printer Eikmeyer TIC SCF-550
Semiconductor parameter analyzer HP 4155B
Ozone cleaning device Jelight UVO Cleaner 144AX-220
Table 4 Instruments used for experiments
4.3 Solution preparation Deionized water was used to prepare all solution. Fresh solutions were made continuously.
One tablet of PBS was dissolved in 200 ml deionized water (see Table 3). The pH was
checked with a pH-meter. The buffer was then stored in a refrigerator (+6oC).
H2O2 was diluted with PBS to a concentration of 0.1M and this was then used as stock
solution for further dilution.
ᴅ-(+)-glucose was weighed and dissolved in PBS to concentrations of 20mM and 1M. It was
allowed to mutarotate in room temperature for 24h and was then stored in a refrigerator
(+6oC).

23
For enzyme immobilisation solution, 17.5wt% BSA solution was made by weighing 0.035g
of BSA and add 165µl (=0.165g) water. 0.050g glutaraldehyde was weighed and diluted to
1.0g with water to a 2.5wt% solution. 4.17mg GOx was weighed and dissolved 0.225ml PBS.
0.125ml of the BSA solution was added to the GOx solution and then 0.15ml of the
glutaraldehyde solution was added to that. The blend was mixed properly and used directly
after preparation. 5µl of the blend contained 8.8U of the enzyme.
3.8mg glucose oxidase was weighed and solved in 0.5ml PBS. This gives 1600U/ml or
8U/5µl. The solution was used directly after preparation.
4.4 Preparation of mediated carbon inks
4.4.1 Ferrocene-mediated ink Ferrocene was grinded by hand with a pestle and mortar to a fine powder. Methanol was
added to avoid dust. The particle size of the ferrocene powder was then checked with a light
microscope. The powder was allowed to dry and then mixed with carbon ink (Dupont 7102).
Calculations were made for the dry weight of the ink, as the solvent disappear during the
curing. Inks containing 1, 5 and 10wt% was prepared and sonicated for 20 minutes.
Ferrocene was also solved in methanol and diethylene glycol monobuthyl ether. The ferrocene
solved in diethylene glycol monobuthyl ether was mixed with carbon ink (Dupont 7102) to
dry weight concentrations of 1 and 2wt%.
4.4.2 Ferricyanide-mediated ink Potassium ferricyanide was grinded by hand with a pestle and mortar to a fine powder. The
powder was sieved with a sieve shaker to achieve homogenous particle size. A 40µm sieve
was used. The amplitude was set to 1.6 and the time to 30 minutes. This procedure was
repeated two to three times. The sieved powder was mixed thoroughly with carbon ink
(Dupont 7102) to concentrations of 0.5, 1, 2.5, and 5wt% and was then sonicated for 20
minutes. Calculations were made for the dry weight of the ink.
4.4.3 CoPC-mediated ink 100g mediated carbon graphite paste, product nr. C203040P3, was purchased from Gwent
Group, Gwent Electronic Materials Ltd.
4.5 Fabrication of gate electrodes for characterization with potentiostat Silver conducting paths screen-printed on PET plastic sheets (Polyfoil) was used as the
substrate. The stencil was cut out from self-adhesive plastic film on a plotter table. The stencil
was placed on the substrate and the ink was pulled over the stencil with a glass slide. The
stencil was then removed and the electrodes were allowed to cure in an oven. The inks based
on Dupont 7102 were cured in 120oC for 5 minutes and the ink from Gwent in 80
oC for 15
minutes. Nail polish was used as an insulator to cover the silver that cannot be in contact with
the electrolyte. The exposed carbon area was 3x4 mm2 in size. Electrodes without any
mediator were also made from DuPont 7102. The designs of the electrodes are shown in
Figure 15.
Figure 15 Sketch of stencil printed electrodes.
The exposed carbon area is 3x4mm2.

24
For electrodes with enzyme, 5 or 10µl of the enzyme immobilisation solution containing BSA
and GA was dropped onto the electrode surfaces with a micro pipette and the electrodes were
then allowed to dry in petri dishes in refrigerator.
4.6 Characterization of gate electrodes with potentiostat The stencil-printed gate electrodes were characterized with a potentiostat and a three electrode
system. An Ag/AgCl electrode was used as reference electrode and a platinum grid as a
counter electrode. These electrodes and the working electrode were immersed into a small
beaker containing the electrolyte. Cyclic voltammetry and chronoamperometry in stirred
solution was run. Table 5 below gives an overview over the electrodes and testing made.
(Some of the tests made are based on the results achieved for the initial measurements; see
section 5.2 and 5.3 below).
Electrode Amount of
mediator (wt
% of dry ink)
Tests Settings
No mediator (DuPont 7102)
- CV in PBS
CV in H2O2
-0.4V to 0.8V, 50mV/s
0V to 0.8V, 50mV/s
No mediator (DuPont 7102) with
GOx/BSA/GA
- CV in PBS and glucose -0.4V to 0.8V, 50mV/s
Ferrocene, no enzyme
Grinded
Solved
1, 2, 5, 10
1, 2
CV in PBS
CV in PBS
-0.1V to 0.8V, 50mV/s
-0.1V to 0.8V, 50mV/s
Ferrocene, with GOx/BSA/GA
Grinded
10
CV in PBS and glucose
-0.1V to 0.8V, 50mV/s
Ferricyanide, no enzyme
Screen-printed
0.5, 1, 2.5, 5
5
CV in PBS
CV in PBS
-0.4V to 0.8V, 50mV/s
-0.4V to 0.8V, 50mV/s
Ferricyanide with GOx/BSA/GA
5 CV in PBS and glucose -0.4V to 0.8V, 50mV/s
CoPC, no enzyme No
information
from
manufacturer
CV in PBS and H2O2
CA with H2O2 additions
(stirred solution)
0V to 0.8V, 50mV/s
0.5V
CoPC with GOx/BSA/GA No
information
from
manufacturer
CV in PBS and glucose
CA with glucose addition
(stirred solution)
0V to 0.8V, 50mV/s
0.55V
Table 5 Fabrication and characterization details of the stencil-printed gate electrodes.
Except for some electrodes with GOx/BSA/GA, a new electrode was used for every
measurement. For the CV measurements, at least five potential cycles were run. All
measurements were performed in room temperature.

25
4.7 Transistor fabrication and measurements Five layers were screen-printed to achieve the transistor. The materials and functions of the
different layers are listed in Table 6 below. The polyfoil substrate had an antistatic treatment
on one side. The choice of gate materials and measurement settings were based on the results
of the measurements of the gate electrodes with the potentiostat.
La-
yer
Material Function Supplier and product Mesh
(threads/
cm - µm)
Mesh
apertu-
re
(µm)
Curing
0 Polyfoil (PET
plastic)
Substrate Heidelberg 140oC 30min
1 Silver, Ag Conducting
paths for
electrical
contact
Dupont Ag5000 120 – 34 45 120oC 4min
2 PEDOT:PSS Channel
material
Heraeus Clevios SV3 120 – 34 45 120oC 4min
3 Carbon Source and
drain contact
Dupont C7102 77 – 48 77 120oC 4min
4 Carbon, mediated
CoPC
Ferricyanid
Gate material
Gwent C2030408P3
Dupont C7102+ferricyanide
77 – 48 77
80oC 15min
120oC 4min
5 Adhesive
Heat curable
UV curable
Isolation,
adhesive and
flow system
3M SP-4533
3M 7555T
77 – 48 77
80oC 1.5min
UV light
Table 6 The printing process and details for the transistor.
Figure 16 Schematic picture of the printing steps and designs of the transistor models.
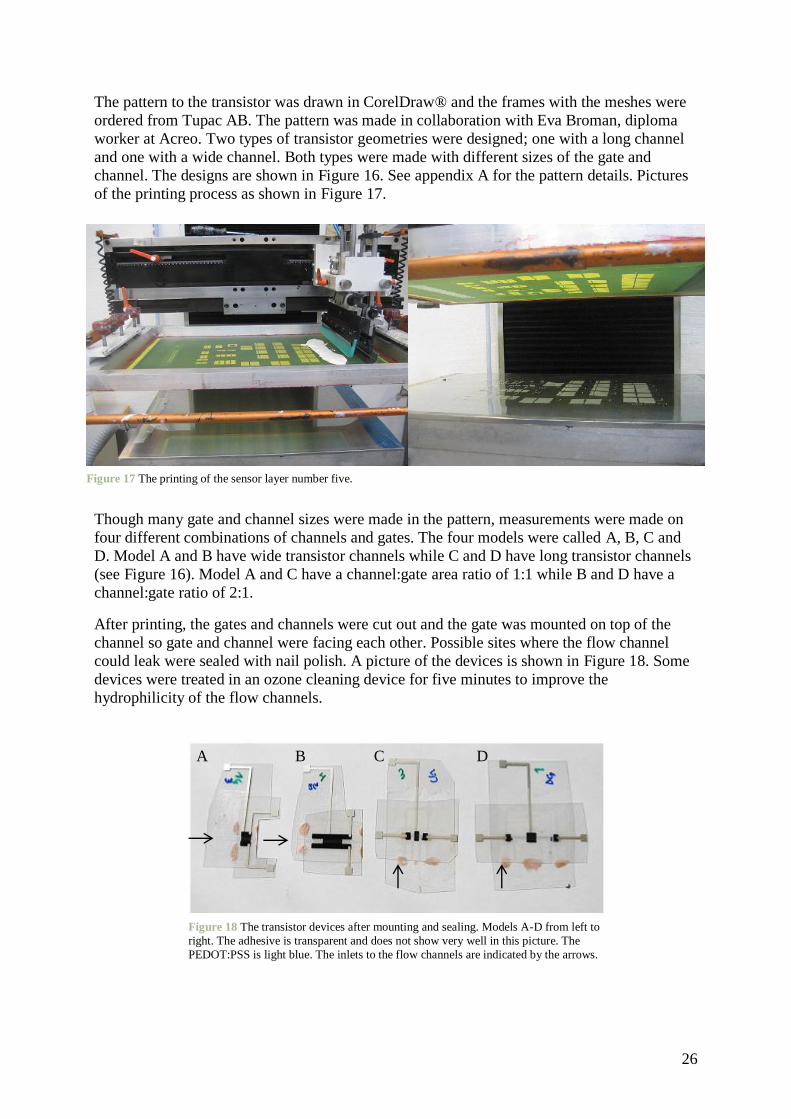
26
The pattern to the transistor was drawn in CorelDraw® and the frames with the meshes were
ordered from Tupac AB. The pattern was made in collaboration with Eva Broman, diploma
worker at Acreo. Two types of transistor geometries were designed; one with a long channel
and one with a wide channel. Both types were made with different sizes of the gate and
channel. The designs are shown in Figure 16. See appendix A for the pattern details. Pictures
of the printing process as shown in Figure 17.
Though many gate and channel sizes were made in the pattern, measurements were made on
four different combinations of channels and gates. The four models were called A, B, C and
D. Model A and B have wide transistor channels while C and D have long transistor channels
(see Figure 16). Model A and C have a channel:gate area ratio of 1:1 while B and D have a
channel:gate ratio of 2:1.
After printing, the gates and channels were cut out and the gate was mounted on top of the
channel so gate and channel were facing each other. Possible sites where the flow channel
could leak were sealed with nail polish. A picture of the devices is shown in Figure 18. Some
devices were treated in an ozone cleaning device for five minutes to improve the
hydrophilicity of the flow channels.
Figure 17 The printing of the sensor layer number five.
Figure 18 The transistor devices after mounting and sealing. Models A-D from left to
right. The adhesive is transparent and does not show very well in this picture. The
PEDOT:PSS is light blue. The inlets to the flow channels are indicated by the arrows.
A B C D

27
For measurements with the parameter analyser, a droplet (<3µl) of the sample was placed at
the inlet to the flow channel and the measurement was started when the flow channel was all
filled with the sample.
For IV-characteristics, the source-drain current was measured as a function of drain voltage
for different gate voltages. The drain voltage was varied between 0V and -1V and the gate
voltage between 0V and 1.25V. For measurements of the response, the source-drain current
was measured as a function of time during three minutes. The measurements details and gate
and channel sizes for the different models are listed in Table 7 below.
Channel/gate size
combination (mm)
Gate material Gate voltage/
Drain voltage (V)
Samples
1x4/1x4 : model A Unmediated (DuPont)
CoPC-mediated
Ferricyanide-mediated + GOx
0.55/-0.20
0.55/-0.20
0.25/-0.20
PBS, 1mM H2O2
PBS, 1mM H2O2
PBS, 20mM glucose
1x16/1x8: model B Unmediated (DuPont)
CoPC-mediated
Ferricyanide-mediated + GOx
0.55/-0.20
0.55/-0.20
0.25/-0.20
PBS, 1mM H2O2
PBS, 1mM H2O2
PBS, 20mM glucose
4x1/2x2: model C Unmediated (DuPont)
CoPC-mediated
0.55/-0.20
0.55/-0.20
PBS, 1mM H2O2
PBS, 1mM H2O2
16x1/2x4: model D Unmediated (DuPont)
CoPC-mediated
0.55/-0.20
0.55/-0.20
PBS, 1mM H2O2
PBS, 1mM H2O2
Table 7 Measurements performed with setting details.
The CoPC-mediated electrodes were evaluated for H2O2 recognition. The ferricyanide-
mediated transistors cannot be tested with H2O2, so these were evaluated for glucose
recognition with glucose oxidase. 5µl of GOx solved in PBS was deposited on each gate
electrode and was allowed to dry in a refrigerator before they were moulted on the channel.
Due to lack of time no glucose measurements were made for the CoPC-mediated electrodes.
Some of the transistor measurements were made in collaboration with Eva Broman. All
measurements were performed in room temperature. A new device was used for every
measurement.

28
Results and discussion 5The results of the fabrication and analysis for both the gate electrodes and the transistors will
be presented and discussed in this chapter.
5.1 Ink preparation The ferricyanide mediated ink was prepared without any problems. The ferrocene ink
however was more difficult because the powder showed electrostatic behaviour and tended to
leave the mortar and stuck on every surface. Therefore ferrocene was grinded in methanol and
could not be sieved in the sieve shaker.
Ferrocene particle sizes after grinding in methanol: <20µm (most particles), 40-50µm
(some particles), 100µm (few particles)
As most particles were smaller than 50µm it should be able to pass through the screen-
printing mesh with an aperture of 77µm.
Ferrocene was very hard to solve, even in organic solvents. In methanol particles precipitated
at low concentrations. Diethylene glycol monobuthyl ether gave a better result but at mediator
concentrations higher than 2wt% of the dry ink, the ink viscosity became too low due to the
large amount of solvent.
Ferrocene solvability in methanol: 0.1g in 10ml
Ferrocene solvability in diethylene glycol monobuthyl ether: 0.3g in 10ml
5.2 Characterization of gate electrodes without enzyme CVs of unmediated electrodes in PBS should not have any peaks as no redox active species
are present. However they show a narrow oxidation peak at 0.1V and reduction peaks below
0.05V. If the silver connections come in contact with the electrolyte peaks can be generated
but further investigation showed that this was not the case. Probably it is something in the
carbon ink causing the peaks but it is unclear what. Some electrodes were cured in the oven
twice but this did not remove the peaks, indicating that rests of solvents is not the problem.
Apart from these interferences, the curves were flat (see Figure 19 below). The interfering
peaks varied a lot in size between electrodes and the ones shown in Figure 19 are very high.
They become much smaller if the potential stops at -0.1V or 0V and don’t go as low as -0.4V
because there is not so much reduction. Often, they were much lower in amplitude but always
at the same positions.
Figure 19 CVs for two unmediated electrodes in PBS. High interfering peaks are observed. Apart
from these the curves are flat.

29
5.2.1 Ferrocene-mediated electrodes in PBS Here, an oxidation and a reduction peak for ferrocene were expected to show in the CV as
ferrocene is a redox active compound. For the electrodes containing 1% and 2% ferrocene
however, no clear peaks except from the interfering peaks at the same position as for the
unmediated electrodes were visible in CVs. The electrodes with dissolved ferrocene showed
the same results as the ones with grinded ferrocene. Electrodes containing 5% and 10%
ferrocene show very weak peaks (see Figure 20). The positions of the peaks are approx.
0.35V and 0.45V and these should be ferrocene as they are somewhat consistent of peak
position in other work (see section 2.4.6). Another peak couple is also shown at higher
potentials and this indicates that multiple electron transfer has taken place. However,
ferrocene only undergoes one electron transfer, so it is unclear where the other peaks come
from but it could be some background signal. Much higher peak currents were also expected
for such high concentrations of ferrocene as 5 and 10wt%. The low currents indicate that the
electron transfer between the ferrocene and the carbon is not working well and an explanation
could be that the ferrocene is trapped in the ink and not available for electron transfer. The
curves did not change much with the cycles but increased a little, indicating slow electron
transport. At least three electrodes of every concentration were run and they all had similar
curve shapes.
Electrodes where the ferrocene solution was deposited on the surface of carbon electrodes
were also tried out to see if this approach could improve the function of the mediator.
However it was not possible to get defined volume at the electrode surface as it had the same
hydrophobicity as the solution. No droplet was therefore formed and most mediator run off
the electrode. Because of this, no useful results were gained from these electrodes and no new
conclusions about the mediator could be drawn.
Figure 20 CV for ferrocene-mediated electrodes in PBS. The peaks are very weak and the
currents very low.

30
5.2.2 Ferricyanide-mediated electrodes in PBS CVs of the electrodes mediated with ferricyanide shows clear oxidation and a reduction peaks
in PBS. All concentrations of mediators have the peaks, but 2.5% and 5% shows smoother
curves and more consistent behaviour. The peak currents increases with increasing
concentration of the mediator as expected. The peak current however decreased with every
potential cycle. This is probably because ferricyanide is very soluble in water and diffuses
into the electrolyte resulting in decreasing concentration at the electrode surface. Figure 21
shows CVs in PBS of electrodes mediated with different concentrations of ferricyanide.
The interfering peaks that were observed in the unmediated ink were present here as well for
most electrodes, but for the higher concentrations of mediator they are small compared with
the mediator peaks. The oxidation peak potential is approx. 0.45V and the reduction peak
potential is approx. 0.1V. This gives a peak separation of approx. 0.35V, a value that is much
larger than expected for a mediator that should have good reversibility. This large value is due
to a large overpotential, caused by slow electron transfer in the electrode. An unclean carbon
electrode probably is the reason for this. However, the ratio between peak currents for the
oxidation peaks and the reduction peaks are approx. one showing that the reaction is not
irreversible.
Several individual electrodes were measured on and they all gave similar results though the
peak current values varied. Figure 22 shows the variation in peak currents between different
electrodes at 0.45V. There can be several reasons for this variation. First, the ferricyanide
diffused from the electrode out to the solution very quickly and the time it took to place the
electrode in the buffer until the measurement started may have affected the amount of
mediator left in the electrode. Second, the stencil printing probably does not give the same
accuracy and reproducibility as the screen-printing technique as the area and thickness of the
ink was not completely homogenous with the stencil printing. So the variation between the
electrodes probably would have been smaller if they were screen-printed. Also, for the
ferricyanide-mediated electrodes, the distribution of the mediator particles in the ink would be
more even if a larger batch was made. Now only a few grams were made to prepare enough
electrodes for the tests.
Figure 21 CVs of ferricyanide-mediated electrodes in PBS containing different amounts of the
mediator. Cycle number two is plotted.
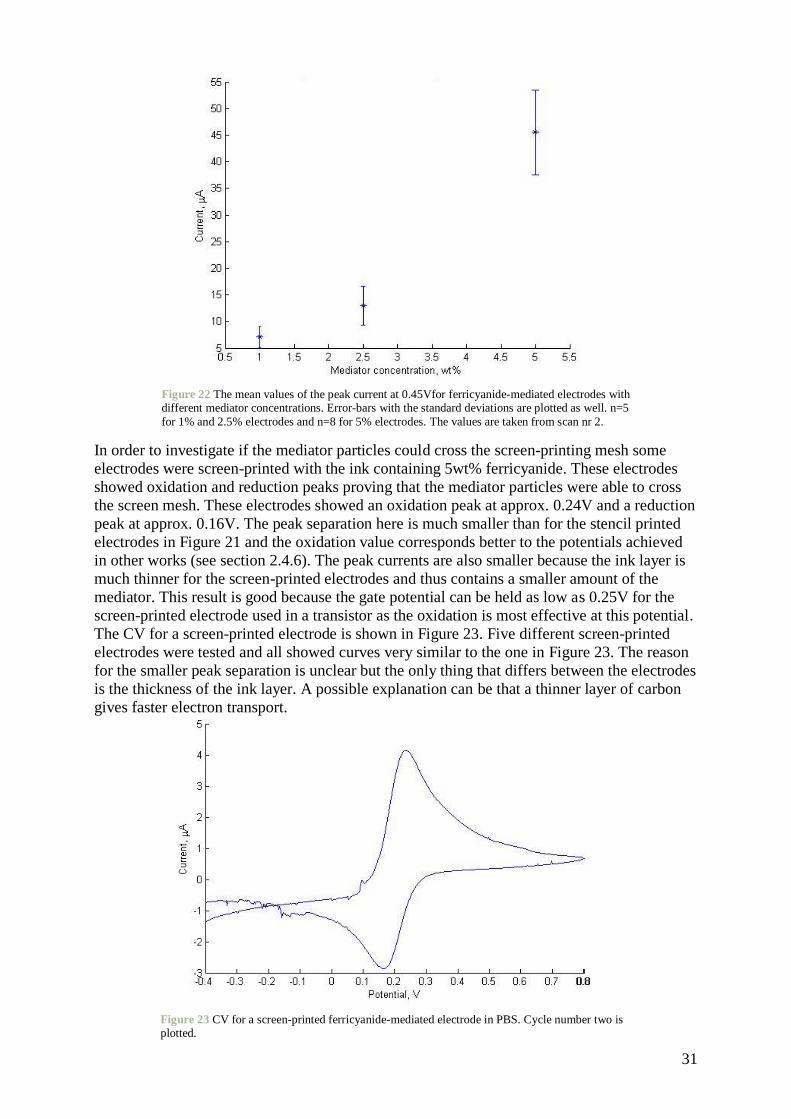
31
In order to investigate if the mediator particles could cross the screen-printing mesh some
electrodes were screen-printed with the ink containing 5wt% ferricyanide. These electrodes
showed oxidation and reduction peaks proving that the mediator particles were able to cross
the screen mesh. These electrodes showed an oxidation peak at approx. 0.24V and a reduction
peak at approx. 0.16V. The peak separation here is much smaller than for the stencil printed
electrodes in Figure 21 and the oxidation value corresponds better to the potentials achieved
in other works (see section 2.4.6). The peak currents are also smaller because the ink layer is
much thinner for the screen-printed electrodes and thus contains a smaller amount of the
mediator. This result is good because the gate potential can be held as low as 0.25V for the
screen-printed electrode used in a transistor as the oxidation is most effective at this potential.
The CV for a screen-printed electrode is shown in Figure 23. Five different screen-printed
electrodes were tested and all showed curves very similar to the one in Figure 23. The reason
for the smaller peak separation is unclear but the only thing that differs between the electrodes
is the thickness of the ink layer. A possible explanation can be that a thinner layer of carbon
gives faster electron transport.
Figure 22 The mean values of the peak current at 0.45Vfor ferricyanide-mediated electrodes with different mediator concentrations. Error-bars with the standard deviations are plotted as well. n=5
for 1% and 2.5% electrodes and n=8 for 5% electrodes. The values are taken from scan nr 2.
Figure 23 CV for a screen-printed ferricyanide-mediated electrode in PBS. Cycle number two is plotted.

32
Figure 24 CV of CoPC-mediated electrodes in PBS and H2O2.
5.2.3 CoPC- mediated electrodes in PBS and H2O2 CVs of the electrodes in PBS showed no peaks at all and the current stays well below 1µA.
This is expected because CoPC must be reduced by H2O2 before it can be oxidized. The curve
stays stabile over the cycles. When CV was run in 0.1mM H2O2 a clear oxidation peak was
shown at approx. 0.55V. There is no corresponding reduction peak because the oxidation of
H2O2 is irreversible. The peak current is decreasing a little for every new potential cycle and
this may be due to that the concentration of H2O2 at the electrode is decreasing faster than the
diffusion of new molecules to the surface. When the concentration of H2O2 was increased to
1mM the peak current also increased as can be seen in Figure 24. In 10mM H2O2 the peak
current was increased further but the peak at 0.55V disappeared and a peak at approx. 0.7V
was shown instead. The peak potential of 0.55V is higher than 0.4 that was stated at the
homepage of the ink provider (see section 3.1.1). 0.55V is almost as high as it would be if a
platinum electrode was used. The peaks however prove that the catalyst works.
Several electrodes were measured in H2O2 and the peak currents varied for every electrode.
The large variation here is probably also due to the stencil printing and the reproducibility had
probably been better if all electrodes were screen-printed as stated above in section 5.2.2.
Figure 25 shows the variation.

33
Chronoamperometry in stirred solution was run at 0.5V because the CVs show that the
oxidation of H2O2 is effective at this potential. H2O2 was added successively. The current
increased quickly when the H2O2 was added but the increase was smaller and smaller for
every addition (see Figure 26). The results show that concentrations at least as low as 0.05mM
and as least as high as 8mM can be detected with these electrodes.
As negative control, CVs of unmediated electrodes made of Dupont 7102 were run in 10mM
H2O2 from 0V to 0.8V. No peaks were shown in this CV and the currents were very low.
Figure 25 The mean values with errorbars for the currents at 0.55V. The values are obtained from CVs
cycles nr 2 of CoPC-mediated electrodes in different concentrations of H2O2. For no H2O2, n=3 and for 0.1mM and 1.0mM H2O2 n=5.
Figure 26 CA for CoPC mediated electrode in stirred solution with successive additions of 0.1M H2O2 to 10ml PBS, indicated by the arrows. First addition was 5µl, the following seven was 10µl and the last
eight 100µl. This gives concentrations of 0.05, 0.15, 0.25, 0.35, 0.45, 0.55, 0.65, 0.74, 1.7, 2.7, 3.6, 4.5,
5.4, 6.3, 7.2 and 8.0 mM H2O2.

34
5.3 Characterization of electrodes with immobilized enzyme CVs of unmediated electrodes made of DuPont 7102 containing 5µl GOx/BSA/GA solution
showed high interfering peaks around 0.1V and -0.1V but no other peaks in PBS or in 20mM
glucose. Three electrodes were first run in PBS and then in glucose. This shows that the
enzyme solution itself or the glucose does not generate any oxidation or reduction peaks (see
Figure 27). As for the unmediated electrodes without any enzyme, the peaks vary in
amplitude and were sometimes not present at all. If they were, they stayed at the same
positions.
5.3.1 Ferrocene-mediated electrodes with 10µl GOx/BSA/GA solution Despite the poor results from the electrodes run in PBS, electrodes containing 10wt%
ferrocene with enzyme was prepared to see if the response would be different in the presence
of glucose. Three electrodes with enzyme was run first in PBS then in glucose and one was
run directly in glucose. However no difference could be seen between the measurements in
PBS and the measurements in glucose, so nothing can be said about the function of the
mediator. The current was increasing a little with every cycle but did not reach any high
values. Figure 28 shows the CVs. An expected result would have been an increase of the
oxidation peak currents in presence of glucose.
Figure 27 CV for unmediated electrodes with immobilized enzyme in PBS and 20mM glucose as
negative control. Though the interferences are high no other peaks are shown.

35
5.3.2 Ferricyanide-mediated electrodes with 10µl GOx/BSA/GA solution 10µl of the enzyme solution was added to these electrodes in order to cover the whole
electrode surface in hope of limit the diffusion of the mediator out in the solution. The
electrodes tested contained 5wt% ferricyanide. Despite this the peak currents decreased with
every cycle for CVs in PBS. The same electrodes were then run in 20mM glucose. The peak
currents now increased with every cycle instead. However the current values in glucose did
not exceed the values reached in PBS. It is therefore unclear whether the electrodes can sense
glucose or not. An expected result would be an increase of the anodic peak current in the
presence of the analyte, but the diffusion of the mediator makes it impossible to compare two
measurements for the same electrode and they are not reproducible enough for comparisons
among different electrodes.
Figure 29 CVs for ferricyanide-mediated electrodes with GOx/BSA/GA in PBS and 20mM glucose. Cycle
number seven is plotted for three individual electrodes.
Figure 28 CVs of ferrocene-mediated electrodes with GOx/BSA/GA in PBS and glucose. Cycle number
five is plotted for four different electrodes.

36
5.3.3 CoPC-mediated electrodes with 5µl GOx/BSA/GA solution CVs of the electrodes in PBS had no peaks as expected and this shows that the electrodes give
no response in absence of the analyte glucose.
CVs of the same electrodes in 20mM glucose showed increasing currents above 0.4V. Though
the clear peaks shown for the H2O2 response are absent, the CVs in glucose clearly show
responses different from the ones in PBS. This indicates that the electrodes can sense the
H2O2 created in the reaction between GOx and glucose and that the enzyme is working well.
As negative control, electrodes without any enzyme were run in 20mM glucose and these
gave no response as excepted. The curves did not change much over the cycles. The CVs are
shown in Figure 30. Three individual electrodes were measured and they all showed very
similar responses as seen in the figure. One electrode that was not tested in PBS first was run
in glucose direct but it showed no different response from the other three.
CA at 0.55V in stirred solution also shows a small but clear increase of the current after
addition of glucose, see Figure 31. The increase was not as fast as for the H2O2 response,
probably because the reaction between GOx and glucose takes some time. The CA shows that
glucose concentrations as low as 1mM can be sensed with the electrodes. However the
increase in current is very small for concentrations above 10mM. Two additional CA
measurements were made and these showed no increase in the current for the additions giving
glucose concentrations above 10mM. This can be due to saturation of the enzyme or low
oxygen levels in the sample. Comparing this graph with the CA for H2O2 addition (Figure 26)
the firs additions, very approximately reaches the same current level. From this it can be
concluded that 1mM H2O2 approximately corresponds to 20mM glucose.
Figure 30 CVs for CoPC-mediated electrodes with GOx/BSA/GA in PBS and 20mM glucose. Electrodes without any enzyme in 20mM glucose are also showed as a negative control. Scan number two is plotted.
Measurements from three individual electrodes (four for electrodes with enzyme in glucose) are shown.

37
5.4 Transistor fabrication The transistors were printed with good results. The adhesive however was hard to print
because it clogged the mesh after a while.
The antistatic treatment on the polyfoil made the substrate hydrophilic enough for water or
PBS to flow into the flow channels via capillary forces. Though the carbon gate was quite
hydrophobic it did not stop the flow. The flow channel systems were tested for the two
adhesives and the heat curable showed best results as it allowed flow in the channels which
had adhesive on one side (the long channels). However, long exposure to liquid tended to
dissolve the adhesive and should be avoided. Ozone treatment for five minutes was tried to
change the hydrophobicity of the UV-curable adhesive, but this took away all the adhesive
properties. The heat-curable adhesive was therefore chosen. With a different design on the
flow channel however, the UV-curable adhesive could be an alternative.
The results of the printing show that a working flow system can be made with screen-printing
technique.
5.5 Transistor measurements Model C and D had more problems with leakage than model A and B (see Figure 16 and
Figure 18). Also the analyte tended to flow better and faster in the narrower flow channels of
A and B. The problem with the leaking in model C and D can easily be solved by changing
the screen-printing pattern so that the adhesive pattern on the gate matches the adhesive
pattern on the channel resulting in no flow over the adhesive. The reason this was not done is
lack of space to make one gate for every channel. Instead we were now able to combine all
gate sizes with all channel sizes.
Figure 31 Chronoamperometry in stirred solution with additions of 1M glucose to 10ml PBS
indicated by the arrows. First addition was 10µl, the second 15µl, the third 25µl and the last three
50µl. This gives concentrations of 1, 2.5, 5, 10, 15 and 20mM glucose. Applied voltage was
0.55V.

38
5.5.1 CoPC-mediated gate electrodes Output characteristics of the different transistor models are shown in Figure 32 and Figure 33
below. They are measured with PBS as the electrolyte.
These curves shows that the devices behave like transistors and the results are consistent with
that of other work. When the gate voltage is increased, the source-drain current is decreasing
as expected. The cut-off gate voltage is not reached. The ratio between the current at Vg=0
and the current at Vg=1.25 for Vd=-1V is largest for model C and A according to these curves,
see Table 8. This was expected as these models have larger gate areas compared with channel
areas than model B and D (see section 3.2.3).
Model: A B C D
On-off ratio: 6.4 3.9 6.1 5.2
Table 8 Current ratio between highest and lowest applied Vg at Vd=-1V for the different transistor models.
Figure 32 IV-curve for transistor model A and B with CoPC-mediated gates. PBS acts as electrolyte.
Figure 33 IV-curve for transistor model C and D with CoPC-mediated gates. PBS acts as electrolyte.

39
The figures below show time vs. drain current for the different transistor models with PBS
and 1mM H2O2 as analyte respectively. Vg was set to 0.55V and Vd to -0.2V. The
concentration of 1mM H2O2 was chosen because it gave the clearest response in the CV
measurements. Unmediated transistors with gates of DuPont 7102 were testes as negative
controls.
Figure 34 Transistors model A with CoPC-mediated gates. Measurements done with PBS
and H2O2 respectively as analyte.
Figure 35 Transistors model B with CoPC-mediated gates. Measurements done
with PBS and H2O2 respectively as analyte.

40
For all models the current is lower for the measurements with H2O2 as expected. The current
measured is negative and therefore decreases in current looks like increases in the figures. The
currents are much higher here than for the potentiostat measurements. Also, model A and B
shows larger current values than model C and D. Table 9 shows the drain current response
after 60s for the different models of transistors and compares the results for PBS and H2O2.
The same calculation was made for the response after 40s with almost identical results for the
relative response and not much difference in standard deviation (std).
Figure 37 Transistors model C with CoPC-mediated gates. Measurements done with
PBS and H2O2 respectively as analyte.
Figure 36 Transistors model D with CoPC-mediated gates. Measurements done with PBS and H2O2 respectively as analyte.

41
Model Measurement IDS mean
(µA)
Standard
deviation
(Std/IDS
mean)*100
(%)
Relative response
(MeanPBS/MeanH2O2)
Number
of
samples
A In PBS
In 1mM H2O2
-268
-182
11.4
7.76
4.25
4.26
1.47
3
3
B In PBS
In 1mM H2O2
-422
-309
13.7
10.7
3.25
3.46
1.36
3
4
C In PBS
In 1mM H2O2
-33.9
-16.5
1.77
3.48
5.22
21.1
2.05
3
4
D In PBS
In 1mM H2O2
-10.3
-4.90
0.34
0.28
3.30
5.71
2.11
3
3
Table 9 Current responses at 60s for transistors with CoPC-mediated gate electrodes.
Here, it is clear that model A and B have higher currents than C and D. However, the relative
response for model C and D is better than model A and B, and D has the very best. Looking at
the graphs, the current also stabilizes quicker for model C and D than A and B, for which a
steady state never is reached. These results show that a model with a long transistor channel
gives the best response and that the geometry of the transistor does matter for the response.
This was not expected as the opposite has been stated in other work (se section 2.5.3). There
is not much difference in relative response between A and B or between C and D, indicating
that relationship between gate and channel size did not matter much in this case, but further
investigation with more extreme relationships and more measurements are needed to be
certain. Compared with the potentiostat measurements, the consistency of the measurements
for different devices are good with small standard deviations. The standard deviations in
relationship to the currents do not differ much between the four models, except from model C
that has the worst. However, to be able to draw a more correct conclusion about the
reproducibility more devices needs to me measured. It is necessary to have good
reproducibility for a disposable device that cannot be calibrated.
As a negative control, transistors with unmediated gates were tested for PBS and 1mM H2O2
(see Figure 38). The results from the unmediated sensors are not as consistent as for the
CoPC-mediated. No clear difference can be seen between measurements in PBS and
measurements in H2O2. This shows that the PEDOT:PSS in the channel itself cannot sense
H2O2.
Figure 38 Transistors model A-D with unmediated gate electrodes in PBS and 1mM H2O2 respectively. Two or three of each model were tested.

42
5.5.2 Ferricyanide-mediated gate electrodes with 5µl GOx Because the sample volume in the transistor is so small the problem with diffusion that
occurred at the potentiostat measurements should not be a problem here. Therefore, a few
transistors with ferricyanide-mediated ink were prepared to see if detection of glucose was
possible. Model A and B were chosen because these models had no problems with leaking
flow channels. The deposition of the enzyme solution onto the gate electrodes was somewhat
difficult as the gate was so small that the enzyme in some cases flowed away out to the flow
channel. This resulted in not equal amount of enzyme on all electrodes. Also, the screen-prints
for some of the gate electrodes of model B were not perfect resulting in inconsistent sizes of
the electrodes. However, measurements were made anyway to see if the results could give an
indication of the functionality of the transistor. Current response for PBS was compared with
current response for 20mM glucose, see Figure 39. When the analyte was applied you could
see that the enzyme was dissolved quickly.
Though the results are not as consistant as for the CoPC-mediated electrodes, they indicate
that the mediator work and that the transistor can sense glucose. However, more negative
controls and measurements where the amount of enzyme is more concistent are needed to be
sure.
Figure 39 Measurements for transistors with ferricyanide-mediated electrodes with GOx on the surface. Model A is to the left and model B to the right.

43
Conclusion 6To conclude, the results show that it is possible to make a biosensor based on an OECT with
screen-printing technique, including a flow system for the sample. Though more measurement
and characterization needs to be done, the method is promising. The transistor measurements
performed shows that the OECT works as a sensor for H2O2, and probably also for glucose.
The results from the H2O2 measurements indicate good reproducibility, though the sensitivity
needs to be further investigated. Different transistor models were tried out and models with a
long channel gave the best relative response. This shows that optimisation of the geometry is
important for the function of the sensor.
Comparing the mediators tested here, the best results were gained with the CoPC-mediated
ink from Gwent Electronic materials Ltd. These electrodes and device were easy to
characterize because they could be evaluated for H2O2 response first. The electrodes also
proved to be able to sense glucose with glucose oxidase and the transistors device with CoPC
electrodes could sense hydrogen peroxide. The drawback was the high working potential and
possible O2 dependence. The results for the ferricyanide-mediated electrodes are promising,
but more measurements in smaller sample volumes are needed and so are more transistor
measurements. If such measurements should be successful, ferricyanide electrodes would be
preferable to CoPC electrodes as the working potential could be much lower, 0.25V instead of
0.55V, hence approving the selectivity of the sensor. The drawback of ferricyanide was its
solvability that made the potentiostat measurements difficult. No good results were achieved
for the ferrocene-mediated electrodes and it is unclear why. Further investigation is needed to
sort that out.
The possibilities for variation of the sensor are many with this fabrication technique and the
electrodes can be made relatively cheap with the mediator approach. By changing the enzyme
and or mediator, sensors for different analytes can be produces with the same technique. The
mediator approach also enables relatively cheap material costs. However, the poor results for
the ferrocene-mediated electrodes show that not all mediators are appropriate for bulk
modification of ink. By applying the enzyme with ink-jet printing an all-printed sensor can be
achieved.

44
Further perspectives 7Further investigation of the printed OECT-sensor is needed to conclude if it has potential to
be developed into a commercial device or not.
7.1 Further characterization and considerations regarding the gate electrodes
In order to come up with a good gate electrode the following variables should be optimized:
Amount of mediator in the ink. Too high concentration of the mediator may cause an
increase in background current [32], but it should be high enough not to be the
limiting factor for detection. By measuring the detection limits for the analyte with
various amounts of mediator this can be achieved.
Amount of enzyme on the electrode surface. As for the mediator, the amount of
enzyme should not be the limiting factor for the detection. By measuring the detection
limits for the analyte with various amounts of enzyme this can be achieved.
It is important to decide what detection ranges that are wanted and this depends on the
application of the sensor.
The selectivity of the electrode must be investigated. The selectivity tells how specific the
sensor is for the analyte and how well it can discriminate it from other, similar compounds.
Response to other compounds gives a false signal. Bad selectivity could be improved by
coating the enzyme with a selective membrane, like Nafion [40]. An alternative is to try to
find a mediator with even lower working potential that will not oxidize interfering
compounds.
7.2 Further characterization of the transistor as a sensor The geometry of the transistor must be optimized to improve the sensitivity, as it is clear from
the results that the geometry can have a large impact on relative response and current levels.
Investigation is also needed of the following properties:
Sensitivity: The sensitivity (often nA/µM) of the device must be investigated further
and this has to be done with the transistor measurements and not potentiostat
measurements of the electrodes. The sensitivity investigated amperometrically with
the potentiostat may not be the same with the transistor as transducer. Because the
transistor work as an amplifier as well the sensitivity can be much higher compared
with traditional amperometric measuring [52].
Reproducibility: A very important property for a disposable sensor.
Stability: How well do it respond if conditions like pH and temperature are varied? For how long can it be stored?
Linearity of the response: Which concentrations of the analyte give a linear response?
Also, the optimal gate potential should be evaluated for the transistor measurements as well
and not only for potentiostat measurements with a reference electrode.
7.3 Measurements For ferricyanide, the diffusion of the mediator into the solution makes it very difficult to
compare measurements as the same electrode can’t be used twice and the diffusion starts as
soon the electrode comes in contact with the electrolyte. If a very small sample volume could
be used, the diffusion would not be a problem as the mediator would still be close to the
surface. An alternative way to make potentiostat measurements would be to print Ag/AgCl

45
reference electrodes close to the working electrode and just add a small droplet of sample
covering the two electrodes. In the transistor the sample volume is very small (<3µl) and the
diffusion should not be a problem.
With this approach the electrodes could also be tested without BSA/GA immobilisation of the
enzyme, an advantage which enables better comparison between potentiostat measurements
and transistor measurements.
7.4 Ink Different carbon inks can perform differently and it is not certain that DuPont 7102 is the
best. Wang et al. [59] have compared screen-printed electrodes made from carbon inks for
from different manufacturers. Their electrochemical behaviour and electroanalytical
performances have been investigated by analysing background currents, potential windows
and activity of some redox systems, among these ferrocyanide. The results show that there are
considerable differences between the carbon inks. If mediated inks should be prepared by
mixing the mediator into a commercial carbon ink, the choice of ink should be taken into
consideration.
There are also commercial inks that already contain a mediator, as the CoPC-mediated ink
from Gwent Electronic Materials used in this work. Some other mediated inks from Gwent
are listed in table below [56].
Mediator Product Detection Approx. working
potential vs. Ag/AgCl
CoPC C2030408P3 H2O2 +0.4V
Prussian Blue C2070424D2 H2O2 0V
Meldola’s blue C2030519P5 NADH +0.05V
Potassium ferrocyanide C2070508D4 H2O2 in combination with
peroxidase
Negative potentials
Table 10 Commercial mediated carbon inks from Gwent Electronic materials.
Potassium ferricyanide powder with particle sizes <10µm are available at Sigma-Aldrich and
by using this product the prepatarion of the ferricyanide mediated ink would have been
simpler because the grinding and sieving steps would be unnecessary. However this product
was not available when ferricyanide was ordered for this project.
7.5 Deposition of the enzyme One way to better deposit the enzyme on the electrode surface would be to use inkjet printing.
This would enable higher throughput and better precision than with a pipette. This has been
done by Wang et al. [17] with promising results ad described earlier (se section 2.2.2).
An alternative is to mix the enzyme into the carbon ink and screen-print it as well, which
would reduce the fabrication steps even further. A water based ink with curing temperature
below 40oC would be to prefer in that case to avoid loss of enzyme activity, as stated in
section 2.3.4.

46
References 8
[1] Clark Jr. LC, Lyons C. Electrode systems for continuous monitoring in cardiovascular
surgery. Ann N Y Acad Sci 1962;102:29-45.
[2] Eggins B. Biosensors: An Introduction. New York: B.G. Teubner and John Wiley & Sons
Ltd; 1996.
[3] Mohanty SP, Koucianos E. Biosensors: A tutorial review. IEEE Potentials 2006;25(2):35-
40.
[4] Nilsson D, Kugler T, Svensson P-, Berggren M. An all-organic sensor-transistor based on
a novel electrochemical transducer concept printed electrochemical sensors on paper. Sens
Actuators, B Chem 2002;86(2-3):193-197.
[5] Lin P, Yan F. Organic thin-film transistors for chemical and biological sensing. Adv Mater
2012;24(1):34-51.
[6] Gerard M, Chaubey A, Malhotra BD. Application of conducting polymers to biosensors.
Biosensors and Bioelectronics 2002;17(5):345-359.
[7] Zirkl M, Sawatdee A, Helbig U, Krause M, Scheipl G, Kraker E, et al. An all-printed
ferroelectric active matrix sensor network based on only five functional materials forming a
touchless control interface. Adv Mater 2011;23(18):2069-2074.
[8] Nikolou M, Malliaras GG. Applications of poly (3,4-ethylenedioxythiophene) doped with
poly(styrene sulfonic acid) transistors in chemical and biological sensors. Chem Rec
2008;8(1):13-22.
[9] Bankar SB, Bule MV, Singhal RS, Ananthanarayan L. Glucose oxidase - An overview.
Biotechnol Adv 2009;27(4):489-501.
[10] Gründler P. Chemical sensors: an introduction for scientists and engineers. New York:
Springer; 2007.
[11] Chaubey A, Malhotra BD. Mediated biosensors. Biosens Bioelectron 2002;17(6-7):441-
456.
[12] Kipphan H. Handbook of printed media: technologies and production methods. New
York: Springer; 2001.
[13] Materials for Printed Elctronics Technical Information: DuPont Microcircuit Materials.
2011; Available at:
http://www2.dupont.com/MCM/en_US/tech_info/products/printed_electronics.html#pwb.
Accessed 03/20, 2012.
[14] Gonzalez-Macia L, Morrin A, Smyth MR, Killard AJ. Advanced printing and deposition
methodologies for the fabrication of biosensors and biodevices. Analyst 2010;135(5):845-867.

47
[15] O'Halloran MP, Pravda M, Guilbault GG. Prussian Blue bulk modified screen-printed
electrodes for H2O2 detection and for biosensors. Talanta 2001;55(3):605-611.
[16] Basiric L, Cosseddu P, Scidà A, Fraboni B, Malliaras GG, Bonfiglio A. Electrical
characteristics of ink-jet printed, all-polymer electrochemical transistors. Org Electron : phys
mater appl 2012;13(2):244-248.
[17] Fabrication of a glucose biosensor by piezoelectric inkjet printing. Proceedings - 2009
3rd International Conference on Sensor Technologies and Applications, SENSORCOMM
2009; 2009.
[18] Gorton L, Csoregi E, Dominguez E, Emneus J, Jonsson-Pettersson G, Marko-Varga G, et
al. Selective detection in flow analysis based on the combination of immobolized enzymes
and chemically modified electrodes. Anal Chim Acta 1991;250(1):203-248.
[19] Wilson R, Turner APF. Glucose oxidase: An ideal enzyme. Biosensors and
Bioelectronics 1992;7(3):165-185.
[20] Heller A, Feldman B. Electrochemical glucose sensors and their applications in diabetes
management. Chem Rev 2008;108(7):2482-2505.
[21] Du T, Liu B, Hou X, Zhang B, Du C. Covalent immobilization of glucose oxidase onto
Poly(St-GMA-NaSS) monodisperse microspheres via BSA as spacer arm. Appl Surf Sci
2009;255(18):7937-7941.
[22] Zhu Z-, Mabeck JT, Zhu C, Cady NC, Batt CA, Malliaras GG. A simple poly(3,4-
ethylene dioxythiophene)/poly(styrene sulfonic acid) transistor for glucose sensing at neutral
pH. Chem Commun 2004;10(13):1556-1557.
[23] Crouch E, Cowell DC, Hoskins S, Pittson RW, Hart JP. A novel, disposable, screen-
printed amperometric biosensor for glucose in serum fabricated using a water-based carbon
ink. Biosens Bioelectron 2005;21(5):712-718.
[24] Newman JD, Turner APF. Home blood glucose biosensors: A commercial perspective.
Biosens Bioelectron 2005;20(12):2435-2453.
[25] Mersal GAM, Khodari M, Bilitewski U. Optimisation of the composition of a screen-
printed acrylate polymer enzyme layer with respect to an improved selectivity and stability of
enzyme electrodes. Biosens Bioelectron 2004;20(2):305-314.
[26] Wang J. Electrochemical glucose biosensors. Chem Rev 2008;108(2):814-825.
[27] Cicoira F, Sessolo M, Yaghmazadeh O, Defranco JA, Yang SY, Malliaras GC. Influence
of device geometry on sensor characteristics of planar Organic electrochemical transistors.
Adv Mater 2010;22(9):1012-1016.
[28] McNaught AD, Wilkinson A. Compendium of chemical terminology : IUPAC
recommendations. 2nd ed. Oxford: Blackwell Science; 1997.

48
[29] Nakabayashi Y, Wakuda M, Imai H. Amperometric Glucose Sensors Fabricated by
Electrochemical Polymerization of Phenols on Carbon Paste Electrodes Containing Ferrocene
as an Electron Transfer Mediator. Analytical Sciences 1998;14(6):1069-1076.
[30] Yaghoubian H, Karimi-Maleh H, Khalilzadeh MA, Karimi F. Electrocatalytic oxidation
of levodopa at a ferrocene modified carbon nanotube paste electrode. International Journal of
Electrochemical Science 2009;4(7):993-1003.
[31] Wang J, Mo J-, Li S, Porter J. Comparison of oxygen-rich and mediator-based glucose-
oxidase carbon-paste electrodes. Anal Chim Acta 2001;441(2):183-189.
[32] Miao Y, Chia LS, Goh NK, Tan SN. Amperometric glucose biosensor based on
immobilization of glucose oxidase in chitosan matrix cross-linked with glutaraldehyde.
Electroanalysis 2001;13(4):347-349.
[33] Guo Y, Guadalupe AR. Screen-printable surfactant-induced sol-gel graphite composites
for electrochemical sensors. Sens Actuators, B Chem 1998;B46(3):213-219.
[34] Zou C-, Zhou M, Xie G-, Luo P, Xiong X-, Xu H-, et al. Preparation of disposable saliva
α-amylase biosensor. Fenxi Huaxue Chin J Anal Chem 2008;36(9):1217-1220.
[35] Lee S-, Fang H-, Chen W-. Amperometric glucose biosensor based on screen-printed
carbon electrodes mediated with hexacyanoferrate-chitosan oligomers mixture. Sens
Actuators, B Chem 2006;117(1):236-243.
[36] Dzyadevich SV, Arkhipova VN, Soldatkin AP, El'Skaya AV, Shul'Ga AA. Glucose
conductometric biosensor with potassium hexacyanoferrate(III) as an oxidizing agent. Anal
Chim Acta 1998;374(1):11-18.
[37] Ge F, Zhang X-, Zhang Z-, Zhang X-. Potassium ferricyanide mediated disposable
biosensor for determination of maltose and glucose. Anal Lett 1998;31(3):383-394.
[38] Wang J, Zhang X. Screen printed cupric-hexacyanoferrate modified carbon enzyme
electrode for single-use glucose measurements. Anal Lett 1999;32(9):1739-1749.
[39] Crouch E, Cowell DC, Hoskins S, Pittson RW, Hart JP. Amperometric, screen-printed,
glucose biosensor for analysis of human plasma samples using a biocomposite water-based
carbon ink incorporating glucose oxidase. Anal Biochem 2005;347(1):17-23.
[40] Shimomura T, Sumiya T, Ono M, Ito T, Hanaoka T-. Amperometric l-lactate biosensor
based on screen-printed carbon electrode containing cobalt phthalocyanine, coated with
lactate oxidase-mesoporous silica conjugate layer. Anal Chim Acta 2012;714:114-120.
[41] Pravda M, O'Halloran MP, Kreuzer MP, Guilbault GG. Composite glucose biosensor
based on screen-printed electrodes bulk modified with Prussian Blue and glucose oxidase.
Anal Lett 2002;35(6):959-970.
[42] Ricci F, Palleschi G. Sensor and biosensor preparation, optimisation and applications of
Prussian Blue modified electrodes. Biosens Bioelectron 2005;21(3):389-407.

49
[43] Turkusic E, Kalcher J, Kahrovic E, Beyene NW, Moderegger H, Sofic E, et al.
Amperometric determination of bonded glucose with an MnO2 and glucose oxidase bulk-
modified screen-printed electrode using flow-injection analysis. Talanta 2005;65(2 SPEC.
ISS.):559-564.
[44] Bird J. Electrical and Electronic Principles and Technology. 3rd ed. Burlington: Elsevier;
2007.
[45] Kergoat L, Piro B, Berggren M, Horowitz G, Pham M-. Advances in organic transistor-
based biosensors: from organic electrochemical transistors to electrolyte-gated organic field-
effect transistors. Analytical and Bioanalytical Chemistry 2011:1-14.
[46] Bernards DA, MacAya DJ, Nikolou M, Defranco JA, Takamatsu S, Malliaras GG.
Enzymatic sensing with organic electrochemical transistors. J Mater Chem 2008;18(1):116-
120.
[47] David Nilsson. An organic electrochemical transistor for printed sensors and logic.
Norrköping: Organic Electronics, Dept. of Science and Technology, Linköping Univ.; 2005.
[48] Yaghmazadeh O, Cicoira F, Bernards DA, Yang SY, Bonnassieux Y, Malliaras GG.
Optimization of organic electrochemical transistors for sensor applications. J Polym Sci Part
B 2011;49(1):34-39.
[49] Bernards DA, Malliaras GG. Steady-state and transient behavior of organic
electrochemical transistors. Advanced Functional Materials 2007;17(17):3538-3544.
[50] Yang SY, DeFranco JA, Sylvester YA, Gobert TJ, Macaya DJ, Owens RM, et al.
Integration of a surface-directed microfluidic system with an organic electrochemical
transistor array for multi-analyte biosensors. Lab Chip Miniaturisation Chem Biol
2009;9(5):704-708.
[51] Macaya DJ, Nikolou M, Takamatsu S, Mabeck JT, Owens RM, Malliaras GG. Simple
glucose sensors with micromolar sensitivity based on organic electrochemical transistors.
Sens Actuators, B Chem 2007;123(1):374-378.
[52] Tang H, Yan F, Lin P, Xu J, Chan HLW. Highly sensitive glucose biosensors based on
organic electrochemical transistors using platinum gate electrodes modified with enzyme and
nanomaterials. Adv Funct Mater 2011;21(12):2264-2272.
[53] Tang H, Lin P, Chan HLW, Yan F. Highly sensitive dopamine biosensors based on
organic electrochemical transistors. Biosens Bioelectron 2011;26(11):4559-4563.
[54] Shim NY, Bernards DA, Macaya DJ, DeFranco JA, Nikolou M, Owens RM, et al. All-
plastic electrochemical transistor for glucose sensing using a ferrocene mediator. Sensors
2009;9(12):9896-9902.
[55] Electrochemical transistors with ionic liquids for enzymatic sensing. Organic
Semiconductors in Sensors and Bioelectronics IV; 24 August 2011 through 25 August 2011;
2011.

50
[56] Gwent Electronic Materials Ltd, Carbon Working Electrode Materials. 2012; Available
at: http://www.gwent.org/gem_carbon_working.html. Accessed 05/21, 2012.
[57] Tripathi G. Enzyme Biotechnology. Jaipur, IND: Global Media; 2009.
[58] Wang J. Analytical electrochemistry. 3. ed. ed. Hoboken, N.J.: Wiley; 2006.
[59] Wang J, Tian B, Nascimento VB, Angnes L. Performance of screen-printed carbon
electrodes fabricated from different carbon inks. Electrochim Acta 1998;43(23):3459-3465.

i
Appendix A The pattern used to print the sensor (not according to scale). Here the layers are colour coded.
All sizes of the gates and channels are listed in the table below.
1:Silver (grey), 2:PEDOT:PSS (blue), 3:Carbon (black), 4:Mediated carbon (green),
5:Adhesive (orange transparent). One frame was made for every layer.

ii
Channel sizes
(length* x width),
mm
Gate
sizes, mm
Flow channel
width, mm
Wide
channels
1x4
1x16
1x24
1x2
1x4
1x8
1
Long
channels
4x1
16x1
24x1
2x1
2x2
2x4
2
16x1 2x2 “circular”
*length: between source and drain