Embed Size (px)
Citation preview

A preliminary study on the identification of the sources of nitrate contamination in groundwater in Malta
Results and interpretation
Groundwater Resources Programme
Commissioned Report CR/08/094


BRITISH GEOLOGICAL SURVEY
GROUNDWATER RESOURCES PROGRAMME
Commissioned Report CR/08/094
A preliminary study on the identification of the sources of nitrate contamination in groundwater in Malta.
Results and interpretation
M E Stuart, T H E Heaton, L Maurice, P J Chilton and P J Williams
Keywords
Report; nitrate; groundwater; nitrogen stable isotopes; Malta.
Front cover
Collecting groundwater and sewage samples and making on-site measurements on Malta
Bibliographical reference
STUART, M E, HEATON, T H E, MAURICE L, CHILTON, P J AND
WILLIAMS P J . 2008. A preliminary study on the identification of the sources of nitrate contamination in groundwater in Malta Results and interpretation. British Geological Survey Commissioned Report, CR/08/094. 4pp.
Copyright in materials derived from the British Geological Survey’s work is owned by the Natural Environment Research Council (NERC) and/or the authority that commissioned the work. You may not copy or adapt this publication without first obtaining permission. Contact the BGS Intellectual Property Rights Section, British Geological Survey, Keyworth, e-mail [email protected]. You may quote extracts of a reasonable length without prior permission, provided a full acknowledgement is given of the source of the extract.
© NERC 2008. All rights reserved
Keyworth, Nottingham British Geological Survey 2008

The full range of our publications is available from BGS shops at Nottingham, Edinburgh, London and Cardiff (Welsh publications only) see contact details below or shop online at www.geologyshop.com
The London Information Office also maintains a reference collection of BGS publications including maps for consultation.
The Survey publishes an annual catalogue of its maps and other publications; this catalogue is available from any of the BGS Sales Desks.
The British Geological Survey carries out the geological survey of Great Britain and Northern Ireland (the latter as an agency service for the government of Northern Ireland), and of the surrounding continental shelf, as well as its basic research projects. It also undertakes programmes of British technical aid in geology in developing countries as arranged by the Department for International Development and other agencies.
The British Geological Survey is a component body of the Natural Environment Research Council.
British Geological Survey offices
BGS Central Enquiries Desk
� 0115 936 3143 Fax 0115 936 3276 email [email protected]
Kingsley Dunham Centre, Keyworth, Nottingham NG12 5GG
� 0115 936 3241 Fax 0115 936 3488 email [email protected]
Murchison House, West Mains Road, Edinburgh EH9 3LA
� 0131 667 1000 Fax 0131 668 2683 email [email protected]
London Information Office at the Natural History Mus eum (Earth Galleries), Exhibition Road, South Kensington, London SW7 2DE
� 020 7589 4090 Fax 020 7584 8270 � 020 7942 5344/45 email [email protected]
Columbus House, Greenmeadow Springs, Tongwynlais, Cardiff CF15 7NE
� 029 2052 1962 Fax 029 2052 1963
Forde House, Park Five Business Centre, Harrier Way, Sowton EX2 7HU
� 01392 445271 Fax 01392 445371
Maclean Building, Crowmarsh Gifford, Wallingford OX10 8BB
� 01491 838800 Fax 01491 692345
Geological Survey of Northern Ireland, Colby House, Stranmillis Court, Belfast BT9 5BF
� 028 9038 8462 Fax 028 9038 8461 www.bgs.ac.uk/gsni/
Parent Body
Natural Environment Research Council, Polaris House, North Star Avenue, Swindon SN2 1EU
� 01793 411500 Fax 01793 411501 www.nerc.ac.uk
Website www.bgs.ac.uk Shop online at www.geologyshop.com
BRITISH GEOLOGICAL SURVEY
CR/08/094
v
Foreword
This report is the second product of a study by the British Geological Survey (BGS) into the sources of nitrate in the groundwater of the Islands of Malta. It describes the collection and analysis of groundwater and nitrogen source-term samples and a detailed interpretation of the results. The study was funded by the Technical Assistance Programme under the Rural Development Programme for Malta 2004-2006. The start-up meeting was in December 2007 and the project was completed in March 2009.
Acknowledgements
The authors are grateful to their project counterparts in the Malta Resources Authority, Manuel Sapiano and Miriam Micallef Sultana, without whose effort none of this would have been possible. The authors are also grateful to the following technical staff for their advice, provision of information and assistance and facilitation of sample collection.
Water Services Corporation
Groundwater sampling - Diandra Caruana, Hilary Borg, Michael Galea, Josianne Callus, Joseph Saliba, Francis Xavier Rapinett, Noel Gauci, Silvio Debono,
Wastewater sampling – Sigmund Galea, Vince Vassallo
Organisation of field laboratory – John Micallef
Organisation of analyses – Paula Grech Bonnichi
Ministry for Rural Affairs and the Environment, Agr icultural Services and Rural Development Division
Supply of archive soil samples – Tony Meli Sampling of animal wastes – Noel Azzopardi, Joseph Abela, Marlon Apap
Agricultural Cooperative
Supply of fertilizer samples– Clement Azzopardi
Private borehole sampling
Raymond Mifsud
In addition to the authors, the following BGS staff members have contributed to this phase of the project:
BGS Wallingford laboratories
Dan Lapworth – laboratory analysis and fluorescence data interpretation
Daren Gooddy – groundwater tracers analysis and interpretation
Sally Bourliakas, Debbie Allen, Sarah Hannay – laboratory analysis
Chris Milne – laboratory management
BGS Keyworth laboratories
Jenny Cook – laboratory management
NERC Isotope Geoscience laboratory
Jo Green, Carol Arrowsmith – laboratory analysis
CR/08/094
vi
Contents
Foreword iv
Acknowledgements iv
Contents iv
Executive summary iv
1 Introduction 4 1.1 Background 4
1.2 Project objectives 4
1.3 Scope of report 4
2 Methodology 4 2.1 Wellhead activities 4
2.2 Sewage and animal wastes 4
3 Laboratory analysis 4
4 Sample collection and landuse classification 4 4.1 Groundwater, surface water and wastewater 4
4.2 Animal wastes, soils and synthetic fertilizers 4
5 Discussion of isotope results for groundwater nitrate 4 5.1 General pattern for groundwater nitrate 4
5.2 15N/14N ratios of different nitrogen sources 4
5.3 18O/16O ratios of different nitrate sources 4
5.4 Conclusions from nitrate isotopes 4
6 Evolution of groundwater quality 4 6.1 Carbonate dissolution 4
6.2 The impact of saline intrusion 4
6.3 Conclusions on background water quality 4
7 Potential sources of groundwater nitrate 4 7.1 Evidence from inorganic chemistry 4
7.2 Evidence from organic indicators 4
7.3 Evidence from microbiology 4
7.4 Multi-indicator approach 4
7.5 Evidence from historical trends 4
7.6 Evidence for denitrification 4
7.7 Conclusions on nitrate relationship with landuse from co-contaminants 4
8 Conceptual models of Maltese aquifers 4 8.1 Features of limestone island aquifers 4
8.2 Timescales of groundwater movement 4
8.3 Existing information on aquifer properties 4
8.4 conceptual models of groundwater flow 4
CR/08/094
vii
9 Conclusions and technical recommendations 4 9.1 Conclusions 4
9.2 Possible further investigations 4
References 4
Appendix 1 Analytical data 4
Appendix 2 Landuse in wellhead vicinity for selected sites 4
Appendix 3 Maps of distribution of key indicators 4
Appendix 4 Nitrate crossplots 4
Appendix 5 Fluorescence plots 4
Appendix 6 Statistical summary plots for groundwater nitrate time-series data 4
TABLES
Table 2.1 On-site measurements......................................................................................... 4
Table 2.2 Summary of groundwater sample collection methods ........................................ 4
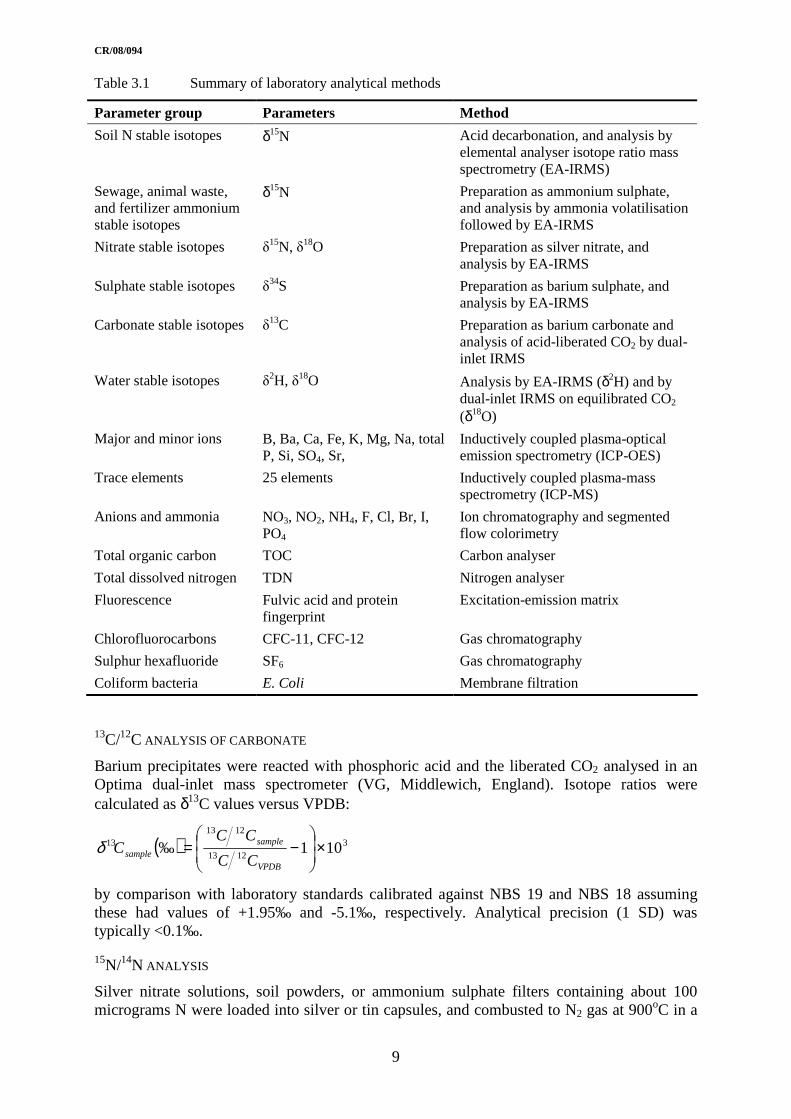
Table 3.1 Summary of laboratory analytical methods......................................................... 4
Table 4.1 Groundwater and surface water sample description............................................4
Table 4.2 Detailed landuse for 100 m radius of wellhead for selected sites ....................... 4
Table 4.3 Wastewater sample descriptions.......................................................................... 4
Table 4.4 Animal waste sample descriptions ...................................................................... 4
Table 4.5 Soil sample details ............................................................................................... 4
Table 4.6 Fertilizer sample details....................................................................................... 4
Table 5.1 Summary of δ15N data ......................................................................................... 4
Table 5.2 Summary of likely importance of potential sources of groundwater nitrate from nitrogen isotopes.................................................................................................. 4
Table 6.1 Summary of median δ13C values per landuse class ............................................. 4
Table 6.2 Seawater composition for selected solutes for 3.8% salinity (after Turekian, 1968).................................................................................................................... 4
Table 6.3 Estimated seawater content of groundwater from chloride concentrations......... 4
Table 6.4 Summary of median δ34S values per landuse class ............................................. 4
Table 7.1 Summary of median inorganic nitrogen species and phosphorus concentrations in groundwater per landuse class (mg/l).............................................................. 4
Table 7.2 Enhancement of major ion concentrations (median for landuse classes) in groundwater in the perched aquifers ...................................................................4
Table 7.3 Summary of median trace element concentrations in sewage and animal wastes (µg/l) .................................................................................................................... 4
Table 7.4 Summary of median trace element concentrations in groundwater in the perched aquifer per landuse class (µg/l)............................................................................ 4
CR/08/094
viii
Table 7.5 Summary of median trace element concentrations in groundwater in the Malta MSL aquifer per landuse class (µg/l) ..................................................................4
Table 7.6 Summary of average trace element concentrations in groundwater in the Gozo MSL aquifer per landuse class (µg/l) ..................................................................4
Table 7.7 Summary of median fluorescence measurements in groundwater per landuse class ..................................................................................................................... 4
Table 7.8 Summary of median organic carbon and nitrogen concentrations per landuse class (mg/l) .......................................................................................................... 4
Table 7.9 Decrease in agricultural and garrigue land area since 1956 (ha) (Meli, 1993) ... 4
Table 7.10 Changes in nitrate-N concentrations from 1991 to present study ....................... 4
Table 7.11 Statistical summary of nitrate-N monitoring data for selected sites.................... 4
Table 7.12 Summary of co-contaminant and nitrate concentration ranges ........................... 4
Table 8.1 Summary of groundwater regimes in the Maltese aquifers ................................. 4
FIGURES
Figure 1.1 Flowchart of project activities. Numbered activities refer to tasks in Annex 2, Section 4 of the project ToR................................................................................ 4
Figure 2.1 Informal manure pile in a field corner (probably from rabbits or goats) close to the headworks of Zahra borehole ........................................................................ 4
Figure 2.2 Recording data from on-site analysis at Fiddien borehole .................................. 4
Figure 2.3 Pressure-filtering bulk sample into a jerry can at the Medina Road borehole..... 4
Figure 2.4 Passing samples from the upper reservoirs through ion-exchange resin cartridges to concentrate nitrogen species at the field laboratory set up at Ta Kandja Pumping Station...................................................................................... 4
Figure 2.5 Collecting a sample from Marsa Sewage Works................................................. 4
Figure 4.1 Map of groundwater and surface water sampling sites (sample numbers from Table 4.1)............................................................................................................. 4
Figure 4.2 Assessment of landuse within 100 m of wellhead for Hemsija and >>>>.......... 4
Figure 4.3 Map of wastewater sample sites .......................................................................... 4
Figure 4.4 Map of animal waste sample sites ....................................................................... 4
Figure 4.5 Map of soil sample sites ...................................................................................... 4
Figure 5.1 Crossplot of nitrate δ18O versus δ15N for groundwater samples ......................... 4
Figure 5.2 Graphical summary of δ15N in groundwater under various landuses, soil and potential source terms.......................................................................................... 4
Figure 5.3 Summary of δ15Nand δ18O in nitrate in groundwater and various potential nitrate sources ...................................................................................................... 4
Figure 6.1 Piper diagram of majors ions in groundwater and seawater................................ 4
Figure 6.2 Crossplots of HCO3, Ca, Mg and Li against δ13C ............................................... 4

CR/08/094
ix
Figure 6.3 Distribution of δ13C values with geological setting............................................. 4
Figure 6.4 Crossplots of selected major ions against chloride (green line is the average seawater ratio; blue line is the average ratio in springs observed by BRGM, 1991).................................................................................................................... 4
Figure 6.5 Crossplot of δ34S against non sea salt sulphate in groundwater estimated from chloride concentrations........................................................................................ 4
Figure 6.6 Distribution of δ34S values with geological setting ............................................. 4
Figure 7.1 Crossplots of selected parameters against nitrate-N............................................ 4
Figure 7.2 Crossplots of selected organic indicators against dissolved organic carbon. (key as Figure 7.1) ....................................................................................................... 4
Figure 7.3 Crossplots of nitrate and various pollution indicators against sulphate, both axes divided by chloride (key as Figure 7.1)...............................................................4
Figure 7.4 Crossplots of various residence time indicators against sulphate, both axes divided by chloride (key as Figure 7.1)...............................................................4
Figure 7.5 Selected nitrate trends in the perched aquifers (from BRGM, 1991 and present study) ................................................................................................................... 4
Figure 7.6 Nitrate-N time series data from sites in the Malta MSL aquifer (data from present study in red) ............................................................................................ 4
Figure 7.7 Nitrate-N time series data from sites in the Gozo MSL aquifer (data from present study in red) ............................................................................................ 4
Figure 7.8 Modern water fractions using CFC-11 and CFC-12 ........................................... 4
Figure 8.1 Estimation of groundwater age and flow mechanism using a lumped model of SF6 and CFC-12 concentrations for Malta and Gozo.......................................... 4
Figure 8.2 Idealised representation of groundwater flow in the saturated zone of an unconfined aquifer of constant thickness (H) showing groundwater age distributions for purely advective transport to a point of z depth. Solid lines connect points of equal age; broken line indicates groundwater flow path......... 4
Figure 8.3 δ2H vs δ18O for waters in Malta .......................................................................... 4
Figure 8.4 Conceptual model of groundwater movement in perched aquifers on Malta...... 4
Figure 8.5 Conceptual model of groundwater movement in the Malta MSL aquifer........... 4
Figure 8.6 Conceptual model of groundwater movement in the Gozo MSL aquifer ........... 4
Figure 8.7 Proportional symbol plot for nitrate-N concentrations overlaid on geology....... 4
Figure 8.8 Proportional symbol plot for chloride concentrations overlaid on geology ........ 4
Figure 8.9 Proportional symbol plot for E. Coli concentrations overlaid on geology.......... 4
Figure 8.10 Proportional symbol plot for molybdenum concentrations overlaid on geology 4
Figure 8.11 Groundwater movement and nitrogen processes in the Malta MSL aquifers ..... 4

CR/08/094
x
Executive summary
PROJECT OBJECTIVES AND SCOPE OF REPORT
This report comprises the output from Workpackages 2 and 3 of the project ‘A preliminary study on the identification of the sources of nitrate contamination in groundwater in Malta’. It sets out the methodology used for sample collection for groundwater and potential source terms provides a summary of the analytical procedures used and tabulates all the analytical results. An interpretation of these data is made in the context of conceptual models of the aquifers and the implications for sources of nitrate.
The main aim of the study is to identify the activities which are responsible for the high concentrations of nitrate currently found in the groundwaters of Malta and to evaluate the relative contribution of each activity. Successful identification of these polluting activities would allow the regulatory agencies of Malta to design targeted Programmes of Measures to control the most polluting activities. This would have the aim of improving the chemical status of groundwater with respect to nitrate and help Malta to meet the requirements of relevant European Directives
PRESENT NITRATE CONCENTRATIONS IN GROUNDWATER AND T RENDS
Fifty groundwater samples were collected representing the main sea level (MSL) aquifers on Malta and Gozo and the more important of the perched aquifers on Malta. Locations were selected to represent distinct landuse types (urban, agricultural and areas irrigated with treated sewage effluent (TSE)) and proximity to point sources (sewer galleries, cesspits, cattle and pig farms). Landuse classifications were provided by the Malta Resources Authority. Samples were analysed for nitrogen species and a wide range of indicators and potential co-contaminants: major and minor ions; trace elements; total organic carbon; stable isotopes of nitrate, carbonate, sulphate and water; fluorescence; faecal coliforms and residence time tracers.
In the perched aquifers, the high nitrate concentrations were confirmed, with a median of 164 mg/l (37 mg/l as N) and a wide range of values. The majority of the supplies are no longer used due to poor water quality. In the MSL aquifers, concentrations are more moderate and more consistent ranging from 10 mg/l to 159 mg/l (2.3 to 36 mg/l as N) with a median value of 62 mg/l (14 mg/l as N) in the Malta aquifer and from 24 mg/l to 106 mg/l (5.4 mg/l to 24 mg/l as N) with a median value of 44 mg/l (10 mg/l as N) in Gozo. Nitrate concentrations have risen significantly in the perched aquifers over the last 10-20 years. In the MSL aquifers groundwater nitrate appears to have been stable over the last 30-40 years.
NITRATE ISOTOPE STUDY
Nitrate δ15N and δ18O values reflect the original sources of nitrogen and oxygen as modified by any subsequent chemical transformation. All but two of the groundwater samples had δ15N values in the range +7.2 to +13.2‰, and δ
18O values in the range +2.8 to +6.4 with groundwaters from the three aquifers not distinguished. These similarities suggest that the source/s of nitrate is the same in all three, and that differences in nitrate concentrations may reflect different hydrology.
The δ15N and δ18O values of potential nitrate sources are based on measured values for nitrate in fertilizers, and on calculated values for nitrate derived from nitrification of the source N. The values of nitrate for Maltese synthetic fertilizers are similar to the global range. If the application of fertilizer is immediately followed by heavy rainfall, it can comprise a direct
CR/08/094
xi
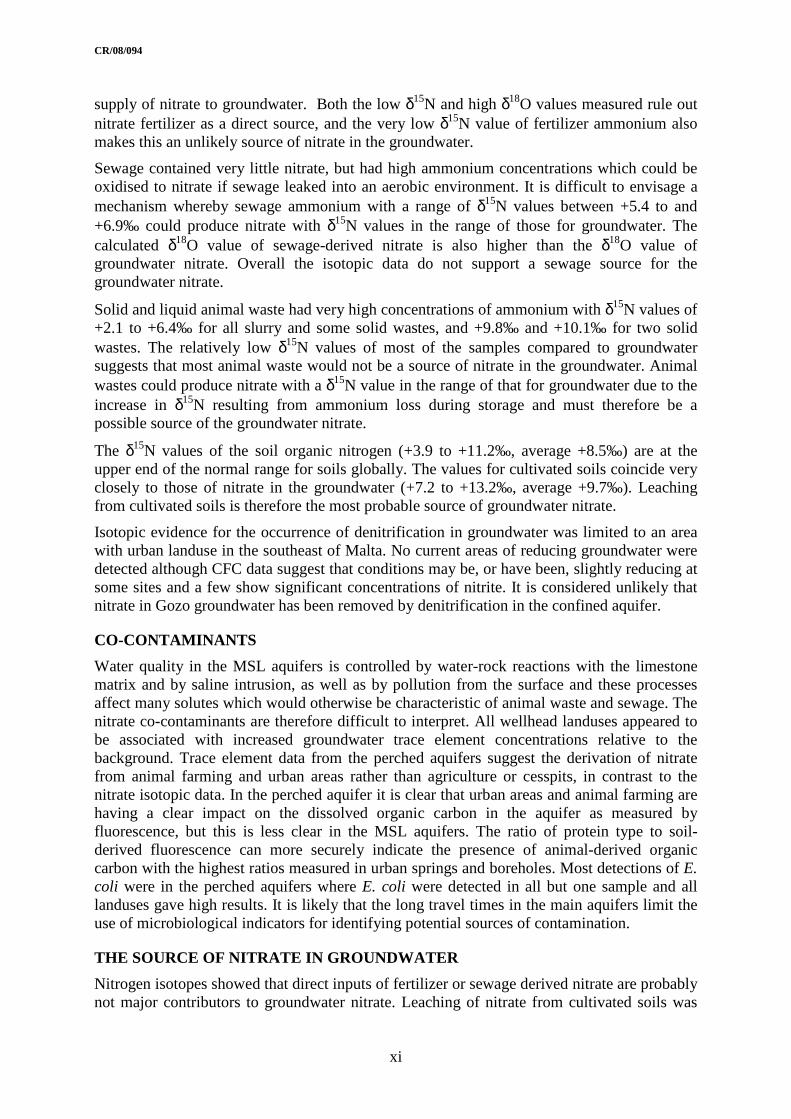
supply of nitrate to groundwater. Both the low δ15N and high δ18O values measured rule out nitrate fertilizer as a direct source, and the very low δ15N value of fertilizer ammonium also makes this an unlikely source of nitrate in the groundwater.
Sewage contained very little nitrate, but had high ammonium concentrations which could be oxidised to nitrate if sewage leaked into an aerobic environment. It is difficult to envisage a mechanism whereby sewage ammonium with a range of δ15N values between +5.4 to and +6.9‰ could produce nitrate with δ15N values in the range of those for groundwater. The calculated δ18O value of sewage-derived nitrate is also higher than the δ18O value of groundwater nitrate. Overall the isotopic data do not support a sewage source for the groundwater nitrate.
Solid and liquid animal waste had very high concentrations of ammonium with δ15N values of +2.1 to +6.4‰ for all slurry and some solid wastes, and +9.8‰ and +10.1‰ for two solid wastes. The relatively low δ15N values of most of the samples compared to groundwater suggests that most animal waste would not be a source of nitrate in the groundwater. Animal wastes could produce nitrate with a δ15N value in the range of that for groundwater due to the increase in δ15N resulting from ammonium loss during storage and must therefore be a possible source of the groundwater nitrate.
The δ15N values of the soil organic nitrogen (+3.9 to +11.2‰, average +8.5‰) are at the upper end of the normal range for soils globally. The values for cultivated soils coincide very closely to those of nitrate in the groundwater (+7.2 to +13.2‰, average +9.7‰). Leaching from cultivated soils is therefore the most probable source of groundwater nitrate.
Isotopic evidence for the occurrence of denitrification in groundwater was limited to an area with urban landuse in the southeast of Malta. No current areas of reducing groundwater were detected although CFC data suggest that conditions may be, or have been, slightly reducing at some sites and a few show significant concentrations of nitrite. It is considered unlikely that nitrate in Gozo groundwater has been removed by denitrification in the confined aquifer.
CO-CONTAMINANTS
Water quality in the MSL aquifers is controlled by water-rock reactions with the limestone matrix and by saline intrusion, as well as by pollution from the surface and these processes affect many solutes which would otherwise be characteristic of animal waste and sewage. The nitrate co-contaminants are therefore difficult to interpret. All wellhead landuses appeared to be associated with increased groundwater trace element concentrations relative to the background. Trace element data from the perched aquifers suggest the derivation of nitrate from animal farming and urban areas rather than agriculture or cesspits, in contrast to the nitrate isotopic data. In the perched aquifer it is clear that urban areas and animal farming are having a clear impact on the dissolved organic carbon in the aquifer as measured by fluorescence, but this is less clear in the MSL aquifers. The ratio of protein type to soil-derived fluorescence can more securely indicate the presence of animal-derived organic carbon with the highest ratios measured in urban springs and boreholes. Most detections of E. coli were in the perched aquifers where E. coli were detected in all but one sample and all landuses gave high results. It is likely that the long travel times in the main aquifers limit the use of microbiological indicators for identifying potential sources of contamination.
THE SOURCE OF NITRATE IN GROUNDWATER
Nitrogen isotopes showed that direct inputs of fertilizer or sewage derived nitrate are probably not major contributors to groundwater nitrate. Leaching of nitrate from cultivated soils was

CR/08/094
xii
likely to be the most important source, though derivation from animal wastes cannot be discounted. The isotope data do not rule out inorganic fertilizers and/or animal wastes as the original source of the nitrogen. The data are compatible with a process whereby nitrogen from inorganic fertilizers and/or animal wastes is assimilated into the soil organic nitrogen pool, and takes on the isotopic composition of this pool during the cycling of nitrogen attendant on cultivation, before nitrification and leaching to the underlying groundwater. Data from co-contaminants are equivocal with limited relationship between current landuse and groundwater quality.
A key finding of the study has been the confirmation of the long saturated zone residence times in the MSL aquifers. This has important implications for any relationship between present-day activities and groundwater concentrations. The lack of widespread rapid pathways from the surface to the water table as deduced from microbiological evidence suggest that a major part of infiltration may occur by relatively slow flow through the aquifer matrix. The travel time for nitrate from the surface to an abstraction point could be several decades at some sites. The nitrate stored in aquifer porewaters will act as a secondary source for a long period even if surface applications were to cease completely. If disposal and management of solid animal wastes were to be targeted as the most important source of nitrate contamination it is unlikely that significant improvements would be seen for several years or even decades.
CR/08/094
1
1 Introduction
1.1 BACKGROUND
The island of Malta has already been comprehensively studied over a long period from the perspective of its limited water resources (Tricker, 1977, Mangion and Sapiano, 2005). The scale of high groundwater nitrate concentrations is already well defined, and Malta has been described by the European Environment Agency as having the most widespread groundwater nitrate problem among the EU member states (EU, 2002).
Generally, it is difficult to relate nitrate found in groundwater directly to any one of the possible sources of nitrate - agriculture, industry, sewered or unsewered sanitation. Experience suggests that this is even harder to do in island states where the pressures associated with the high population density and limitations on land availability produce a complex land-use pattern in which sources of nitrate are invariably mixed together.
Stable isotope techniques have been a valuable tool in hydrochemical research for over 30 years, and have been widely used in studies of the source, fate and behaviour of anthropogenically-derived contaminants, of which nitrate is probably the most important. 15N/14N measurements, in partnership with other chemical data, can provide information on both the sources of nitrate contamination, and the processes involved in transformations (notably denitrification). Other stable isotopes can also be applied to the identification of sources of pollution.
1.2 PROJECT OBJECTIVES
The overall objective of the project was to provide the Malta Resources Authority (MRA) with the scientific basis to underpin policies and action programmes to address nitrate pollution of groundwater. Within this context, the main aim of the study is to identify the activities which are responsible for the high concentrations of nitrate currently found in the groundwaters of Malta and to evaluate the relative contribution of each activity. The dominant role of these activities may be due either to their widespread distribution in Malta as diffuse pollution sources or to high concentrations of nitrogen present in the local recharge associated with point sources.
Successful identification of these polluting activities would allow the regulatory agencies of Malta to design targeted Programmes of Measures to control the most important activities. This would have the aim of improving the chemical status of groundwater with respect to nitrate and enable Malta to meet the requirements of the Water Framework Directive, the Groundwater Directive and the Nitrates Directive.
1.3 SCOPE OF REPORT
This report comprises the output from Workpackage 2 and part of Workpackage 3 of the project (Figure 1.1). It includes:
• methodology for sample collection for groundwater and potential source terms;
• summary of analytical procedures used;
• analytical results;
• interpretation of data;
• conceptual models of the aquifers;
• recommendations for possible further technical work;

CR/08/094
2
• implications for control measures.
Data review – literature1 (i)
Groundwater monitoring for nitrate isotopes, isotopic indicators, co-contaminants and inorganic parameters 2(ii) & (iv)
Waste stream characterisation 2 (i)
Development of monitoring strategy 1 (iii)
Identification and classification of polluting activities 1 (ii)
Data review – MRA data 1 (ii)
Agreement of formal planwith MRA 1 (iii)
Identification of potential co -contaminants
Evaluation of potential isotopic indicators 2 (iii)
Raw data and preliminary conclusions
Data interpretation
Identification of nitrate sources and interpretive methodology 3 (ii)
WP1 Report
WP2 Report
WP3 Report
Public information seminar 3 (iii)
Conclusions and recommendations to MRA
Final Report
Workpackage 1
Workpackage 2
Workpackage 3
Figure 1.1 Flowchart of project activities. Numbered activities refer to tasks in Annex 2, Section 4 of the project ToR

CR/08/094
3
2 Methodology
The sampling strategy and list of sites and waste stream samples agreed with the MRA is set out in Section 7 of the WP1 report (Stuart et al., 2008).
2.1 WELLHEAD ACTIVITIES
2.1.1 Checklist
On arrival at boreholes and pumping stations the first activity was to check that the pump was working. If not, a period was allowed for the borehole to be flushed before starting to collect samples.
Arrangements were made with the Water Services Corporation to shut off the chlorine disinfection supply to individual boreholes about three hours before the sampling visit and, if necessary, to augment chlorine in other supplies within the same part of the distribution system. Residual chlorine was tested before sampling and, in most cases, the chlorine was switched back on at the conclusion of the visit.
2.1.2 Landuse visual inspection
A quick visual inspection was made for obvious local point sources and photographs of the headworks and the surrounding landuse made (Figure 2.1).
Figure 2.1 Informal manure pile in a field corner (probably from rabbits or goats) close to the headworks of Zahra borehole

CR/08/094
4
2.1.3 On-site analysis
A number of unstable parameters relevant to the redox status of the water, temperature and alkalinity were measured at the time of sample collection (Table 2.1).
Table 2.1 On-site measurements
Parameter Method
pH Combination pH electrode in flow-through cell
Redox potential (Eh) Platinum redox electrode in flow-through cell
Dissolved oxygen (DO) Membrane in flow-through cell
Specific electrical conductance (SEC) Platinum conductivity electrode
Temperature Digital thermometer
Alkalinity Duplicate titrations using Hach digital titrator with 1.6 N sulphuric acid and bromocresol green indicator
Figure 2.2 Recording data from on-site analysis at Fiddien borehole
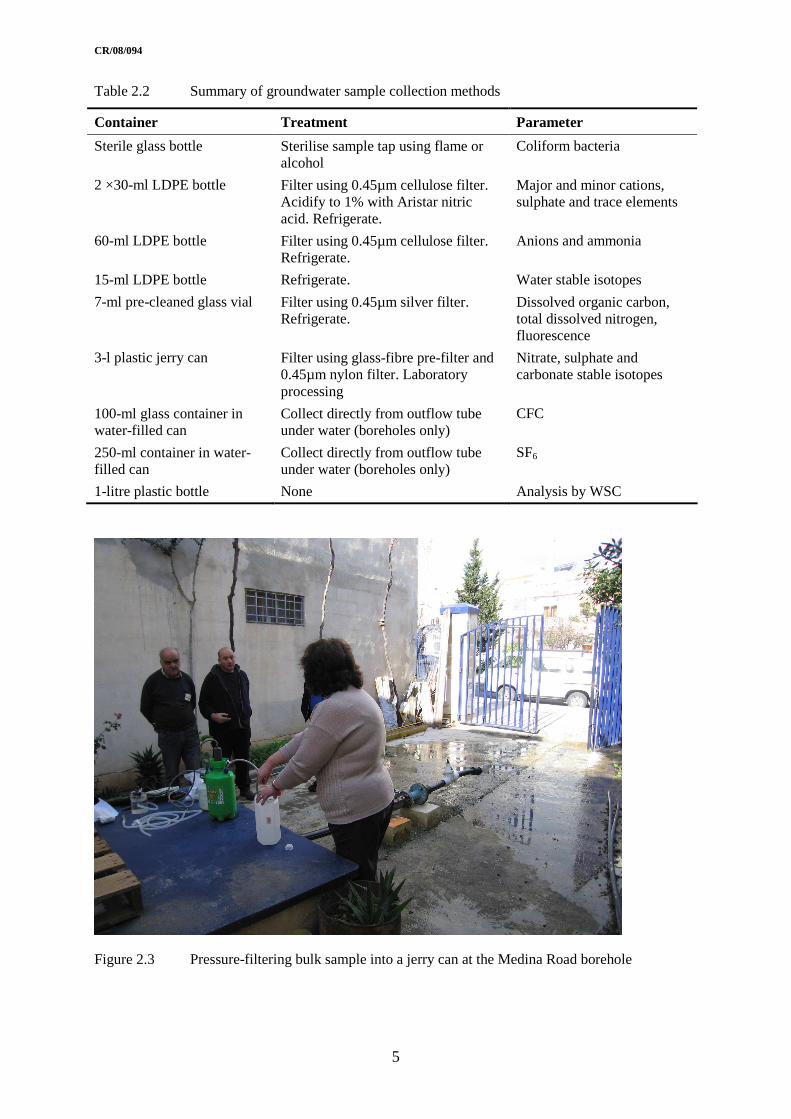
2.1.4 Sample collection
A series of samples were collected for the range of parameters required (Table 2.2). A large-volume sample was filtered into a jerry can and processed in the field laboratory for stable isotopes. The field laboratory was established in a room provided by the Water Services Corporation at Ta Kandja Pumping station. This was equipped with power, running water and sink, distilled water, a refrigerator and freezer and a large table, working area. This also had out-of-hours access for project staff and proved to be an ideal base for project work.
CR/08/094
5
Table 2.2 Summary of groundwater sample collection methods
Container Treatment Parameter
Sterile glass bottle Sterilise sample tap using flame or alcohol
Coliform bacteria
2 ×30-ml LDPE bottle Filter using 0.45µm cellulose filter. Acidify to 1% with Aristar nitric acid. Refrigerate.
Major and minor cations, sulphate and trace elements
60-ml LDPE bottle Filter using 0.45µm cellulose filter. Refrigerate.
Anions and ammonia
15-ml LDPE bottle Refrigerate. Water stable isotopes
7-ml pre-cleaned glass vial Filter using 0.45µm silver filter. Refrigerate.
Dissolved organic carbon, total dissolved nitrogen, fluorescence
3-l plastic jerry can Filter using glass-fibre pre-filter and 0.45µm nylon filter. Laboratory processing
Nitrate, sulphate and carbonate stable isotopes
100-ml glass container in water-filled can
Collect directly from outflow tube under water (boreholes only)
CFC
250-ml container in water-filled can
Collect directly from outflow tube under water (boreholes only)
SF6
1-litre plastic bottle None Analysis by WSC
Figure 2.3 Pressure-filtering bulk sample into a jerry can at the Medina Road borehole

CR/08/094
6
2.1.5 Groundwater sample processing for stable isotopes
Samples for nitrate stable isotopes were collected using ion-exchange resins (Chang et al., 1999; Heaton et al., 2004). An approximate estimate of the nitrogen and chloride content was made to ensure that a suitable quantity of nitrogen was collected on the resin and that the resin capacity was not overloaded with chloride. Nitrate was estimated from a Hach colorimetric test and chloride directly from the conductivity using the relationship determined from existing data (Phase 1 report).
Sample was placed in the top reservoir and a siphon system adjusted to aim to pass a suitable volume of sample to give 2 mg of nitrogen adsorbed on the resin (Figure 2.4). The flow rate was adjusted to allow the sample to drip slowly through the resin and the eluate was collected and measured to check that a suitable volume had been passed. The eluate was tested for absence of nitrate with a colorimetric test strip. The resins were stored under refrigeration until they were transported to the UK
Carbonate and sulphate from a 200-ml aliquot were precipitated using 15 mL alkaline 1 M barium chloride and allowed to settle overnight. The barium precipitates were filtered off under pressure on 0.45 µm nylon membranes and these stored in the refrigerator until transport to the UK.
Figure 2.4 Passing samples from the upper reservoirs through ion-exchange resin cartridges to concentrate nitrogen species at the field laboratory set up at Ta Kandja Pumping Station
CR/08/094
7
2.2 SEWAGE AND ANIMAL W ASTES
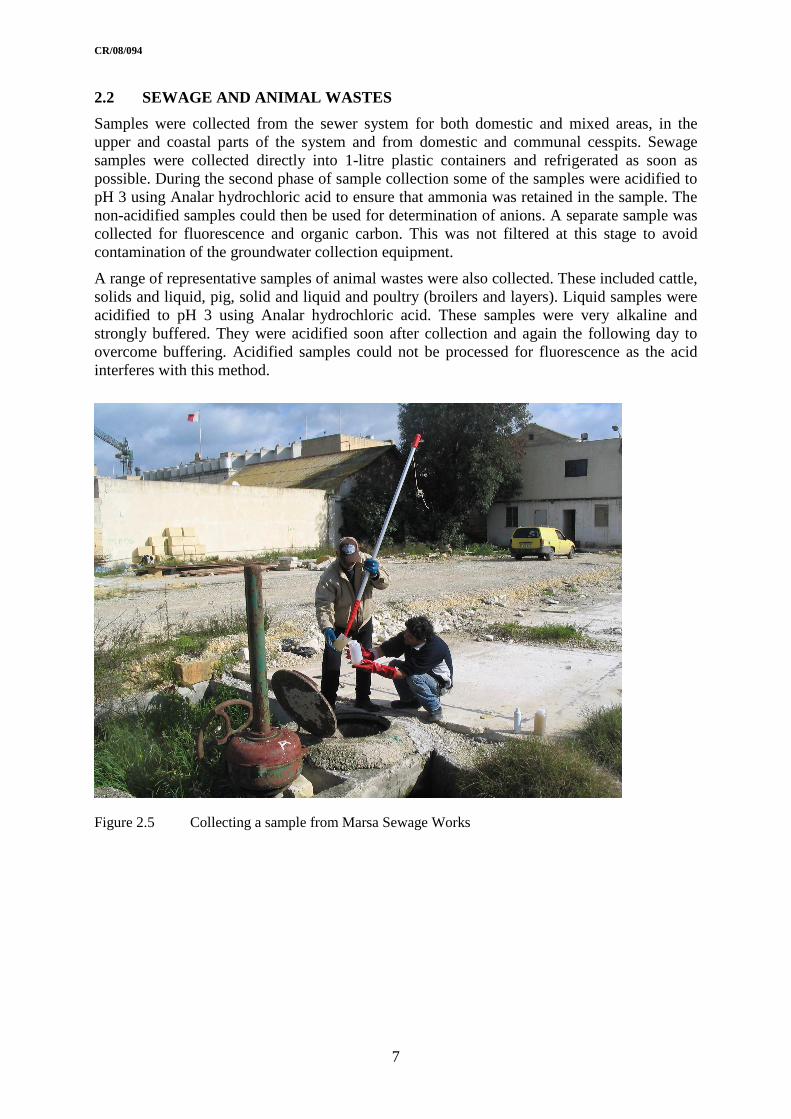
Samples were collected from the sewer system for both domestic and mixed areas, in the upper and coastal parts of the system and from domestic and communal cesspits. Sewage samples were collected directly into 1-litre plastic containers and refrigerated as soon as possible. During the second phase of sample collection some of the samples were acidified to pH 3 using Analar hydrochloric acid to ensure that ammonia was retained in the sample. The non-acidified samples could then be used for determination of anions. A separate sample was collected for fluorescence and organic carbon. This was not filtered at this stage to avoid contamination of the groundwater collection equipment.
A range of representative samples of animal wastes were also collected. These included cattle, solids and liquid, pig, solid and liquid and poultry (broilers and layers). Liquid samples were acidified to pH 3 using Analar hydrochloric acid. These samples were very alkaline and strongly buffered. They were acidified soon after collection and again the following day to overcome buffering. Acidified samples could not be processed for fluorescence as the acid interferes with this method.
Figure 2.5 Collecting a sample from Marsa Sewage Works

CR/08/094
8
3 Laboratory analysis
3.1.1 Preparation of samples for isotope analysis
WATER NITRATE RESINS
Anion resins containing nitrate were eluted with hydrobromic acid and processed to silver nitrate (Chang et al., 1999; Heaton et al., 2004).
SOILS
Soil samples were reacted with 5% hydrochloric acid for 20 hours, rinsed free of chloride with de-ionised water, dried at 50oC, ground to a powder, and homogenised. Weight %C and weight %N were determined by Elemental Analyser against an acetanilide standard.
ANIMAL WASTES
Liquid wastes were filtered to 2 µm. Solid wastes were slurried with a known weight of water on a shaker table for 4 hours, centrifuged, and the supernatant liquid to 2 µm.
Following HACH colorimetric analysis of ammonium concentrations, sufficient solution to contain about 1 mg NH4-N was made alkaline by addition of magnesium oxide, placed in a sealed container, and the resulting ammonia quantitatively collected on an acidified quartz filter paper for 15N/14N analysis.
FERTILIZERS
One gram of fertilizer was mixed with 20 mL de-ionised water on a shaker table for 4 hours, and the solution filtered to 0.45 µm. Fertilizer ammonium was converted to ammonium sulphate using the same method as for animal waste ammonium (above). Fertilizer nitrate concentration was determined by HACH colorimetric analysis, and sufficient solution to contain about 1 mg NO3-N was passed through anion exchange resin and converted to silver nitrate using the same method as for water nitrate (above).
BARIUM PRECIPITATES
Membrane filters containing barium precipitates were oven dried, the precipitate weighed, and divided into two portions. One portion was used, without further treatment, for 13C/12C analysis of barium carbonate (representing the total dissolved inorganic carbon of the water). The second portion was reacted with 2% hydrochloric acid for 20 hours, rinsed free of chloride with de-ionised water, dried, and used for 34S/32S analysis of barium sulphate.
3.1.2 Isotope analysis
2H/1H ANALYSIS
Microlitre samples of water were converted into H2 gas in the chromium furnace of a EuroPyrOH EA (Eurovector, Milan, Italy) on-line to an Isoprime mass spectrometer (GV Instruments, Manchester, England). Isotope ratios were calculated as δ2H values versus VSMOW:
( ) 312
122 101‰ ×
−=
VSMOW
samplesample
HH
HHHδ
by comparison with laboratory standard waters calibrated against VSMOW and SLAP, assuming these had values of 0‰ and -248‰, respectively. Analytical precision (1 SD) was typically <1‰.
CR/08/094
9
Table 3.1 Summary of laboratory analytical methods
Parameter group Parameters Method
Soil N stable isotopes δ15N Acid decarbonation, and analysis by elemental analyser isotope ratio mass spectrometry (EA-IRMS)
Sewage, animal waste, and fertilizer ammonium stable isotopes
δ15N Preparation as ammonium sulphate, and analysis by ammonia volatilisation followed by EA-IRMS
Nitrate stable isotopes δ15N, δ18O Preparation as silver nitrate, and
analysis by EA-IRMS
Sulphate stable isotopes δ34S Preparation as barium sulphate, and analysis by EA-IRMS
Carbonate stable isotopes δ13C Preparation as barium carbonate and analysis of acid-liberated CO2 by dual-inlet IRMS
Water stable isotopes δ2H, δ18O Analysis by EA-IRMS (δ2H) and by
dual-inlet IRMS on equilibrated CO2 (δ18O)
Major and minor ions B, Ba, Ca, Fe, K, Mg, Na, total P, Si, SO4, Sr,
Inductively coupled plasma-optical emission spectrometry (ICP-OES)
Trace elements 25 elements Inductively coupled plasma-mass spectrometry (ICP-MS)
Anions and ammonia NO3, NO2, NH4, F, Cl, Br, I, PO4
Ion chromatography and segmented flow colorimetry
Total organic carbon TOC Carbon analyser
Total dissolved nitrogen TDN Nitrogen analyser
Fluorescence Fulvic acid and protein fingerprint
Excitation-emission matrix
Chlorofluorocarbons CFC-11, CFC-12 Gas chromatography
Sulphur hexafluoride SF6 Gas chromatography
Coliform bacteria E. Coli Membrane filtration
13C/12C ANALYSIS OF CARBONATE
Barium precipitates were reacted with phosphoric acid and the liberated CO2 analysed in an Optima dual-inlet mass spectrometer (VG, Middlewich, England). Isotope ratios were calculated as δ13C values versus VPDB:
( ) 31213
121313 101‰ ×
−=
VPDB
samplesample
CC
CCCδ
by comparison with laboratory standards calibrated against NBS 19 and NBS 18 assuming these had values of +1.95‰ and -5.1‰, respectively. Analytical precision (1 SD) was typically <0.1‰.
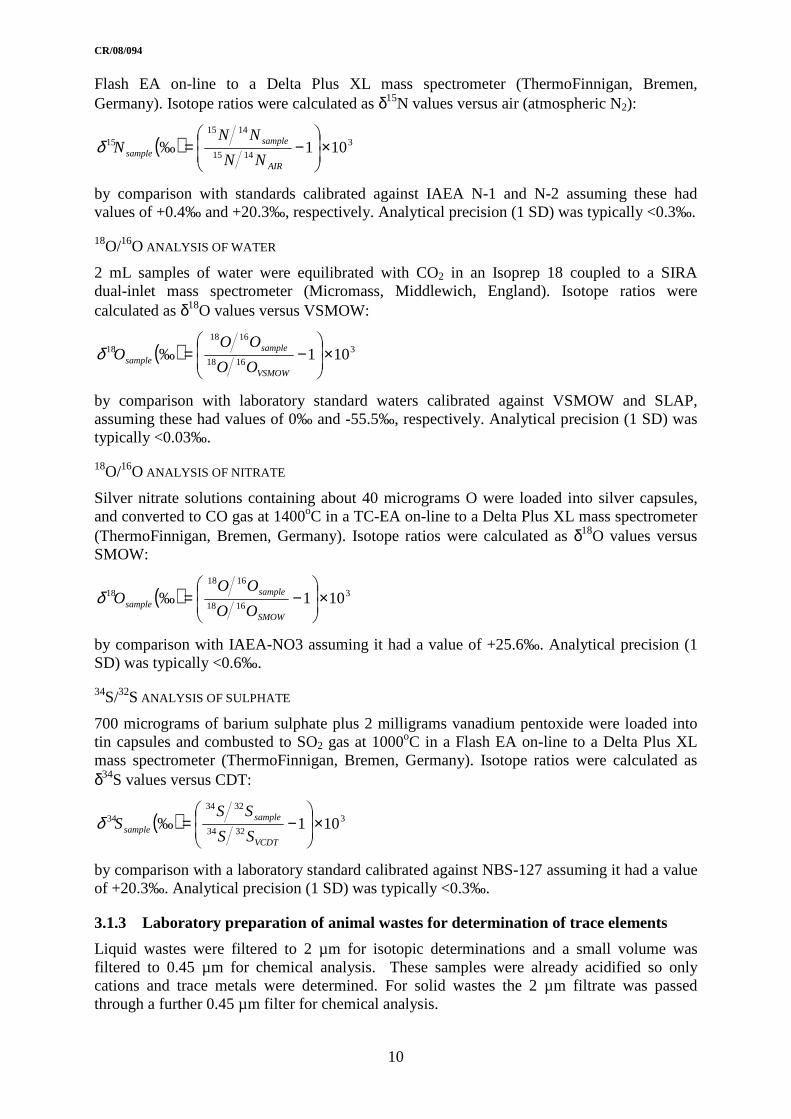
15N/14N ANALYSIS
Silver nitrate solutions, soil powders, or ammonium sulphate filters containing about 100 micrograms N were loaded into silver or tin capsules, and combusted to N2 gas at 900oC in a
CR/08/094
10
Flash EA on-line to a Delta Plus XL mass spectrometer (ThermoFinnigan, Bremen, Germany). Isotope ratios were calculated as δ15N values versus air (atmospheric N2):
( ) 31415
141515 101‰ ×
−=
AIR
samplesample
NN
NNNδ
by comparison with standards calibrated against IAEA N-1 and N-2 assuming these had values of +0.4‰ and +20.3‰, respectively. Analytical precision (1 SD) was typically <0.3‰.
18O/16O ANALYSIS OF WATER
2 mL samples of water were equilibrated with CO2 in an Isoprep 18 coupled to a SIRA dual-inlet mass spectrometer (Micromass, Middlewich, England). Isotope ratios were calculated as δ18O values versus VSMOW:
( ) 31618
161818 101‰ ×
−=
VSMOW
samplesample
OO
OOOδ
by comparison with laboratory standard waters calibrated against VSMOW and SLAP, assuming these had values of 0‰ and -55.5‰, respectively. Analytical precision (1 SD) was typically <0.03‰.
18O/16O ANALYSIS OF NITRATE
Silver nitrate solutions containing about 40 micrograms O were loaded into silver capsules, and converted to CO gas at 1400oC in a TC-EA on-line to a Delta Plus XL mass spectrometer (ThermoFinnigan, Bremen, Germany). Isotope ratios were calculated as δ18O values versus SMOW:
( ) 31618
161818 101‰ ×
−=
SMOW
samplesample OO
OOOδ
by comparison with IAEA-NO3 assuming it had a value of +25.6‰. Analytical precision (1 SD) was typically <0.6‰.
34S/32S ANALYSIS OF SULPHATE
700 micrograms of barium sulphate plus 2 milligrams vanadium pentoxide were loaded into tin capsules and combusted to SO2 gas at 1000oC in a Flash EA on-line to a Delta Plus XL mass spectrometer (ThermoFinnigan, Bremen, Germany). Isotope ratios were calculated as δ34S values versus CDT:
( ) 33234
323434 101‰ ×
−=
VCDT
samplesample
SS
SSSδ
by comparison with a laboratory standard calibrated against NBS-127 assuming it had a value of +20.3‰. Analytical precision (1 SD) was typically <0.3‰.
3.1.3 Laboratory preparation of animal wastes for determination of trace elements
Liquid wastes were filtered to 2 µm for isotopic determinations and a small volume was filtered to 0.45 µm for chemical analysis. These samples were already acidified so only cations and trace metals were determined. For solid wastes the 2 µm filtrate was passed through a further 0.45 µm filter for chemical analysis.
CR/08/094
11
4 Sample collection and landuse classification
4.1 GROUNDWATER, SURFACE WATER AND WASTEWATER
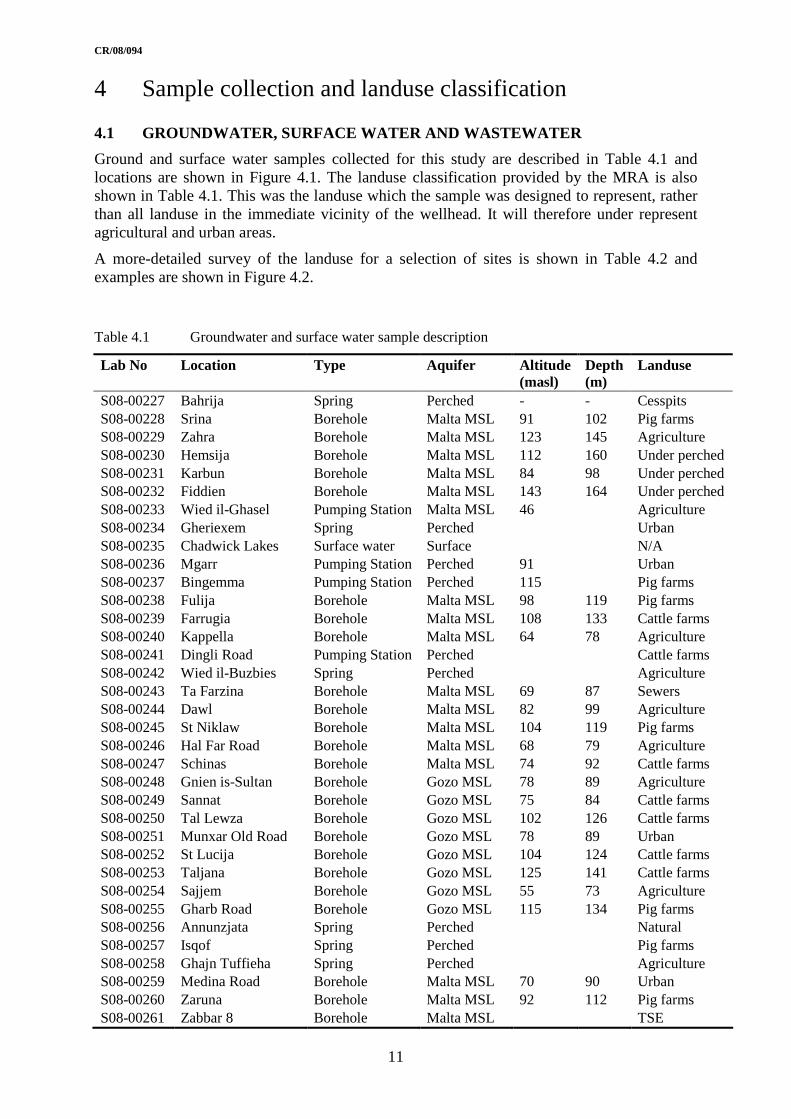
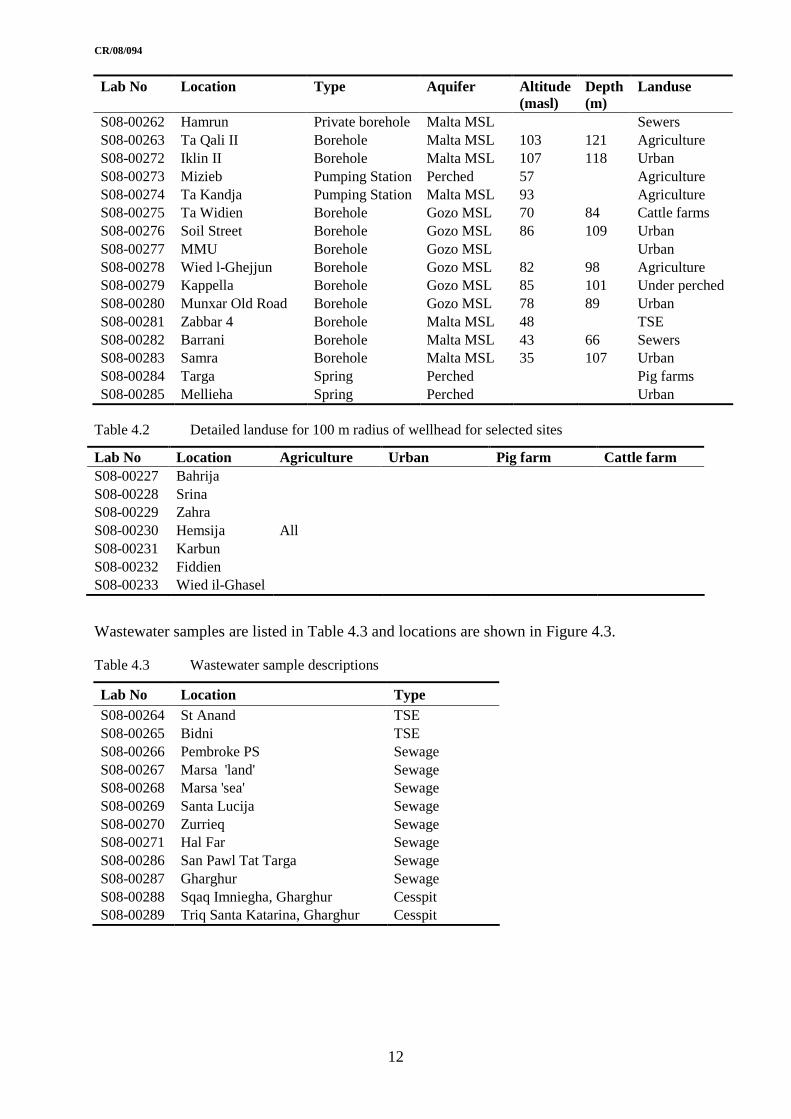
Ground and surface water samples collected for this study are described in Table 4.1 and locations are shown in Figure 4.1. The landuse classification provided by the MRA is also shown in Table 4.1. This was the landuse which the sample was designed to represent, rather than all landuse in the immediate vicinity of the wellhead. It will therefore under represent agricultural and urban areas.
A more-detailed survey of the landuse for a selection of sites is shown in Table 4.2 and examples are shown in Figure 4.2.
Table 4.1 Groundwater and surface water sample description
Lab No Location Type Aquifer Altitude (masl)
Depth (m)
Landuse
S08-00227 Bahrija Spring Perched - - Cesspits S08-00228 Srina Borehole Malta MSL 91 102 Pig farms S08-00229 Zahra Borehole Malta MSL 123 145 Agriculture S08-00230 Hemsija Borehole Malta MSL 112 160 Under perched S08-00231 Karbun Borehole Malta MSL 84 98 Under perched S08-00232 Fiddien Borehole Malta MSL 143 164 Under perched S08-00233 Wied il-Ghasel Pumping Station Malta MSL 46 Agriculture S08-00234 Gheriexem Spring Perched Urban S08-00235 Chadwick Lakes Surface water Surface N/A S08-00236 Mgarr Pumping Station Perched 91 Urban S08-00237 Bingemma Pumping Station Perched 115 Pig farms S08-00238 Fulija Borehole Malta MSL 98 119 Pig farms S08-00239 Farrugia Borehole Malta MSL 108 133 Cattle farms S08-00240 Kappella Borehole Malta MSL 64 78 Agriculture S08-00241 Dingli Road Pumping Station Perched Cattle farms S08-00242 Wied il-Buzbies Spring Perched Agriculture S08-00243 Ta Farzina Borehole Malta MSL 69 87 Sewers S08-00244 Dawl Borehole Malta MSL 82 99 Agriculture S08-00245 St Niklaw Borehole Malta MSL 104 119 Pig farms S08-00246 Hal Far Road Borehole Malta MSL 68 79 Agriculture S08-00247 Schinas Borehole Malta MSL 74 92 Cattle farms S08-00248 Gnien is-Sultan Borehole Gozo MSL 78 89 Agriculture S08-00249 Sannat Borehole Gozo MSL 75 84 Cattle farms S08-00250 Tal Lewza Borehole Gozo MSL 102 126 Cattle farms S08-00251 Munxar Old Road Borehole Gozo MSL 78 89 Urban S08-00252 St Lucija Borehole Gozo MSL 104 124 Cattle farms S08-00253 Taljana Borehole Gozo MSL 125 141 Cattle farms S08-00254 Sajjem Borehole Gozo MSL 55 73 Agriculture S08-00255 Gharb Road Borehole Gozo MSL 115 134 Pig farms S08-00256 Annunzjata Spring Perched Natural S08-00257 Isqof Spring Perched Pig farms S08-00258 Ghajn Tuffieha Spring Perched Agriculture S08-00259 Medina Road Borehole Malta MSL 70 90 Urban S08-00260 Zaruna Borehole Malta MSL 92 112 Pig farms S08-00261 Zabbar 8 Borehole Malta MSL TSE
CR/08/094
12
Lab No Location Type Aquifer Altitude (masl)
Depth (m)
Landuse
S08-00262 Hamrun Private borehole Malta MSL Sewers S08-00263 Ta Qali II Borehole Malta MSL 103 121 Agriculture S08-00272 Iklin II Borehole Malta MSL 107 118 Urban S08-00273 Mizieb Pumping Station Perched 57 Agriculture S08-00274 Ta Kandja Pumping Station Malta MSL 93 Agriculture S08-00275 Ta Widien Borehole Gozo MSL 70 84 Cattle farms S08-00276 Soil Street Borehole Gozo MSL 86 109 Urban S08-00277 MMU Borehole Gozo MSL Urban S08-00278 Wied l-Ghejjun Borehole Gozo MSL 82 98 Agriculture S08-00279 Kappella Borehole Gozo MSL 85 101 Under perched S08-00280 Munxar Old Road Borehole Gozo MSL 78 89 Urban S08-00281 Zabbar 4 Borehole Malta MSL 48 TSE S08-00282 Barrani Borehole Malta MSL 43 66 Sewers S08-00283 Samra Borehole Malta MSL 35 107 Urban S08-00284 Targa Spring Perched Pig farms S08-00285 Mellieha Spring Perched Urban
Table 4.2 Detailed landuse for 100 m radius of wellhead for selected sites
Lab No Location Agriculture Urban Pig farm Cattle farm S08-00227 Bahrija S08-00228 Srina S08-00229 Zahra S08-00230 Hemsija All S08-00231 Karbun S08-00232 Fiddien S08-00233 Wied il-Ghasel
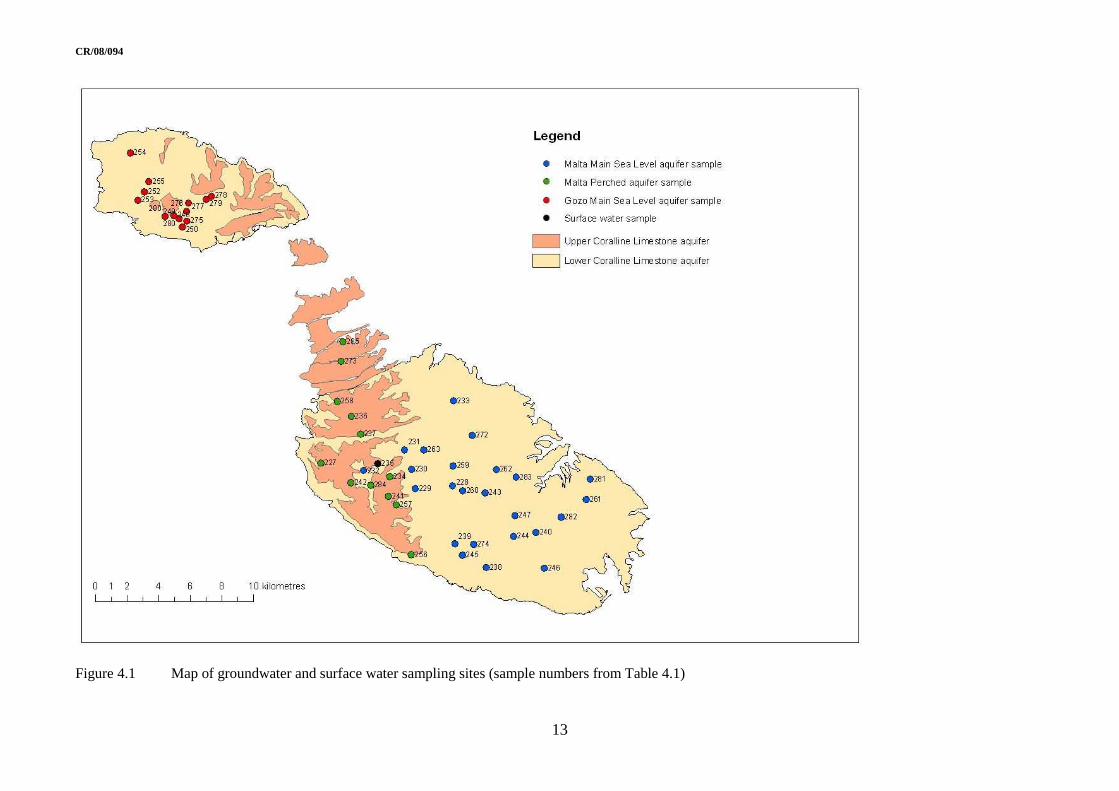
Wastewater samples are listed in Table 4.3 and locations are shown in Figure 4.3.
Table 4.3 Wastewater sample descriptions
Lab No Location Type S08-00264 St Anand TSE S08-00265 Bidni TSE S08-00266 Pembroke PS Sewage S08-00267 Marsa 'land' Sewage S08-00268 Marsa 'sea' Sewage S08-00269 Santa Lucija Sewage S08-00270 Zurrieq Sewage S08-00271 Hal Far Sewage S08-00286 San Pawl Tat Targa Sewage S08-00287 Gharghur Sewage S08-00288 Sqaq Imniegha, Gharghur Cesspit S08-00289 Triq Santa Katarina, Gharghur Cesspit
CR/08/094
13
Figure 4.1 Map of groundwater and surface water sampling sites (sample numbers from Table 4.1)

CR/08/094
14
Figure 4.2 Assessment of landuse within 100 m of wellhead for Hemsija and >>>>
CR/08/094
15
Figure 4.3 Map of wastewater sample sites

CR/08/094
16
4.2 ANIMAL WASTES, SOILS AND SYNTHETIC FERTILIZERS
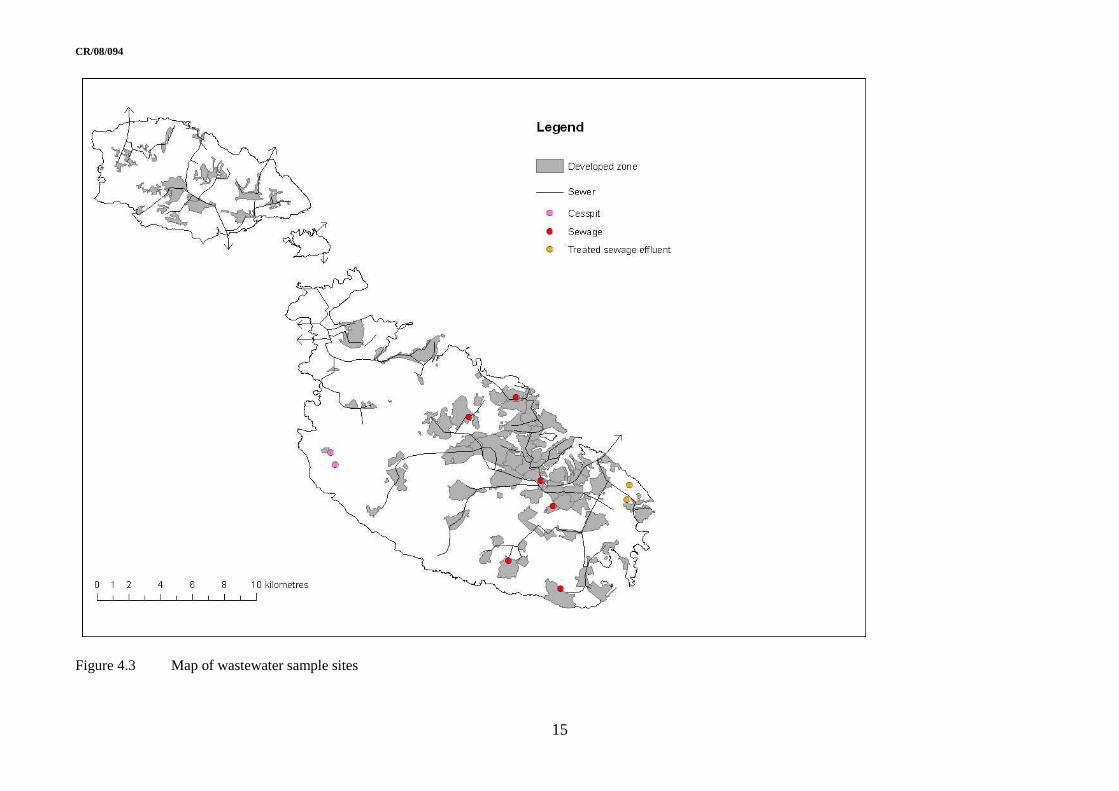
Animal waste samples collected during the study are listed in Table 4.4 and locations are shown in Figure 4.4. Soil samples were obtained from the soil archive held by the Agricultural Services and Rural Development Division of the Ministry of Rural Affairs and the Environment. These are described in Table 4.5 and shown on a national soil map in Figure 4.5. Samples of typical synthetic fertilizers were kindly provided by the Agricultural Cooperative and details are given in Table 4.6.
Table 4.4 Animal waste sample descriptions
Lab No Location Source Sample type S08-00290 Qormi Pig Slurry S08-00291 Ghaxaq Pig Slurry S08-00292 Buskett (Xmun) Cattle farms Separated liquid S08-00293 Buskett (Falzon) Pig Separated liquid S08-00294 Zebbug Pig Slurry S08-00682 Handaq Poultry Solid S08-00683 Qormi Cattle farms Solid S08-00684 Mgarr Poultry (layers) Solid S08-00685 Ghaxaq Cattle farms Solid S08-00686 Buskett (Xmun) Poultry (broilers) Solid S08-00687 Buskett (Xmun) Cattle farms Separated solids S08-00688 Buskett (Falzon) Pig Separated solids S08-00689 Zebbug Poultry (broilers) Solid
Table 4.5 Soil sample details
Site no Type Location Human impact Landuse Crop Irrigation
G003 Vertisol Gozo Terraced Agricultural Summer crops No G020 Vertisol Gozo Terraced Abandoned None No G028 Calcisol Gozo Terraced Abandoned None No G046 Vertisol Gozo Not disturbed Agricultural Cereal No G053 Calcisol Gozo Terraced Agricultural Cereal No G080 Vertisol Malta Terraced Abandoned None No G088 Vertisol Malta Terraced Agricultural Fodder No G120 Calcisol Malta Terraced Agricultural Fruit trees No G144 Cambisol Malta Terraced Agricultural Fallow No G163 Regosol Malta Terraced Agriculture Vines Drip G174 Vertisol Malta Terraced Agricultural Fallow Drip G199 Calcisol Malta Terraced Agricultural Fallow Unspecified G223 Regosol Malta Terraced Agricultural Fallow No G236 Leptosol Malta Terraced Agricultural Vines No G244 Regosol Malta Made ground Agricultural Fruit trees Drip G276 Calcisol Malta Terraced Agricultural Fodder No G308 Calcisol Malta Terraced Agricultural Fallow Undetermined

CR/08/094
17
Table 4.6 Fertilizer sample details
Sample i.d.
Manufacturer/ Importer/Brand
N-P2O5-K 2O (%) Other Formula Typical use – application rate
MF1 Agria 5-0-10 Soluble Trees, vegetables, flowers
MF2 Agri Import di D’Amato Vito
12-61 mono ammonium phosphate
MF3 Van der Rift 21% ammonium sulphate
MF4 Gat/ Gatit 12-6-36 MF5 Gat/ Gatit 14-14-28 MF6 Gat/ Gatit 18-9-26 MF7 Gat/ Gatit 18-18-18 MF8 Gat/ Gatit 19-5-30 MF9 Gat/ Gatit 23-12-12
Cu, Fe, Mn, Mo, Zn (and sometimes Mg)
Soluble, fertigation
MF10 Haifa/ Multi-K
Zn 12-0-43 (as KNO3) 2%Zn, Low in Na
and Cl for use in arid and semi-arid areas
Soluble, foliar application or fertigation
Fruit trees, vegetables, flowers
MF11 Rosier/ Rosafert 12-12-17 (3% NO3-N , 9% NH4-N)
2%MgO, 22%SO3, 0.02% soluble B, 0.02% Cu, 0.07% Fe, 0.06% Mn, 0.1%Zn. Low in Cl
Granulated, solid application
Fruit and vegetables – 10-20 kg/100 m2
MF12 Rosier 26%

CR/08/094
18
Figure 4.4 Map of animal waste sample sites
CR/08/094
19
!(
!(
!( !(
!(
!(
!(
!(
!(
!(
!(
!(
!(
!(
!(
!(
!(
0 2 4 6 8 101 kilometres
Legend
Soil class
Calcisol
Cambisol
Leptosol
Luvisol
Regosol
Urban
Vertisol
!( Soil sample
Figure 4.5 Map of soil sample sites
CR/08/094
20
5 Discussion of isotope results for groundwater nitrate
5.1 GENERAL PATTERN FOR GROUNDWATER NITRATE
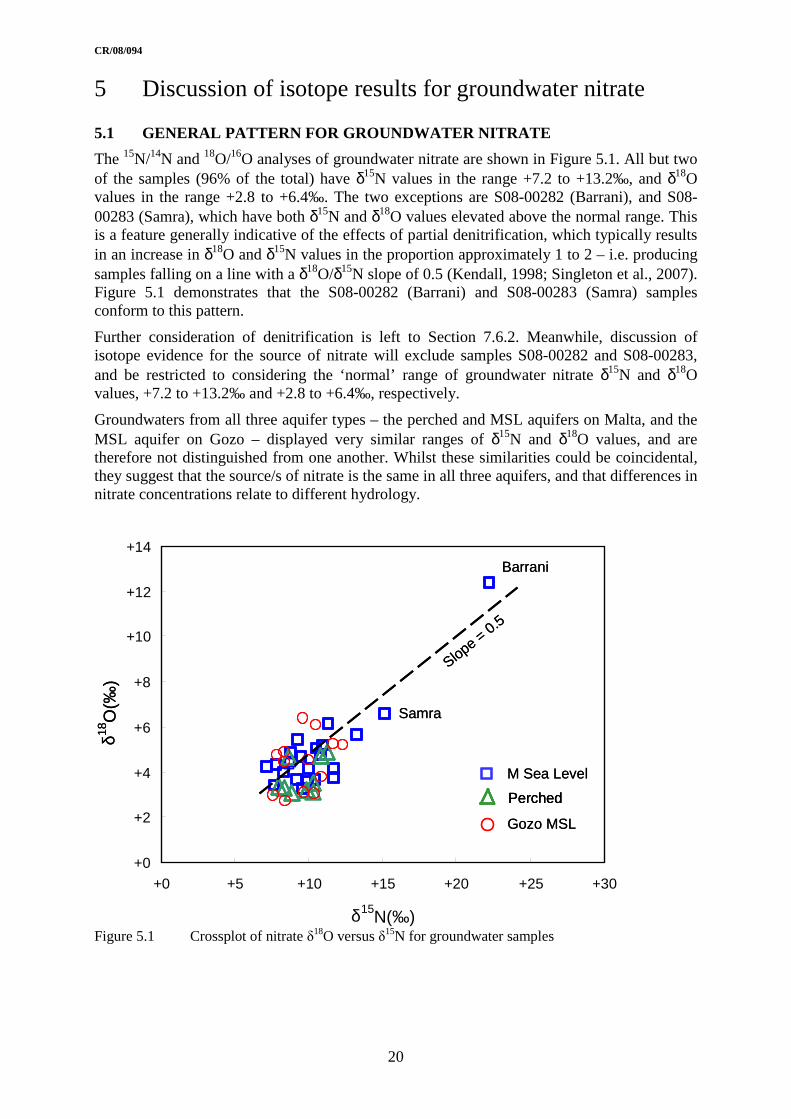
The 15N/14N and 18O/16O analyses of groundwater nitrate are shown in Figure 5.1. All but two of the samples (96% of the total) have δ15N values in the range +7.2 to +13.2‰, and δ18O values in the range +2.8 to +6.4‰. The two exceptions are S08-00282 (Barrani), and S08-00283 (Samra), which have both δ15N and δ18O values elevated above the normal range. This is a feature generally indicative of the effects of partial denitrification, which typically results in an increase in δ18O and δ15N values in the proportion approximately 1 to 2 – i.e. producing samples falling on a line with a δ18O/δ15N slope of 0.5 (Kendall, 1998; Singleton et al., 2007). Figure 5.1 demonstrates that the S08-00282 (Barrani) and S08-00283 (Samra) samples conform to this pattern.
Further consideration of denitrification is left to Section 7.6.2. Meanwhile, discussion of isotope evidence for the source of nitrate will exclude samples S08-00282 and S08-00283, and be restricted to considering the ‘normal’ range of groundwater nitrate δ15N and δ18O values, +7.2 to +13.2‰ and +2.8 to +6.4‰, respectively.
Groundwaters from all three aquifer types – the perched and MSL aquifers on Malta, and the MSL aquifer on Gozo – displayed very similar ranges of δ15N and δ18O values, and are therefore not distinguished from one another. Whilst these similarities could be coincidental, they suggest that the source/s of nitrate is the same in all three aquifers, and that differences in nitrate concentrations relate to different hydrology.
Figure 5.1 Crossplot of nitrate δ18O versus δ15N for groundwater samples
+0
+2
+4
+6
+8
+10
+12
+14
+0 +5 +10 +15 +20 +25 +30
δ15N(‰)
δ18O
(‰)
δ18O
(‰)
M Sea LevelM Sea Level
PerchedPerchedPerched
Gozo MSLGozo MSL
Slope = 0.5
Barrani
Samra
Slope = 0.5
Barrani
Samra
CR/08/094
21
5.2 15N/14N RATIOS OF DIFFERENT NITROGEN SOURCES
5.2.1 Synthetic fertilizers
A summary of the 15N results used for the interpretation is shown in Table 5.1. If excessive amounts of fertilizer are applied to soil, and are immediately washed through by heavy rainfall, the fertilizer may comprise a direct supply of nitrate to groundwater – either directly as fertilizer nitrate, or by oxidation of fertilizer ammonium. This mechanism, involving little chemical interaction or nitrogen exchange with the soil, would be expected to produce nitrate with δ15N values similar to those of the fertilizer.
The δ15N values for synthetic inorganic fertilizers utilised in Malta, -5.0 to +0.3 ‰ for ammonium and +1.3 to +3.5‰ for nitrate (Table 5.1) are within the typical -5 to +4 range reported for fertilizers in other countries (Vitòria et al., 2004, Shomar et al., 2008). These values are considerably lower than the +7.2 to +13.2‰ range for the groundwater nitrate Direct inputs of fertilizer-derived nitrate are not therefore regarded as a major contributor to the groundwater nitrate (though note, below, that fertilizer assimilated into the soil N pool could be a source).
Table 5.1 Summary of δ15N data
Sample n δδδδ15N range (‰)
δδδδ15N mean (‰)
Fertilizer, NH4 9 -5 to 0 -2 Fertilizer, NO3 6 +1 to +4 +2 Sewage 10 +5 to +7 +6 Liquid animal wastes 5 +3 to +6 +4 Solid animal wastes 6 +2 to +10 +6 Cultivated soils N 14 +6 to +11 +9 Non-cultivated soils N 3 +4 to +7 +5 Groundwater NO3
* 45 +7 to +13 +10
* Excludes two denitrified samples
5.2.2 Animal wastes
Animal waste was collected from recently-excreted sources. As this material is highly anoxic it probably contained little nitrate, but had very high concentrations of ammonium (Table A5, Appendix 1). Spreading of animal waste onto the land, however, could lead to rapid oxidation of the ammonium to nitrate, and constitute a potentially significant source of pollution.
The δ15N value of ammonium in animal waste is initially determined by the value for the excreted nitrogen, but thereafter is greatly dependent on the amount of ammonium lost by ammonia volatilisation. In this process kinetic and equilibrium isotope fractionations favour loss of 15N-depleted ammonia, and result in a consequent increase in the δ15N value of the residual ammonium (Heaton, 1986; Heaton et al., 1997). δ15N values of ammonium and of nitrate derived from animal waste therefore tend to increase progressively with increased ‘age’, i.e. increased time of decomposition and oxidation (Kim et al., 2008). The δ15N values of Maltese animal waste samples averaged +5.3‰, but had a broad range (+2.1 to +10.1 ‰) comparable to published values (Bateman and Kelly, 2007), and which probably reflects the different ages and degrees of decomposition of the samples. Recent results for δ15N in manure in Gaza (Shomar et al., 2008) where composite samples were collected from piles show a narrower range (+7.5 to +11.9 ‰)
CR/08/094
22
0
1
2
3
4
5
6
7
8
9
10
11
12
13
14
15
16
-10 -5 0 +5 +10 +15
δ15N (‰)
NH4-N
NO3-N
Soil N
Sewage
Liquid animal wastes
Synthetic fertilisers
Solid animal wastes
Uncultivated soil
Agriculture
Pig
Cattle
Baseline
TSE
Under perched
Urban
Sewers
Cesspits
Cultivated soil
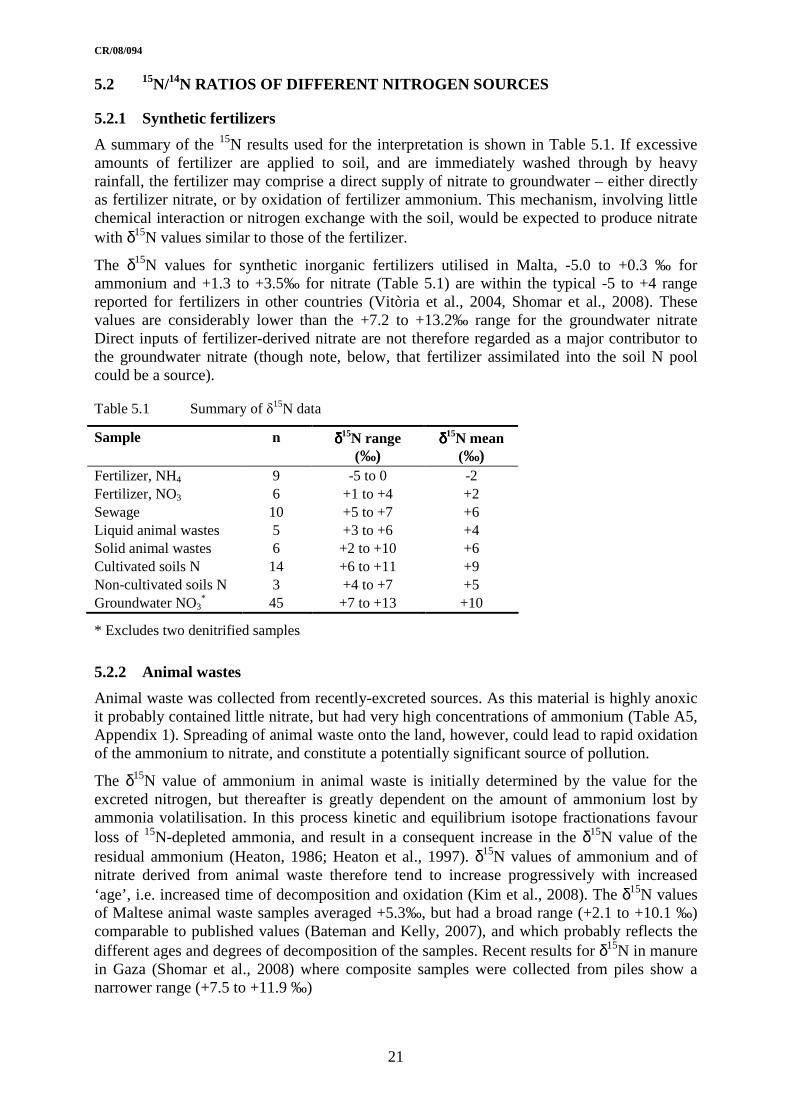
Figure 5.2 Graphical summary of δ15N in groundwater under various landuses, soil and potential source terms
If the oxidation of ammonium to nitrate was quantitative, there would be little isotope fractionation, and the δ15N value of the nitrate would tend to be similar to that of the ammonium (Kendall, 1998; Kim et al., 2008). On this basis only the dry poultry (S08-00682) and cattle farms (S08-00683) waste samples, with δ15N values of about +10‰, are comparable to the average δ15N value for groundwater nitrate; the majority of analysed animal waste samples have δ15N values lower than those in the groundwater (Figure 5.2). However, we can not rule out the possibility that if these wastes were subject to further decomposition, as would be likely to occur with distribution onto soil, δ15N values could rise towards levels compatible with them being sources of the nitrate in the groundwater.
5.2.3 Sewage
In common with the animal waste samples, sewer and cesspit samples were also collected from entirely anoxic environments, and so had high ammonium concentrations, but very little nitrate. If sewage were to leak into aerobic sub-surface environments, it could potentially constitute a source of nitrate contamination.
Unlike animal wastes, however, sewage constrained in sub-surface environments has much less opportunity to lose ammonia by volatilisation, and thereby increase its δ15N value (Aravena et al., 1993). This may explain why samples from a wide variety of sewers and cesspits exhibit only a narrow range of δ15N values, from +5.4 to +6.9 ‰. These are very similar to δ15N in sewage sludges reported by Shomar et al. (2008) ranging from +4.6 to +7.4 ‰ and in aged, dried sludge from +5.2 to +7.4 ‰. As the values for Malta sewage are lower than those for the groundwater nitrate, they suggest that nitrate derived directly from leaking sewers or from cesspits is not a major source of pollution.
Sou
rce
Gro
undw
ater
te
rms
land
use
clas
s
NH3-N NO3-N Soil N

CR/08/094
23
5.2.4 Soil nitrogen
The δ15N values of the soil organic nitrogen are quite high (+4 to +11‰, average +8.5 ‰) and at the upper end of the normal range for soils globally (Amundson et al., 2003). Insofar as the factors responsible for determining soil δ15N values are understood, it is probable that soils with high δ15N are very ‘open’ with respect to nitrogen, with relatively large amounts of nitrogen loss (Handley et al., 1999; Amundson et al., 2003). This may well be a reflection of both Malta’s climate (dry summers with heavy winter rain) and particularly its intensive cultivation. Cultivation has been suggested as another cause of higher soil δ15N values (Broadbent et al., 1980), and we note that the three soil samples from sites in Malta marked as non-agricultural or abandoned tended to have the lowest δ15N values (Table A6, Appendix 1). Shomar et al. (2008) report a similar pattern with wastewater irrigated soils in Gaza averaging +7.3 ‰ and other soils in the range +4.0 to + 5.7 ‰.
Soil nitrification tends to produce nitrate with δ15N values similar to those of the soil organic nitrogen (Kendall et al., 2007). On this basis, cultivation of Malta’s agricultural soils (δ15N = +6.0 to +11.2‰, average +9.1‰) could certainly produce nitrate isotopically similar to that in the groundwater (δ15N = +7.2 to +13.2‰, average +9.7‰).
5.3 18O/16O RATIOS OF DIFFERENT NITRATE SOURCES
5.3.1 Fertilizer nitrate
Nitrate whose oxygen is derived solely from atmospheric sources – which includes rainfall nitrate and nitrate in synthetic fertilizer – has relatively high δ18O values (Kendall, 1998; Heaton et al., 2004). For Maltese fertilizers the δ18O values were +24 to +26‰, and therefore much higher than the +2.8 to +6.4‰ for groundwater nitrate (Figure 5.3). This confirms the 15N/14N data in ruling out any significant direct contribution of fertilizer nitrate.
0
+5
+10
+15
+20
+25
+30
-5 0 +5 +10 +15
δ18O
(‰
)
δ15N (‰) δ15N (‰)
0
+5
+10
+15
+20
+25
+30
-5 0 +5 +10 +15
Measured groundwater nitrate
Measured fertilizer nitrate
Calculated fertilizer ammonium-derived nitrate
Calculated sewage ammonium-derived nitrate
Calculated manure ammonium-derived nitrate
Measured groundwater nitrate
Calculated soil N-derived nitrate (cultivated soils)
Calculated soil N-derived nitrate (uncultivated soils)
0
+5
+10
+15
+20
+25
+30
-5 0 +5 +10 +15
δ18O
(‰
)
δ15N (‰) δ15N (‰)
0
+5
+10
+15
+20
+25
+30
-5 0 +5 +10 +150
+5
+10
+15
+20
+25
+30
-5 0 +5 +10 +15
δ18O
(‰
)
δ15N (‰) δ15N (‰)
0
+5
+10
+15
+20
+25
+30
-5 0 +5 +10 +15
Measured groundwater nitrate
Measured fertilizer nitrate
Calculated fertilizer ammonium-derived nitrate
Calculated sewage ammonium-derived nitrate
Calculated manure ammonium-derived nitrate
Measured groundwater nitrate
Measured fertilizer nitrate
Calculated fertilizer ammonium-derived nitrate
Calculated sewage ammonium-derived nitrate
Calculated manure ammonium-derived nitrate
Measured groundwater nitrate
Calculated soil N-derived nitrate (cultivated soils)
Calculated soil N-derived nitrate (uncultivated soils)
Measured groundwater nitrate
Calculated soil N-derived nitrate (cultivated soils)
Calculated soil N-derived nitrate (uncultivated soils)
Figure 5.3 Summary of δ15Nand δ18O in nitrate in groundwater and various potential nitrate sources

CR/08/094
24
5.3.2 Nitrate from bacterial nitrification
The remaining major potential source is nitrate formed by bacterial nitrification. This typically involves species of Nitrosomonas and Nitrobacter, and theoretically derives two of the three oxygens in the NO3
- ion from water, and one of the oxygens from atmospheric O2. The expected δ18O value of nitrate derived by microbial nitrification can therefore be calculated to be:
( )21818
318 3132 OwaterNO OOO δδδ ×+×=
For local Maltese groundwater having δ18Owater = -5.3 to -4.3‰ (above), and atmospheric O2 having δ18OO2 = +23.5‰ (Kroopnick and Craig, 1972), the expected δ18ONO3 value of nitrate derived by microbial nitrification would be +4.3 to +5.0‰. Bearing in mind the simplifying approximations inherent in these calculation (Kendall et al., 2007), these values are perfectly within the range +2.8 to +6.4‰ measured for nitrate in Maltese groundwaters. Assuming that this δ18Owater also applies to soil water the anticipated leaching of nitrate from soils can also be represented on Figure 5.3. The calculated values for cultivated soils are very similar to those for groundwater whilst those for uncultivated soils are differentiated by lower δ15N.
In contrast, the same calculation utilising δ18Owater values of = -2.8 to -0.3‰ for sewage and TSE waters (above) would yield δ18ONO3 = +6.0 to +7.6‰, suggesting that nitrification in these waters is a less likely source of the groundwater nitrate.
5.4 CONCLUSIONS FROM NITRATE ISOTOPES
Nitrate stable isotope measurements suggest that leaching from cultivated soils, spreading of animal wastes, and bacterial nitrification in groundwater are the most likely sources of groundwater nitrate. Direct inputs of fertilizer-derived nitrate or sewage are probably not major contributors as their δ15N is lower than that of groundwater nitrate, but transformation of these in the soil zone or the unsaturated zone may change their signatures.
Table 5.2 Summary of likely importance of potential sources of groundwater nitrate from nitrogen isotopes
Sources Cultivated soils � Animal wastes � Bacterial nitrification � TSE � Sewage direct leaching � Fertilizers direct leaching �

CR/08/094
25
6 Evolution of groundwater quality
6.1 CARBONATE DISSOLUTION
The evolution of major ion quality is summarised in the Piper plot shown in Figure 6.1. Infiltrating meteoric water equilibrates with soil CO2 and carbonate under open system conditions leading to calcite saturation in groundwater as seen in the perched aquifers. Over a longer timescale in the main aquifers, incongruent dissolution of the carbonate matrix leads to increases in concentration of HCO3, Ca, Mg and Sr in groundwater. Secondary precipitation of calcite on fissure surfaces can lead to release of CO2 and with decrease in concentration of HCO3 and Ca, tending to a Ca:Mg ratio of 1. Sodium-calcium ion exchange can lead to further limited calcite dissolution deep in the aquifer, but this would not be seen against the seawater intrusion which occurs. Seawater has higher Ca, much higher Mg and lower HCO3 than most of the groundwaters. The anomalous quality of the sample from Barrani in the Malta MSL aquifer is clearly shown in Figure 6.1.
Groundwater has a wide range of values of δ13C values reflecting the aquifer processes
described above.
• a δ13C value of -10 ‰ or less is typical for limestone solution by dissolved soil CO2 under open system conditions. This type of water is seen the perched aquifers and in some groundwater in the Malta MSL aquifer (Figures 5.1 and 5.2);
• incongruent dissolution of the limestone matrix which is likely to have a δ13C value similar to seawater (+1 ‰) leads to higher δ
13C values in the dissolved carbonate;
• secondary precipitation of calcite on fissure surfaces can lead to release of CO2 and higher δ13C values of dissolved carbonate species with decrease in concentration of HCO3 and Ca. This type of water is seen in the Malta and Gozo MSL aquifers.
0
10
20
30
40
50
60
70
80
90
100
Mg
2+
0
10
20
30
40
50
60
70
80
90
100
Ca2+
0102030405060708090100
Cl-
0 10 20 30 40 50 60 70 80 90 100
SO4 2-
0
10
20
30
40
50
60
70
80
90
1000
10
20
30
40
50
60
70
80
90
100
0
10
20
30
40
50
60
70
80
90
100100
90
80
70
60
50
40
30
20
10
0
Perched
Malta MSL
Gozo MSL
Seawater
Figure 6.1 Piper diagram of majors ions in groundwater and seawater
Barrani
CR/08/094
26
0
50
100
150
200
250
300
350
-20 -15 -10 -5 0 +5
δ13C (‰)
HC
O3
conc
entr
atio
n (m
g/l)
PerchedMalta
Gozo
Seawater
0
100
200
300
400
500
-20 -15 -10 -5 0 +5
δ13C (‰)
Ca
conc
entr
atio
n (m
g/l)
0
50
100
150
200
-20 -15 -10 -5 0 +5
δ13C (‰)
Mg
conc
entr
atio
n (m
g/l)
1406
0
10
20
30
40
50
60
-20 -15 -10 -5 0 +5
δ13C (‰)
Li c
once
ntra
tion
(µg/
l)
185185
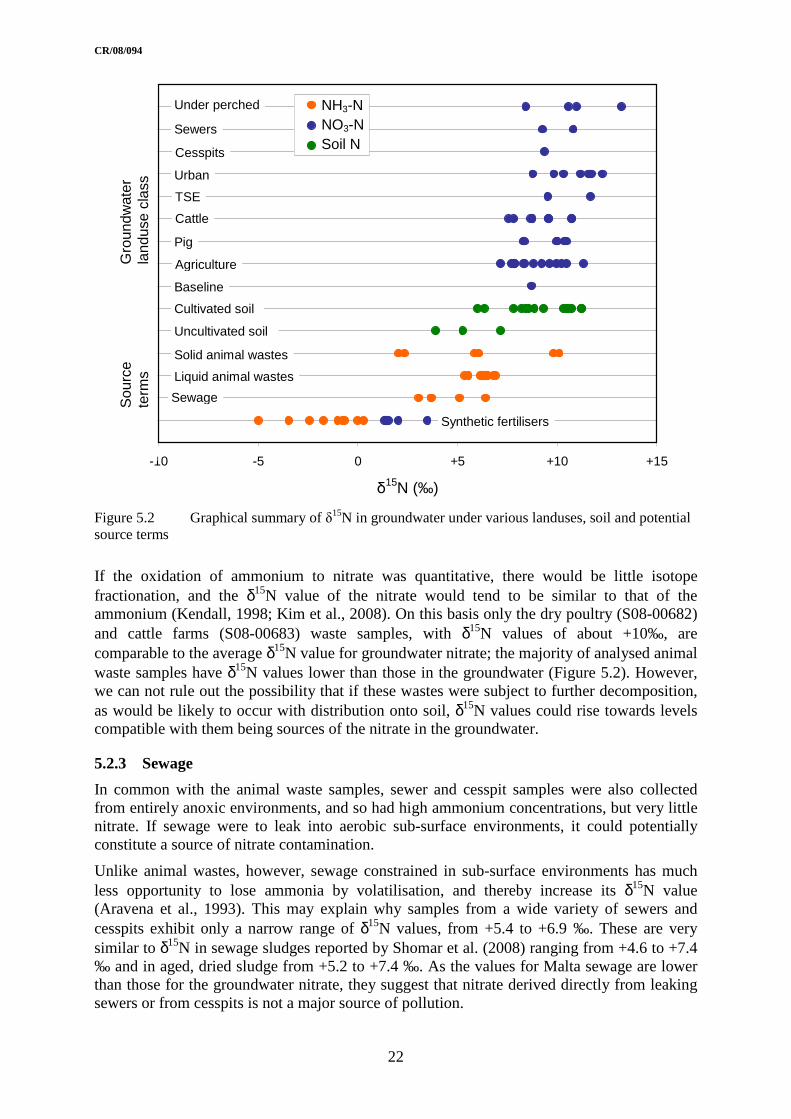
Figure 6.2 Crossplots of HCO3, Ca, Mg and Li against δ13C
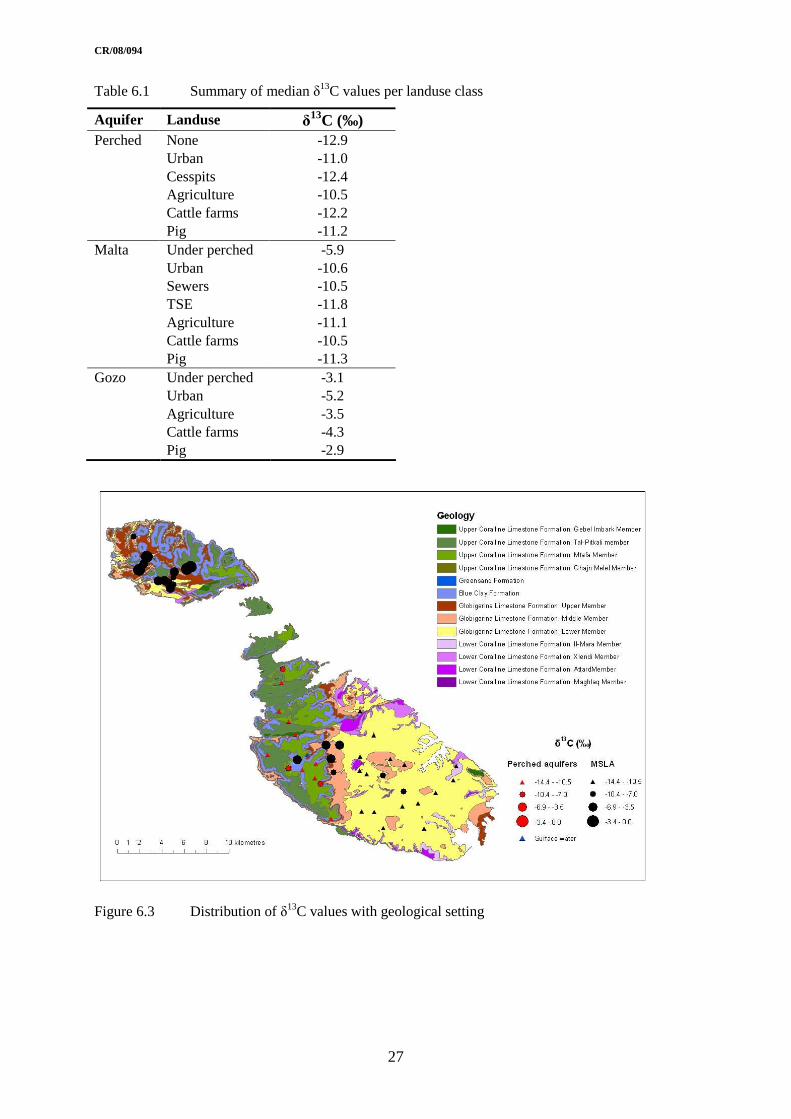
The average concentrations shown in Table 6.1 indicate that the δ13C signature of groundwater does not depend on landuse but is related to the geochemical processes which occur down the flowpath and the residence time. Groundwaters in the perched and Malta MSL aquifers have similar signatures, except for the sites which are under the perched aquifers where the values are much lower (Figure 6.3). On Gozo the average results are similar for all uses.
Figure 6.2 shows that species such as Mg and Li trend from the perched aquifers, through the Malta main aquifer and Gozo towards seawater concentrations, but that bicarbonate and calcium are controlled by other processes, such as carbonate dissolution.
CR/08/094
27
Table 6.1 Summary of median δ13C values per landuse class
Aquifer Landuse δ13C (‰)
Perched None -12.9 Urban -11.0 Cesspits -12.4 Agriculture -10.5 Cattle farms -12.2 Pig -11.2 Malta Under perched -5.9 Urban -10.6 Sewers -10.5 TSE -11.8 Agriculture -11.1 Cattle farms -10.5 Pig -11.3 Gozo Under perched -3.1 Urban -5.2 Agriculture -3.5 Cattle farms -4.3 Pig -2.9
Figure 6.3 Distribution of δ13C values with geological setting

CR/08/094
28
6.2 THE IMPACT OF SALINE INTRUSION
Seawater has a relatively consistent composition with an average salinity of 3.5 %. Seawater in the Mediterranean is slightly more saline (3.8 %). Table 6.2 shows the average composition corrected to 3.8 % salinity and also dilutions of this which would give chloride concentrations similar to the range of the more heavily affected samples. It is clear from Table 6.2 that all but the elements at the base of the table would have an impact on measured concentrations and this needs to be taken into account during interpretation of the project results. Some major and minor constituents are observed at concentrations exceeding the value anticipated from seawater intrusion alone (Figure 6.4). This is likely to be due to a number of reasons:
• present in desalinated seawater used for water supply (B);
• present in infiltration affected by pollution- discussed further in the following section;
• present in the aquifer matrix and mobilised over a long period (residence time indicator) – discussed in Section 6.1 (e.g. Li, Mg).
Table 6.2 Seawater composition for selected solutes for 3.8% salinity (after Turekian, 1968)
Solute Concentration Dilution × 20 Dilution × 50 Cl (mg/l) 21003 1050 420 Na (mg/l) 11674 584 233 SO4 (mg/l) 2933 147 59 Mg (mg/l) 1406 70 28 Ca (mg/l) 452 23 9.0 K (mg/l) 423 21 8.5 HCO3 (mg/l) 157 7.9 3.1 Br (mg/l) 72 3.6 1.4 N (mg/l) 17 0.84 0.34 F (mg/l) 14 0.71 0.28 Sr (mg/l) 8.8 0.44 0.18 B (mg/l) 4.8 0.24 0.10 Si (mg/l) 3.1 0.16 0.06 Li (µg/l) 185 9.2 3.7 Rb (µg/l) 130 6.5 2.6 P (µg/l) 96 4.8 1.9 Ba (µg/l) 23 1.1 0.46 Mo (µg/l) 11 0.54 0.22 Ni (µg/l) 7.2 0.36 0.14 Zn (µg/l) 5.4 0.27 0.11 Fe (µg/l) 3.7 0.18 0.074 As (µg/l) 2.8 0.14 0.056 V (µg/l) 2.1 0.10 0.041 Al (µg/l) 1.1 0.054 0.022 Cu (µg/l) 0.98 0.049 0.020 Mn (µg/l) 0.43 0.022 0.0087 Co (µg/l) 0.42 0.021 0.0085 Sb (µg/l) 0.36 0.018 0.0072 Cr (µg/l) 0.22 0.011 0.0043 Cd (µg/l) 0.12 0.0060 0.0024 Pb (µg/l) 0.033 0.0016 0.00065 Y (µg/l) 0.014 0.00071 0.00028 La (µg/l) 0.0031 0.00016 0.000063 Be (µg/l) 0.00065 0.000033 0.000013

CR/08/094
29
Figure 6.4 shows that B is indeed detected in many samples above the concentration that would be predicted from the chloride concentration. Enhanced concentrations of Li are observed in samples of groundwater from beneath the perched aquifers, in most other samples from the Gozo MSL and some urban and agricultural samples from the Malta MSL aquifers. Mg is similar.
Chloride/sulphate ratios are consistent with those observed by the BRGM (1991). Most samples from the Malta and Gozo MSL aquifers are close to the seawater mixing line (Cl: SO4 = 7.15). A few have enhanced chloride relative to sulphate – S08-00243 (Ta Farzina, Malta MSL, sewers), S08-00274 (Ta Kandja, Malta MSL, agriculture), S08-00250 (Tal Lewza, Gozo MSL, cattle farms) and S08-00276 (Soil Street, Gozo MSL, urban). Samples from the perched aquifers have a similar ratio to the BRGM ‘springs’ (Cl: SO4 = 1.26). The samples from S08-00255 (Gharb Road, Gozo MSL, pigs) and S08-00230 (Hemsija, Malta MSL, under perched) are also close to this ratio. The same pattern, but less markedly, is shown by the Br data and possibly by K. The two highest K values in the perched aquifers are from urban areas.
Sodium concentrations are well correlated with Cl but slightly lower than would be predicted from chloride concentrations in seawater. For the other major components of seawater, concentrations of HCO3, Ca, Sr and F show little relationship with chloride ratios in seawater. Calcium and HCO3 are present at concentrations enhanced relative to chloride in all samples. Fluoride and Sr are generally higher in the Gozo MSL.
A simplistic estimate of the contribution of seawater from saline intrusion can be made by assuming that all groundwater chloride is from seawater (Table 6.3). Since chloride is an important and conservative component of animal wastes and sewage this is likely to overestimate seawater content. The lowest values in the perched aquifers are at the Annunzjata and Bahrija springs (S08-00256 and S08-00227) and the highest at Mizieb and Dingli Road pumping stations (S08-00273 and S08-00241). In the Malta MSL aquifer the borehole at Barrani (S08-00282) appears to have an anomalously low value. Otherwise the highest values are at Hal Far Road and Ta Kandja PS (S08-00246 and S08-00274). For the Gozo MSL aquifer the lowest values are at Kappella (S08-00279 under the perched aquifer) and Ta Widien (S08-00275) with the highest values at Sajjem and Tal Lewza (S08-00254 and S08-00250).
The data for δ34S in sulphate shows a wide range of values: -6 to +19 ‰ (Table 6.4). Low values down to -6 ‰ might be expected for sulphate derived by oxidation of reduced sulphur compounds (e.g. sulphides and organic S compounds), as might be found in typical near-surface environments, derived from the soil or from organic wastes. The higher values are trending towards the value for seawater sulphate (+21 ‰). The lowest values were measured at Hemsija and Karbun (S08-00230 and S08-00231 under the perched aquifers), at Zahra (S08-00229) and Wied l-Ghejjun (S08-00278).
Table 6.3 Estimated seawater content of groundwater from chloride concentrations
Aquifer Median seawater content (%) Range (%)
Perched 1.2 0.45 – 2.0
Malta MSL 1.9 0.19 - 5.6
Gozo MSL 4.3 1.3 - 9.5

CR/08/094
30
0
0.1
0.2
0.3
0.4
0.5
0 500 1000 1500 2000 2500
Cl concentration (mg/l)
B c
once
ntra
tion
(µg/
l)
0
5
10
15
20
25
30
35
0 500 1000 1500 2000 2500
Cl concentration (mg/l)
Li c
once
ntra
tion
(µg/
l)
0
50
100
150
200
250
300
0 500 1000 1500 2000 2500
Cl concentration (mg/l)
SO
4 c
once
ntra
tion
(mg/
l)
BRGM springs
0
1
2
3
4
5
6
7
8
0 500 1000 1500 2000 2500
Cl concentration (mg/l)
Br
conc
entr
atio
n (m
g/l)
0
5
10
15
20
25
30
35
40
45
50
0 500 1000 1500 2000 2500
Cl concentration (mg/l)
K c
once
ntra
tion
(mg/
l)
Background Perched
Urban PerchedCesspit Perched
Agriculture PerchedCattle Perched
Pig Perched
Under Perched Malta MSLUrban Malta MSL
Sewer Malta MSLTSE irrigation Malta MSL
Agriculture Malta MSL
Cattle Malta MSLPig Malta MSL:
Under Perched Gozo MSL
Urban Gozo MSLAgriculture Gozo MSL
Cattle Gozo MSLPig Gozo MSL
Figure 6.4 Crossplots of selected major ions against chloride (green line is the average seawater ratio; blue line is the average ratio in springs observed by BRGM, 1991)
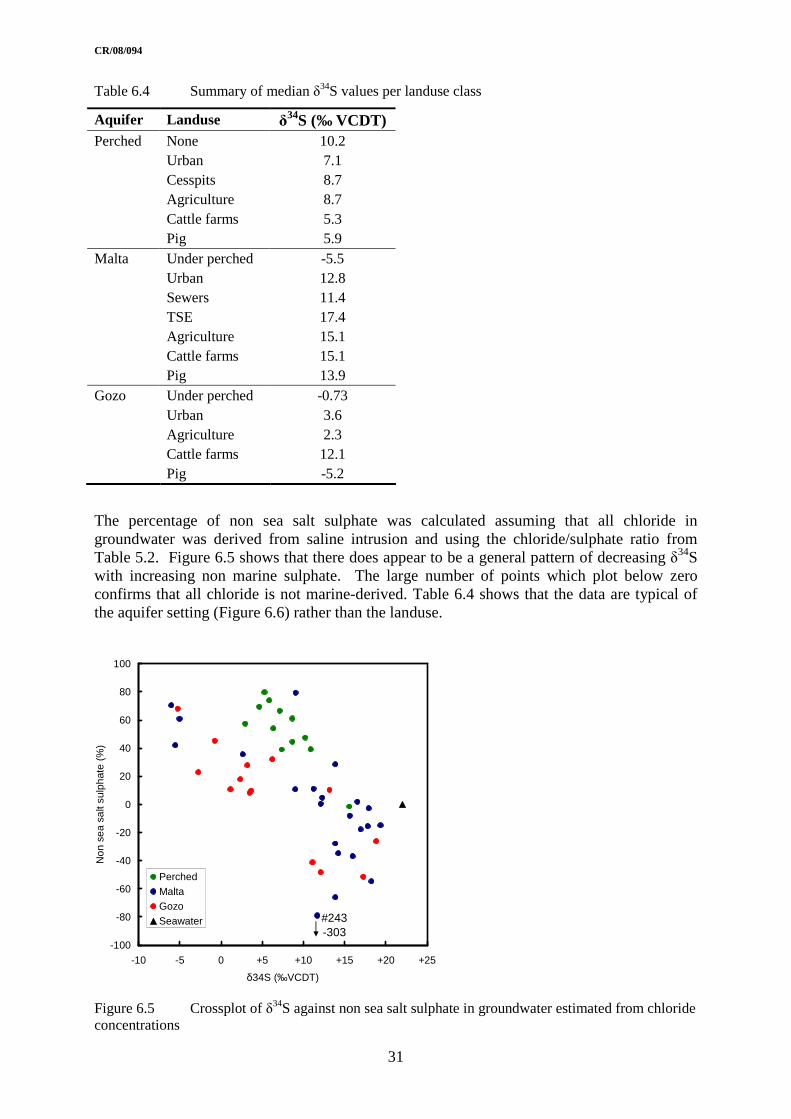
CR/08/094
31
Table 6.4 Summary of median δ34S values per landuse class
Aquifer Landuse δ34S (‰ VCDT)
Perched None 10.2 Urban 7.1 Cesspits 8.7 Agriculture 8.7 Cattle farms 5.3 Pig 5.9 Malta Under perched -5.5 Urban 12.8 Sewers 11.4 TSE 17.4 Agriculture 15.1 Cattle farms 15.1 Pig 13.9 Gozo Under perched -0.73 Urban 3.6 Agriculture 2.3 Cattle farms 12.1 Pig -5.2
The percentage of non sea salt sulphate was calculated assuming that all chloride in groundwater was derived from saline intrusion and using the chloride/sulphate ratio from Table 5.2. Figure 6.5 shows that there does appear to be a general pattern of decreasing δ
34S with increasing non marine sulphate. The large number of points which plot below zero confirms that all chloride is not marine-derived. Table 6.4 shows that the data are typical of the aquifer setting (Figure 6.6) rather than the landuse.
-100
-80
-60
-40
-20
0
20
40
60
80
100
-10 -5 0 +5 +10 +15 +20 +25
δ34S (‰VCDT)
Non
sea
sal
t sul
phat
e (%
)
PerchedMaltaGozoSeawater #243
-303
Figure 6.5 Crossplot of δ34S against non sea salt sulphate in groundwater estimated from chloride concentrations

CR/08/094
32
Figure 6.6 Distribution of δ34S values with geological setting
6.3 CONCLUSIONS ON BACKGROUND WATER QUALITY
In conclusion, the major ion quality of groundwater is typical of limestone aquifers, with incongruent dissolution giving rise to enhanced concentrations of Mg and Sr. It is clear that all major and minor elements in seawater have a large impact on measured concentrations in the MSL aquifers and this needs to be taken into account during interpretation of the project results.
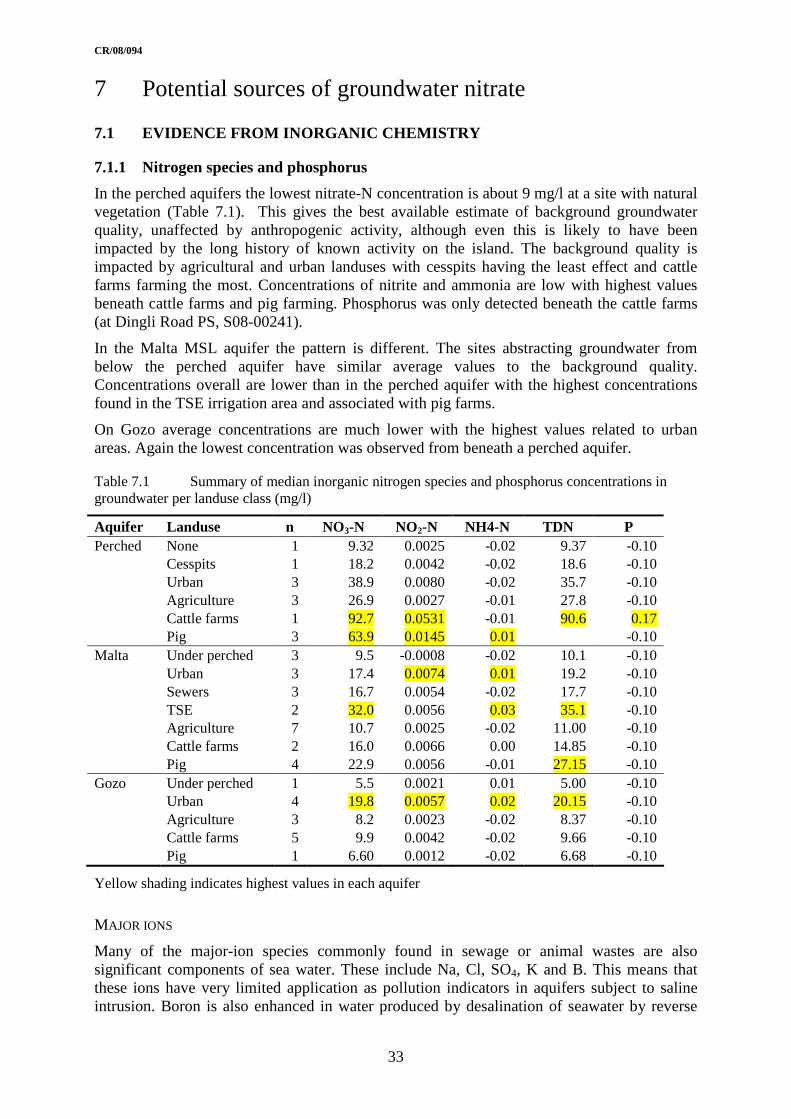
CR/08/094
33
7 Potential sources of groundwater nitrate
7.1 EVIDENCE FROM INORGANIC CHEMISTRY
7.1.1 Nitrogen species and phosphorus
In the perched aquifers the lowest nitrate-N concentration is about 9 mg/l at a site with natural vegetation (Table 7.1). This gives the best available estimate of background groundwater quality, unaffected by anthropogenic activity, although even this is likely to have been impacted by the long history of known activity on the island. The background quality is impacted by agricultural and urban landuses with cesspits having the least effect and cattle farms farming the most. Concentrations of nitrite and ammonia are low with highest values beneath cattle farms and pig farming. Phosphorus was only detected beneath the cattle farms (at Dingli Road PS, S08-00241).
In the Malta MSL aquifer the pattern is different. The sites abstracting groundwater from below the perched aquifer have similar average values to the background quality. Concentrations overall are lower than in the perched aquifer with the highest concentrations found in the TSE irrigation area and associated with pig farms.
On Gozo average concentrations are much lower with the highest values related to urban areas. Again the lowest concentration was observed from beneath a perched aquifer.
Table 7.1 Summary of median inorganic nitrogen species and phosphorus concentrations in groundwater per landuse class (mg/l)
Aquifer Landuse n NO3-N NO2-N NH4-N TDN P Perched None 1 9.32 0.0025 -0.02 9.37 -0.10 Cesspits 1 18.2 0.0042 -0.02 18.6 -0.10 Urban 3 38.9 0.0080 -0.02 35.7 -0.10 Agriculture 3 26.9 0.0027 -0.01 27.8 -0.10 Cattle farms 1 92.7 0.0531 -0.01 90.6 0.17 Pig 3 63.9 0.0145 0.01 -0.10 Malta Under perched 3 9.5 -0.0008 -0.02 10.1 -0.10 Urban 3 17.4 0.0074 0.01 19.2 -0.10 Sewers 3 16.7 0.0054 -0.02 17.7 -0.10 TSE 2 32.0 0.0056 0.03 35.1 -0.10 Agriculture 7 10.7 0.0025 -0.02 11.00 -0.10 Cattle farms 2 16.0 0.0066 0.00 14.85 -0.10 Pig 4 22.9 0.0056 -0.01 27.15 -0.10 Gozo Under perched 1 5.5 0.0021 0.01 5.00 -0.10 Urban 4 19.8 0.0057 0.02 20.15 -0.10 Agriculture 3 8.2 0.0023 -0.02 8.37 -0.10 Cattle farms 5 9.9 0.0042 -0.02 9.66 -0.10 Pig 1 6.60 0.0012 -0.02 6.68 -0.10
Yellow shading indicates highest values in each aquifer
MAJOR IONS
Many of the major-ion species commonly found in sewage or animal wastes are also significant components of sea water. These include Na, Cl, SO4, K and B. This means that these ions have very limited application as pollution indicators in aquifers subject to saline intrusion. Boron is also enhanced in water produced by desalination of seawater by reverse
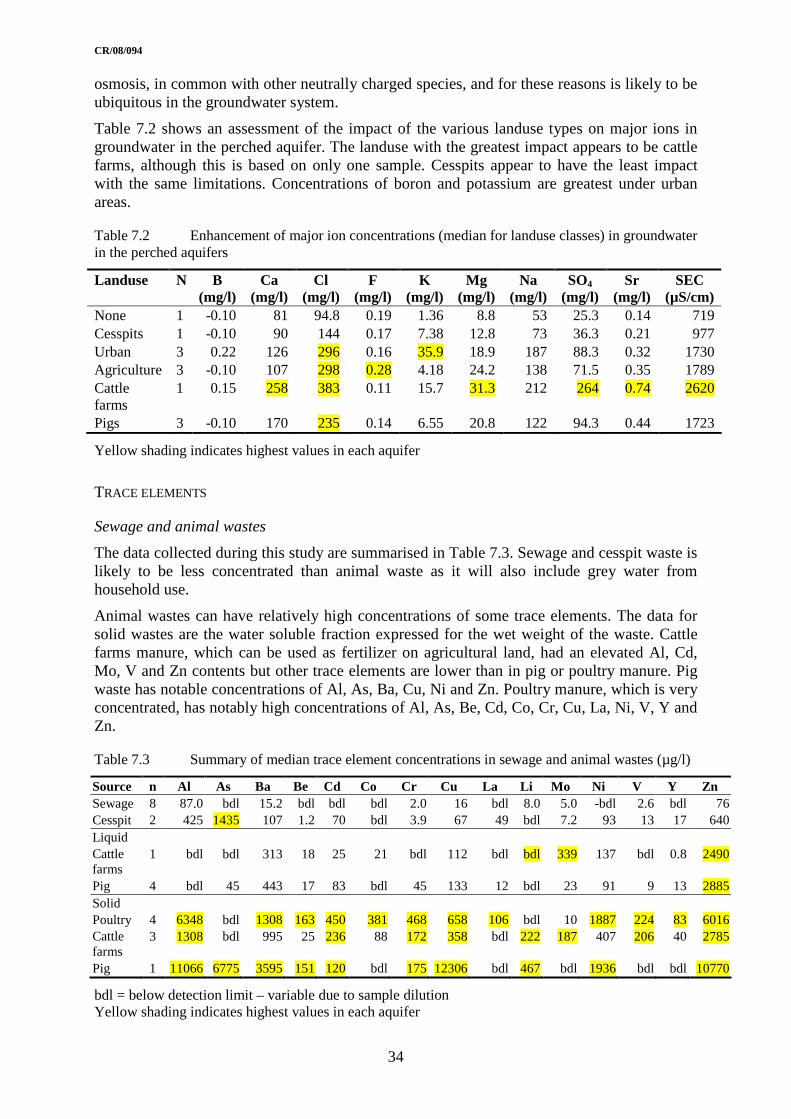
CR/08/094
34
osmosis, in common with other neutrally charged species, and for these reasons is likely to be ubiquitous in the groundwater system.
Table 7.2 shows an assessment of the impact of the various landuse types on major ions in groundwater in the perched aquifer. The landuse with the greatest impact appears to be cattle farms, although this is based on only one sample. Cesspits appear to have the least impact with the same limitations. Concentrations of boron and potassium are greatest under urban areas.
Table 7.2 Enhancement of major ion concentrations (median for landuse classes) in groundwater in the perched aquifers
Landuse N B (mg/l)
Ca (mg/l)
Cl (mg/l)
F (mg/l)
K (mg/l)
Mg (mg/l)
Na (mg/l)
SO4 (mg/l)
Sr (mg/l)
SEC (µS/cm)
None 1 -0.10 81 94.8 0.19 1.36 8.8 53 25.3 0.14 719 Cesspits 1 -0.10 90 144 0.17 7.38 12.8 73 36.3 0.21 977 Urban 3 0.22 126 296 0.16 35.9 18.9 187 88.3 0.32 1730 Agriculture 3 -0.10 107 298 0.28 4.18 24.2 138 71.5 0.35 1789 Cattle farms
1 0.15 258 383 0.11 15.7 31.3 212 264 0.74 2620
Pigs 3 -0.10 170 235 0.14 6.55 20.8 122 94.3 0.44 1723
Yellow shading indicates highest values in each aquifer
TRACE ELEMENTS
Sewage and animal wastes
The data collected during this study are summarised in Table 7.3. Sewage and cesspit waste is likely to be less concentrated than animal waste as it will also include grey water from household use.
Animal wastes can have relatively high concentrations of some trace elements. The data for solid wastes are the water soluble fraction expressed for the wet weight of the waste. Cattle farms manure, which can be used as fertilizer on agricultural land, had an elevated Al, Cd, Mo, V and Zn contents but other trace elements are lower than in pig or poultry manure. Pig waste has notable concentrations of Al, As, Ba, Cu, Ni and Zn. Poultry manure, which is very concentrated, has notably high concentrations of Al, As, Be, Cd, Co, Cr, Cu, La, Ni, V, Y and Zn.
Table 7.3 Summary of median trace element concentrations in sewage and animal wastes (µg/l)
Source n Al As Ba Be Cd Co Cr Cu La Li Mo Ni V Y Zn Sewage 8 87.0 bdl 15.2 bdl bdl bdl 2.0 16 bdl 8.0 5.0 -bdl 2.6 bdl 76 Cesspit 2 425 1435 107 1.2 70 bdl 3.9 67 49 bdl 7.2 93 13 17 640 Liquid Cattle farms
1 bdl bdl 313 18 25 21 bdl 112 bdl bdl 339 137 bdl 0.8 2490
Pig 4 bdl 45 443 17 83 bdl 45 133 12 bdl 23 91 9 13 2885 Solid Poultry 4 6348 bdl 1308 163 450 381 468 658 106 bdl 10 1887 224 83 6016 Cattle farms
3 1308 bdl 995 25 236 88 172 358 bdl 222 187 407 206 40 2785
Pig 1 11066 6775 3595 151 120 bdl 175 12306 bdl 467 bdl 1936 bdl bdl 10770
bdl = below detection limit – variable due to sample dilution Yellow shading indicates highest values in each aquifer
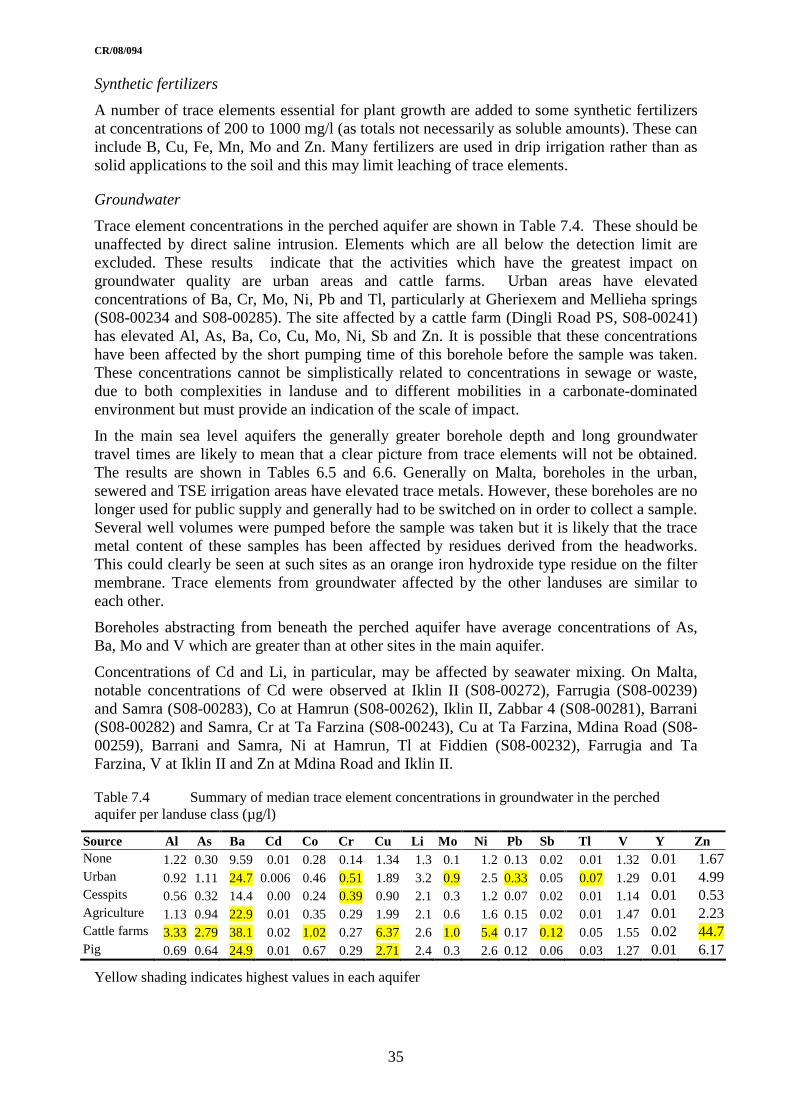
CR/08/094
35
Synthetic fertilizers
A number of trace elements essential for plant growth are added to some synthetic fertilizers at concentrations of 200 to 1000 mg/l (as totals not necessarily as soluble amounts). These can include B, Cu, Fe, Mn, Mo and Zn. Many fertilizers are used in drip irrigation rather than as solid applications to the soil and this may limit leaching of trace elements.
Groundwater
Trace element concentrations in the perched aquifer are shown in Table 7.4. These should be unaffected by direct saline intrusion. Elements which are all below the detection limit are excluded. These results indicate that the activities which have the greatest impact on groundwater quality are urban areas and cattle farms. Urban areas have elevated concentrations of Ba, Cr, Mo, Ni, Pb and Tl, particularly at Gheriexem and Mellieha springs (S08-00234 and S08-00285). The site affected by a cattle farm (Dingli Road PS, S08-00241) has elevated Al, As, Ba, Co, Cu, Mo, Ni, Sb and Zn. It is possible that these concentrations have been affected by the short pumping time of this borehole before the sample was taken. These concentrations cannot be simplistically related to concentrations in sewage or waste, due to both complexities in landuse and to different mobilities in a carbonate-dominated environment but must provide an indication of the scale of impact.
In the main sea level aquifers the generally greater borehole depth and long groundwater travel times are likely to mean that a clear picture from trace elements will not be obtained. The results are shown in Tables 6.5 and 6.6. Generally on Malta, boreholes in the urban, sewered and TSE irrigation areas have elevated trace metals. However, these boreholes are no longer used for public supply and generally had to be switched on in order to collect a sample. Several well volumes were pumped before the sample was taken but it is likely that the trace metal content of these samples has been affected by residues derived from the headworks. This could clearly be seen at such sites as an orange iron hydroxide type residue on the filter membrane. Trace elements from groundwater affected by the other landuses are similar to each other.
Boreholes abstracting from beneath the perched aquifer have average concentrations of As, Ba, Mo and V which are greater than at other sites in the main aquifer.
Concentrations of Cd and Li, in particular, may be affected by seawater mixing. On Malta, notable concentrations of Cd were observed at Iklin II (S08-00272), Farrugia (S08-00239) and Samra (S08-00283), Co at Hamrun (S08-00262), Iklin II, Zabbar 4 (S08-00281), Barrani (S08-00282) and Samra, Cr at Ta Farzina (S08-00243), Cu at Ta Farzina, Mdina Road (S08-00259), Barrani and Samra, Ni at Hamrun, Tl at Fiddien (S08-00232), Farrugia and Ta Farzina, V at Iklin II and Zn at Mdina Road and Iklin II.
Table 7.4 Summary of median trace element concentrations in groundwater in the perched aquifer per landuse class (µg/l)
Source Al As Ba Cd Co Cr Cu Li Mo Ni Pb Sb Tl V Y Zn None 1.22 0.30 9.59 0.01 0.28 0.14 1.34 1.3 0.1 1.2 0.13 0.02 0.01 1.32 0.01 1.67 Urban 0.92 1.11 24.7 0.006 0.46 0.51 1.89 3.2 0.9 2.5 0.33 0.05 0.07 1.29 0.01 4.99 Cesspits 0.56 0.32 14.4 0.00 0.24 0.39 0.90 2.1 0.3 1.2 0.07 0.02 0.01 1.14 0.01 0.53 Agriculture 1.13 0.94 22.9 0.01 0.35 0.29 1.99 2.1 0.6 1.6 0.15 0.02 0.01 1.47 0.01 2.23 Cattle farms 3.33 2.79 38.1 0.02 1.02 0.27 6.37 2.6 1.0 5.4 0.17 0.12 0.05 1.55 0.02 44.7 Pig 0.69 0.64 24.9 0.01 0.67 0.29 2.71 2.4 0.3 2.6 0.12 0.06 0.03 1.27 0.01 6.17
Yellow shading indicates highest values in each aquifer
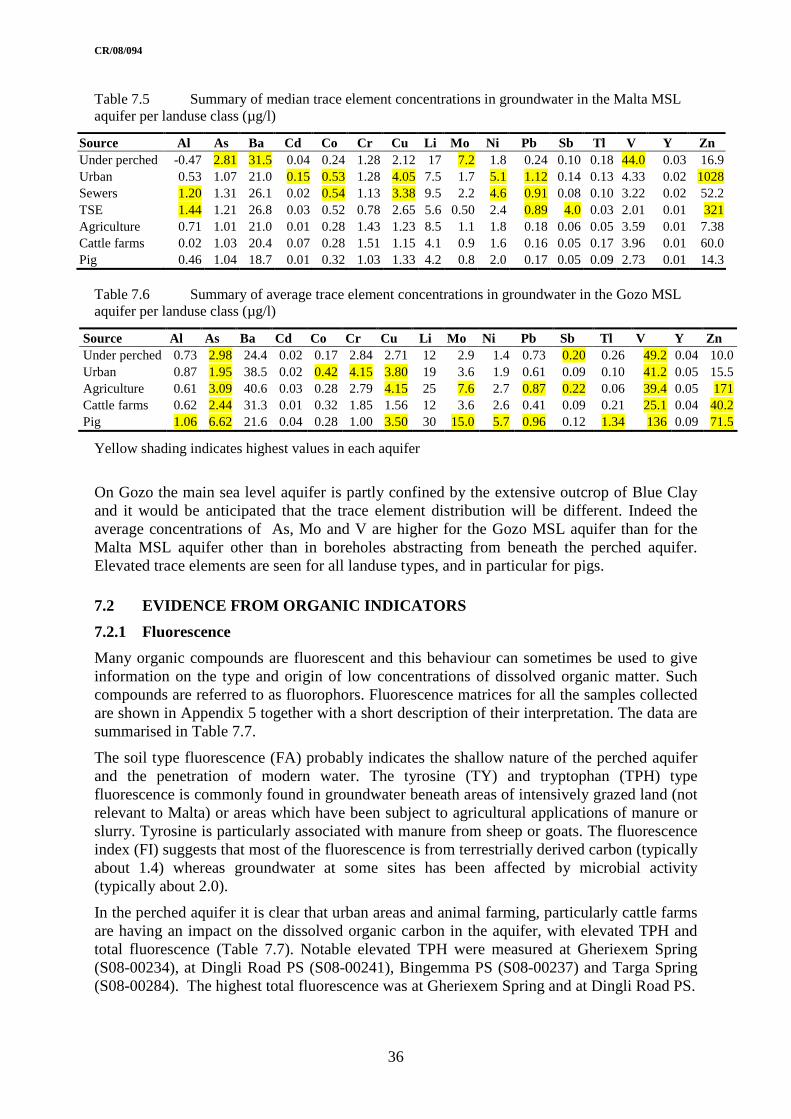
CR/08/094
36
Table 7.5 Summary of median trace element concentrations in groundwater in the Malta MSL aquifer per landuse class (µg/l)
Source Al As Ba Cd Co Cr Cu Li Mo Ni Pb Sb Tl V Y Zn Under perched -0.47 2.81 31.5 0.04 0.24 1.28 2.12 17 7.2 1.8 0.24 0.10 0.18 44.0 0.03 16.9 Urban 0.53 1.07 21.0 0.15 0.53 1.28 4.05 7.5 1.7 5.1 1.12 0.14 0.13 4.33 0.02 1028 Sewers 1.20 1.31 26.1 0.02 0.54 1.13 3.38 9.5 2.2 4.6 0.91 0.08 0.10 3.22 0.02 52.2 TSE 1.44 1.21 26.8 0.03 0.52 0.78 2.65 5.6 0.50 2.4 0.89 4.0 0.03 2.01 0.01 321 Agriculture 0.71 1.01 21.0 0.01 0.28 1.43 1.23 8.5 1.1 1.8 0.18 0.06 0.05 3.59 0.01 7.38 Cattle farms 0.02 1.03 20.4 0.07 0.28 1.51 1.15 4.1 0.9 1.6 0.16 0.05 0.17 3.96 0.01 60.0 Pig 0.46 1.04 18.7 0.01 0.32 1.03 1.33 4.2 0.8 2.0 0.17 0.05 0.09 2.73 0.01 14.3
Table 7.6 Summary of average trace element concentrations in groundwater in the Gozo MSL aquifer per landuse class (µg/l)
Source Al As Ba Cd Co Cr Cu Li Mo Ni Pb Sb Tl V Y Zn Under perched 0.73 2.98 24.4 0.02 0.17 2.84 2.71 12 2.9 1.4 0.73 0.20 0.26 49.2 0.04 10.0 Urban 0.87 1.95 38.5 0.02 0.42 4.15 3.80 19 3.6 1.9 0.61 0.09 0.10 41.2 0.05 15.5 Agriculture 0.61 3.09 40.6 0.03 0.28 2.79 4.15 25 7.6 2.7 0.87 0.22 0.06 39.4 0.05 171 Cattle farms 0.62 2.44 31.3 0.01 0.32 1.85 1.56 12 3.6 2.6 0.41 0.09 0.21 25.1 0.04 40.2 Pig 1.06 6.62 21.6 0.04 0.28 1.00 3.50 30 15.0 5.7 0.96 0.12 1.34 136 0.09 71.5
Yellow shading indicates highest values in each aquifer
On Gozo the main sea level aquifer is partly confined by the extensive outcrop of Blue Clay and it would be anticipated that the trace element distribution will be different. Indeed the average concentrations of As, Mo and V are higher for the Gozo MSL aquifer than for the Malta MSL aquifer other than in boreholes abstracting from beneath the perched aquifer. Elevated trace elements are seen for all landuse types, and in particular for pigs.
7.2 EVIDENCE FROM ORGANIC INDICATORS
7.2.1 Fluorescence
Many organic compounds are fluorescent and this behaviour can sometimes be used to give information on the type and origin of low concentrations of dissolved organic matter. Such compounds are referred to as fluorophors. Fluorescence matrices for all the samples collected are shown in Appendix 5 together with a short description of their interpretation. The data are summarised in Table 7.7.
The soil type fluorescence (FA) probably indicates the shallow nature of the perched aquifer and the penetration of modern water. The tyrosine (TY) and tryptophan (TPH) type fluorescence is commonly found in groundwater beneath areas of intensively grazed land (not relevant to Malta) or areas which have been subject to agricultural applications of manure or slurry. Tyrosine is particularly associated with manure from sheep or goats. The fluorescence index (FI) suggests that most of the fluorescence is from terrestrially derived carbon (typically about 1.4) whereas groundwater at some sites has been affected by microbial activity (typically about 2.0).
In the perched aquifer it is clear that urban areas and animal farming, particularly cattle farms are having an impact on the dissolved organic carbon in the aquifer, with elevated TPH and total fluorescence (Table 7.7). Notable elevated TPH were measured at Gheriexem Spring (S08-00234), at Dingli Road PS (S08-00241), Bingemma PS (S08-00237) and Targa Spring (S08-00284). The highest total fluorescence was at Gheriexem Spring and at Dingli Road PS.

CR/08/094
37
Table 7.7 Summary of median fluorescence measurements in groundwater per landuse class
Aquifer Landuse FA TY TPH Total FI TPH:FA Perched None 195 3 33 343 1.55 0.17 Urban 565 41 126 1048 1.97 0.23 Cesspits 183 13 45 360 1.49 0.24 Agriculture 364 13 70 606 1.39 0.19 Cattle farms 1960 329 3569 1.31 0.17 Pig 784 56 204 1307 1.79 0.26 Malta Under perched 225 17 36 415 1.72 0.20 Urban 253 67 107 560 1.49 0.42 Sewers 183 11 44 355 1.51 0.24 TSE 211 29 70 375 1.63 0.33 Agriculture 210 35 63 398 1.58 0.29 Cattle farms 555 59 168 958 1.79 0.33 Pig 218 27 44 395 1.56 0.24 Gozo Under perched 276 123 212 710 1.50 0.77 Urban 153 34 39 301 2.20 0.24 Agriculture 373 26 108 677 1.90 0.27 Cattle farms 193 19 38 362 2.08 0.19 Pig 277 11 46 508 1.79 0.17
FA = ‘fulvic acid’ area – soil type fluorescence TY = ‘tyrosine’ area – protein type fluorescence TPH = ‘trytophan’ area – protein type fluorescence FI = fluorescence index
Yellow shading indicates highest values in each aquifer
For the sea level aquifers the pattern is less distinguishable, but the impact of cattle farms on the Malta aquifer can be seen. The highest TPH and total fluorescence were at Farrugia (S08-00239), together with Iklin II and Kappella (S08-00272 and S08-00240). On Gozo, the highest TPH was at Kappella (S08-00279), and total fluorescence at Gnien is-Sultan and Sajjem (S08-00248 and S08-00254). The FI gives a mixed picture with impact from urban areas and pig farms in the perched aquifers, a cattle farm site and a site under the perched aquifer on Malta and at urban areas and cattle farms on Gozo. Results over 2 were measured at Hemsija, Tal Lewza, St Lucija, Taljana, Soil St and MMU (S08-00230, 00250, 00252, 00253, 00276 and 00277).
The TPH: FA ratio can indicate the presence of animal derived organic carbon. The highest concentrations were measured in urban springs and boreholes; Gheriexem spring, Mdina Road, Iklin II, Zabbar 4, and Kappella(Gozo) under a perched aquifer (S08-00234, 00259, 00272, 00281 and 00279).
The potential organic source terms all exhibit high FA, TY, TPH, Total and TPH: FA with sewage having a consistent elevated TPH: FA. Sewage tends to have an FI of <2 whereas solid animal wastes have FI >100.
7.2.2 Dissolved organic carbon and nitrogen
A summary of results for organic species is shown in Table 7.8. Background concentrations of dissolved organic carbon are generally <1 mg/l and concentrations in the perched aquifer are consistent with this, with the samples from Annunzjata and Bahrija springs (S08-00256 and S08-00227) being <0.8 mg/l. All other samples in the perched aquifer have greater concentrations and these are highest in Targa spring and in Dingli Road and Mizieb PS (S08-00284, 00241 and 00273). In the Malta MSL aquifer average concentrations are highest for
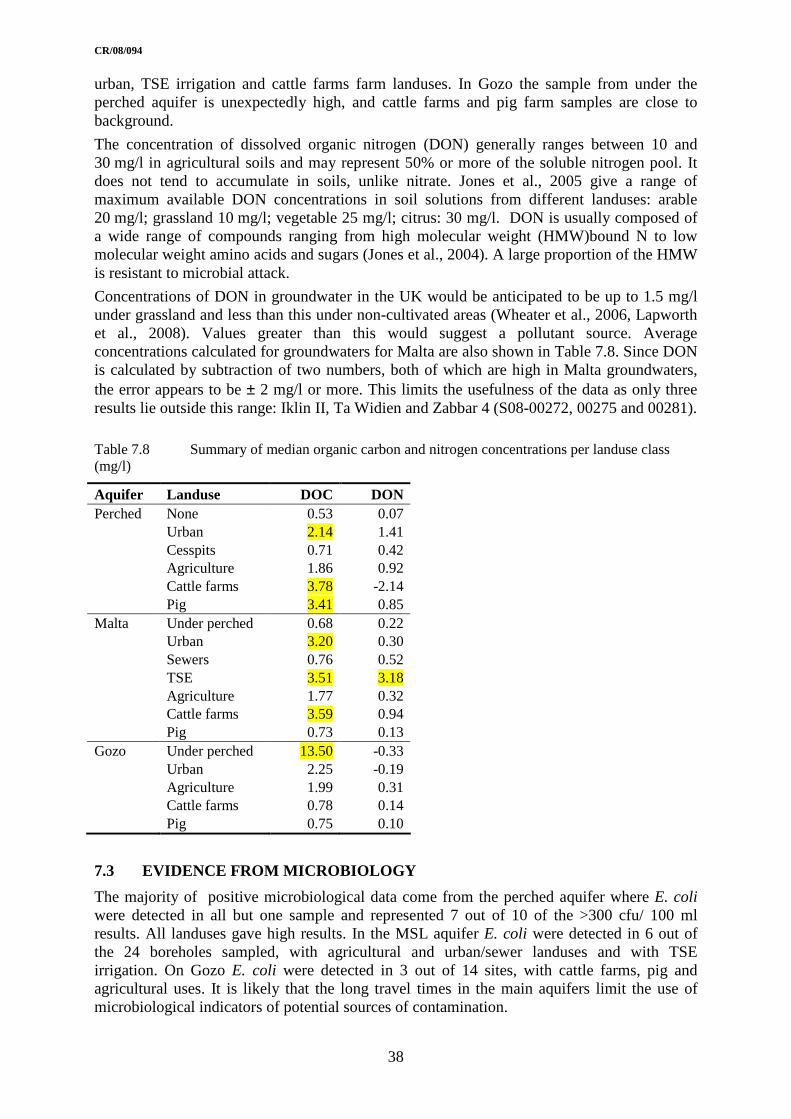
CR/08/094
38
urban, TSE irrigation and cattle farms farm landuses. In Gozo the sample from under the perched aquifer is unexpectedly high, and cattle farms and pig farm samples are close to background.
The concentration of dissolved organic nitrogen (DON) generally ranges between 10 and 30 mg/l in agricultural soils and may represent 50% or more of the soluble nitrogen pool. It does not tend to accumulate in soils, unlike nitrate. Jones et al., 2005 give a range of maximum available DON concentrations in soil solutions from different landuses: arable 20 mg/l; grassland 10 mg/l; vegetable 25 mg/l; citrus: 30 mg/l. DON is usually composed of a wide range of compounds ranging from high molecular weight (HMW)bound N to low molecular weight amino acids and sugars (Jones et al., 2004). A large proportion of the HMW is resistant to microbial attack.
Concentrations of DON in groundwater in the UK would be anticipated to be up to 1.5 mg/l under grassland and less than this under non-cultivated areas (Wheater et al., 2006, Lapworth et al., 2008). Values greater than this would suggest a pollutant source. Average concentrations calculated for groundwaters for Malta are also shown in Table 7.8. Since DON is calculated by subtraction of two numbers, both of which are high in Malta groundwaters, the error appears to be ± 2 mg/l or more. This limits the usefulness of the data as only three results lie outside this range: Iklin II, Ta Widien and Zabbar 4 (S08-00272, 00275 and 00281).
Table 7.8 Summary of median organic carbon and nitrogen concentrations per landuse class (mg/l)
Aquifer Landuse DOC DON Perched None 0.53 0.07 Urban 2.14 1.41 Cesspits 0.71 0.42 Agriculture 1.86 0.92 Cattle farms 3.78 -2.14 Pig 3.41 0.85 Malta Under perched 0.68 0.22 Urban 3.20 0.30 Sewers 0.76 0.52 TSE 3.51 3.18 Agriculture 1.77 0.32 Cattle farms 3.59 0.94 Pig 0.73 0.13 Gozo Under perched 13.50 -0.33 Urban 2.25 -0.19 Agriculture 1.99 0.31 Cattle farms 0.78 0.14 Pig 0.75 0.10
7.3 EVIDENCE FROM MICROBIOLOGY
The majority of positive microbiological data come from the perched aquifer where E. coli were detected in all but one sample and represented 7 out of 10 of the >300 cfu/ 100 ml results. All landuses gave high results. In the MSL aquifer E. coli were detected in 6 out of the 24 boreholes sampled, with agricultural and urban/sewer landuses and with TSE irrigation. On Gozo E. coli were detected in 3 out of 14 sites, with cattle farms, pig and agricultural uses. It is likely that the long travel times in the main aquifers limit the use of microbiological indicators of potential sources of contamination.

CR/08/094
39
7.4 MULTI-INDICATOR APPROACH
7.4.1 Crossplots
The crossplots set out in Appendix 4 give a graphical representation of the likely impact of saline water mixing in the MSL aquifers. For example for SEC vs nitrate-N the results for the perched aquifer broadly fall on a line whereas the MSL sites show a spread of data towards high SEC in the Gozo aquifer (Figure 7.1). Most major ions shown similar plots, K, Mg, Na Sr and possibly sulphate. The data for bicarbonate are very scattered and those for B constrained by the B detection limit. Iron and Mn do not show any relationship with nitrate. In contrast the data for Ca are clearly correlated with nitrate.
0
1000
2000
3000
4000
5000
6000
7000
0 20 40 60 80 100
Nitrate-N concentration (mg/l)
SE
C(µ
S/c
m)
0
50
100
150
200
250
300
0 20 40 60 80 100
Nitrate-N concentration (mg/l)
Ca
conc
entr
atio
n (m
g/l)
0
2
4
6
8
10
12
14
0 20 40 60 80 100
Nitrate-N concentration (mg/l)
Cu
conc
entr
atio
n (µ
g/l)
0
100
200
300
400
0 20 40 60 80 100
Nitrate-N concentration (mg/l)
TP
H
0
2
4
6
8
10
12
14
0 50 100
Background Perched Urban Perched Cesspit Perched
Agriculture Perched Cattle Perched Pig Perched
Under Perched Malta MSL Urban Malta MSL Sewer Malta MSL
TSE irrigation Malta MSL Agriculture Malta MSL Cattle Malta MSL
Pig Malta MSL: Under Perched Gozo MSL Urban Gozo MSL
Agriculture Gozo MSL Cattle Gozo MSL Pig Gozo MSL
Figure 7.1 Crossplots of selected parameters against nitrate-N

CR/08/094
40
0
20
40
60
80
100
120
140
160
180
200
0 3 6 9 12 15
DOC concentration (mg/l)
TY
0.0
0.1
0.2
0.3
0.4
0.5
0.6
0.7
0.8
0.9
1.0
0 3 6 9 12 15
DOC concentration (mg/l)
TP
H/F
A
Figure 7.2 Crossplots of selected organic indicators against dissolved organic carbon. (key as Figure 7.1)
0
0.0005
0.001
0.0015
0.0 0.2 0.4 0.6 0.8
SO4/Cl concentration
B/C
l con
cent
ratio
n
0
0.02
0.04
0.06
0.08
0.1
0.0 0.2 0.4 0.6 0.8
SO4/Cl concentration
DO
C/C
l con
cent
ratio
n
0
0.05
0.1
0.15
0.2
0.25
0.3
0.0 0.2 0.4 0.6 0.8
SO4/Cl concentration
NO
3-N
/Cl c
once
ntra
tion
0
5
10
15
20
25
0.0 0.2 0.4 0.6 0.8
SO4/Cl concentration
Tot
al F
lu/C
l con
cent
ratio
n
Figure 7.3 Crossplots of nitrate and various pollution indicators against sulphate, both axes divided by chloride (key as Figure 7.1)

CR/08/094
41
Visual inspection of the plots suggests that the majority of trace metals show little relationship to nitrate as all have some high values in samples with low nitrate. It is possible that there is some relationship with Cu in the perched aquifer. The organic indicators show little relationship with nitrate but some are possibly related to organic carbon (Figure 7.2).
Plotting both axes divided by chloride is a method of correcting the data for saline water content (Figure 7.3). This approach highlights the anomalously low chloride concentration from Barrani (S08-00282) which appears in the upper right corner for the top two plots and a possible relationship between total fluorescence and sulphate other than for Gheriexem Spring (S08-00234). Applying the same approach to potential residence time indicators is perhaps more successful (Figure 7.4). These plots show a distinction between the perched aquifers, with low residence indicators, a group of samples from under the perched aquifers, other sites on Gozo (and two sites with agricultural use in the Malta MSL, but with Middle Globigerina at outcrop) and a group of all other samples except Barrani.
0
0.001
0.002
0.003
0.004
0.005
0.006
0.0 0.2 0.4 0.6 0.8
SO4/Cl concentration
F/C
l con
cent
ratio
n
0
0.02
0.04
0.06
0.08
0.1
0.0 0.2 0.4 0.6 0.8
SO4/Cl concentration
Li/C
l con
cent
ratio
n
2010 1.42
0
0.01
0.02
0.03
0.04
0.05
0.06
0.07
0.0 0.2 0.4 0.6 0.8
SO4/Cl concentration
Mo/
Cl c
once
ntra
tion
0
0.002
0.004
0.006
0.008
0.0 0.2 0.4 0.6 0.8
SO4/Cl concentration
Sr/
Cl c
once
ntra
tion
Figure 7.4 Crossplots of various residence time indicators against sulphate, both axes divided by chloride (key as Figure 7.1)
CR/08/094
42
7.4.2 Multiple linear regression
A multiple linear regression matrix was constructed using all the quality results and the landuse class. Landuse was included by allocating a value of 1 for the major landuse at each site with other landuses being set to zero. For solutes coefficients of 0.7 or more were used in the interpretation. The coefficients are relatively weak for landuse, 0.5 in some cases but have been included. The results indicated that there are a number of different solute associations.
PERCHED AQUIFERS
• NO3-N, TDN, SEC, Ca, Co, Cu, SO4, possibly with Al, Br, Cl, Mg, Na, Sr, Y, Zn and Zr. This group has a low negative correlation with pH (R=-0.75) and a weak positive correlation with cattle farms (R=0.75);
• NO2-N, Ag, K, Mn, Mo, Ni, P, PO4, Rb, Sb, Si, TPH, TPH/FA, Total fluorescence and V, possibly with As, B, Cr and δ15N. This group had a low positive correlation with urban areas (R=0.57);
• NH4-N, Fe and Tl. This group had a weak correlation with pig farms (R=0.54);
• background and cesspit areas had generally weak negative correlations with the first group above (R=-0.6);
• agricultural areas had little or no correlation to any solutes;
• very limited or no correlation to other data: DOC, F, HCO3, Sn, Th, FI and E. Coli;
In these aquifers many trace metals have some correlation with FA and this may reflect their transport in groundwater as fulvic acid type complexes.
It is possible that the urban area data represents a component of wastewater which has been discharged or leaked to the subsurface, bypassing the soil zone. The low concentrations of NO2-N indicate possible denitrification perhaps due to the organic loading suggested by the fluorescence data.
The presence of ammonia and Fe suggests that there is some reducing water within the aquifers.
MALTA MSL
• SEC, B, Br, Cl, Mg, K, Na, Rb and SO4. Clearly intruded seawater (R= 0.8 to 0.99);
• As, Ba, F, HCO3, Li, Si, Sr, Mo, Th, Tl, V, Y, Zr This group appears to be associated with water under the perched aquifers (R=0.60 to 0.81);
• Ce, Co, Cr, Cu, La, Ni, Sb, δ15N- associated with denitrification and possibly Mn and Sn. This group may be weakly correlated with sewers (R=0.5 to 0.6);
• Cd, DOC, Pb, FA, TPH, Ty and possibly Zn and E. Coli with urban areas (R=0.56 to 0.88);
• Ca, Fe, NO3-N weakly associated with TSE irrigation (R=0.55 to 0.57);
The group of solutes associated with water from under the perched aquifers include a series of elements typical of groundwater with a relatively long residence time.
GOZO MSL
• SEC, B, Br, Cl, Mg, K, Na, Rb and SO4. Clearly intruded seawater (R=0.74 to 0.99)

CR/08/094
43
• As, F, HCO3, Li, Si, Sr, Mo, Th, Tl, V, Y, Zn, Zr. This group appears to be weakly associated with pig farms, but may also be sites under the Blue Clay as it is similar to the Malta MSL (R=0.6 to 0.91);
• Cd, Cu, DOC, Pb, FA, Total fluorescence weakly associated with agricultural areas (R=0.5 to 0.55);
• Ca, Co, Cr, NO3-N associated with urban areas (R=0.55 to 0.76);
• E. Coli associated with pig farms and Cd group as above (R=0.7 to 0.8);
• Under perched aquifer associated with DOC, Ty and TPH (R=0.8 to 0.9).
Perhaps two conclusions can be drawn from this rather confusing information. Firstly that data from the perched aquifers appears to be consistent with the derivation of nitrate from animal farming and urban areas rather than agriculture or cesspits. Secondly that a number of trace elements are associated with groundwater from beneath the perched aquifers, resulting possibly from leakage of water from the overlying Blue Clay.
7.5 EVIDENCE FROM HISTORICAL TRENDS
7.5.1 Agricultural development
Groundwater nitrate concentrations need to be considered in the context of landuse changes. The area of agricultural and unused land has declined considerably over the last 50 years as the urban area has increased (Table 7.9). Fragmentation has remained a dominant feature with almost 13,000 existing holdings of an average of only 0.8 ha each. The irrigated area has increased since 1991 with the adoption of modern irrigation techniques, mostly drip, and with TSE irrigation. Groundwater in recently urbanised areas may retain an agricultural signature.
Table 7.9 Decrease in agricultural and garrigue land area since 1956 (ha) (Meli, 1993)
Year Dry Irrigated Total agricultural
Garrigue/Waste Total
1956 17088 816 17904 2550 20433 1961 14966 693 15659 2318 18007 1966 13752 693 14445 2028 16476 1970 12578 624 13202 1931 15134 1975 12167 690 12857 1861 14718 1980 11031 586 11617 1615 13232 1982 10911 580 11491 1526 13017 1986 9878 664 10542 1444 11986 1991 9998 723 10721 1181 11902 2000 8639 1508 10147 1471 11619 2003 8545 1826 10371 1311 11682 2006 8126 2245 10371 1311 11682
7.5.2 Historical data in BRGM report
The first available analyses of groundwater in Malta show that in 1865 water in the perched aquifers was of good quality with nitrate-N concentrations of about 1 mg/l as N. A single analysis for the MSL aquifer near Marsa also at this time was about 2 mg/l as N. In the mid 1960s the Madonna spring in Mellieha was found to have a nitrate content of >300 mg/l (>68 mg/l as N) and this, along with a number of other springs, was taken out of supply at this time. Table 7.10 shows the changes in nitrate-N concentrations from 1991 to the present study.

CR/08/094
44
Table 7.10 Changes in nitrate-N concentrations from 1991 to present study
Nitrate-N concentration (mg/l) BGS id Site name Aquifer 1991 2008 Change S08-00236 Mgarr Perched 37.3 34.3 -3.0 S08-00241 Dingli Road Perched 49.7 92.7 43.0 S08-00242 Wied il-Buzbies Perched 20.7 46.9 26.2 S08-00256 Annunzjata Perched 7.1 9.32 2.2 S08-00257 Isqof Perched 36.5 63.9 27.4 S08-00258 Ghajn Tuffieha Perched 15.9 26.9 11.0 S08-00273 Mizieb Perched 8.48 9.59 1.11 S08-00284 Targa Perched 36.5 74.3 37.8 S08-00285 Madonna Perched 64.9 39.4 -25.5 Median 11.0
S08-00228 Srina Malta MSL 26.5 32.7 6.2 S08-00229 Zahra Malta MSL 18.7 13.0 -5.7 S08-00230 Hemsija Malta MSL 15.3 12.0 -3.3 S08-00231 Karbun Malta MSL 12.5 9.5 -3.0 S08-00232 Fiddien Malta MSL 7.9 8.9 1.0 S08-00238 Fulija Malta MSL 17.1 22.9 5.8 S08-00239 Farrugia Malta MSL 13.9 16.0 2.1 S08-00240 Kappella Malta MSL 9.7 10.1 0.4 S08-00243 Ta Farzina Malta MSL 15.3 16.7 1.4 S08-00244 Dawl Malta MSL 13.5 14.1 0.6 S08-00245 San Niklaw Malta MSL 10.3 10.6 0.3 S08-00246 Hal Far Road Malta MSL 10.9 10.3 -0.6 S08-00247 Schinas Malta MSL 12.5 11.8 -0.7 S08-00259 Mdina Road Malta MSL 24.9 15.4 -9.5 S08-00260 Zaruna Malta MSL 21.9 31.7 9.8 S08-00263 Ta Qali II Malta MSL 12.3 10.7 -1.6 S08-00272 Iklin II Malta MSL 11.7 17.4 5.7 S08-00283 Samra Malta MSL 28.7 35.7 7.0 Median 0.5
S08-00248 Gnien is-Sultan Gozo MSL 12.3 13.0 0.7 S08-00249 Sannat Gozo MSL 11.3 15.0 3.7 S08-00250 Tal Lewza Gozo MSL 10.5 9.0 -1.5 S08-00252 Santa Lucija Gozo MSL 11.3 8.6 -2.7 S08-00253 Taljana Gozo MSL 9.3 9.9 0.6 S08-00254 Sajjem Gozo MSL 9.3 8.2 -1.1 S08-00255 Gharb Road Gozo MSL 6.7 6.6 -0.1 S08-00275 Widien Gozo MSL 12.7 11.8 -0.9 S08-00276 Soil Street Gozo MSL 24.7 23.6 -1.1 S08-00277 MMU Gozo MSL 8.9 10.1 1.2 S08-00278 Wied l-Ghejjun Gozo MSL 7.3 6.6 -0.7 S08-00279 Kappella Gozo MSL 5.9 5.5 -0.4 S08-00280 Munxar Old Road Gozo MSL 13.7 19.8 6.1 Median -0.4
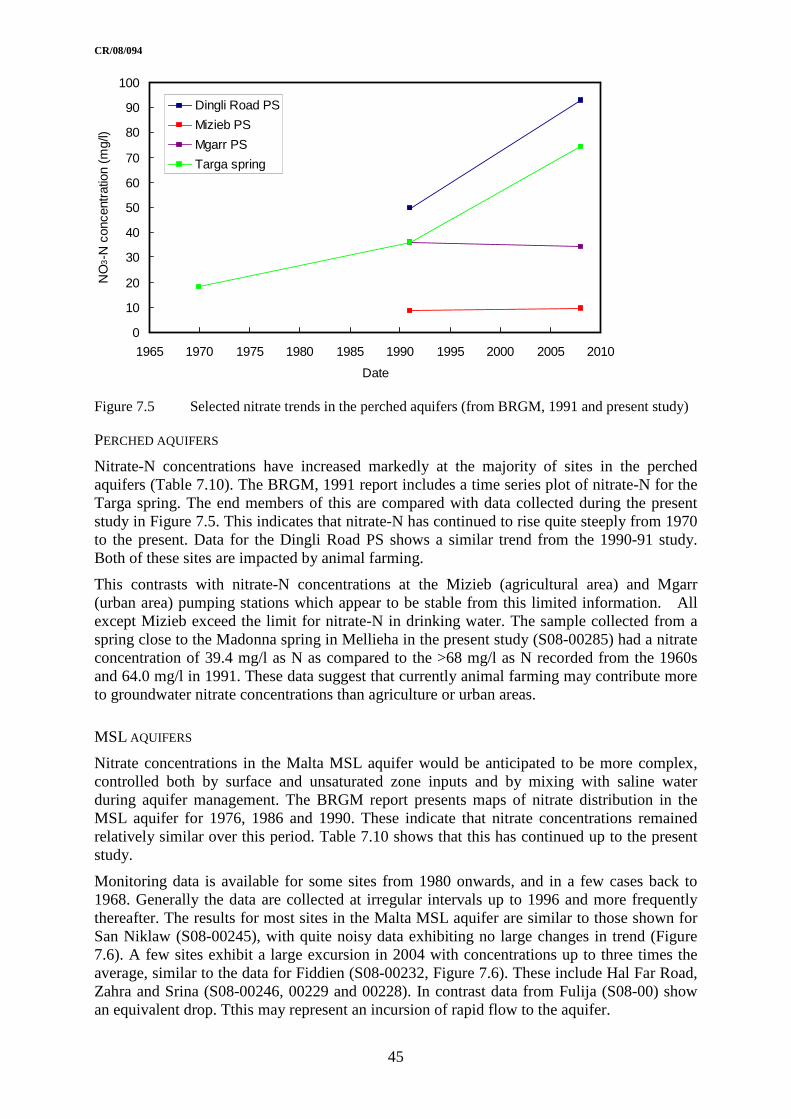
CR/08/094
45
0
10
20
30
40
50
60
70
80
90
100
1965 1970 1975 1980 1985 1990 1995 2000 2005 2010
Date
NO
3-N
con
cent
ratio
n (m
g/l)
Dingli Road PS
Mizieb PS
Mgarr PS
Targa spring
Figure 7.5 Selected nitrate trends in the perched aquifers (from BRGM, 1991 and present study)
PERCHED AQUIFERS
Nitrate-N concentrations have increased markedly at the majority of sites in the perched aquifers (Table 7.10). The BRGM, 1991 report includes a time series plot of nitrate-N for the Targa spring. The end members of this are compared with data collected during the present study in Figure 7.5. This indicates that nitrate-N has continued to rise quite steeply from 1970 to the present. Data for the Dingli Road PS shows a similar trend from the 1990-91 study. Both of these sites are impacted by animal farming.
This contrasts with nitrate-N concentrations at the Mizieb (agricultural area) and Mgarr (urban area) pumping stations which appear to be stable from this limited information. All except Mizieb exceed the limit for nitrate-N in drinking water. The sample collected from a spring close to the Madonna spring in Mellieha in the present study (S08-00285) had a nitrate concentration of 39.4 mg/l as N as compared to the >68 mg/l as N recorded from the 1960s and 64.0 mg/l in 1991. These data suggest that currently animal farming may contribute more to groundwater nitrate concentrations than agriculture or urban areas.
MSL AQUIFERS
Nitrate concentrations in the Malta MSL aquifer would be anticipated to be more complex, controlled both by surface and unsaturated zone inputs and by mixing with saline water during aquifer management. The BRGM report presents maps of nitrate distribution in the MSL aquifer for 1976, 1986 and 1990. These indicate that nitrate concentrations remained relatively similar over this period. Table 7.10 shows that this has continued up to the present study.
Monitoring data is available for some sites from 1980 onwards, and in a few cases back to 1968. Generally the data are collected at irregular intervals up to 1996 and more frequently thereafter. The results for most sites in the Malta MSL aquifer are similar to those shown for San Niklaw (S08-00245), with quite noisy data exhibiting no large changes in trend (Figure 7.6). A few sites exhibit a large excursion in 2004 with concentrations up to three times the average, similar to the data for Fiddien (S08-00232, Figure 7.6). These include Hal Far Road, Zahra and Srina (S08-00246, 00229 and 00228). In contrast data from Fulija (S08-00) show an equivalent drop. Tthis may represent an incursion of rapid flow to the aquifer.
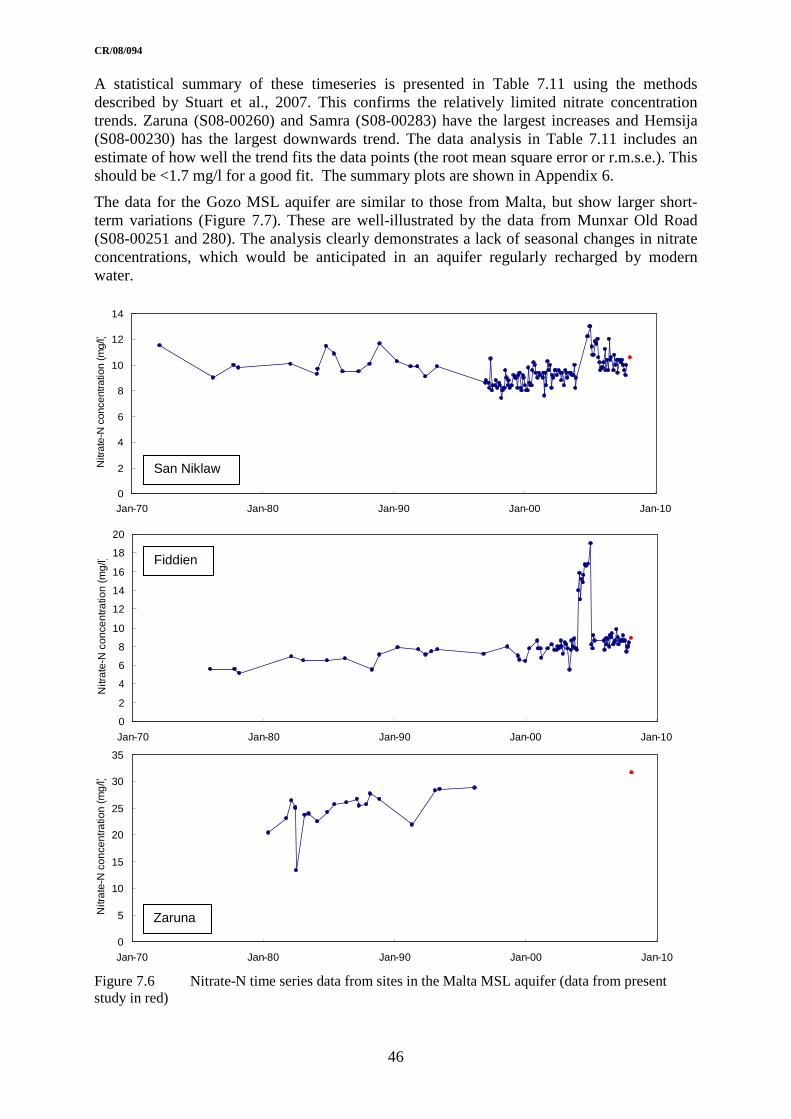
CR/08/094
46
A statistical summary of these timeseries is presented in Table 7.11 using the methods described by Stuart et al., 2007. This confirms the relatively limited nitrate concentration trends. Zaruna (S08-00260) and Samra (S08-00283) have the largest increases and Hemsija (S08-00230) has the largest downwards trend. The data analysis in Table 7.11 includes an estimate of how well the trend fits the data points (the root mean square error or r.m.s.e.). This should be <1.7 mg/l for a good fit. The summary plots are shown in Appendix 6.
The data for the Gozo MSL aquifer are similar to those from Malta, but show larger short-term variations (Figure 7.7). These are well-illustrated by the data from Munxar Old Road (S08-00251 and 280). The analysis clearly demonstrates a lack of seasonal changes in nitrate concentrations, which would be anticipated in an aquifer regularly recharged by modern water.
0
2
4
6
8
10
12
14
Jan-70 Jan-80 Jan-90 Jan-00 Jan-10
Nitr
ate-
N c
once
ntra
tion
(mg/
l)
0
2
4
6
8
10
12
14
16
18
20
Jan-70 Jan-80 Jan-90 Jan-00 Jan-10
Nitr
ate-
N c
once
ntra
tion
(mg/
l)
0
5
10
15
20
25
30
35
Jan-70 Jan-80 Jan-90 Jan-00 Jan-10
Nitr
ate-
N c
once
ntra
tion
(mg/
l)
Figure 7.6 Nitrate-N time series data from sites in the Malta MSL aquifer (data from present study in red)
San Niklaw
Zaruna
Fiddien

CR/08/094
47
0
5
10
15
20
25
30
35
Jan-70 Jan-80 Jan-90 Jan-00 Jan-10
Nitr
ate-
N c
once
ntra
tion
(mg/
l)
0
5
10
15
20
25
Jan-70 Jan-80 Jan-90 Jan-00 Jan-10
Nitr
ate-
N c
once
ntra
tion
(mg/
l)
Figure 7.7 Nitrate-N time series data from sites in the Gozo MSL aquifer (data from present study in red)
Table 7.11 Statistical summary of nitrate-N monitoring data for selected sites
Aquifer Site Start n Mean concentration
(mg/l)
Mean trend (mg/l/year)
R.m.s.e. (mg/l)
Predicted concentration in 2015 (mg/l )
Dawl 1968 103 13.4 0.01 1.2 13.8 Farrugia 1980 134 15.3 0.06 1.6 16.2 Farzina 1978 82 15.7 0.06 1.5 16.7 Fiddien 1975 85 8.8 0.10 2.5 9.4 Fulija 1978 113 19.7 0.14 3.4 22.4 Hal Far Rd 1973 80 10.5 -0.05 2.7 9.3 Hemsija 1981 122 12.6 -0.21 1.6 9.7 Samra 1981 9 22.2 0.84 5.0 45.4 San Niklaw 1972 130 9.6 0.02 1.1 9.8 Schinas 1968 123 12.0 -0.05 0.8 11.2 Srina 1977 133 26.1 0.22 6.1 31.4 Zahra 1978 132 13.5 0.02 4.1 13.0
Malta MSL
Zaruna 1980 22 25.1 0.38 2.9 35.5 Gnien is-Sultan 1976 132 12.5 0.03 2.1 13.1 Kappella 1982 121 6.1 -0.06 1.6 5.0 Munxar Old Rd 1981 135 15.7 0.37 2.9 21.2 Sannat 1968 123 14.5 -0.02 7.2 13.6 Soil Street 1981 41
Gozo MSL
Taljana 1981 122 9.9 0.00 2.7 9.2
Munxar Old Road

CR/08/094
48
Predicted concentrations in 2015 assuming that current trends continue are also shown in Table 7.11. Concentrations are likely to increase slightly in the Malta MSL with the highest concentrations at Samra and Zaruna, and possibly fall slightly in the Gozo MSL apart from Munxar Old Road.
7.6 EVIDENCE FOR DENITRIFICATION
7.6.1 Redox indicators
Relatively low concentrations of dissolved oxygen (<3 mg/l) were measured at the Barrani and Samra boreholes (S08-00282 and S08-00283) and in the Bahrija spring with urban/sewer landuse (S08-00227) and in Wied l-Ghejjun (S08-00278) where the groundwater appears to be relatively old. The lowest values for redox potential (Eh) were observed in five of the Gozo boreholes, including Wied l-Ghejjun, in Fiddien (S08-00232 beneath the perched aquifer) and in Srina (S08-00228) and Barrani boreholes. Together these indicators suggest that oxygen may be depleted in old confined groundwater and also in groundwater particularly affected by modern organic pollution. These groundwaters are the most likely areas for denitrification to occur.
7.6.2 Nitrate isotopes
The groundwater nitrate mainly has δ18O values in a narrow range between +3 and +5, and is
entirely consistent with the 'theoretical' value expected for nitrate produced by microbial nitrification in which one oxygen is derived from atmospheric O2 (+23.5) and two oxygens are derived from the water. There is one clear exception to this - sample S08-00282 (Barrani) which has elevated nitrate δ18O matching its high δ15N. This is indicative of partial denitrification, and it is interesting that this sample has the lowest dissolved oxygen content observed in this study.
Plotting nitrate δ18O versus δ15N indicates that two other samples may be showing signs of
denitrification – S08-00230 (Hemsija) and S08-00283 (Samra) - although their DO is not especially low (Figure 5.1). Simple regression of all the data - admittedly much influenced by S08-00282 - yields a slope close to 0.5, normally produced by denitrification.
CFC-12 modern fraction
0.0 0.5 1.0 1.5 2.0
CF
C-1
1 m
oder
n fr
actio
n
0.0
0.5
1.0
1.5
2.0
FarrugiaHalfar
Sajjem
Zabbar 4
Kappella, Gozo
Karbun
Figure 7.8 Modern water fractions using CFC-11 and CFC-12

CR/08/094
49
7.6.3 Evidence from CFCs
The plot in Figure 7.8 suggests that CFC-11 is depleted slightly in a number of samples which is consistent with a small amount of degradation of CFC-11. This has been well documented in reducing and slightly reducing environments. The sites which could have been reducing and therefore at which denitrification could have occurred are on both Malta and Gozo. These sites do not correspond with the sites identified as such using isotopes.
7.7 CONCLUSIONS ON NITRATE RELATIONSHIP WITH LANDUSE FR OM CO-CONTAMINANTS
In the perched aquifers the nitrate-N concentration was confirmed as being high (median 37 mg/l) with a wide range of values (9.3 mg/l to 92.7 mg/l). The majority of the sources are no longer used due to poor water quality. The background concentration is impacted by agricultural and urban landuses with cesspits having the least effect and cattle farms farming the most. This is corroborated by measurements of major and trace elements, dissolved organic carbon and by groundwater fluorescence.
In the Malta MSL aquifer the pattern is different. The sites abstracting from below the perched aquifer have similar nitrate-N concentrations to the background (median concentration 9.5 mg/l). Concentrations overall are lower than in the perched aquifers with the highest concentrations found in the TSE irrigation area (32 mg/l) and possibly those associated with pig farms (23 mg/l). The results from fluorescence analysis suggest that cattle farms, urban areas and TSE irrigation areas may be contributing organic carbon. Trace metal concentrations were elevated in boreholes in urban areas not regularly used at the time of sampling.
On Gozo, average nitrate-N concentrations are much lower with the highest values related to urban areas (20 mg/l). Again the lowest concentration was observed from beneath a perched aquifer. Low concentrations of nitrite and ammonia are also detected. Fluorescence measurements suggest a non-soil origin for the organic content of groundwater.
The nitrate co-contaminants are difficult to interpret (Table 7.12). Animal wastes, and to a more limited extent, sewage do contain elevated concentrations of trace elements but these were not found to be diagnostic. All landuses appeared to be associated with increased trace element concentrations relative to the background concentration at Annunzjata spring. Data from the perched aquifers appears to suggest the derivation of nitrate from animal farming and urban areas rather than agriculture or cesspits. Trace element concentrations are also affected by saline intrusion and by residence time in the MSL aquifers. A number of trace elements are associated with groundwater from beneath the perched aquifers, resulting possibly from leakage of water from the overlying Blue Clay.
In the perched aquifer it is clear that urban areas and animal farming, particularly cattle farms, are having an impact on the dissolved organic carbon in the aquifer as measured by fluorescence. For the sea level aquifers the pattern is less clear, but the impact of cattle farms on the Malta aquifer can be seen with an elevated protein-derived content. On Gozo, the pattern is confused with high protein-type fluorescence from under the perched aquifer and at agricultural sites. The ratio of protein type to soil-derived fluorescence can perhaps more securely indicate the presence of animal derived organic carbon. The highest ratios were measured in urban springs and boreholes. The FI, which gives an indication of the microbially derived organic content, also provides a mixed picture with impact from urban areas and pig farms in the perched aquifer, urban areas in Malta and most sites on Gozo.
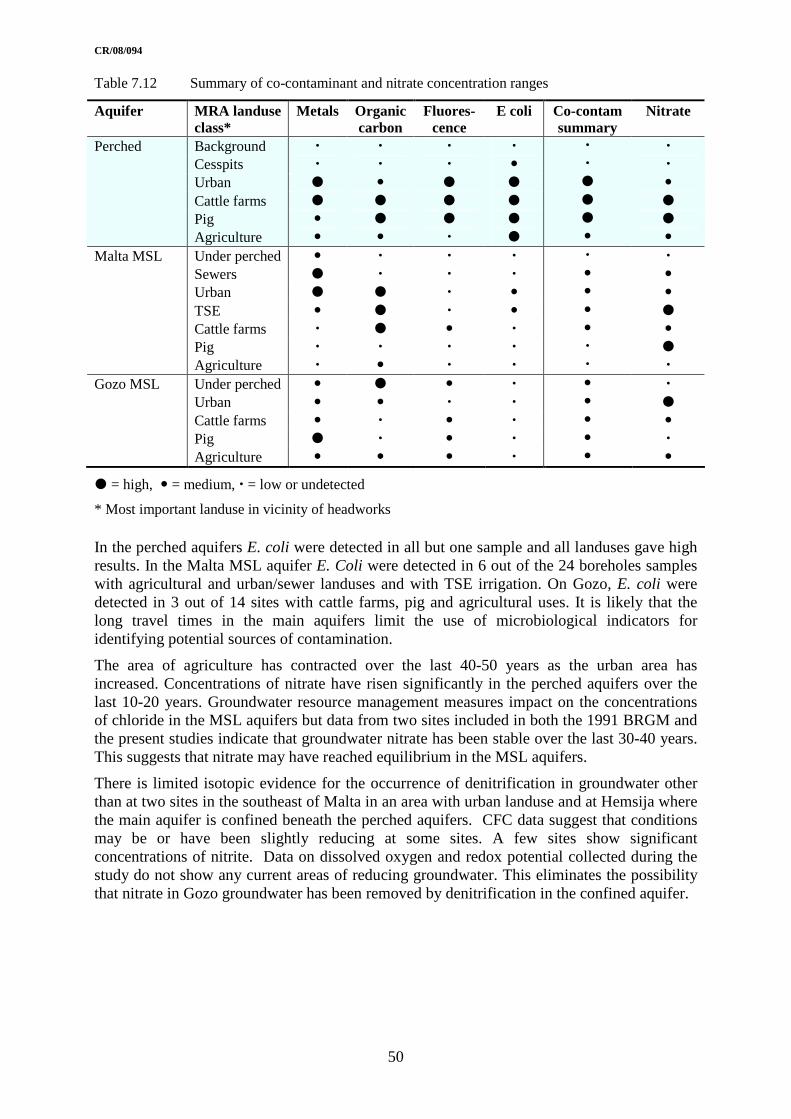
CR/08/094
50
In the perched aquifers E. coli were detected in all but one sample and all landuses gave high results. In the Malta MSL aquifer E. Coli were detected in 6 out of the 24 boreholes samples with agricultural and urban/sewer landuses and with TSE irrigation. On Gozo, E. coli were detected in 3 out of 14 sites with cattle farms, pig and agricultural uses. It is likely that the long travel times in the main aquifers limit the use of microbiological indicators for identifying potential sources of contamination.
The area of agriculture has contracted over the last 40-50 years as the urban area has increased. Concentrations of nitrate have risen significantly in the perched aquifers over the last 10-20 years. Groundwater resource management measures impact on the concentrations of chloride in the MSL aquifers but data from two sites included in both the 1991 BRGM and the present studies indicate that groundwater nitrate has been stable over the last 30-40 years. This suggests that nitrate may have reached equilibrium in the MSL aquifers.
There is limited isotopic evidence for the occurrence of denitrification in groundwater other than at two sites in the southeast of Malta in an area with urban landuse and at Hemsija where the main aquifer is confined beneath the perched aquifers. CFC data suggest that conditions may be or have been slightly reducing at some sites. A few sites show significant concentrations of nitrite. Data on dissolved oxygen and redox potential collected during the study do not show any current areas of reducing groundwater. This eliminates the possibility that nitrate in Gozo groundwater has been removed by denitrification in the confined aquifer.
Table 7.12 Summary of co-contaminant and nitrate concentration ranges
Aquifer MRA landuse class*
Metals Organic carbon
Fluores-cence
E coli Co-contam summary
Nitrate
Perched Background � � � � � � Cesspits � � � � � � Urban � � � � � � Cattle farms � � � � � � Pig � � � � � � Agriculture � � � � � � Malta MSL Under perched � � � � � � Sewers � � � � � � Urban � � � � � � TSE � � � � � � Cattle farms � � � � � � Pig � � � � � � Agriculture � � � � � � Gozo MSL Under perched � � � � � � Urban � � � � � � Cattle farms � � � � � � Pig � � � � � � Agriculture � � � � � �
� = high, � = medium, � = low or undetected
* Most important landuse in vicinity of headworks

CR/08/094
51
8 Conceptual models of Maltese aquifers
8.1 FEATURES OF LIMESTONE ISLAND AQUIFERS
Limestones consist of accretions of microscopic marine organism fossils and mineral precipitation. Coralline limestones are composed of the tests of coralline algae and the Globigerina Limestone from planktonic globigerinid foraminifera. The limestone matrix porosity and the pore structure are dependent on the nature of this source material and subsequent alteration. The matrix is often intersected by fractures. There are two types of fracture porosity: primary or unmodified fractures and secondary porosity associated with carbonate dissolution.
Limestones often allow both slow groundwater movement through the pores of the matrix and fast movement through any fractures or solution features, and therefore act as dual porosity aquifers. The proportion of slow and fast groundwater flow depends on the nature of the matrix porosity and the size of the pore throats relative to the density and continuity of fracturing or solution features. It is likely that both routes are operating in most such aquifers.
Water and soluble pollutants, such as nitrate, can move by both routes, depending on the relative permeability. Where pore throats are very small, some colloidal material or large microbiological cysts are excluded and may move preferentially through fractures. Long travel times may be anticipated in the matrix of both the unsaturated and saturated zones if the porosity is high. Pollutants may also diffuse into or out of slow-moving matrix water from the more rapidly moving fracture water.
The relationship between the volumes of storage in the aquifer and annual recharge determines average groundwater residence time. Island limestone aquifers often have short residence times of 1 or 2 years. For example, many limestone islands in the Caribbean, such as Barbados, have high rainfall but low relief and a limited volume of storage (Chilton et al., 2000). In contrast, the large storage in the Malta MSL aquifers suggest that saturated zone residence time may be of the order of decades (Sapiano et al., 2006).
8.2 TIMESCALES OF GROUNDWATER MOVEMENT
8.2.1 Groundwater tracers
Groundwater tracers such as CFC-12 and SF6 can provide an estimate of the saturated zone travel time and the groundwater flow regime. Travel time in the unsaturated zone will be additional. The results plotted in Figure 8.1 show that groundwaters in Malta and Gozo have quite different histories. The age of the groundwater can be calculated using the concentration of each of the indicators separately. For Malta, groundwater in the Main Sea Level aquifer is, on average, between 15 and 40 years old. The two sites in the Malta MSL abstracting from beneath the perched aquifer gave groundwater ages in the same range as the other sites in the aquifer. The under the perched site on Gozo was towards the lower end of the range. Five of the 23 sites had concentrations for CFCs in excess of modern rainfall, indicating that groundwater has been locally contaminated, e.g. by refrigerants and these data cannot be used. Results for SF6 tend to be much less affected by such problems and an age can be obtained. The sites affected are all on Malta: the boreholes at St Niklaw (1992), Ta Farzina (1990), and the two boreholes at Zabbar (1985) (S08-00245, 00243, 00261 and 00281). No suitable samples were obtained from the perched aquifers due to a lack of suitable sampling points.
Flow to boreholes appears to be by a number of mechanisms (Figure 8.1). The red line represents piston (matrix) flow through the saturated zone. Groundwater from the boreholes at Fiddien and Hal Far Road (S08-00232 and S08-00246) plots close to this line. The pink line is an exponential function representing the accretion of water of different ages along a
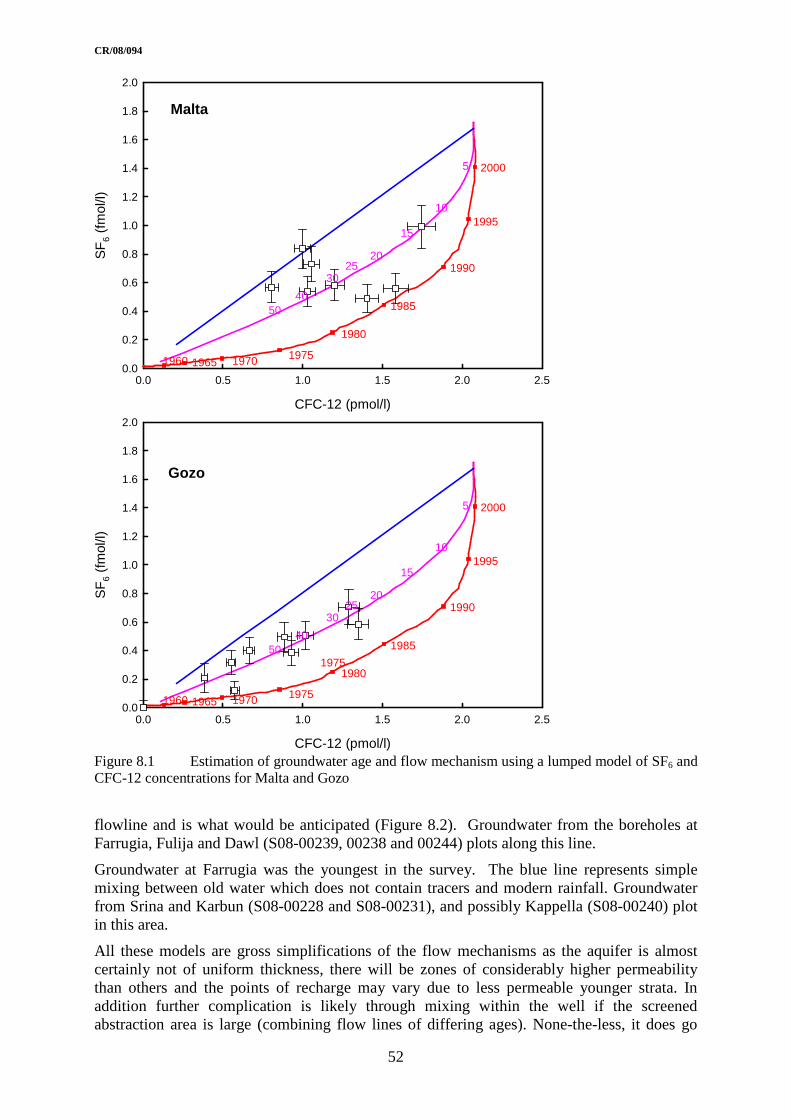
CR/08/094
52
flowline and is what would be anticipated (Figure 8.2). Groundwater from the boreholes at Farrugia, Fulija and Dawl (S08-00239, 00238 and 00244) plots along this line.
Groundwater at Farrugia was the youngest in the survey. The blue line represents simple mixing between old water which does not contain tracers and modern rainfall. Groundwater from Srina and Karbun (S08-00228 and S08-00231), and possibly Kappella (S08-00240) plot in this area.
All these models are gross simplifications of the flow mechanisms as the aquifer is almost certainly not of uniform thickness, there will be zones of considerably higher permeability than others and the points of recharge may vary due to less permeable younger strata. In addition further complication is likely through mixing within the well if the screened abstraction area is large (combining flow lines of differing ages). None-the-less, it does go
CFC-12 (pmol/l)
0.0 0.5 1.0 1.5 2.0 2.5
SF
6 (f
mol
/l)
0.0
0.2
0.4
0.6
0.8
1.0
1.2
1.4
1.6
1.8
2.0
5
10
15
2025
30
4050
2000
1995
1990
1980
19751970
1985
19651960
CFC-12 (pmol/l)
0.0 0.5 1.0 1.5 2.0 2.5
SF
6 (f
mol
/l)
0.0
0.2
0.4
0.6
0.8
1.0
1.2
1.4
1.6
1.8
2.0
5
10
15
2025
30
4050
2000
1995
1990
1980
19751970
1985
1965
1975
1960
Figure 8.1 Estimation of groundwater age and flow mechanism using a lumped model of SF6 and CFC-12 concentrations for Malta and Gozo
Malta
Gozo

CR/08/094
53
someway to giving an indication as to how old the groundwater is in terms of a mean concentration of an 'average' packet of water.
Results from Gozo show that the groundwater is generally much older (from 35 years old to pre-dating the introduction of CFCs in the 1940s). All the data points, apart possibly from Gnien is-Sultan (S08-00248), fall on the pink exponential line. The oldest groundwater in the study is from Wied l-Ghejjun (S08-00278) and the most modern on Gozo from Munxar Old Road (S08-00280).
The results can also be interpreted in terms of the proportion of mixing of old and modern water. This would suggest that groundwater on Malta would be between 20 and 50% modern; whilst on Gozo groundwater is between 0 and 35% modern.
8.2.2 Coliform bacteria
The survival of coliforms in the subsurface is thought to be limited, with a half life of the order of 11 to 18 hours (Coombs et al., 1999). Their detection in groundwater is therefore an indication of the presence of a rapid connection between the source of pathogens and groundwater. This connection can be due to poor sanitary completion of boreholes, e.g. water moving down the outside of the casing, or to rapid groundwater movement through highly permeable media such as gravels, or through fractures or fissures in the aquifer.
The perched aquifers would be anticipated to be the most vulnerable to bacterial pollution. Of the 12 samples collected from these aquifers all but two had detectable E. Coli and half had concentrations of >300 cfu/100 ml. One of the low results was from the Annunzjata Spring which was included as a background sample (S08-00256). In contrast, for the MSL aquifer on Malta 18 of the 24 samples had no detectable coliforms. On Gozo the pattern is similar with 11 out of 14 samples having no coliforms. The lack of detection of E. Coli at the majority of sample sites suggests that there are few rapid connections between the surface and the main aquifer. An obvious conclusion must be that the majority of boreholes in the MSL aquifers must be well constructed and affording protection to the aquifer. There is no obvious correspondence between fraction of modern water and coliform concentration for the MSL aquifers.
H z
R
Figure 8.2 Idealised representation of groundwater flow in the saturated zone of an unconfined aquifer of constant thickness (H) showing groundwater age distributions for purely advective transport to a point of z depth. Solid lines connect points of equal age; broken line indicates groundwater flow path
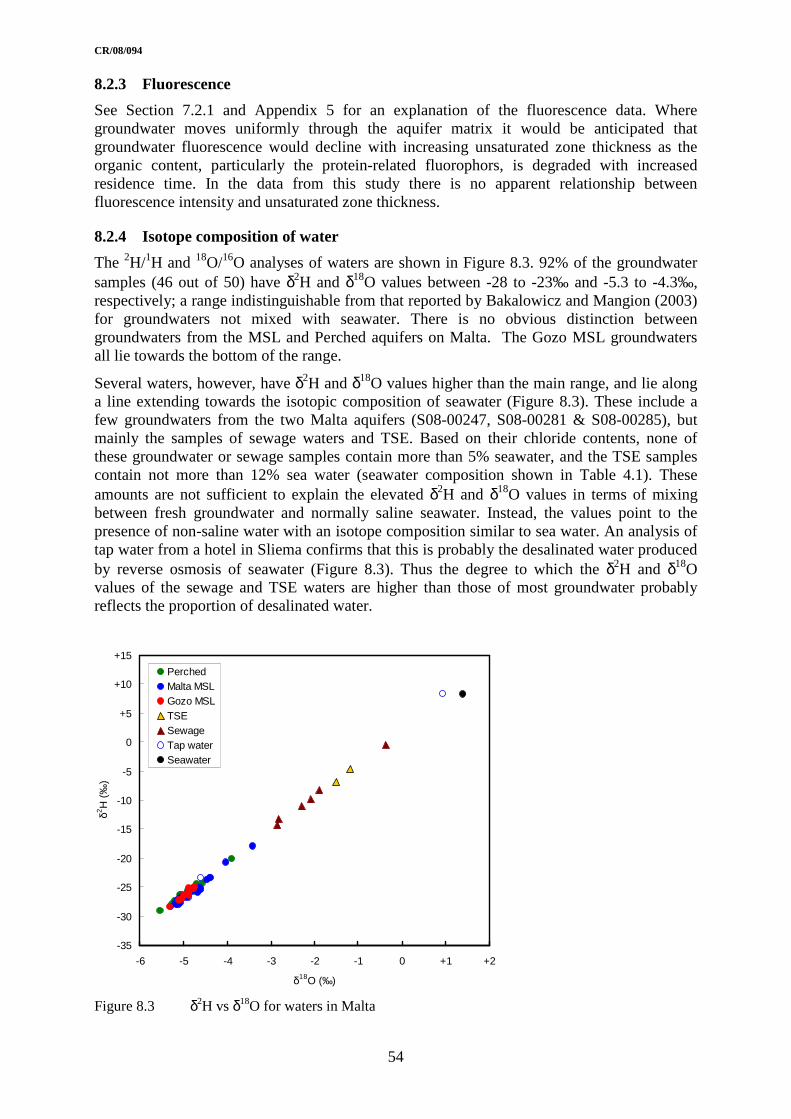
CR/08/094
54
8.2.3 Fluorescence
See Section 7.2.1 and Appendix 5 for an explanation of the fluorescence data. Where groundwater moves uniformly through the aquifer matrix it would be anticipated that groundwater fluorescence would decline with increasing unsaturated zone thickness as the organic content, particularly the protein-related fluorophors, is degraded with increased residence time. In the data from this study there is no apparent relationship between fluorescence intensity and unsaturated zone thickness.
8.2.4 Isotope composition of water
The 2H/1H and 18O/16O analyses of waters are shown in Figure 8.3. 92% of the groundwater samples (46 out of 50) have δ2H and δ18O values between -28 to -23‰ and -5.3 to -4.3‰, respectively; a range indistinguishable from that reported by Bakalowicz and Mangion (2003) for groundwaters not mixed with seawater. There is no obvious distinction between groundwaters from the MSL and Perched aquifers on Malta. The Gozo MSL groundwaters all lie towards the bottom of the range.
Several waters, however, have δ2H and δ18O values higher than the main range, and lie along a line extending towards the isotopic composition of seawater (Figure 8.3). These include a few groundwaters from the two Malta aquifers (S08-00247, S08-00281 & S08-00285), but mainly the samples of sewage waters and TSE. Based on their chloride contents, none of these groundwater or sewage samples contain more than 5% seawater, and the TSE samples contain not more than 12% sea water (seawater composition shown in Table 4.1). These amounts are not sufficient to explain the elevated δ2H and δ18O values in terms of mixing between fresh groundwater and normally saline seawater. Instead, the values point to the presence of non-saline water with an isotope composition similar to sea water. An analysis of tap water from a hotel in Sliema confirms that this is probably the desalinated water produced by reverse osmosis of seawater (Figure 8.3). Thus the degree to which the δ2H and δ18O values of the sewage and TSE waters are higher than those of most groundwater probably reflects the proportion of desalinated water.
-35
-30
-25
-20
-15
-10
-5
0
+5
+10
+15
-6 -5 -4 -3 -2 -1 0 +1 +2
δ18O (‰)
δ2H
(‰
)
PerchedMalta MSLGozo MSLTSESewageTap waterSeawater
Figure 8.3 δ2H vs δ18O for waters in Malta
CR/08/094
55
Desalination of seawater by reverse osmosis for public supply was implemented in Malta in 1983 and reached a peak in 1994/95. The detection in groundwater confirms that there probably has been some groundwater recharge probably from the sewage system over this period.
8.2.5 Tritium
Bakalowicz and Mangion (2003) also analysed samples for tritium. They found that the tritium content in rainfall was in the range 2.6 to 11 TU. In the perched aquifer, tritium ranged between 1.9 and 7.4 TU and in the Malta MSL aquifer between 0.2 and 3.1 TU, mainly being below 1.5 TU. These concentrations were interpreted as suggesting that residence time in the MSL aquifer was probably >40 years. Tritium measured at the Fiddien borehole suggested that groundwater was recharged to the MSL aquifer around the Dingli-Rabat plateau, possibly through fractures in the intervening impermeable beds.
8.3 EXISTING INFORMATION ON AQUIFER PROPERTIES
The Maltese limestones have relatively high primary porosity. Primary porosity of the Globigerina Limestone was found to be between 32 and 40 % (Cassar et al., 2008) and primary porosity of the Upper Coralline Limestones is reported to be 41-45 % (Bakalowicz and Mangion, 2003). The primary porosity of the Lower Coralline Limestone is lower and more variable, ranging from 7 to 20 %, (Bakalowicz and Mangion, 2003). There are few data on matrix permeability although Bakalowicz and Mangion (2003) suggest that it is generally low, and report that permeability (presumably primary) for the Upper Coralline Limestone is around 1 × 10⁻⁶ cm/s (or 9 × 10⁻⁴ m/d). BRGM (1991) report that permeability is higher in unfractured samples from the Upper Coralline than the Lower Coralline. They also report that vertical permeability in the Globigerina limestone is 10-7 m/s. Flow in the matrix in all three limestones will therefore be slow. Diffusional exchange of solutes between the porous low permeability matrix and faster flowing water in the fracture/fissure aquifer components is likely to have the effect of initially slowing down the rate of contaminant transport through the aquifer, but will also prolong contaminant residence times.
There is very little published hydraulic conductivity or transmissivity data. For the Lower Coralline Limestone, hydraulic conductivity from pumping tests is reported as 400 × 10-6 m/s (35 m/d) and transmissivity as between 10-4 and 10-3 m2/s (8 to 86 m2/d) (Bakalowicz and Mangion, 2003). This is quite low transmissivity compared to carbonate aquifers in the UK, for example regional data for the Chalk, which has similar hydrogeological characteristics to the Maltese Coralline limestones, indicate that median transmissivity (per region) varies from 410 to 1800 m2/d (Allen et al., 1997), although the aquifer thickness is generally greater. The Chalk is a mildly karstic carbonate aquifer with high porosity. Allen et al. (1997) report that the UK average Chalk porosity is 34 %. The major UK Jurassic limestone aquifers have regional mean transmissivities of between 139 and 318 m2/day (Allen et al., 1997). These limestones have more karstic characteristics than the Chalk (although cave development in both aquifers is rare and small-scale). The Jurassic limestones have lower mean matrix porosities of between 14.5 and 19.1 %.
In both the UK Chalk and the UK Jurassic limestones higher transmissivity is associated with solutional enlargement of fractures to form fissures and small conduits. It is therefore likely that in the Maltese limestones transmissivities exceeding 1000 m2/d will also occur locally where primary fractures have been modified by dissolution. This is most likely in the Upper and Lower Coralline Limestones where small-scale solutional fissures have been observed. There are also a small number of currently hydrologically inactive large caves in the Upper and Lower Coralline Limestones indicating the potential for dissolution in these aquifers, although large-scale currently hydrologically active caves do not appear to occur. Although there are no pumping test data reported for the Upper Coralline Limestone, BRGM (1991)
CR/08/094
56
report that springs in the Upper Coralline limestone are characterised by high turbidity, bacteriological contamination, and a rapid response to rainfall indicating high transmissivity and suggesting that the aquifer is karstic and that rapid groundwater flow is common. The low transmissivities observed in the Lower Coralline limestone suggests that it may be less karstic and have lower permeability. However large scale fossil cave development in the Lower Coralline limestone at Ghar Dalam indicates that the aquifer is susceptible to dissolution, and the lack of karstic indicators (turbidity, bacteriological contamination etc.) may be a function of attenuation and slow travel times in the Globigerina Limestone which overlies most of the Lower Coralline limestones.
Solutional enlargement of fractures is not observed in the Globigerina Limestone which is in consequence likely to have lower transmissivity. The Globigerina limestone is subdivided into the Upper, Middle and Lower members. The Middle Globigerina is a marly limestone which is likely to have lower permeability than the Upper and Lower Globigerina. Where the Upper or Middle Globigerina outcrop at the surface recharge through to the underlying Lower Coralline limestone is therefore likely to be limited by the low permeability Middle Globigerina.
The BRGM survey carried out in 1990 (BRGM, 1991) found that pollutant concentrations, and in particular nitrate, in private boreholes varied spatially over quite short distances in some areas. This was ascribed to low pollutant mobility, presumably as a result of the low transmissivity.
Overall travel times in the Lower Coralline Limestone are low compared to similar environments elsewhere. The geological reasons for this are not clear, but a consistent picture emerges of long travel times, and low levels of faecal contamination. Table 8.1 summarises the differences in hydrogeological setting of the three aquifers
Table 8.1 Summary of groundwater regimes in the Maltese aquifers
Perched Malta MSL Gozo MSL
Semi-permeable cover None Part Large part Recharge Direct Direct & influenced by
cover Mainly influenced by cover
Depth to WT (m) 20 - 50 Variable – up to 190 Variable – up to 100 Unsaturated zone travel time Days- years Years – decades Decades Groundwater saturated zone age (years)
Modern 15 – 40 25 – 60
8.4 CONCEPTUAL MODELS OF GROUNDWATER FLOW
This section integrates existing information on groundwater residence times and aquifer property data together with other data to construct conceptual models of groundwater behaviour in the three aquifers. These are presented below as annotated schematic cross-sections.
8.4.1 Perched aquifers
The conceptual model for the perched aquifers assumes (Figure 8.4):
• these aquifers are present in the Upper Coralline Limestone in the western part of Malta. They are reported to be of limited saturated thickness;
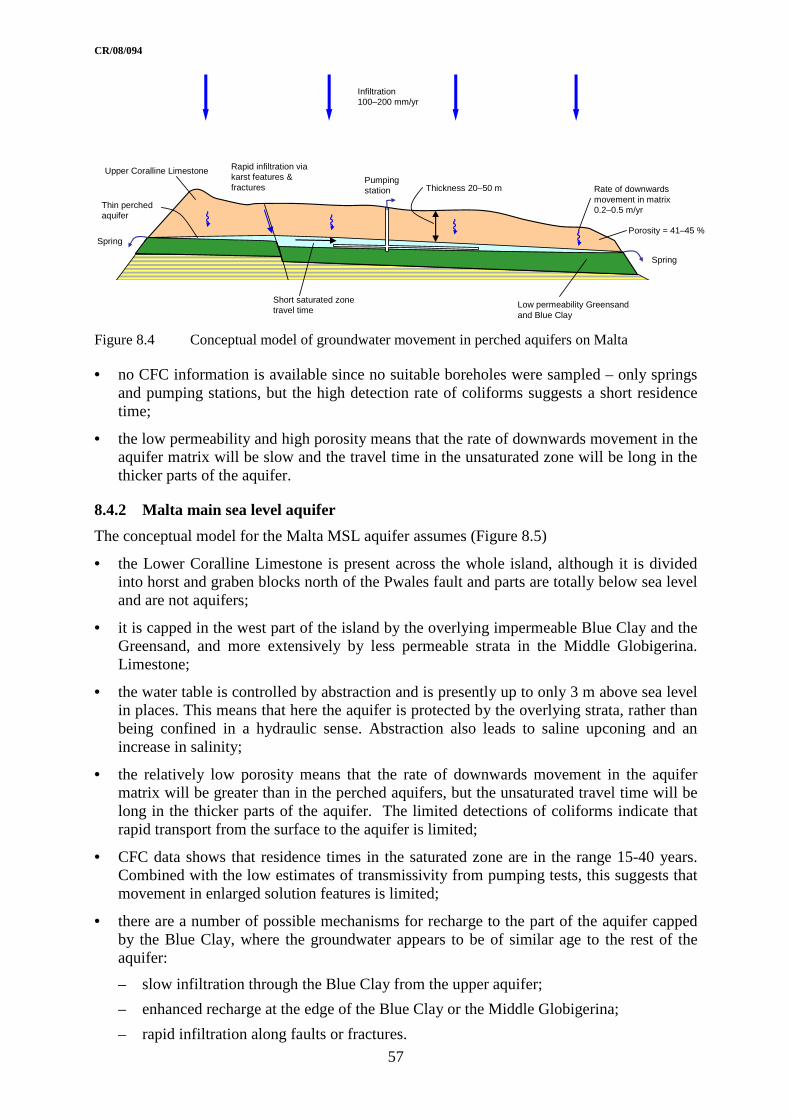
CR/08/094
57
Spring
Spring
Porosity = 41–45 %
Rate of downwards movement in matrix 0.2–0.5 m/yr
Upper Coralline Limestone
Low permeability Greensand and Blue Clay
Thin perched aquifer
Rapid infiltration via karst features & fractures
Infiltration 100–200 mm/yr
Thickness 20–50 m
Short saturated zone travel time
Pumping station
Figure 8.4 Conceptual model of groundwater movement in perched aquifers on Malta
• no CFC information is available since no suitable boreholes were sampled – only springs and pumping stations, but the high detection rate of coliforms suggests a short residence time;
• the low permeability and high porosity means that the rate of downwards movement in the aquifer matrix will be slow and the travel time in the unsaturated zone will be long in the thicker parts of the aquifer.
8.4.2 Malta main sea level aquifer
The conceptual model for the Malta MSL aquifer assumes (Figure 8.5)
• the Lower Coralline Limestone is present across the whole island, although it is divided into horst and graben blocks north of the Pwales fault and parts are totally below sea level and are not aquifers;
• it is capped in the west part of the island by the overlying impermeable Blue Clay and the Greensand, and more extensively by less permeable strata in the Middle Globigerina. Limestone;
• the water table is controlled by abstraction and is presently up to only 3 m above sea level in places. This means that here the aquifer is protected by the overlying strata, rather than being confined in a hydraulic sense. Abstraction also leads to saline upconing and an increase in salinity;
• the relatively low porosity means that the rate of downwards movement in the aquifer matrix will be greater than in the perched aquifers, but the unsaturated travel time will be long in the thicker parts of the aquifer. The limited detections of coliforms indicate that rapid transport from the surface to the aquifer is limited;
• CFC data shows that residence times in the saturated zone are in the range 15-40 years. Combined with the low estimates of transmissivity from pumping tests, this suggests that movement in enlarged solution features is limited;
• there are a number of possible mechanisms for recharge to the part of the aquifer capped by the Blue Clay, where the groundwater appears to be of similar age to the rest of the aquifer:
– slow infiltration through the Blue Clay from the upper aquifer;
– enhanced recharge at the edge of the Blue Clay or the Middle Globigerina;
– rapid infiltration along faults or fractures.

CR/08/094
58
Spring
Enhanced recharge at clay margin?
Borehole
Pumping station
Impermeable Blue Clay
Gallery
Fault
Saline
Fault
BoreholePoorly permeable, fractured Globigerina Limestone
Natural groundwater flow
Rate of downwards movement in matrix 0.5–2.8 m/yr
Porosity = 7–20 %
Rapid infiltration via karst features & fractures?
Saturated travel time 15-40 years
Infiltration 100–200 mm/yr
Natural direction of groundwater flow
SW NEGroundwater drawn under perched aquifers by abstraction
Lower Coralline Limestone
Saline upconing
UpperCoralline Limestone
Figure 8.5 Conceptual model of groundwater movement in the Malta MSL aquifer

CR/08/094
59
Enhanced recharge at clay margin?
Borehole
Impermeable Blue Clay
Fault
Fault
Borehole
Poorly permeable, fractured Globigerina Limestone
Natural direction of groundwater flow
Rate of downwards movement in matrix 0.5–2.8 m/yr
Porosity = 7–20 %
Rapid infiltration via karst features & fractures?
Saturated travel time 35->60 years
Infiltration 100–200 mm/yr
SW NEGroundwater drawn under perched aquifers by abstraction
Lower Coralline Limestone
Upper Coralline Limestone
Saline upconing
Figure 8.6 Conceptual model of groundwater movement in the Gozo MSL aquifer

CR/08/094
60
8.4.3 Gozo main sea level aquifer
The conceptual model for the Gozo MSL aquifer assumes (Figure 8.6):
• the Lower Coralline Limestone aquifer is present across the whole island;
• it is extensively capped by the impermeable Blue Clay and the Greensand and by less permeable strata in the Middle Globigerina Limestone;
• the water table is controlled by abstraction and is presently only a few metres above sea level. This abstraction also leads to extensive saline upconing and an increase in salinity;
• the relatively low porosity means that the rate of downwards movement in the aquifer matrix will be greater than in the perched aquifers but the unsaturated travel time will be long in the thicker parts of the aquifer. The limited number of detections of coliforms indicates that rapid transport from the surface to the aquifer is limited except where the Lower Coralline Limestone is at outcrop;
• CFC data shows that the residence time in the saturated zone is in the range 30-60 years. Combined with the low estimates of transmissivity from pumping tests this suggests that movement in enlarged solution features may be limited.
• there are a number of possible mechanisms for recharge to the part of the aquifer capped by the Blue Clay. The single groundwater age from this part of the aquifer was in the older part of the range of the rest of the aquifer. Possible mechanisms include:
– slow infiltration through the Blue Clay from the upper aquifers;
– enhanced recharge at the edge of the Blue Clay;
– rapid infiltration along faults or fractures.
8.4.4 Geological controls on distribution of nitrate and other solutes
Proportional symbol plots can be helpful in visualising the spatial relationship between concentration and geological setting. The plot for nitrate clearly demonstrates the consistently high nitrate concentrations present in samples from the perched aquifers (Figure 8.7). In the Malta MSL aquifer, nitrate concentrations are more variable. Nitrate concentrations appear to have some relationship with geology, with the highest concentrations occurring where the Lower Coralline Limestone is at outcrop. On Gozo, nitrate concentrations in the MSL aquifer are consistently lower than those on Malta. Low nitrate concentrations occur on outcrops of all strata from the Blue Clay Formation to the Lower Globigerina Limestone, but most samples were from boreholes on the outcrop of the Upper Globigerina Limestone. Of the three samples that have slightly higher nitrate concentration, one is on the Middle Globigerina and two are on the Upper Globigerina but close to the boundary with the Lower Globigerina Limestone. Overall there is some suggestion from the spatial data that nitrate concentrations are lower where there is a greater thickness of Globigerina Limestone between the surface and the abstraction from the Lower Coralline Limestone.
The distribution of chloride and other major ion concentrations confirms the established pattern of saline intrusion with high values for the Gozo MSL and some parts of the south of Malta (Figure 8.8). The perched aquifers are in the lower part of the range. This is likely to be due to the pattern of abstraction and recharge rather than directly to geological factors.
For E. Coli the perched aquifers generally have high concentrations. The spatial pattern for the Malta MSL aquifer shows that the greatest concentrations are associated with Middle Globigerina outcrops (Figure 8.9). For Gozo concentrations are highest in the northwest of the island. It is not clear what mechanism is controlling these values. Proportional plots are shown in Appendix 3.

CR/08/094
61
Figure 8.7 Proportional symbol plot for nitrate-N concentrations overlaid on geology
Figure 8.8 Proportional symbol plot for chloride concentrations overlaid on geology

CR/08/094
62
Figure 8.9 Proportional symbol plot for E. Coli concentrations overlaid on geology
Figure 8.10 Proportional symbol plot for molybdenum concentrations overlaid on geology

CR/08/094
63
The distribution of molybdenum is clearly geologically controlled with the highest concentrations in sources abstracting from beneath the confining Blue Clay cover in the Dingli area on Malta and also on Gozo (Figure 8.10). Concentrations are uniformly low in the perched aquifers and the unconfined MSL aquifer on Malta. Interestingly the highest concentrations in the Malta MSL are associated with areas of Middle Globigerina outcrop and may suggest that this is reducing infiltration to the underlying aquifers. A similar pattern is seen in other residence time indicators such as Li and 13C, but less clearly as these are also affected by other processes.
8.4.5 Controls on nitrate distribution in the different aquifers
There are significant differences in nitrate concentrations between the perched and MSL aquifers with the perched aquifers having the highest concentrations and the Gozo MSL aquifer the lowest. The reasons for this are not clear but there are several possibilities:
• difference in recharge concentration due to a long-term reduction in the area of agricultural land, the relatively recent increase in irrigated agriculture on the Malta MSL aquifer or to small-scale landuse patterns;
• dilution of modern recharge by older, low-nitrate water;
• differences in recharge distribution due to less permeable strata present at the surface impeding or delaying recharge and possibly enhanced recharge at the edge of such areas from run-off;
• differences in unsaturated zone thickness and therefore speed of arrival of modern concentrations at the water table.
Nitrate concentrations in the perched aquifer continue to rise in some areas, whereas there has been little evidence for rising concentrations in the Malta MSL over the last 30 to 40 years. This indicates that the MSL has reached an apparent equilibrium between surface sources and abstracted concentrations. However, the likely high proportion of slow matrix flow will mean that there is potential for the diffusion of solutes, including nitrate, from larger voids, fractures, fissures and conduits, into the matrix thereby delaying the downwards movement of solutes. This travel time may be very long in many parts of the MSL aquifers and there may still be high nitrate water yet to arrive, eventually bringing nitrate concentrations to the levels currently seen in the perched aquifers in some areas (Figure 8.11).
The recharge areas on Gozo look to be quite limited and it may be that the MSL aquifer receives a significant proportion of older, lower nitrate, recharge from slow infiltration through the overlying less-permeable strata.
8.4.6 Summary
The study has confirmed elevated nitrate throughout the aquifers.
The three aquifers have different hydrogeological regimes:
• the perched aquifers have short groundwater residence times, the highest and rising nitrate concentrations;
• the Malta MSL has long residence times 15-40 years, and lower and more stable nitrate concentrations;
• the Gozo MSL has the longest residence times, 25-60 years, and the lowest nitrate concentrations;
• the reasons for the different nitrate concentrations and trends are not clear.

CR/08/094
64
����������������
�����������������������
����
����������� Soil
Saturated zone pathway
Water table
Dominant vertical flowdepends on: thicknessrechargeporosity(fractures)
Dominant lateral flowdepends on: hydraulic gradienthydraulic conductivityeffective porositythickness(fractures)
Unsaturated zone pathway
Aerobic environment. Possible nitrification. Very little attenuation by sorption or denitrification, transport dominated by diffusion exchange between fractures and matrix
Transport dominated by dilution and diffusion exchange
Mixing and storage in soil pool. Soil nitrogen processes including nitrification
������
������������������������������������������������������
Fertilizer
Animal waste
������������������������������������������������������
Sewer gallery
Borehole
Travel time0.5 – 3 m/yr
Average groundwater age - decades
Groundwater movement Nitrogen processes
Figure 8.11 Groundwater movement and nitrogen processes in the Malta MSL aquifers

CR/08/094
65
9 Conclusions and technical recommendations
9.1 CONCLUSIONS
9.1.1 Present nitrate concentrations in groundwater
In the perched aquifers the nitrate concentration was confirmed as being high, with a median of 164 mg/l (37 mg/l as N) and with a wide range of values with the majority of the supplies no longer used due to poor water quality. In the MSL aquifers, concentrations are more moderate and more consistent ranging from 10 mg/l to 159 mg/l (2.3 to 36 mg/l as N) with a median value of 62 mg/l (14 mg/l as N) in the Malta aquifer and from 24 mg/l to 106 mg/l (5.4 mg/l to 24 mg/l as N) with a median value of 44 mg/l (10 mg/l as N) in Gozo. Nitrate concentrations have risen significantly in the perched aquifers over the last 10-20 years. In the MSL aquifers groundwater nitrate appears to have been largely stable over the last 30-40 years.
9.1.2 The sources of nitrate in groundwater
The groundwater nitrate stable isotope values reflect the original sources of nitrogen and oxygen as modified by any subsequent chemical transformation. The similarities between the nitrate isotopic signature for the three aquifers suggest that the source/s of nitrate are the same, and that differences in nitrate concentrations may relate to different hydrology.
Nitrogen isotopes showed that direct inputs of fertilizer (from run off after rainfall) or sewage derived nitrate (from leaking sewers) are probably not major contributors to groundwater nitrate. The low δ15N and δ18O values rule out fertilizer nitrate as a direct source, and the very low δ15N value of fertilizer ammonium also makes it an unlikely source of groundwater nitrate. The measured low δ15N and calculated higher δ18O value of sewage-derived nitrate also do not support a sewage source for the groundwater nitrate.
Leaching of nitrate from cultivated soils is likely to be the most important source, though derivation from animal wastes could not be discounted. Assuming that soil nitrification produces nitrate with similar δ15N values, the soil values coincide very closely to those of nitrate in the groundwater. The relatively low δ15N values of most of the samples compared to groundwater suggests that most animal waste would not be a direct source of nitrate in the groundwater. Measured δ15N values are greatly affected by loss of gaseous nitrogen during decomposition during storage, which leads to an increase in the δ15N value of the residual nitrogen. Thus the animal wastes with relatively low values could produce nitrate with a δ15N value in the range of that for groundwater during storage. Animal wastes must therefore be a possible source of the groundwater nitrate.
In the case of a soil nitrate source it must be emphasised that the isotope data do not rule out inorganic fertilizers and/or animal wastes as the original source of the nitrogen. The data are compatible with a process whereby nitrogen from inorganic fertilizers and/or animal wastes is assimilated into the soil organic nitrogen pool, and takes on the isotopic composition of this pool during the cycling of nitrogen attendant on cultivation, before nitrification and leaching to the underlying groundwater.
Water quality in the MSL aquifers is controlled both by water-rock reactions with the limestone matrix and by saline intrusion, as well as by pollution from the surface. Many solutes are also present in sewage and animal waste and they would otherwise be useful indicators for nitrogen sources. The nitrate co-contaminants are therefore difficult to interpret and the results were equivocal with limited relationship between current landuse and groundwater quality.
CR/08/094
66
9.1.3 Timescales of groundwater flow
A key finding of the study has been the confirmation of the long saturated zone residence times in the MSL aquifers. This has important implications for any relationship between present-day activities and groundwater concentration and it would appear unrealistic that a clear pattern could be anticipated. The lack of widespread rapid pathways from the surface to the water table as deduced from microbiological evidence suggest that a major part of infiltration may occur by relatively slow flow through the aquifer matrix. The travel time for nitrate from the surface to an abstraction point could be several decades at some sites.
The nitrate stored in aquifer porewaters will act as a secondary source for a long period even if surface applications were to cease completely. If disposal and management of solid animal wastes were to be targeted as the most important source of nitrate contamination it is unlikely that significant improvements would be seen for several years or even decades.
9.2 POSSIBLE FURTHER INVESTIGATIONS
The following activities would contribute to an increased understanding of nitrate transport and storage in the groundwater system, which would inform the design of appropriate programmes of measures and contribute to the prediction of the timescale required for improvements to groundwater quality to be effected.
9.2.1 Determine nitrate leaching from cultivated soils
Collect leaching data from the soil root zone in arable and horticultural areas. This would confirm that leaching from agricultural soils is a major source of nitrate in groundwater and inform the calculation of the nitrogen application reductions which would need to be made to bring leaching down to the level required for groundwater to meet the regulatory obligations.
This is difficult to do in this type of aquifer as typical samplers such as porous pots (vacuum lysimeters) are problematic to install in fractured media and structured clay soils. It may be possible to employ wick samplers or zero tension lysimeters (interception trays) which may be better at intercepting macropore flow (Holder et al., 1991; Zhu et al., 2002).
9.2.2 Determine nitrate storage in the unsaturated zone
Investigate the unsaturated zone porewater concentrations by cored drilling and extraction of porewater. This has been successfully used for limestones in the UK to identify the amount of nitrate held in store in the unsaturated zone (Smith-Carington et al., 1983). This would confirm whether stored nitrate in the unsaturated zone will lead to future increases in groundwater nitrate concentration.
This can be a costly technique both for cored drilling, particularly for the depths which would be required here and for processing and analysing the samples. The core can be used to provide other information, for example aquifer properties data, although this should be available for the Globigerina limestone from quarried material.
There has been some speculation on the feasibility of reducing the cost by lateral coring from the shaft of one of the big pumping stations. We are unable to comment on this from our own experience but in principle it would appear reasonable. It is not known what the zone of influence of the shaft would be and therefore what penetration would be required.
9.2.3 Quantify sewer leakage
Attempt to quantify leakage from the remaining unlined sections of sewer galleries. Most work in this area has concentrated on the use of artificial tracers added to the sewage. (Vollertsen and Hvitved-Jacobsen, 2003; Rieckermann et al., 2007). An approach using flow

CR/08/094
67
gauging at the input and exits of galleries without input connections, analogous to that used for estimating canal leakage, may be helpful.
9.2.4 Microbial source tracking
Attempt to identify the sources of microbial pollution by application of gene sequencing of microbial DNA using techniques such as quantitative polymerase chain reaction. These novel techniques are becoming commercially available, but it is not clear whether they would be applicable to groundwater several decades old.
9.2.5 Improve characterisation and flow modelling of aquifers
Numerical modelling of groundwater flow and transport would enable a link to be made between the nitrate concentrations at the base of the soil zone and concentrations at various points in the aquifer. This would require the collection of new data from the above activities to quantify the various elements of the model, namely:
• nitrate leached from the base of the soil zone;
• nitrate transport through the unsaturated zone by both rapid and matrix routes;
• transport of nitrate from the unsaturated to the saturated zone;
• nitrate transport through the saturated zone;
• capture by abstraction.
The model could then be used to predict the response time of the aquifer to changes in surface activities as a result of programmes of measures designed to improve groundwater quality.
9.2.6 Improved groundwater quality monitoring
Improved collection of groundwater quality data to provide time series for nitrate concentrations under the Nitrates Directive and for other determinands under the Water Framework and Groundwater Directives. This is required for trend quantification and assessment of the efficiency of the Programme of Measures. Existing water quality information is not adequate for the precise determination of trends.

CR/08/094
68
References
Some of the references listed below are held in the Library of the British Geological Survey at Keyworth, Nottingham. Copies of the references may be purchased from the Library subject to the current copyright legislation.
ALLEN, D., BREWERTON, L. J., COLEBY, L. M., GIBBS, B. R., LEWIS, M. A., MACDONALD, A. M., WAGSTAFF, S. J. and WILLIAMS , A. T. 1997. The physical properties of major aquifers in England and Wales. British Geological Survey Technical Report WD/97/34 and Environment Agency R&D Publication 8. AMUNDSON, R., AUSTIN, A. T., SCHUUR, E. A. G., YOO, K., MATZEK, V., KENDALL, C., UEBERSAX, A., BRENNER, D. and BAISDEN, W. T. 2003. Global patterns of the isotopic composition of soil and plant nitrogen. . Global Biogeochemical Cycles, Vol. 17, Article no. 1031. ARAVENA, R., EVANS, M. L. and CHERRY, J. A. 1993. Stable isotopes of oxygen and nitrogen in source identification of nitrate from septic systems. Ground Water, Vol. 31, 2, 180-186. BAKALOWICZ , M. and MANGION, J. 2003. The limestone aquifers of Malta; their recharge conditions from isotope and chemical surveys. 49-54 in Hydrology of the Mediterranean and Semiarid Regions. Proceedings of an International Symposium. Montpelier. 2003. Publication no. 278, (Wallingford: IAHS) BATEMAN , A. S. and KELLY , S. D. 2007. Fertilizer nitrogen isotope signatures. Isotopes in Environmental and Health Studies, Vol. 43, 237-247. BRGM. 1991. Study of the fresh water resources of Malta. Appendix 7: Water quality and environmental aspects. BRGM R 33691 EAU 4S 91. CASSAR, J., MARROCCHI, A., SANTARELLI , M. L. and MUSCAT, M. 2008. Controlling crystallization damage by the use of salt inhibitors on Malta's limestone. Materiales de Construcción, Vol. 58, 289-293. CHANG, C. C. Y., LANGSTON, J., RIGGS, M., CAMPBELL, D. H., SILVA , S. R. and KENDALL, C. 1999. A method for nitrate collection for δ15N and δ18O analysis from waters with low nitrate concentrations. Canadian Journal of Fisheries and Aquatic Science, Vol. 56, 1856-1864. CHILTON, P. J., VLUGMAN , A. A. and HEADLEY, J. Groundwater quality monitoring tailored for pollution risk assessment in Barbados. 297-306 in International Workshop on Information for Susutainable Water Management, Monitoring Tailor Made III. 2000. Timmerman, J. G. (editor), COOMBS, P., MORRIS, B. L., WEST, J. M. and HUNTER, P. 1999. Transport and fate of Cryptosporidium and other pathogens in groundwater systems. UK Water Industry Research Ltd 00/DW/06/11. EU. 2002. Present concentration of nitrate in groundwater bodies in European countries. European Environment Agency http://www.eea.europa.eu HANDLEY , L. L., AUSTIN, A. T., ROBINSON, D., SCRIMGEOUR, C. M., RAVEN, J. A., HEATON, T. H. E., SCHMIDT, S. and STEWART, G. R. 1999. The 15N natural abundance (δ15N) of ecosystem samples reflects measures of water availability. Australian Journal of Plant Physiology, Vol. 26, 185-199. HEATON, T. H. E. 1986. Nitrate pollution of groundwater. South African Journal of Science, Vol. 82, 6, 279. HEATON, T. H. E., SPIRO, B. and ROBERTSON, S. M. C. 1997. Potential canopy influences on the isotopic composition of nitrogen and sulphur in atmospheric deposition. Oecologia, Vol. 109, 600-607. HEATON, T. H. E., WYNN, P. and TYE, A. 2004. Low 15N/14N ratios for nitrate in snow in the High Arctic (79°N). . Atmospheric Environment, Vol. 38, 5611-5621. HOLDER, M., BROWN, K. W., THOMAS, K. C., ZABCIK , D. and MURRAY, H. E. 1991. Capillary-wick unsaturated zone soil pore water sampler. Soil Science Society of America Journal, Vol. 58, 1195-1202. JONES, D. L., SHANNON, D., V. MURPHY, D. and FARRAR, J. 2004. Role of dissolved organic nitrogen (DON) in soil N cycling in grassland soils. Soil Biology and Biochemistry, Vol. 36, 5, 749-756.
CR/08/094
69
JONES, D. L., HEALEY, J. R., WILLETT, V. B., FARRAR, J. F. and HODGE, A. 2005. Dissolved organic nitrogen uptake by plants - an important N uptake pathway? Soil Biology & Biochemistry, Vol. 37, 3, 413-423. KENDALL, C. 1998. Tracing nitrogen sources and cycling in catchments. 519-576 in Isotope Tracers in Catchment Hydrology. Kendall, C. and McDonnell, J. J. (editor). (Amsterdam: Elsevier Science B.V.) KENDALL, C., ELLIOTT, E. M. and WANKEL, S. D. 2007. Tracing anthropogenic inputs of nitrogen to ecosystems. 375-449 in Stable Isotopes in Ecology and Environmental Science. Michener, R. and Lajtha, K. (editor). Blackwell Publishing.) KIM , Y. J., CHOI, W. J., LIM , S. S., KWAK J.H., CHANG S.X., KIM H.Y., K.S., Y. and RO, H. M. 2008. Changes in nitrogen isotopic compositions during composting of cattle feedlot animal waste: effects of bedding material type. Bioresource Technology, Vol. 99, 13, 5452-5458. KROOPNICK, P. M. and CRAIG, H. 1972. Atmospheric oxygen: Isotopic composition and solubility fractionation. Science, Vol. 175, 54-55. LAPWORTH, D. J., SHAND, P., ABESSER, C., DARLING, W. G., HARIA, A. H., EVANS, C. D. and REYNOLDS, B. 2008. Groundwater nitrogen composition and transformation within a moorland catchment, mid-Wales. Science of The Total Environment, Vol. 390, 1, 241-254. MANGION, J. and SAPIANO, M. 2005. Meeting the demand – enhancing the availability of water supplies in Malta. in International Conference of the LIFE – 3rd Countries Project TCY/CY/019. Nicosia, Cyprus MELI, A. 1993. Overview of agricultural landuse in Malta. Options Méditerranéennes, Vol. Séries B, 7, 71-75. RIECKERMANN, J., BARES, V., KRACHT, O., BRAUN, D. and GUJER, W. 2007. Estimating sewer leakage from continuous tracer experiments. Water Research, Vol. 41, 9, 1960-1972. SAPIANO, M., MANGION, J. and BATCHELOR, C. 2006. Malta Water Resources Review. FAO SHOMAR, B., OSENBRÜCK, K. and YAHYA , A. 2008. Elevated nitrate levels in the groundwater of the Gaza Strip: Distribution and sources. Science of The Total Environment, Vol. 398, 164-174. SINGLETON, M. J., ESSER, B. K., MORAN, J. E., HUDSON, G. B., MCNAB, W. W. and HARTER, T. 2007. Saturated zone denitrification: Potential for natural attenuation of nitrate contamination in shallow groundwater under dairy operations. Environmental Science & Technology, Vol. 41, 3, 759-765. SMITH -CARINGTON, A. K., BRIDGE, L. R., ROBERTSON, A. S. and FOSTER, S. S. D. 1983. The nitrate problem in groundwater supplies from Jurassic limestones in central Lincolnshire. Institute of Geological Sciences, Report 83/3 STUART, M. E., CHILTON, P. J., KINNIBURGH, D. G. and COOPER, D. M. 2007. Screening for long-term trends in groundwater nitrate monitoring data. Quarterly Journal of Engineering Geology and Hydrogeology, Vol. 40, 361-376. STUART, M. E., HEATON, T. H. E. and CHILTON, P. J. 2008. A preliminary study on the identification of the sources of nitrate contamination in groundwater in Malta: data review and sampling strategy. British Geological Survey Commissioned Report, CR/08/002. TRICKER, A. S. 1977. Recurrent problems of water supply in Malta. Geography, Vol. 62, 275, 118-121. VOLLERTSEN, J. and HVITVED-JACOBSEN, T. 2003. Exfiltration from gravity sewers: a pilot scale study Water Science & Technology, Vol. 47, 4, 69-76. WHEATER, H. S., NEAL, C. and PEACH, D. 2006. Hydro-ecological functioning of the Pang and Lambourn catchments, UK: An introduction to the special issue. Journal of Hydrology, Vol. 330, 1-2, 1-9. ZHU, Y., FOX, R. H. and TOTH, J. D. 2002. Leachate collection efficiency of zero-tension pan and passive capillary fiberglass wick lysimeters. Soil Science Society of America Journal, Vol. 66, 1, 37-43.

CR/08/094
70
Appendix 1 Analytical data
Contents
Table A1 Well-head measurements and public supply status ............................................ 73
Table A2 Major and minor ions and nitrogen species in groundwater (mg/l) .................... 74
Table A3 Trace elements in groundwater (µg/l) ................................................................. 76
Table A4 Major and trace elements in TSE and raw sewage (mg/l)................................... 78
Table A5 Major and trace elements in animal waste (mg/l on a wet weight basis) ............ 79
Table A6 Nitrogen concentration and stable isotopes in soils ............................................ 80
Table A7 Nitrogen stable isotopes in fertilizers .................................................................. 80
Table A8 Nitrogen stable isotopes in animal wastes and sewage ....................................... 81
Table A9 Nitrate stable isotopes in groundwater ................................................................ 82
Table A10 Stable isotopes of water, carbonate C and sulphate S in groundwater, surface water, tap water and sewage................................................................................ 83
Table A11 Fluorescence and dissolved organic carbon and nitrogen data ........................... 85
Table A12 Groundwater tracers ............................................................................................ 88
Table A13 Microbiological data for groundwater (cfu/100 ml)............................................ 89

CR/08/094
71
Table A1 Well-head measurements and public supply status
Lab No Date Time Temp (oC)
SEC (µS/cm)
pH Eh (mV)
DO (mg/l)
HCO3 (mg/l)
Status
S08-00227 22/01/2008 10:40 19.4 977 7.95 372 2.8 196 Private supply S08-00228 22/01/2008 11:20 19.7 1710 7.35 283 9.3 181 In use S08-00229 22/01/2008 12:00 18.6 1498 7.27 367 8.1 271 In use S08-00230 22/01/2008 12:30 18.8 1534 7.14 325 6.9 319 In use S08-00231 22/01/2008 12:50 18.8 1718 7.27 414 7.0 268 In use S08-00232 22/01/2008 13:30 18.4 2070 7.33 274 5.1 297 In use S08-00233 22/01/2008 14:15 19.9 1554 7.62 386 8.1 165 In use S08-00234 23/01/2008 09:45 16.7 1748 7.78 393 5.8 191 Not in use S08-00235 23/01/2008 10:20 14.1 2150 7.87 380 6.2 237 S08-00236 23/01/2008 11:10 19.3 1400 7.24 402 9.9 170 In use S08-00237 23/01/2008 11:40 17.2 1361 7.38 394 9.7 197 In use S08-00238 23/01/2008 12:45 19.8 2340 7.14 376 5.4 150 In use S08-00239 23/01/2008 13:45 18.1 1690 7.25 314 8.8 141 Not in use S08-00240 23/01/2008 14:30 19.4 1753 7.19 379 6.9 243 Not in use S08-00241 24/01/2008 09:45 17.7 2620 6.58 433 3.8 192 Irrigation S08-00242 24/01/2008 11:30 17.9 1791 8.08 406 139 Not in use S08-00243 24/01/2008 12:30 16.8 2880 7.30 352 222 In use S08-00244 24/01/2008 14:00 17.7 1202 7.26 312 8.0 208 In use S08-00245 24/01/2008 14:40 17.4 7.29 320 10.0 180 In use S08-00246 24/01/2008 15:25 18.4 4630 7.21 318 234 In use S08-00247 24/01/2008 16:00 18.6 1887 7.31 456 8.6 184 In use S08-00248 28/01/2008 10:50 18.9 2050 7.26 272 235 In use S08-00249 28/01/2008 11:15 18.6 1867 7.28 272 202 In use S08-00250 28/01/2008 11:45 18.6 6180 7.32 309 210 In use S08-00251 28/01/2008 12:15 18.4 3470 7.23 In use/ residual Cl S08-00252 28/01/2008 14:24 19.6 3670 7.34 494 308 In use S08-00253 28/01/2008 14:35 17.0 1939 7.48 458 279 In use S08-00254 28/01/2008 15:30 17.6 5150 7.12 435 256 In use S08-00255 28/01/2008 16:00 16.7 2500 7.24 410 329 In use S08-00256 29/01/2008 14:00 18.6 719 7.90 419 190 Irrigation S08-00257 29/01/2008 14:30 18.4 1723 7.22 448 204 Not in use S08-00258 29/01/2008 15:00 18.6 1593 7.86 437 144 Not in use S08-00259 30/01/2008 11:00 18.9 1160 7.47 439 5.3 198 Irrigation S08-00260 30/01/2008 12:10 18.6 1259 7.25 392 7.4 169 Industry S08-00261 30/01/2008 13:30 18.7 2830 7.11 405 8.5 213 Irrigation S08-00262 31/01/2008 11:30 19.9 2520 7.60 430 8.7 260 Private supply S08-00263 31/01/2008 12:30 19.4 1052 7.42 357 11.7 198 In use & irrigation S08-00272 12/03/2008 11:30 20.4 2810 7.35 328 5.1 242 In use S08-00273 12/03/2008 12:30 21.0 1789 7.33 310 6.2 213 In use S08-00274 12/03/2008 14:50 15.8 4390 7.48 369 6.4 214 In use S08-00275 13/03/2008 10:30 16.9 1380 7.98 355 8.1 206 In use S08-00276 13/03/2008 11:15 16.7 4160 7.36 265 7.4 160 In use S08-00277 13/03/2008 11:45 15.9 4340 7.14 337 4.8 293 In use S08-00278 13/03/2008 13:25 15.1 3690 7.36 234 2.3 285 In use S08-00279 13/03/2008 14:10 14.4 1275 7.48 271 6.6 251 In use S08-00280 13/03/2008 15:15 14.8 3280 7.16 334 5.8 266 In use /repeat S08-00281 14/03/2008 12:15 15.7 2990 7.14 414 7.6 229 Irrigation S08-00282 14/03/2008 12:50 15.8 881 7.05 290 0.5 279 Not in use S08-00283 14/03/2008 14:05 16.7 2570 7.10 325 2.9 282 Not in use S08-00284 17/03/2008 14:20 16.6 1736 7.54 327 6.7 143 Not in use S08-00285 17/03/2008 15:00 14.1 1730 8.06 313 9.4 151 Not in use S08-00264 31/01/2008 14:20 15.2 7050 7.25 361 12.0 242 TSE S08-00265 31/01/2008 15:00 13.2 7440 7.46 397 4.6 228 TSE

CR/08/094
72
Table A2 Major and minor ions and nitrogen species in groundwater (mg/l)
Lab No B Ca Cl F Fe K Mg Mn Na NH4-N NO2-N NO3-N TDN P PO4 Si SO4 Sr S08-00227 -0.1 90 144 0.169 -0.005 7.38 12.8 -0.002 73.2 -0.02 0.00419 18.2 18.6 -0.1 0 4.54 36.3 0.209 S08-00228 0.13 106 326 0.281 0.0218 25.7 18.7 -0.002 183 -0.02 0.00177 32.7 32.7 -0.1 0 4.31 35.7 0.359 S08-00229 0.17 93 250 1.26 0.0093 7.41 39.1 -0.002 143 -0.02 0.00157 13.0 13.5 -0.1 0 10.2 89.2 1.22 S08-00230 0.17 102 234 1.33 0.0383 16.9 41.8 -0.002 139 -0.02 -0.0008 12.0 12.2 -0.1 0 8.84 111 1.69 S08-00231 0.17 92 351 0.800 0.026 7.45 44.4 0.002 187 -0.02 -0.0008 9.47 10.1 -0.1 7.32 84.9 1.34 S08-00232 0.19 83.8 469 1.26 0.02 11.2 58.1 0.0021 239 -0.02 0.00141 8.93 9.04 -0.1 0 7.11 102 2.64 S08-00233 0.12 78.4 354 0.241 -0.005 7.92 22.4 -0.002 191 0.074 -0.0008 8.27 8.55 -0.1 0 3.7 50.5 0.341 S08-00234 0.22 126 296 0.138 -0.005 35.9 18.9 0.054 187 -0.02 0.577 41.6 44.9 0.32 0.7 6.29 90 0.402 S08-00235 0.16 207 353 0.305 -0.005 11.7 33 0.0047 183 0.029 0.153 53.4 52.3 -0.1 0 4.65 197 0.741 S08-00236 -0.1 138 212 0.158 0.007 3.26 16 -0.002 109 -0.02 0.00804 34.3 35.7 -0.1 0 5.04 88.3 0.291 S08-00237 0.11 130 227 0.334 0.032 3.11 19.7 0.0141 102 0.079 0.0145 28.4 29.7 -0.1 0 6.06 52.1 0.443 S08-00238 0.17 116 535 0.283 0.0478 14.4 33.1 -0.002 289 0.211 0.0374 22.9 23.4 -0.1 0 5.15 64.9 0.487 S08-00239 0.1 103 351 0.282 0.0142 8.51 19.4 0.0025 183 -0.02 0.0094 16.0 18.2 -0.1 0 4.76 36.5 0.366 S08-00240 0.1 110 396 0.298 0.0094 5.57 17.8 -0.002 211 -0.02 0.0025 10.1 10.9 -0.1 0 4.79 33.4 0.291 S08-00241 0.15 258 383 0.109 0.0075 15.7 31.3 0.0069 212 -0.02 0.0788 92.7 90.6 0.17 0.2 4.62 264 0.741 S08-00242 -0.1 170 298 0.149 -0.005 4.18 21.5 -0.002 138 0.026 0.0027 46.9 49.3 -0.1 0 4.53 136 0.379 S08-00243 0.1 132 794 0.567 0.0213 10.3 35.5 -0.002 400 -0.02 0.0054 16.7 17.7 -0.1 0 6.36 27.6 0.881 S08-00244 -0.1 93.3 236 0.278 0.0091 6.72 14.3 -0.002 119 -0.02 0.00263 14.1 14.4 -0.1 0 4.5 27.2 0.269 S08-00245 0.15 97.3 667 0.276 0.0155 10.2 34 -0.002 337 -0.02 0.00357 10.6 10.9 -0.1 0 4.24 60.8 0.36 S08-00246 0.32 114 1230 0.289 0.0288 24.5 65.4 -0.002 571 -0.02 0.00859 10.3 10.3 -0.1 0 4.36 150 0.442 S08-00247 0.23 94.6 415 0.44 0.0083 7.22 19.5 -0.002 222 -0.02 0.00419 11.8 11.5 -0.1 0 4.72 42.5 0.319 S08-00248 0.23 92.8 469 1.27 0.0307 11.9 52.1 -0.002 253 -0.02 0.00177 13.0 14.7 -0.1 0 6.7 91 1.84 S08-00249 0.14 99.4 438 0.749 0.0285 7.26 33.4 -0.002 228 -0.02 0.00157 15.0 15.9 -0.1 0 5.61 43.4 0.876 S08-00250 0.39 112 1990 0.808 0.0065 38.1 135 0.0021 1020 -0.02 -0.0008 8.99 9.06 -0.1 0 6.3 221 1.59 S08-00251 0.26 112 908 1.11 0.0216 23.7 77.3 -0.002 470 -0.02 -0.0008 19.7 19.5 -0.1 0 7.06 141 1.8 S08-00252 0.4 93.6 952 1.63 0.0323 18.3 99.9 0.0053 519 -0.02 0.00141 8.58 8.63 -0.1 0 7.16 196 2.5 S08-00253 0.23 65.2 436 1.63 0.0251 8.6 61.5 -0.002 243 0.074 -0.0008 9.86 9.66 -0.1 0 7.22 68 2.04 S08-00254 0.41 132 1490 0.865 0.0097 42.1 102 -0.002 787 -0.02 0.577 8.17 8.37 -0.1 0 6.83 254 1.02 S08-00255 0.38 85.1 526 2.62 0.0514 10.4 84.4 -0.002 317 0.013 0.139 6.60 6.68 -0.1 0 7.86 231 3.58 S08-00256 -0.1 81.2 94.8 0.188 -0.005 1.36 8.77 -0.002 52.8 -0.02 0.00804 9.32 9.37 -0.1 0 3.72 25.3 0.143 S08-00257 -0.1 185 235 0.145 -0.005 6.55 21.3 -0.002 122 0.079 0.0145 63.9 64.4 -0.1 0 4.61 126 0.5

CR/08/094
73
Lab No B Ca Cl F Fe K Mg Mn Na NH4-N NO2-N NO3-N TDN P PO4 Si SO4 Sr S08-00258 -0.1 107 199 0.277 -0.005 2.49 24.2 -0.002 103 0.211 0.0374 26.9 27.8 -0.1 0 4.36 71.5 0.31 S08-00259 0.14 91.1 210 0.336 -0.005 4.93 14.2 0.0039 132 -0.02 0.0094 15.4 15.7 -0.1 0 3.95 41.1 0.371 S08-00260 -0.1 105 221 0.331 0.0126 10.5 15.4 0.0048 130 -0.02 0.0025 31.7 30.9 -0.1 0 5.1 32.5 0.349 S08-00261 0.21 164 677 0.319 0.0056 14.3 44.7 0.0026 368 -0.01 0.0531 39.1 39.8 -0.1 0 6.09 92.3 0.635 S08-00262 0.2 136 601 0.659 0.0132 11.3 32.7 0.018 329 0.026 0.0027 21.5 21.5 -0.1 0 6.93 84.5 0.655 S08-00263 -0.1 75.1 195 1.09 0.0068 4.4 25.7 -0.002 112 -0.02 0.0054 10.7 11.0 -0.1 0 7.09 30.7 1.19 S08-00272 0.25 121 713 0.300 0.0113 16.3 43.1 -0.002 368 -0.02 0.00263 17.4 19.2 -0.1 0 4.76 92.4 0.672 S08-00273 0.19 92.6 414 0.398 0.0056 7.8 29 -0.002 223 -0.02 0.00357 9.59 8.53 -0.1 0 6 57.1 0.354 S08-00274 0.21 127 1250 0.245 -0.005 21.8 66 -0.002 639 -0.02 0.00859 14.0 12.5 -0.1 0 4.38 113 0.492 S08-00275 0.1 95.8 323 0.379 -0.005 4.86 18.4 -0.002 159 0.0193 0.00374 11.8 12.8 -0.1 0 4.95 30.5 0.452 S08-00276 0.23 114 1260 0.466 0.0459 25.5 74.4 -0.002 647 -0.02 0.00356 23.6 20.8 -0.1 0 4.95 116 0.939 S08-00277 0.36 123 1220 1.50 0.0203 20.2 107 -0.002 651 -0.02 0.00141 10.1 9.47 -0.1 0 6.21 191 2.5 S08-00278 0.32 79.5 1010 2.13 0.21 21.4 122 0.0028 540 -0.02 0.00477 6.60 6.11 -0.1 0 6.44 183 4.73 S08-00279 0.22 52.9 267 1.25 0.0188 9.73 49.3 -0.002 152 0.0126 0.00437 5.46 5.00 -0.1 0 6.22 68.2 1.7 S08-00280 0.26 120 898 0.939 0.0275 24.1 81.2 0.0111 488 -0.02 0.00423 19.8 20.8 -0.1 0 7.17 137 1.9 S08-00281 0.35 130 710 0.122 0.407 11.7 34.2 0.0195 366 -0.02 0.00136 24.9 30.4 -0.1 0 4.02 84.4 0.359 S08-00282 -0.1 90.5 40.1 0.159 0.232 5.26 6.44 0.0139 36.7 -0.02 0.00105 2.26 2.57 -0.1 0 4.05 27.1 0.291 S08-00283 0.27 142 650 0.705 0.0951 21.4 38 -0.002 347 -0.02 0.00118 35.7 32.6 -0.1 0 6.01 102 0.835 S08-00284 -0.1 170 287 0.106 0.0105 16 20.8 -0.002 148 -0.02 0.00246 74.3 -0.1 0 4.04 94.3 0.381 S08-00285 0.26 116 304 0.179 -0.005 43.3 19 -0.002 195 -0.02 0.0205 39.4 35.7 -0.1 0.3 3.68 69.9 0.319
Negative values indicate below detection limit
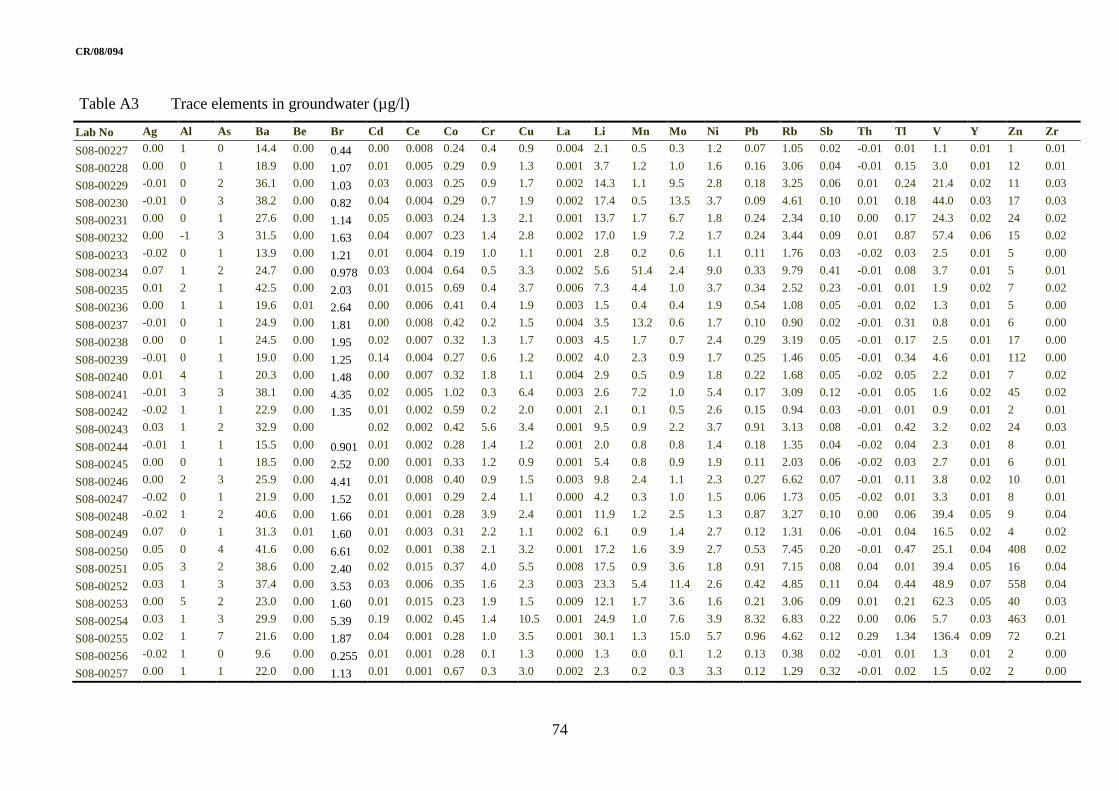
CR/08/094
74
Table A3 Trace elements in groundwater (µg/l)
Lab No Ag Al As Ba Be Br Cd Ce Co Cr Cu La Li Mn Mo Ni Pb Rb Sb Th Tl V Y Zn Zr
S08-00227 0.00 1 0 14.4 0.00 0.44 0.00 0.008 0.24 0.4 0.9 0.004 2.1 0.5 0.3 1.2 0.07 1.05 0.02 -0.01 0.01 1.1 0.01 1 0.01
S08-00228 0.00 0 1 18.9 0.00 1.07 0.01 0.005 0.29 0.9 1.3 0.001 3.7 1.2 1.0 1.6 0.16 3.06 0.04 -0.01 0.15 3.0 0.01 12 0.01
S08-00229 -0.01 0 2 36.1 0.00 1.03 0.03 0.003 0.25 0.9 1.7 0.002 14.3 1.1 9.5 2.8 0.18 3.25 0.06 0.01 0.24 21.4 0.02 11 0.03
S08-00230 -0.01 0 3 38.2 0.00 0.82 0.04 0.004 0.29 0.7 1.9 0.002 17.4 0.5 13.5 3.7 0.09 4.61 0.10 0.01 0.18 44.0 0.03 17 0.03
S08-00231 0.00 0 1 27.6 0.00 1.14 0.05 0.003 0.24 1.3 2.1 0.001 13.7 1.7 6.7 1.8 0.24 2.34 0.10 0.00 0.17 24.3 0.02 24 0.02
S08-00232 0.00 -1 3 31.5 0.00 1.63 0.04 0.007 0.23 1.4 2.8 0.002 17.0 1.9 7.2 1.7 0.24 3.44 0.09 0.01 0.87 57.4 0.06 15 0.02
S08-00233 -0.02 0 1 13.9 0.00 1.21 0.01 0.004 0.19 1.0 1.1 0.001 2.8 0.2 0.6 1.1 0.11 1.76 0.03 -0.02 0.03 2.5 0.01 5 0.00
S08-00234 0.07 1 2 24.7 0.00 0.978 0.03 0.004 0.64 0.5 3.3 0.002 5.6 51.4 2.4 9.0 0.33 9.79 0.41 -0.01 0.08 3.7 0.01 5 0.01
S08-00235 0.01 2 1 42.5 0.00 2.03 0.01 0.015 0.69 0.4 3.7 0.006 7.3 4.4 1.0 3.7 0.34 2.52 0.23 -0.01 0.01 1.9 0.02 7 0.02
S08-00236 0.00 1 1 19.6 0.01 2.64 0.00 0.006 0.41 0.4 1.9 0.003 1.5 0.4 0.4 1.9 0.54 1.08 0.05 -0.01 0.02 1.3 0.01 5 0.00
S08-00237 -0.01 0 1 24.9 0.00 1.81 0.00 0.008 0.42 0.2 1.5 0.004 3.5 13.2 0.6 1.7 0.10 0.90 0.02 -0.01 0.31 0.8 0.01 6 0.00
S08-00238 0.00 0 1 24.5 0.00 1.95 0.02 0.007 0.32 1.3 1.7 0.003 4.5 1.7 0.7 2.4 0.29 3.19 0.05 -0.01 0.17 2.5 0.01 17 0.00
S08-00239 -0.01 0 1 19.0 0.00 1.25 0.14 0.004 0.27 0.6 1.2 0.002 4.0 2.3 0.9 1.7 0.25 1.46 0.05 -0.01 0.34 4.6 0.01 112 0.00
S08-00240 0.01 4 1 20.3 0.00 1.48 0.00 0.007 0.32 1.8 1.1 0.004 2.9 0.5 0.9 1.8 0.22 1.68 0.05 -0.02 0.05 2.2 0.01 7 0.02
S08-00241 -0.01 3 3 38.1 0.00 4.35 0.02 0.005 1.02 0.3 6.4 0.003 2.6 7.2 1.0 5.4 0.17 3.09 0.12 -0.01 0.05 1.6 0.02 45 0.02
S08-00242 -0.02 1 1 22.9 0.00 1.35 0.01 0.002 0.59 0.2 2.0 0.001 2.1 0.1 0.5 2.6 0.15 0.94 0.03 -0.01 0.01 0.9 0.01 2 0.01
S08-00243 0.03 1 2 32.9 0.00 0.02 0.002 0.42 5.6 3.4 0.001 9.5 0.9 2.2 3.7 0.91 3.13 0.08 -0.01 0.42 3.2 0.02 24 0.03
S08-00244 -0.01 1 1 15.5 0.00 0.901 0.01 0.002 0.28 1.4 1.2 0.001 2.0 0.8 0.8 1.4 0.18 1.35 0.04 -0.02 0.04 2.3 0.01 8 0.01
S08-00245 0.00 0 1 18.5 0.00 2.52 0.00 0.001 0.33 1.2 0.9 0.001 5.4 0.8 0.9 1.9 0.11 2.03 0.06 -0.02 0.03 2.7 0.01 6 0.01
S08-00246 0.00 2 3 25.9 0.00 4.41 0.01 0.008 0.40 0.9 1.5 0.003 9.8 2.4 1.1 2.3 0.27 6.62 0.07 -0.01 0.11 3.8 0.02 10 0.01
S08-00247 -0.02 0 1 21.9 0.00 1.52 0.01 0.001 0.29 2.4 1.1 0.000 4.2 0.3 1.0 1.5 0.06 1.73 0.05 -0.02 0.01 3.3 0.01 8 0.01
S08-00248 -0.02 1 2 40.6 0.00 1.66 0.01 0.001 0.28 3.9 2.4 0.001 11.9 1.2 2.5 1.3 0.87 3.27 0.10 0.00 0.06 39.4 0.05 9 0.04
S08-00249 0.07 0 1 31.3 0.01 1.60 0.01 0.003 0.31 2.2 1.1 0.002 6.1 0.9 1.4 2.7 0.12 1.31 0.06 -0.01 0.04 16.5 0.02 4 0.02
S08-00250 0.05 0 4 41.6 0.00 6.61 0.02 0.001 0.38 2.1 3.2 0.001 17.2 1.6 3.9 2.7 0.53 7.45 0.20 -0.01 0.47 25.1 0.04 408 0.02
S08-00251 0.05 3 2 38.6 0.00 2.40 0.02 0.015 0.37 4.0 5.5 0.008 17.5 0.9 3.6 1.8 0.91 7.15 0.08 0.04 0.01 39.4 0.05 16 0.04
S08-00252 0.03 1 3 37.4 0.00 3.53 0.03 0.006 0.35 1.6 2.3 0.003 23.3 5.4 11.4 2.6 0.42 4.85 0.11 0.04 0.44 48.9 0.07 558 0.04
S08-00253 0.00 5 2 23.0 0.00 1.60 0.01 0.015 0.23 1.9 1.5 0.009 12.1 1.7 3.6 1.6 0.21 3.06 0.09 0.01 0.21 62.3 0.05 40 0.03
S08-00254 0.03 1 3 29.9 0.00 5.39 0.19 0.002 0.45 1.4 10.5 0.001 24.9 1.0 7.6 3.9 8.32 6.83 0.22 0.00 0.06 5.7 0.03 463 0.01
S08-00255 0.02 1 7 21.6 0.00 1.87 0.04 0.001 0.28 1.0 3.5 0.001 30.1 1.3 15.0 5.7 0.96 4.62 0.12 0.29 1.34 136.4 0.09 72 0.21
S08-00256 -0.02 1 0 9.6 0.00 0.255 0.01 0.001 0.28 0.1 1.3 0.000 1.3 0.0 0.1 1.2 0.13 0.38 0.02 -0.01 0.01 1.3 0.01 2 0.00
S08-00257 0.00 1 1 22.0 0.00 1.13 0.01 0.001 0.67 0.3 3.0 0.002 2.3 0.2 0.3 3.3 0.12 1.29 0.32 -0.01 0.02 1.5 0.02 2 0.00

CR/08/094
75
Lab No Ag Al As Ba Be Br Cd Ce Co Cr Cu La Li Mn Mo Ni Pb Rb Sb Th Tl V Y Zn Zr
S08-00258 -0.01 1 1 16.8 0.00 2.22 0.01 0.003 0.35 0.3 1.2 0.002 1.8 0.0 0.6 1.6 0.14 0.81 0.02 -0.01 0.01 1.5 0.01 1 0.00
S08-00259 -0.02 1 0 13.5 0.00 0.771 0.03 0.001 0.31 0.1 4.0 0.000 3.2 3.8 0.9 2.5 1.12 1.14 0.14 -0.01 0.13 1.9 0.01 1941 0.00
S08-00260 -0.01 1 1 17.6 0.00 0.709 0.01 0.001 0.34 0.4 1.3 0.000 4.0 4.8 0.7 2.1 0.19 1.31 0.07 -0.01 0.02 2.7 0.01 168 0.00
S08-00261 -0.01 0 1 28.6 0.00 2.63 0.01 0.001 0.49 0.7 1.9 0.001 6.7 2.7 0.6 2.2 0.15 3.24 0.03 -0.01 0.02 1.6 0.01 21 0.00
S08-00262 -0.01 1 1 26.1 0.01 2.09 0.01 0.002 0.64 1.1 2.3 0.001 9.8 19.5 2.0 10.7 0.38 2.82 0.05 0.00 0.10 4.1 0.02 52 0.01
S08-00263 -0.01 1 1 23.6 0.00 0.765 0.02 0.000 0.20 2.0 0.7 0.000 8.5 0.9 3.7 1.4 0.08 1.37 0.08 -0.01 0.13 18.5 0.03 7 0.02
S08-00272 -0.02 0 1 21.0 0.00 2.19 0.29 0.000 0.53 1.3 3.0 0.001 7.5 1.8 1.7 6.7 8.36 4.56 0.08 -0.02 0.18 4.5 0.02 1028 0.00
S08-00273 0.07 1 0 24.0 0.00 1.59 0.02 0.002 0.32 0.9 2.0 0.004 4.2 0.4 1.2 1.4 0.57 1.92 0.02 -0.02 0.01 1.6 0.02 17 0.00
S08-00274 0.03 1 1 21.0 0.00 4.84 0.02 0.001 0.43 1.6 1.7 0.000 9.0 0.1 1.7 2.5 0.22 4.09 0.08 -0.02 0.04 3.6 0.01 4 0.00
S08-00275 0.01 1 1 18.8 0.01 0.825 0.01 0.001 0.32 1.8 1.6 0.000 4.0 0.9 0.9 1.5 0.41 0.81 0.08 0.00 0.01 8.3 0.01 15 0.01
S08-00276 0.03 1 2 32.8 0.00 4.52 0.01 0.001 0.41 2.2 1.5 0.001 13.2 1.3 3.0 1.9 0.07 3.47 0.07 0.01 0.14 9.4 0.03 9 0.01
S08-00277 0.04 1 2 57.1 0.00 4.84 0.04 0.001 0.43 4.3 2.9 0.001 25.5 0.4 9.7 3.0 0.31 6.53 0.20 0.03 0.15 43.8 0.07 64 0.03
S08-00278 0.02 1 3 42.5 0.01 3.76 0.03 0.001 0.28 2.8 4.2 0.001 31.8 2.5 11.1 2.7 0.63 6.83 0.32 0.06 0.26 148.9 0.13 171 0.04
S08-00279 0.01 1 3 24.4 0.00 1.06 0.02 0.001 0.17 2.8 2.7 0.001 11.7 1.0 2.9 1.4 0.73 3.59 0.20 0.15 0.26 49.1 0.04 10 0.18
S08-00280 0.02 1 2 38.3 0.01 3.44 0.01 0.001 0.49 4.3 4.7 0.001 20.3 11.2 3.5 1.9 2.89 7.18 0.09 0.07 0.07 43.0 0.05 15 0.07
S08-00281 0.00 2 1 24.9 0.01 2.32 0.07 0.010 0.56 0.8 3.4 0.004 4.4 19.7 0.4 2.6 1.65 2.57 0.05 0.01 0.04 2.4 0.01 621 0.00
S08-00282 -0.02 10 1 18.7 0.00 0.144 0.07 0.037 0.54 0.8 12.4 0.027 2.8 13.6 2.6 4.6 1.58 1.63 0.49 0.01 0.06 2.6 0.04 569 0.02
S08-00283 0.00 3 1 44.5 0.01 2.03 0.15 0.008 0.56 1.5 5.6 0.005 14.2 1.0 3.5 5.1 0.83 3.67 0.28 0.02 0.05 4.3 0.03 980 0.03
S08-00284 -0.02 2 1 25.6 0.00 0.877 0.04 0.001 0.67 0.5 2.7 0.001 2.4 0.8 0.3 2.6 0.30 2.94 0.06 -0.01 0.03 1.3 0.01 7 0.00
S08-00285 0.06 2 1 25.1 0.00 0.998 0.01 0.000 0.46 1.1 1.4 0.000 3.2 0.0 0.9 2.5 0.19 4.01 0.04 -0.01 0.07 1.2 0.01 3 0.00
Negative values indicate below detection limit
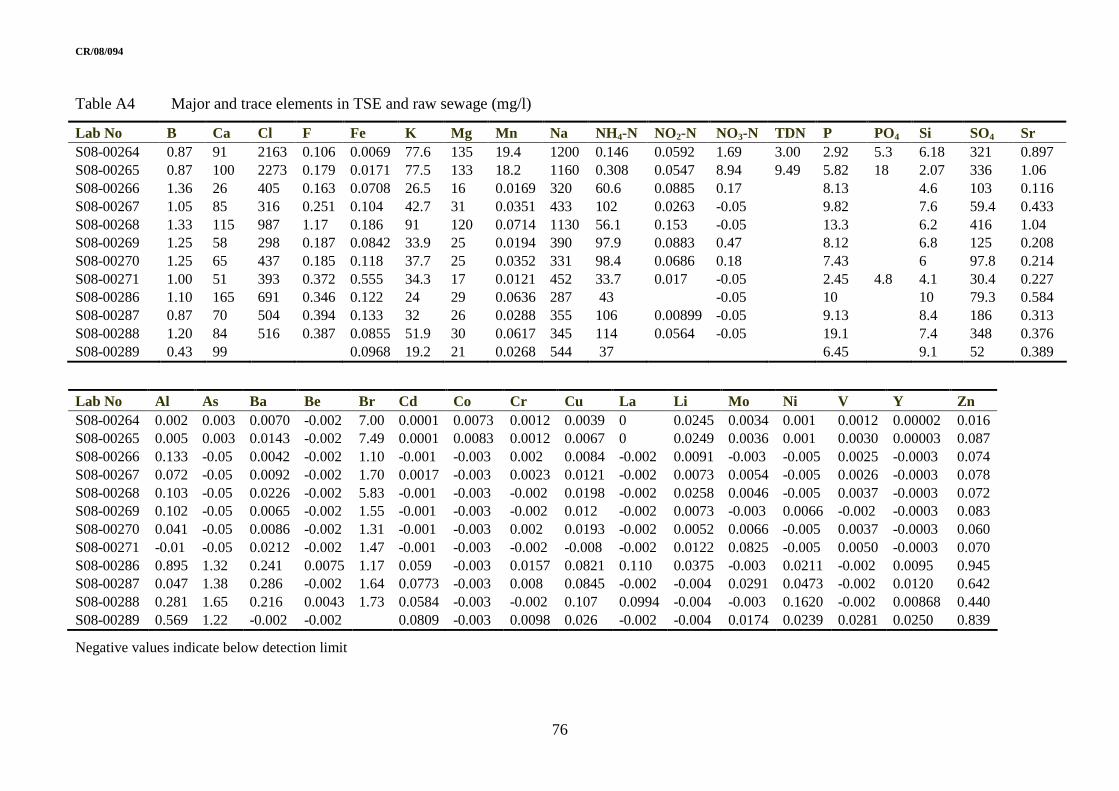
CR/08/094
76
Table A4 Major and trace elements in TSE and raw sewage (mg/l)
Lab No B Ca Cl F Fe K Mg Mn Na NH4-N NO2-N NO3-N TDN P PO4 Si SO4 Sr S08-00264 0.87 91 2163 0.106 0.0069 77.6 135 19.4 1200 0.146 0.0592 1.69 3.00 2.92 5.3 6.18 321 0.897 S08-00265 0.87 100 2273 0.179 0.0171 77.5 133 18.2 1160 0.308 0.0547 8.94 9.49 5.82 18 2.07 336 1.06 S08-00266 1.36 26 405 0.163 0.0708 26.5 16 0.0169 320 60.6 0.0885 0.17 8.13 4.6 103 0.116 S08-00267 1.05 85 316 0.251 0.104 42.7 31 0.0351 433 102 0.0263 -0.05 9.82 7.6 59.4 0.433 S08-00268 1.33 115 987 1.17 0.186 91 120 0.0714 1130 56.1 0.153 -0.05 13.3 6.2 416 1.04 S08-00269 1.25 58 298 0.187 0.0842 33.9 25 0.0194 390 97.9 0.0883 0.47 8.12 6.8 125 0.208 S08-00270 1.25 65 437 0.185 0.118 37.7 25 0.0352 331 98.4 0.0686 0.18 7.43 6 97.8 0.214 S08-00271 1.00 51 393 0.372 0.555 34.3 17 0.0121 452 33.7 0.017 -0.05 2.45 4.8 4.1 30.4 0.227 S08-00286 1.10 165 691 0.346 0.122 24 29 0.0636 287 43 -0.05 10 10 79.3 0.584 S08-00287 0.87 70 504 0.394 0.133 32 26 0.0288 355 106 0.00899 -0.05 9.13 8.4 186 0.313 S08-00288 1.20 84 516 0.387 0.0855 51.9 30 0.0617 345 114 0.0564 -0.05 19.1 7.4 348 0.376 S08-00289 0.43 99 0.0968 19.2 21 0.0268 544 37 6.45 9.1 52 0.389
Lab No Al As Ba Be Br Cd Co Cr Cu La Li Mo Ni V Y Zn S08-00264 0.002 0.003 0.0070 -0.002 7.00 0.0001 0.0073 0.0012 0.0039 0 0.0245 0.0034 0.001 0.0012 0.00002 0.016 S08-00265 0.005 0.003 0.0143 -0.002 7.49 0.0001 0.0083 0.0012 0.0067 0 0.0249 0.0036 0.001 0.0030 0.00003 0.087 S08-00266 0.133 -0.05 0.0042 -0.002 1.10 -0.001 -0.003 0.002 0.0084 -0.002 0.0091 -0.003 -0.005 0.0025 -0.0003 0.074 S08-00267 0.072 -0.05 0.0092 -0.002 1.70 0.0017 -0.003 0.0023 0.0121 -0.002 0.0073 0.0054 -0.005 0.0026 -0.0003 0.078 S08-00268 0.103 -0.05 0.0226 -0.002 5.83 -0.001 -0.003 -0.002 0.0198 -0.002 0.0258 0.0046 -0.005 0.0037 -0.0003 0.072 S08-00269 0.102 -0.05 0.0065 -0.002 1.55 -0.001 -0.003 -0.002 0.012 -0.002 0.0073 -0.003 0.0066 -0.002 -0.0003 0.083 S08-00270 0.041 -0.05 0.0086 -0.002 1.31 -0.001 -0.003 0.002 0.0193 -0.002 0.0052 0.0066 -0.005 0.0037 -0.0003 0.060 S08-00271 -0.01 -0.05 0.0212 -0.002 1.47 -0.001 -0.003 -0.002 -0.008 -0.002 0.0122 0.0825 -0.005 0.0050 -0.0003 0.070 S08-00286 0.895 1.32 0.241 0.0075 1.17 0.059 -0.003 0.0157 0.0821 0.110 0.0375 -0.003 0.0211 -0.002 0.0095 0.945 S08-00287 0.047 1.38 0.286 -0.002 1.64 0.0773 -0.003 0.008 0.0845 -0.002 -0.004 0.0291 0.0473 -0.002 0.0120 0.642 S08-00288 0.281 1.65 0.216 0.0043 1.73 0.0584 -0.003 -0.002 0.107 0.0994 -0.004 -0.003 0.1620 -0.002 0.00868 0.440 S08-00289 0.569 1.22 -0.002 -0.002 0.0809 -0.003 0.0098 0.026 -0.002 -0.004 0.0174 0.0239 0.0281 0.0250 0.839
Negative values indicate below detection limit

CR/08/094
77
Table A5 Major and trace elements in animal waste (mg/l on a wet weight basis)
Lab No B Ca Fe K Mg Mn Na NH4-N* P Si SO4 Sr S08-00290 1.39 137 2.55 1070 31.8 0.455 401 3600 102 36.9 77.7 0.357 S08-00291 3.78 359 1.89 1060 114 1.53 522 1520 126 27.5 183 1.11 S08-00292 5.11 491 1.21 1930 143 1.86 854 1680 66.9 57.3 234 2.66 S08-00293 2.61 399 3.18 1030 103 1.86 498 1840 86.4 22.5 65.4 1.12 S08-00294 2.22 245 2.92 537 119 1.82 388 1280 156 22.5 159 0.609 S08-00682 14.4 348 10.9 7676 143 1246 1434 6195 446 40.7 2081 0.976 S08-00683 5.34 554 2.72 2336 241 1406 1634 1474 164 54.0 829 2.26 S08-00684 5.92 446 3.62 3400 214 1157 549 3333 456 35.9 1054 1.06 S08-00685 7.11 268 6.16 1353 115 563 732 947 138 63.2 341 0.953 S08-00686 7.81 1985 5.18 5175 768 7042 568 3941 904 45.4 2189 2.20 S08-00687 6.54 661 4.33 2010 316 3276 876 1319 244 106 371 3.43 S08-00688 26.7 284 9.06 6437 304 1128 2351 538 678 126 2443 1.01 S08-00689 44.5 338 41.4 16079 121 4212 888 2000 1003 75.2 8357 2.07 Lab No Al As Ba Be Cd Co Cr Cu La Li Mo Ni V Y Zn S08-00290 -0.01 0.187 0.668 0.0173 0.100 -0.003 0.0265 0.128 0.0285 -0.004 0.107 0.0215 -0.002 0.0232 3.41 S08-00291 -0.01 0.14 0.286 0.0194 0.0659 -0.003 0.0561 0.138 0.0255 -0.004 -0.003 0.128 -0.002 0.0129 3.83 S08-00292 -0.01 -0.05 0.313 0.0176 0.0248 0.0212 -0.002 0.112 -0.002 -0.004 0.339 0.137 -0.002 0.0008 2.49 S08-00293 -0.01 -0.05 0.488 0.0129 0.110 -0.003 0.0648 0.0746 -0.002 -0.004 -0.003 0.0737 0.04 0.014 1.53 S08-00294 0.786 -0.05 0.397 0.0176 0.0548 0.0396 0.0332 0.346 -0.002 -0.004 0.0481 0.108 -0.002 -0.0003 2.36 S08-00682 -0.07 -0.34 1.81 0.197 0.0815 0.367 0.627 0.409 0.279 -0.027 0.033 2.32 -0.013 0.1219 6.22 S08-00683 -0.03 -0.14 -0.006 0.010 0.236 0.162 -0.006 0.410 -0.0058 -0.012 0.187 0.407 0.206 0.0396 2.64 S08-00684 8.28 -0.27 0.619 0.136 0.435 0.166 0.311 0.705 -0.0108 0.0662 -0.016 0.871 0.123 0.0364 4.79 S08-00685 10.2 -0.26 0.995 0.082 0.432 0.088 0.223 0.358 -0.0105 0.223 1.01 0.256 -0.011 0.1005 2.78 S08-00686 4.41 -0.21 0.806 0.137 0.467 0.395 0.258 0.611 0.223 -0.017 -0.013 1.45 0.325 0.0437 5.81 S08-00687 1.31 -0.35 1.26 0.025 0.0883 -0.021 0.172 -0.056 -0.0139 0.562 0.159 1.12 0.604 -0.0021 7.37 S08-00688 11.0 6.78 3.60 0.151 0.120 -0.046 0.175 12.3 -0.0307 0.467 -0.046 1.94 -0.031 -0.0046 10.77 S08-00689 22.2 -0.84 6.30 0.637 0.500 0.682 1.56 16.2 -0.0334 -0.067 5.08 3.81 0.548 0.2273 33.09
* from Hach test Negative values indicate below detection limit
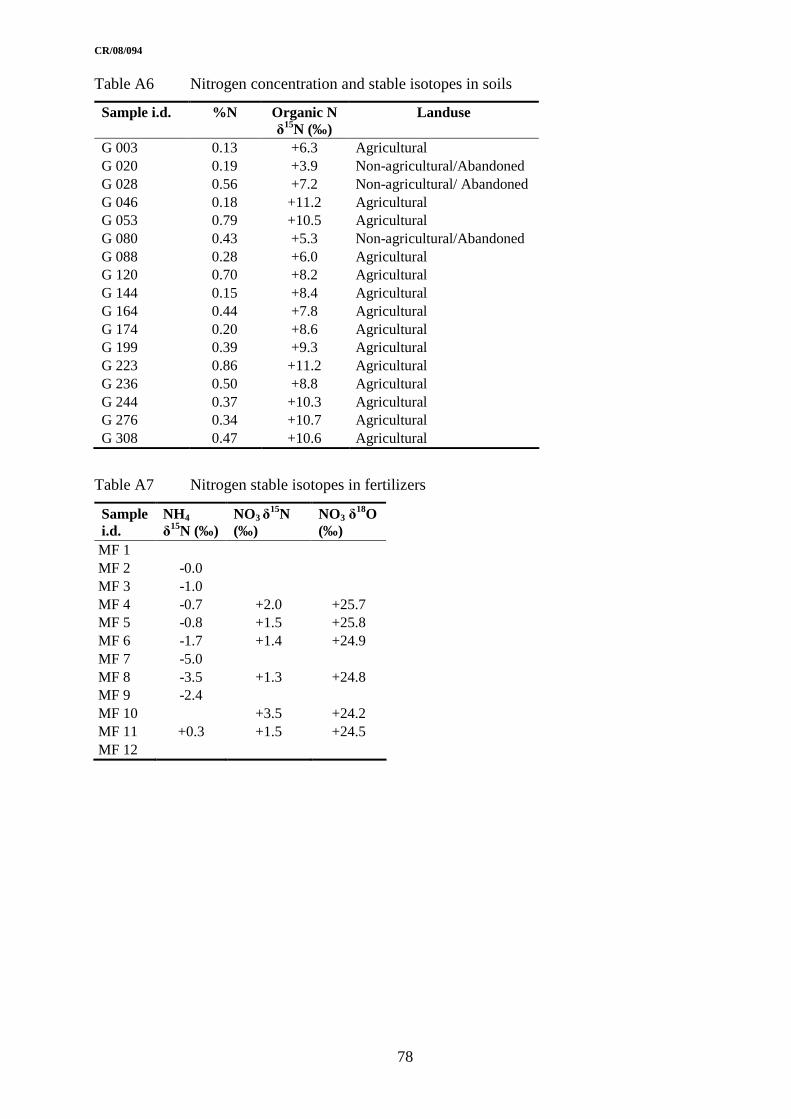
CR/08/094
78
Table A6 Nitrogen concentration and stable isotopes in soils
Sample i.d. %N Organic N δ
15N (‰) Landuse
G 003 0.13 +6.3 Agricultural G 020 0.19 +3.9 Non-agricultural/Abandoned G 028 0.56 +7.2 Non-agricultural/ Abandoned G 046 0.18 +11.2 Agricultural G 053 0.79 +10.5 Agricultural G 080 0.43 +5.3 Non-agricultural/Abandoned G 088 0.28 +6.0 Agricultural G 120 0.70 +8.2 Agricultural G 144 0.15 +8.4 Agricultural G 164 0.44 +7.8 Agricultural G 174 0.20 +8.6 Agricultural G 199 0.39 +9.3 Agricultural G 223 0.86 +11.2 Agricultural G 236 0.50 +8.8 Agricultural G 244 0.37 +10.3 Agricultural G 276 0.34 +10.7 Agricultural G 308 0.47 +10.6 Agricultural
Table A7 Nitrogen stable isotopes in fertilizers
Sample i.d.
NH4 δ
15N (‰) NO3 δ
15N (‰)
NO3 δ18O
(‰) MF 1 MF 2 -0.0 MF 3 -1.0 MF 4 -0.7 +2.0 +25.7 MF 5 -0.8 +1.5 +25.8 MF 6 -1.7 +1.4 +24.9 MF 7 -5.0 MF 8 -3.5 +1.3 +24.8 MF 9 -2.4 MF 10 +3.5 +24.2 MF 11 +0.3 +1.5 +24.5 MF 12

CR/08/094
79
Table A8 Nitrogen stable isotopes in animal wastes and sewage
Sample i.d. Type NH4 δ15N (‰)
S08-00266 Sewage +6.5 S08-00267 Sewage +6.3 S08-00268 Sewage +5.4 S08-00269 Sewage +6.4 S08-00270 Sewage +6.9 S08-00271 Sewage +5.5 S08-00286 Sewage +6.5 S08-00287 Sewage +6.8 S08-00288 Cesspit +6.1 S08-00289 Cesspit +6.5 S08-00290 Pig slurry +5.1 S08-00291 Pig slurry +3.7 S08-00292 Cow slurry +3.1 S08-00293 Pig liquid +3.7 S08-00294 Pig slurry +6.4 S08-00682 Poultry +9.8 S08-00683 Cow solid +10.1 S08-00684 Poultry layers +2.3 S08-00685 Cow solid +6.1 S08-00686 Poultry broilers +2.1 S08-00687 Cow solid waste +5.9

CR/08/094
80
Table A9 Nitrate stable isotopes in groundwater
Lab No δ15N (‰) δ
18O(‰) S08-00227 +9.4 +3.4 S08-00228 +10.5 +3.7 S08-00229 +11.3 +6.1 S08-00230 +13.2 +5.7 S08-00231 +10.6 +5.0 S08-00232 +11.0 +5.2 S08-00233 +8.4 +4.0 S08-00234 +11.2 +4.9 S08-00236 +9.8 +3.2 S08-00237 +8.3 +3.3 S08-00238 +10.0 +4.1 S08-00239 +8.7 +4.4 S08-00240 +7.9 +4.3 S08-00241 +10.7 +4.7 S08-00242 +8.8 +3.1 S08-00243 +9.3 +5.4 S08-00244 +9.2 +3.6 S08-00246 +7.2 +4.2 S08-00247 +8.7 +4.8 S08-00248 +10.0 +4.6 S08-00249 +9.6 +3.1 S08-00250 +7.8 +4.8 S08-00251 +11.6 +5.3 S08-00252 +9.6 +6.4 S08-00253 +7.6 +3.0 S08-00254 +8.3 +4.5 S08-00255 +8.4 +4.9 S08-00256 +8.7 +4.6 S08-00257 +10.4 +3.1 S08-00258 +7.9 +3.3 S08-00259 +8.8 +4.4 S08-00260 +10.0 +3.5 S08-00261 +9.5 +4.7 S08-00262 +10.8 +4.8 S08-00263 +7.7 +3.4 S08-00272 +11.7 +3.7 S08-00273 +10.2 +3.5 S08-00274 +9.6 +3.3 S08-00275 +10.7 +3.8 S08-00276 +10.3 +3.1 S08-00277 +11.6 +4.7 S08-00278 +10.5 +6.1 S08-00279 +8.4 +2.8 S08-00280 +12.3 +5.2 S08-00281 +11.7 +4.1 S08-00282 +22.2 +12.4 S08-00283 +15.1 +6.6 S08-00284 +4.7 S08-00285 +3.7
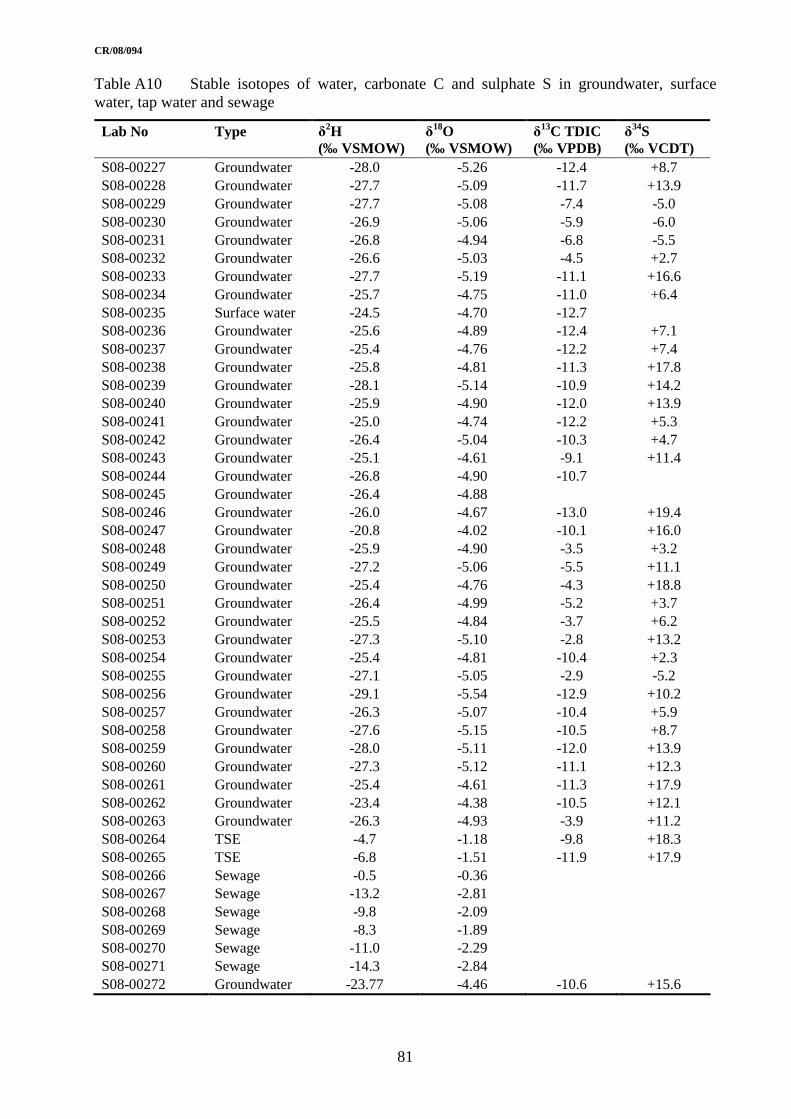
CR/08/094
81
Table A10 Stable isotopes of water, carbonate C and sulphate S in groundwater, surface water, tap water and sewage
Lab No Type δ2H
(‰ VSMOW) δ
18O (‰ VSMOW)
δ13C TDIC
(‰ VPDB) δ
34S (‰ VCDT)
S08-00227 Groundwater -28.0 -5.26 -12.4 +8.7 S08-00228 Groundwater -27.7 -5.09 -11.7 +13.9 S08-00229 Groundwater -27.7 -5.08 -7.4 -5.0 S08-00230 Groundwater -26.9 -5.06 -5.9 -6.0 S08-00231 Groundwater -26.8 -4.94 -6.8 -5.5 S08-00232 Groundwater -26.6 -5.03 -4.5 +2.7 S08-00233 Groundwater -27.7 -5.19 -11.1 +16.6 S08-00234 Groundwater -25.7 -4.75 -11.0 +6.4 S08-00235 Surface water -24.5 -4.70 -12.7 S08-00236 Groundwater -25.6 -4.89 -12.4 +7.1 S08-00237 Groundwater -25.4 -4.76 -12.2 +7.4 S08-00238 Groundwater -25.8 -4.81 -11.3 +17.8 S08-00239 Groundwater -28.1 -5.14 -10.9 +14.2 S08-00240 Groundwater -25.9 -4.90 -12.0 +13.9 S08-00241 Groundwater -25.0 -4.74 -12.2 +5.3 S08-00242 Groundwater -26.4 -5.04 -10.3 +4.7 S08-00243 Groundwater -25.1 -4.61 -9.1 +11.4 S08-00244 Groundwater -26.8 -4.90 -10.7 S08-00245 Groundwater -26.4 -4.88 S08-00246 Groundwater -26.0 -4.67 -13.0 +19.4 S08-00247 Groundwater -20.8 -4.02 -10.1 +16.0 S08-00248 Groundwater -25.9 -4.90 -3.5 +3.2 S08-00249 Groundwater -27.2 -5.06 -5.5 +11.1 S08-00250 Groundwater -25.4 -4.76 -4.3 +18.8 S08-00251 Groundwater -26.4 -4.99 -5.2 +3.7 S08-00252 Groundwater -25.5 -4.84 -3.7 +6.2 S08-00253 Groundwater -27.3 -5.10 -2.8 +13.2 S08-00254 Groundwater -25.4 -4.81 -10.4 +2.3 S08-00255 Groundwater -27.1 -5.05 -2.9 -5.2 S08-00256 Groundwater -29.1 -5.54 -12.9 +10.2 S08-00257 Groundwater -26.3 -5.07 -10.4 +5.9 S08-00258 Groundwater -27.6 -5.15 -10.5 +8.7 S08-00259 Groundwater -28.0 -5.11 -12.0 +13.9 S08-00260 Groundwater -27.3 -5.12 -11.1 +12.3 S08-00261 Groundwater -25.4 -4.61 -11.3 +17.9 S08-00262 Groundwater -23.4 -4.38 -10.5 +12.1 S08-00263 Groundwater -26.3 -4.93 -3.9 +11.2 S08-00264 TSE -4.7 -1.18 -9.8 +18.3 S08-00265 TSE -6.8 -1.51 -11.9 +17.9 S08-00266 Sewage -0.5 -0.36 S08-00267 Sewage -13.2 -2.81 S08-00268 Sewage -9.8 -2.09 S08-00269 Sewage -8.3 -1.89 S08-00270 Sewage -11.0 -2.29 S08-00271 Sewage -14.3 -2.84 S08-00272 Groundwater -23.77 -4.46 -10.6 +15.6
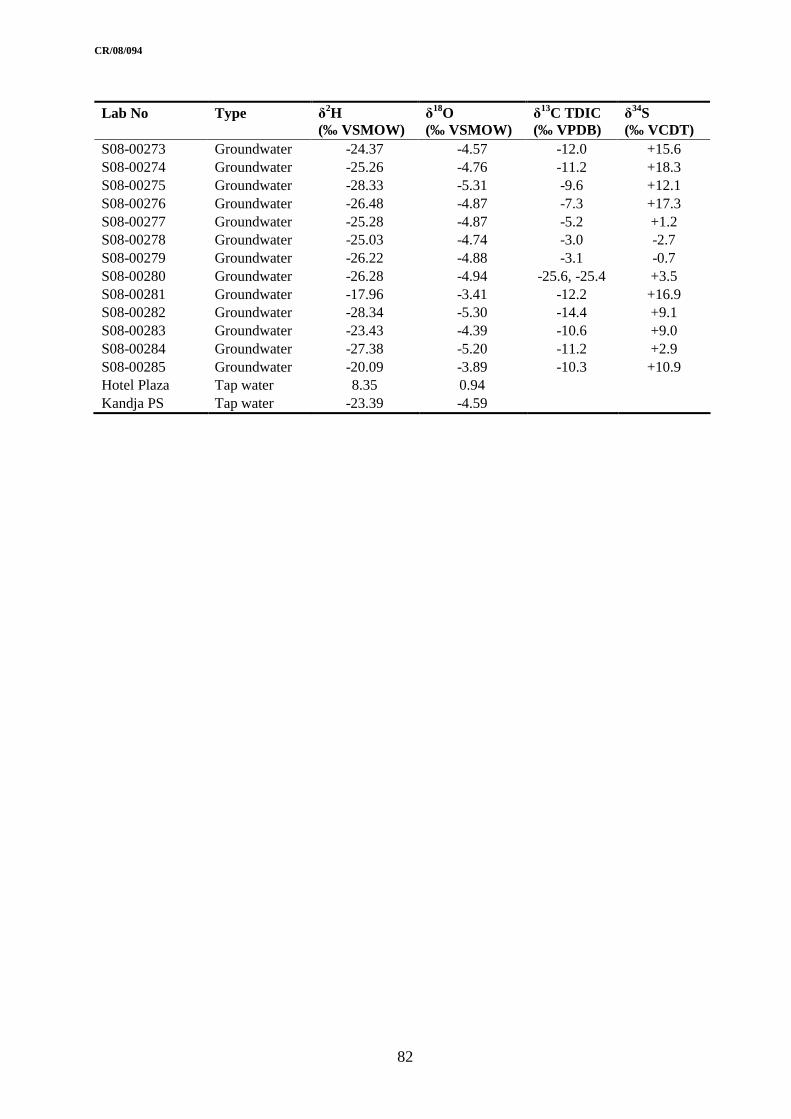
CR/08/094
82
Lab No Type δ2H
(‰ VSMOW) δ
18O (‰ VSMOW)
δ13C TDIC
(‰ VPDB) δ
34S (‰ VCDT)
S08-00273 Groundwater -24.37 -4.57 -12.0 +15.6 S08-00274 Groundwater -25.26 -4.76 -11.2 +18.3 S08-00275 Groundwater -28.33 -5.31 -9.6 +12.1 S08-00276 Groundwater -26.48 -4.87 -7.3 +17.3 S08-00277 Groundwater -25.28 -4.87 -5.2 +1.2 S08-00278 Groundwater -25.03 -4.74 -3.0 -2.7 S08-00279 Groundwater -26.22 -4.88 -3.1 -0.7 S08-00280 Groundwater -26.28 -4.94 -25.6, -25.4 +3.5 S08-00281 Groundwater -17.96 -3.41 -12.2 +16.9 S08-00282 Groundwater -28.34 -5.30 -14.4 +9.1 S08-00283 Groundwater -23.43 -4.39 -10.6 +9.0 S08-00284 Groundwater -27.38 -5.20 -11.2 +2.9 S08-00285 Groundwater -20.09 -3.89 -10.3 +10.9 Hotel Plaza Tap water 8.35 0.94 Kandja PS Tap water -23.39 -4.59
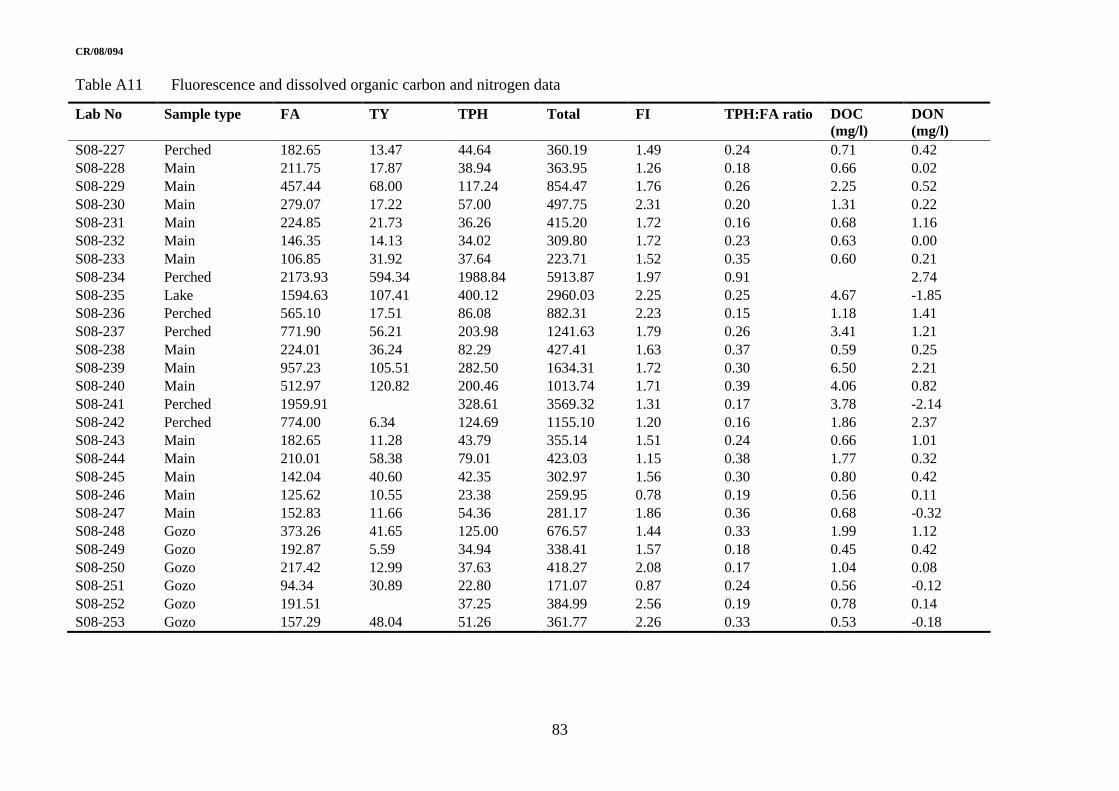
CR/08/094
83
Table A11 Fluorescence and dissolved organic carbon and nitrogen data
Lab No Sample type FA TY TPH Total FI TPH:FA ratio DOC (mg/l)
DON (mg/l)
S08-227 Perched 182.65 13.47 44.64 360.19 1.49 0.24 0.71 0.42 S08-228 Main 211.75 17.87 38.94 363.95 1.26 0.18 0.66 0.02 S08-229 Main 457.44 68.00 117.24 854.47 1.76 0.26 2.25 0.52 S08-230 Main 279.07 17.22 57.00 497.75 2.31 0.20 1.31 0.22 S08-231 Main 224.85 21.73 36.26 415.20 1.72 0.16 0.68 1.16 S08-232 Main 146.35 14.13 34.02 309.80 1.72 0.23 0.63 0.00 S08-233 Main 106.85 31.92 37.64 223.71 1.52 0.35 0.60 0.21 S08-234 Perched 2173.93 594.34 1988.84 5913.87 1.97 0.91 2.74 S08-235 Lake 1594.63 107.41 400.12 2960.03 2.25 0.25 4.67 -1.85 S08-236 Perched 565.10 17.51 86.08 882.31 2.23 0.15 1.18 1.41 S08-237 Perched 771.90 56.21 203.98 1241.63 1.79 0.26 3.41 1.21 S08-238 Main 224.01 36.24 82.29 427.41 1.63 0.37 0.59 0.25 S08-239 Main 957.23 105.51 282.50 1634.31 1.72 0.30 6.50 2.21 S08-240 Main 512.97 120.82 200.46 1013.74 1.71 0.39 4.06 0.82 S08-241 Perched 1959.91 328.61 3569.32 1.31 0.17 3.78 -2.14 S08-242 Perched 774.00 6.34 124.69 1155.10 1.20 0.16 1.86 2.37 S08-243 Main 182.65 11.28 43.79 355.14 1.51 0.24 0.66 1.01 S08-244 Main 210.01 58.38 79.01 423.03 1.15 0.38 1.77 0.32 S08-245 Main 142.04 40.60 42.35 302.97 1.56 0.30 0.80 0.42 S08-246 Main 125.62 10.55 23.38 259.95 0.78 0.19 0.56 0.11 S08-247 Main 152.83 11.66 54.36 281.17 1.86 0.36 0.68 -0.32 S08-248 Gozo 373.26 41.65 125.00 676.57 1.44 0.33 1.99 1.12 S08-249 Gozo 192.87 5.59 34.94 338.41 1.57 0.18 0.45 0.42 S08-250 Gozo 217.42 12.99 37.63 418.27 2.08 0.17 1.04 0.08 S08-251 Gozo 94.34 30.89 22.80 171.07 0.87 0.24 0.56 -0.12 S08-252 Gozo 191.51 37.25 384.99 2.56 0.19 0.78 0.14 S08-253 Gozo 157.29 48.04 51.26 361.77 2.26 0.33 0.53 -0.18

CR/08/094
84
Lab No Sample type FA TY TPH Total FI TPH:FA ratio DOC (mg/l)
DON (mg/l)
S08-254 Gozo 726.02 25.88 108.41 1302.17 1.90 0.15 2.62 0.31 S08-255 Gozo 277.47 10.64 45.81 507.90 1.79 0.17 0.75 0.10 S08-256 Perched 194.97 3.35 32.61 343.16 1.55 0.17 0.53 0.07 S08-257 Perched 951.69 17.01 162.83 1453.67 1.43 0.17 2.22 0.50 S08-258 Perched 364.07 13.33 70.37 605.82 1.39 0.19 0.95 0.92 S08-259 Main 252.90 35.35 107.12 559.58 1.49 0.42 0.67 0.30 S08-260 Main 260.66 14.88 46.62 427.00 1.56 0.18 1.07 -0.80 S08-261 Main 210.73 2.30 32.66 321.07 1.68 0.15 0.51 0.72 S08-262 Main 271.25 27.76 60.53 479.64 1.44 0.22 0.76 0.52 S08-263 Main 146.23 6.15 31.35 284.56 1.69 0.21 0.45 0.32 S08-264 TSE 2078.89 258.75 1425.34 6324.18 1.47 0.69 12.6 1.11 S08-265 TSE 2506.47 99.97 988.29 5760.22 1.69 0.39 9.9 0.17 S08-266 Sewage 11956.45 12790.55 20559.69 53928.22 1.04 1.72 23.1 S08-267 Sewage 12319.24 10962.56 49092.96 68727.29 1.07 3.99 21.9 S08-268 Sewage 12874.84 13927.20 57039.83 76902.89 1.97 4.43 33 S08-269 Sewage 15502.01 15648.05 28016.18 71317.88 1.35 1.81 50.7 S08-270 Sewage 13811.82 13950.76 28984.97 65294.11 1.15 2.10 26.7 S08-271 Sewage 15616.43 4097.18 15312.61 51194.30 1.14 0.98 20.8 S08-272 Main 356.91 98.59 208.81 801.24 1.63 0.59 11.4 4.58 S08-273 Perched 162.71 63.26 68.45 364.17 1.67 0.42 3.5 -0.53 S08-274 Main 218.73 35.05 62.68 397.52 1.58 0.29 3.8 -1.09 S08-275 Gozo 194.66 24.50 48.83 345.37 1.42 0.25 1.8 4.03 S08-276 Gozo 234.08 33.73 55.38 433.99 3.11 0.24 2.6 -2.30 S08-277 Gozo 24.97 5.29 45.99 2.56 0.21 1.9 -0.25 S08-278 Gozo 207.45 7.51 56.47 399.77 1.91 0.27 -1 -0.23 S08-279 Gozo 275.57 122.72 211.92 710.37 1.50 0.77 13.5 -0.33 S08-280 Gozo 211.57 33.82 75.05 430.30 1.84 0.35 4.1 2.46 S08-281 Main 211.99 55.95 107.95 429.12 1.57 0.51 6.1 5.63 S08-282 Main 93.22 7.24 34.31 307.35 1.63 0.37 3.9 0.31 S08-283 Main 80.38 18.17 163.46 1.48 0.23 3.2 -2.52 S08-284 Perched 784.17 63.34 227.02 1306.76 1.91 0.29 8.4

CR/08/094
85
Lab No Sample type FA TY TPH Total FI TPH:FA ratio DOC (mg/l)
DON (mg/l)
S08-285 Perched 544.91 40.81 126.30 1047.68 1.30 0.23 3.1 -3.19 S08-286 Sewage 6827.24 7944.17 15189.01 31208.84 1.33 2.22 S08-287 Sewage 12611.83 10669.49 22244.96 55059.45 1.84 1.76 36.9 S08-288 Sewage 9051.20 6906.23 15563.02 36363.37 0.94 1.72 19.3 S08-289 Sewage 5764.37 476.65 3479.72 14354.88 1.11 0.60 S08-682A Animal waste 39479.67 23160.71 46925.76 109023.91 158.61 1.19 S08-682B Animal waste 35586.79 15708.84 34952.30 94413.81 146.98 0.98 S08-683A Animal waste 6878.86 12392.47 13473.40 36276.77 134.44 1.96 S08-683B Animal waste 8384.88 15676.03 18324.99 43630.91 181.13 2.19 S08-684A Animal waste 13163.17 18299.74 60282.88 80686.71 140.07 4.58 S08-684B Animal waste 12905.98 19955.24 66029.34 84251.78 219.71 5.12 S08-685A Animal waste 9408.92 3559.49 8149.58 29985.03 196.99 0.87 S08-685B Animal waste 10221.53 3500.40 8380.18 31075.40 75.13 0.82 S08-686A Animal waste 18735.87 20686.13 73792.80 103359.21 134.74 3.94 S08-686B Animal waste 24557.62 26340.76 97117.97 124609.62 147.04 3.95 S08-687A Animal waste 7212.40 9718.51 12123.04 35783.50 138.49 1.68 S08-687B Animal waste 8836.41 10373.40 12226.10 37633.60 126.58 1.38 S08-688A Animal waste 14542.13 2192.81 12910.67 37344.56 144.07 0.89 S08-688B Animal waste 12437.11 1521.54 8614.49 31064.98 94.45 0.69 S08-689A Animal waste 129210.75 3940.69 57588.82 252645.49 323.18 0.45 S08-689B Animal waste 139261.89 6602.63 78265.83 276753.18 321.98 0.56
FA = ‘fulvic acid’ area – soil type fluorescence TY = ‘tyrosine’ area – protein type fluorescence TPH = ‘trytophan’ area – protein type fluorescence FI = fluorescence index – ratio of the emission intensity at a wavelength of 450 nm to that at 500 nm at an excitation wavelength of 370 nm Animal wastes leached 0.5 g wet material in 20 ml MilliQ water DON = dissolved organic nitrogen – by difference between TDN (total dissolved N) and (NO3-N + NO2-N + NH4-N). Hence background variation ± 2 mg/l.

CR/08/094
86
Table A12 Groundwater tracers
SF6 CFC-12 CFC-11 Lab No Conc. (fmol/L)
Estimated error (fmol/L)
Fraction modern water
Average year of recharge
Conc. (fmol/L)
Estimated error (fmol/L)
Fraction modern water
Average year of recharge
Conc. (fmol/L)
Estimated error (fmol/L)
Fraction modern water
Average year of recharge
S08-00228 0.84 0.13 0.40 1992 1.00 0.05 0.48 1977 1.52 0.08 0.43 1974 S08-00231 0.57 0.11 0.27 1988 0.81 0.04 0.39 1974 0.89 0.04 0.25 1971 S08-00232 0.49 0.10 0.23 1986 1.40 0.07 0.68 1983 2.41 0.12 0.69 1980 S08-00238 0.58 0.11 0.28 1988 1.20 0.06 0.58 1980 1.83 0.09 0.52 1976 S08-00239 0.99 0.15 0.48 1994 1.74 0.09 0.85 1988 1.80 0.09 0.51 1976 S08-00240 0.73 0.12 0.35 1990 1.06 0.05 0.51 1978 1.54 0.08 0.44 1975 S08-00243 0.71 0.12 0.34 1990 3.10 0.15 1.51 >modern 9.84 0.49 2.80 >modern S08-00244 0.54 0.10 0.26 1987 1.03 0.05 0.50 1977 2.26 0.11 0.64 1979 S08-00245 0.82 0.13 0.39 1992 100.43 5.02 48.86 >modern 41.05 2.05 11.68 >modern S08-00246 0.56 0.11 0.27 1987 1.58 0.08 0.77 1986 2.09 0.10 0.59 1978 S08-00248 0.12 0.06 0.06 1975 0.57 0.03 0.28 1971 1.02 0.05 0.29 1972 S08-00249 0.38 0.09 0.18 1984 0.93 0.05 0.45 1976 1.20 0.06 0.34 1973 S08-00252 0.32 0.08 0.15 1982 0.55 0.03 0.27 1971 0.94 0.05 0.27 1971 S08-00254 0.59 0.11 0.28 1988 1.35 0.07 0.66 1982 1.50 0.07 0.43 1974 S08-00261 0.44 0.09 0.21 1985 2.95 0.15 1.43 >modern 8.23 0.41 2.34 >modern S08-00273 0.90 0.14 0.43 1993 3.51 0.18 1.71 >modern 7.35 0.37 2.09 >modern S08-00275 0.51 0.10 0.24 1986 1.02 0.05 0.50 1977 2.06 0.10 0.58 1977 S08-00276 0.50 0.10 0.24 1984 0.88 0.04 0.43 1975 1.21 0.06 0.34 1973 S08-00277 0.40 0.09 0.19 1986 0.66 0.03 0.32 1973 1.63 0.08 0.46 1975 S08-00278 0.00 0.05 0.00 <1971 0.00 0.00 0.00 <1944 0.00 0.00 0.00 <1949 S08-00279 0.21 0.10 0.10 1979 0.38 0.02 0.19 1968 0.14 0.01 0.04 1960 S08-00280 0.71 0.12 0.34 1990 1.29 0.06 0.63 1982 2.23 0.11 0.63 1979 S08-00281 0.47 0.10 0.23 1986 3.10 0.16 1.51 >modern 5.80 0.29 1.65 >modern
Data in red have concentrations of CFCs greater than atmospheric and indicate exposure to pollution

CR/08/094
87
Table A13 Microbiological data for groundwater (cfu/100 ml)
BGS Lab No WSC Lab No Time Total coli E. Coli S08-00227 08/0329 10.00 20 20 S08-00228 08/0324 11.20 0 0 S08-00229 08/0323 12.15 0 0 S08-00230 08/0325 12.50 24 24 S08-00231 08/0327 13.10 14 14 S08-00232 08/0328 14.10 0 0 S08-00233 08/0326 14.30 0 0 S08-00234 08/0403 9.33 >300 >300 S08-00236 08/0404 10.50 >300 >300 S08-00237 08/0405 11.20 0 0 S08-00238 08/0406 12.24 0 0 S08-00239 08/0408 13.30 0 0 S08-00240 08/0409 14.15 0 0 S08-00241 08/0434 10.15 >300 >300 S08-00242 08/0435 10.50 >300 >300 S08-00243 08/0436 12.20 0 0 S08-00244 08/0437 13.45 0 0 S08-00245 08/0438 14.30 17 17 S08-00246 08/0439 15.10 0 0 S08-00247 08/0440 16.00 0 0 S08-00248 08/0500 10.50 0 0 S08-00249 08/0497 11.15 19 19 S08-00250 08/0498 11.40 0 0 S08-00251 08/0499 12.15 0 0 S08-00252 08/0494 14.00 0 0 S08-00253 08/0493 14.35 0 0 S08-00254 08/0495 15.20 >300 >300 S08-00255 08/0496 16.00 >300 >300 S08-00256 08/0526 13.30 0 0 S08-00257 08/0525 14.30 >300 >300 S08-00258 08/0527 15.20 >300 >300 S08-00259 08/0542 11.00 0 0 S08-00260 08/0544 12.15 >300 >300 S08-00261 08/0543 13.30 35 35 S08-00262 08/0551 11.30 0 0 S08-00263 08/550 12.45 5 5 S08-00272 08/1308 11.20 0 0 S08-00273 08/1309 12.30 2 2 S08-00274 08/1310 14.10 0 0 S08-00275 08/1334 13.30 0 0 S08-00276 08/1338 13.50 0 0 S08-00277 08/1335 14.15 0 0 S08-00278 08/1336 14.45 0 0 S08-00279 08/1337 15.00 0 0 S08-00280 08/1339 15.30 0 0 S08-00281 08/1359 12.00 0 0 S08-00282 08/1360 12.40 0 0 S08-00283 08/1361 14.00 0 0 S08-00284 08/1395 14.10 33 33 S08-00285 08/1396 15.00 61 61
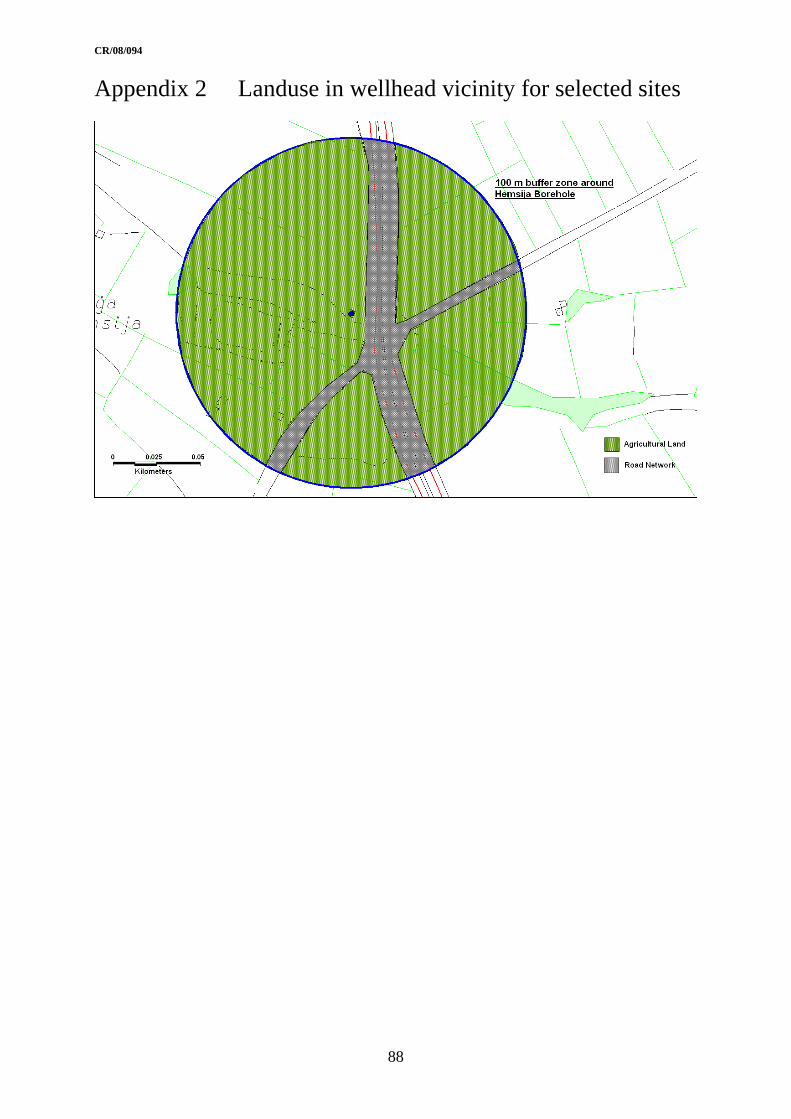
CR/08/094
88
Appendix 2 Landuse in wellhead vicinity for selected sites

CR/08/094
89
Appendix 3 Maps of distribution of key indicators
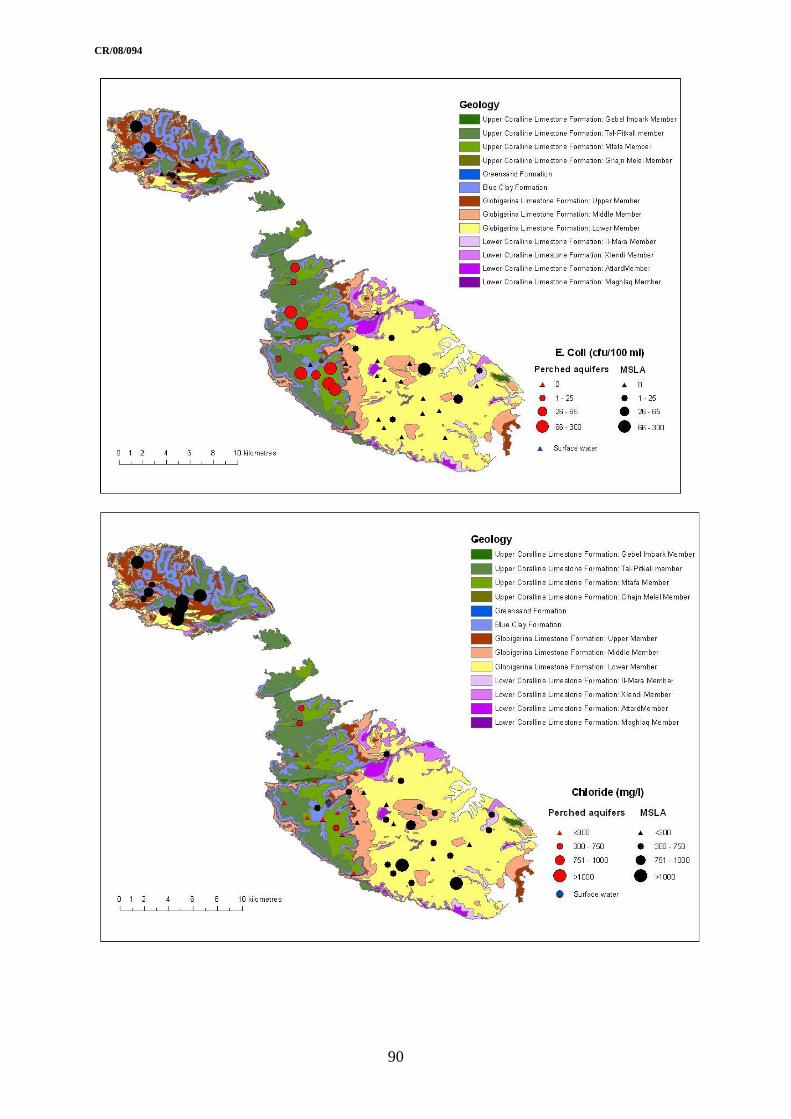
CR/08/094
90
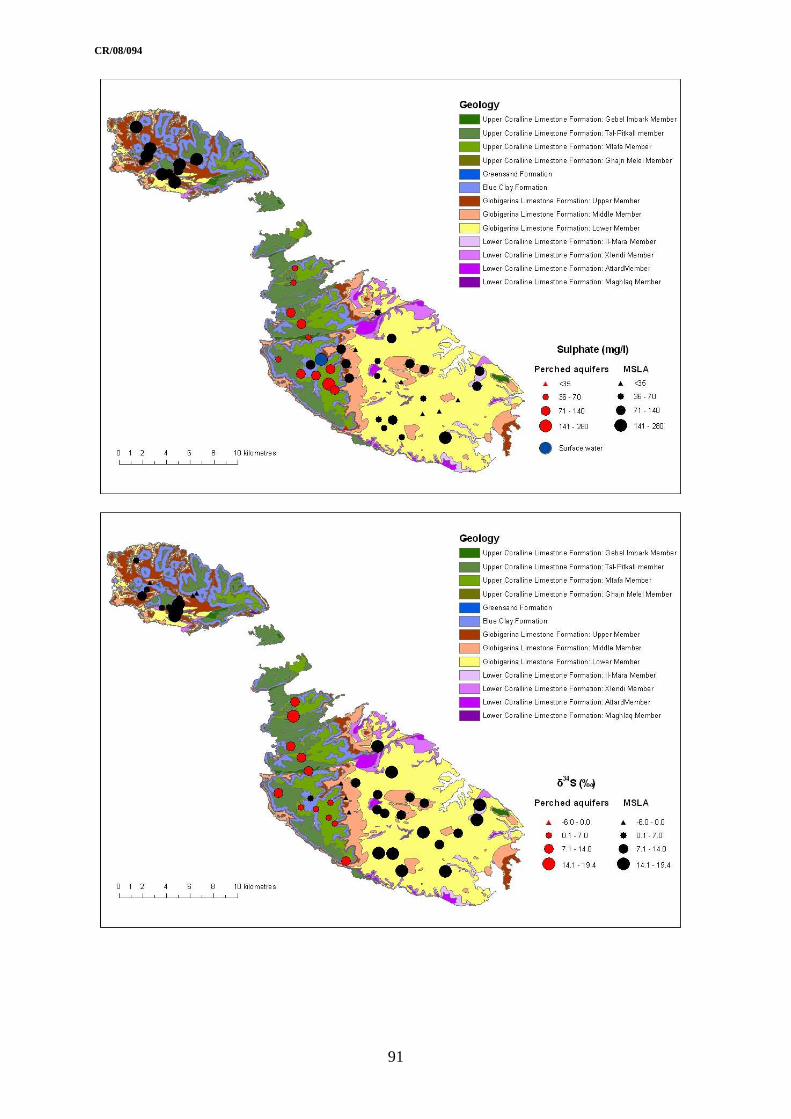
CR/08/094
91

CR/08/094
92

CR/08/094
93

CR/08/094
94

CR/08/094
95
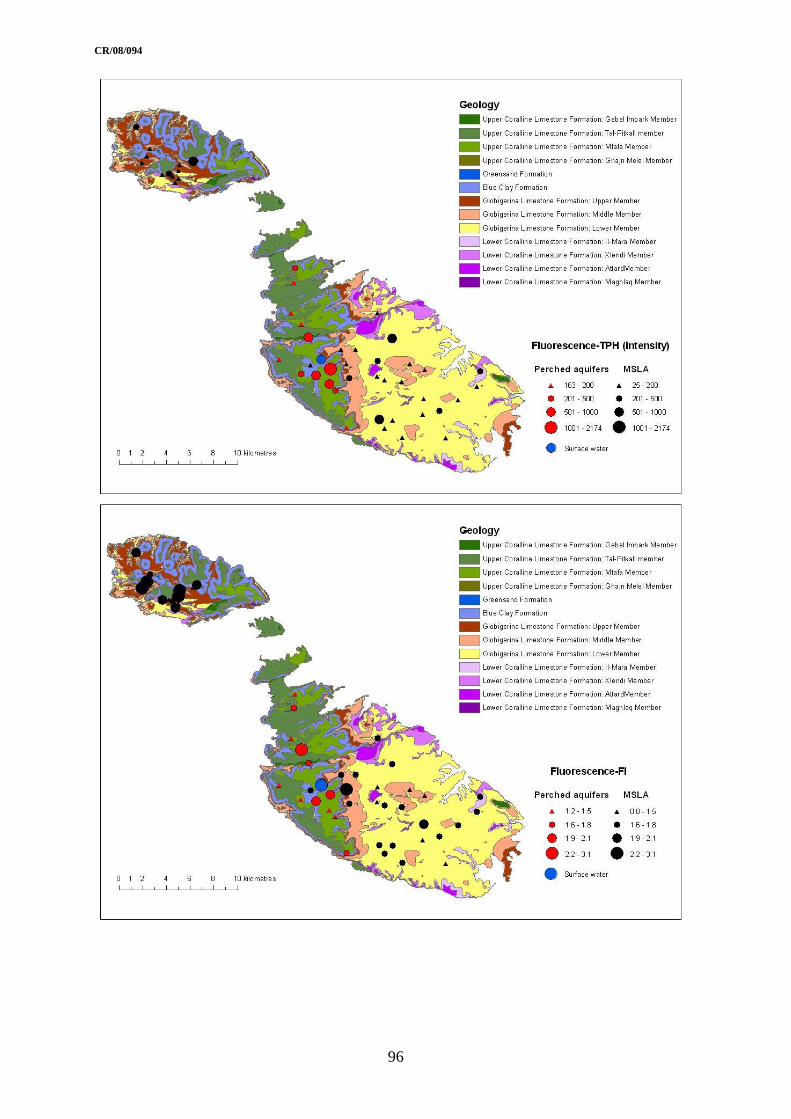
CR/08/094
96

CR/08/094
97
Appendix 4 Nitrate crossplots
MAJOR IONS
0
1000
2000
3000
4000
5000
6000
7000
0 20 40 60 80 100
Nitrate-N concentration (mg/l)
SE
C(µ
S/c
m)
0
1
2
3
4
5
6
7
0 20 40 60 80 100
Nitrate-N concentration (mg/l)
Br
conc
entr
atio
n (m
g/l)
0
50
100
150
200
250
300
0 20 40 60 80 100
Nitrate-N concentration (mg/l)
Ca
conc
entr
atio
n (m
g/l)
0
500
1000
1500
2000
2500
0 20 40 60 80 100
Nitrate-N concentration (mg/l)
Cl c
once
ntra
tion
(mg/
l)
0
1
2
3
0 20 40 60 80 100
Nitrate-N concentration (mg/l)
F c
once
ntra
tion
(mg/
l)
100
150
200
250
300
350
0 20 40 60 80 100
Nitrate-N concentration (mg/l)
HC
O3 c
once
ntra
tion
(mg/
l)

CR/08/094
98
0
5
10
15
20
25
30
35
40
45
50
0 20 40 60 80 100
Nitrate-N concentration (mg/l)
K c
once
ntra
tion
(mg/
l)
0
20
40
60
80
100
120
140
160
0 20 40 60 80 100
Nitrate-N concentration (mg/l)
Mg
conc
entr
atio
n (m
g/l)
0
200
400
600
800
1000
1200
0 20 40 60 80 100
Nitrate-N concentration (mg/l)
Na
conc
entr
atio
n (m
g/l)
0
1
2
3
4
5
0 20 40 60 80 100
Nitrate-N concentration (mg/l)
Sr
conc
entr
atio
n (m
g/l)
0
50
100
150
200
250
300
0 20 40 60 80 100
Nitrate-N concentration (mg/l)
SO
4 c
once
ntra
tion
(mg/
l)
Background Perched
Urban PerchedCesspit Perched
Agriculture PerchedCattle Perched
Pig Perched
Under Perched Malta MSLUrban Malta MSL
Sewer Malta MSLTSE irrigation Malta MSL
Agriculture Malta MSL
Cattle Malta MSLPig Malta MSL:
Under Perched Gozo MSL
Urban Gozo MSLAgriculture Gozo MSL
Cattle Gozo MSLPig Gozo MSL

CR/08/094
99
FE AND MN
0
0.1
0.2
0.3
0.4
0.5
0 20 40 60 80 100
Nitrate-N concentration (mg/l)
Fe
conc
entr
atio
n (m
g/l)
0
10
20
30
40
50
60
0 20 40 60 80 100
Nitrate-N concentration (mg/l)M
n co
ncen
trat
ion
(µg/
l)
TRACE ELEMENTS
0
1
2
3
4
5
6
7
0 20 40 60 80 100
Nitrate-N concentration (mg/l)
As
conc
entr
atio
n (µ
g/l)
0
0.1
0.2
0.3
0.4
0.5
0 20 40 60 80 100
Nitrate-N concentration (mg/l)
B c
once
ntra
tion
(µg/
l)

CR/08/094
100
0.0
0.1
0.2
0.3
0.4
0 20 40 60 80 100
Nitrate-N concentration (mg/l)
Cd
conc
entr
atio
n (µ
g/l)
0.0
0.2
0.4
0.6
0.8
1.0
1.2
0 20 40 60 80 100
Nitrate-N concentration (mg/l)
Co
conc
entr
atio
n (µ
g/l)
0
1
2
3
4
5
6
0 20 40 60 80 100
Nitrate-N concentration (mg/l)
Cr
conc
entr
atio
n (µ
g/l)
0
2
4
6
8
10
12
14
0 20 40 60 80 100
Nitrate-N concentration (mg/l)
Cu
conc
entr
atio
n (µ
g/l)
0 20 40 60 80 100
Nitrate-N concentration (mg/l)
Li c
once
ntra
tion
(µg/
l)
0
2
4
6
8
10
12
14
16
0 20 40 60 80 100
Nitrate-N concentration (mg/l)
Mo
conc
entr
atio
n (µ
g/l)

CR/08/094
101
0
1
2
3
4
5
6
7
8
9
0 20 40 60 80 100
Nitrate-N concentration (mg/l)
Pb
conc
entr
atio
n (µ
g/l)
0.0
0.1
0.2
0.3
0.4
0.5
0.6
0 20 40 60 80 100
Nitrate-N concentration (mg/l)
Sb
conc
entr
atio
n (µ
g/l)
0
20
40
60
80
100
120
140
160
0 20 40 60 80 100
Nitrate-N concentration (mg/l)
V c
once
ntra
tion
(µg/
l)
0
500
1000
1500
2000
2500
0 20 40 60 80 100
Nitrate-N concentration (mg/l)
Zn
conc
entr
atio
n (µ
g/l)

CR/08/094
102
ORGANIC INDICATORS
0
2
4
6
8
10
12
14
0 20 40 60 80 100
Nitrate-N concentration (mg/l)
DO
C c
once
ntra
tion
(mg/
l)
0
500
1000
1500
2000
2500
0 20 40 60 80 100
Nitrate-N concentration (mg/l)F
A
0
100
200
300
400
0 20 40 60 80 100
Nitrate-N concentration (mg/l)
TP
H
0.0
0.1
0.2
0.3
0.4
0.5
0.6
0.7
0.8
0.9
1.0
0 20 40 60 80 100
Nitrate-N concentration (mg/l)
TP
H/F
A
0
100
200
300
400
500
600
700
0 20 40 60 80 100
Nitrate-N concentration (mg/l)
TY
0.0
0.5
1.0
1.5
2.0
2.5
3.0
3.5
0 20 40 60 80 100
Nitrate-N concentration (mg/l)
FI
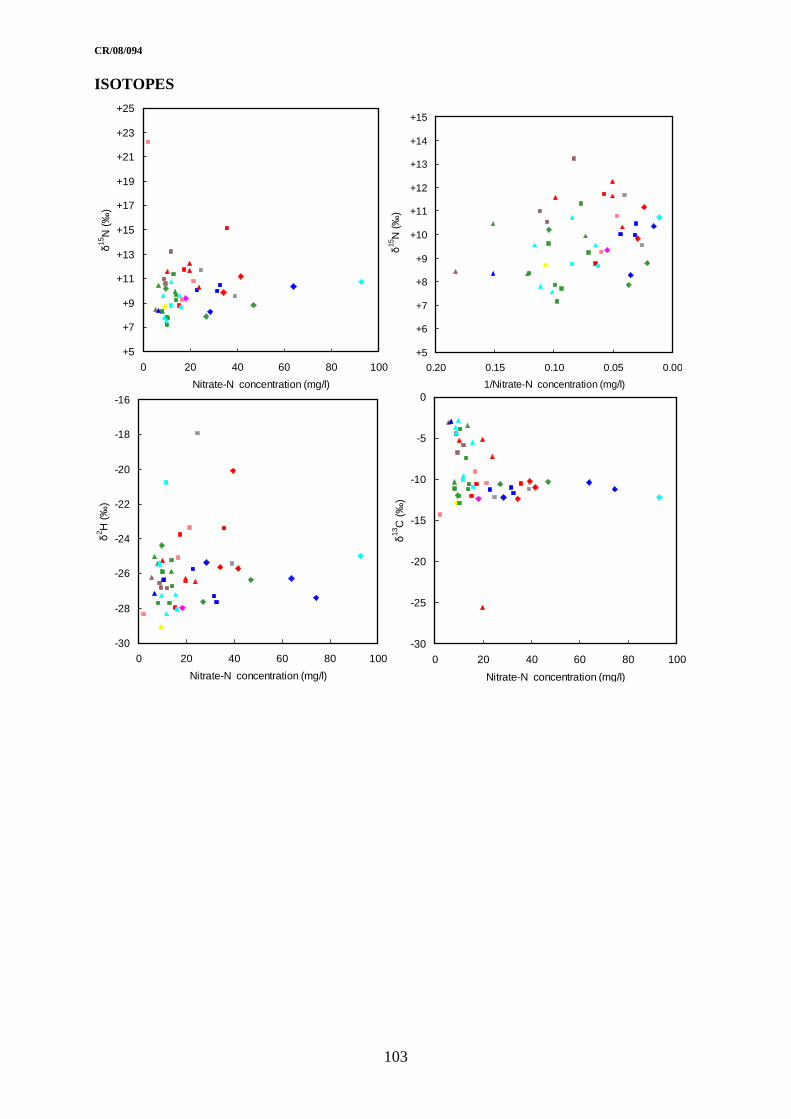
CR/08/094
103
ISOTOPES
+5
+7
+9
+11
+13
+15
+17
+19
+21
+23
+25
0 20 40 60 80 100
Nitrate-N concentration (mg/l)
δ15
N (‰
)
+5
+6
+7
+8
+9
+10
+11
+12
+13
+14
+15
0.000.050.100.150.20
1/Nitrate-N concentration (mg/l)δ
15N
(‰)
-30
-28
-26
-24
-22
-20
-18
-16
0 20 40 60 80 100
Nitrate-N concentration (mg/l)
δ2 H
(‰)
-30
-25
-20
-15
-10
-5
0
0 20 40 60 80 100
Nitrate-N concentration (mg/l)
δ13
C (‰
)
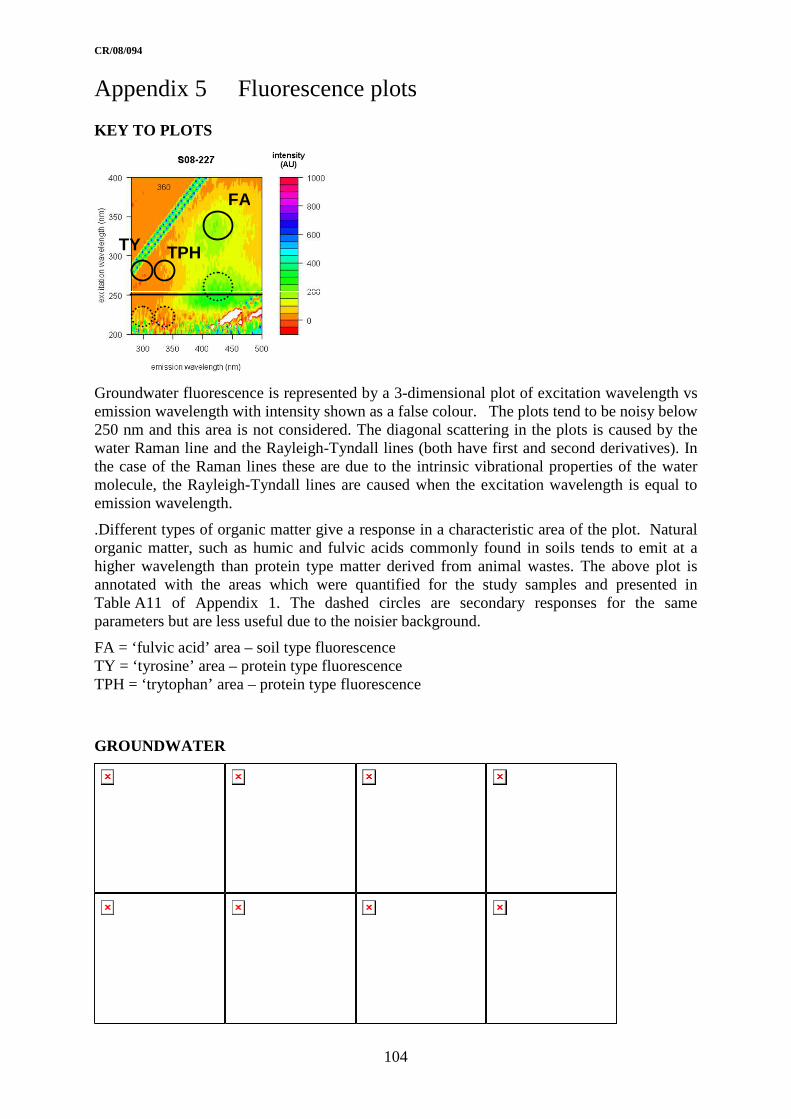
CR/08/094
104
Appendix 5 Fluorescence plots
KEY TO PLOTS
FA
TPH TY
Groundwater fluorescence is represented by a 3-dimensional plot of excitation wavelength vs emission wavelength with intensity shown as a false colour. The plots tend to be noisy below 250 nm and this area is not considered. The diagonal scattering in the plots is caused by the water Raman line and the Rayleigh-Tyndall lines (both have first and second derivatives). In the case of the Raman lines these are due to the intrinsic vibrational properties of the water molecule, the Rayleigh-Tyndall lines are caused when the excitation wavelength is equal to emission wavelength.
.Different types of organic matter give a response in a characteristic area of the plot. Natural organic matter, such as humic and fulvic acids commonly found in soils tends to emit at a higher wavelength than protein type matter derived from animal wastes. The above plot is annotated with the areas which were quantified for the study samples and presented in Table A11 of Appendix 1. The dashed circles are secondary responses for the same parameters but are less useful due to the noisier background.
FA = ‘fulvic acid’ area – soil type fluorescence TY = ‘tyrosine’ area – protein type fluorescence TPH = ‘trytophan’ area – protein type fluorescence
GROUNDWATER

CR/08/094
105

CR/08/094
106
TREATED SEWAGE EFFLUENT AND RAW SEWAGE

CR/08/094
107
SOLID ANIMAL WASTES (IN DUPLICATE)
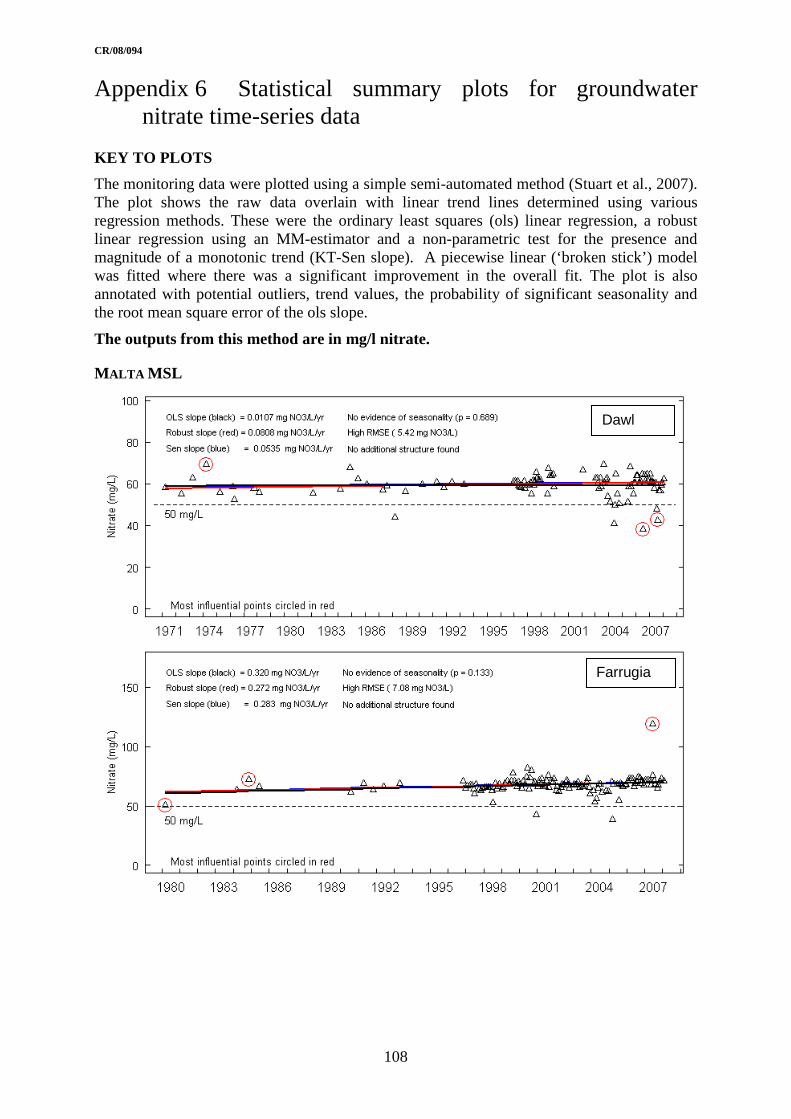
CR/08/094
108
Appendix 6 Statistical summary plots for groundwater nitrate time-series data
KEY TO PLOTS
The monitoring data were plotted using a simple semi-automated method (Stuart et al., 2007). The plot shows the raw data overlain with linear trend lines determined using various regression methods. These were the ordinary least squares (ols) linear regression, a robust linear regression using an MM-estimator and a non-parametric test for the presence and magnitude of a monotonic trend (KT-Sen slope). A piecewise linear (‘broken stick’) model was fitted where there was a significant improvement in the overall fit. The plot is also annotated with potential outliers, trend values, the probability of significant seasonality and the root mean square error of the ols slope.
The outputs from this method are in mg/l nitrate.
MALTA MSL
Farrugia
Dawl
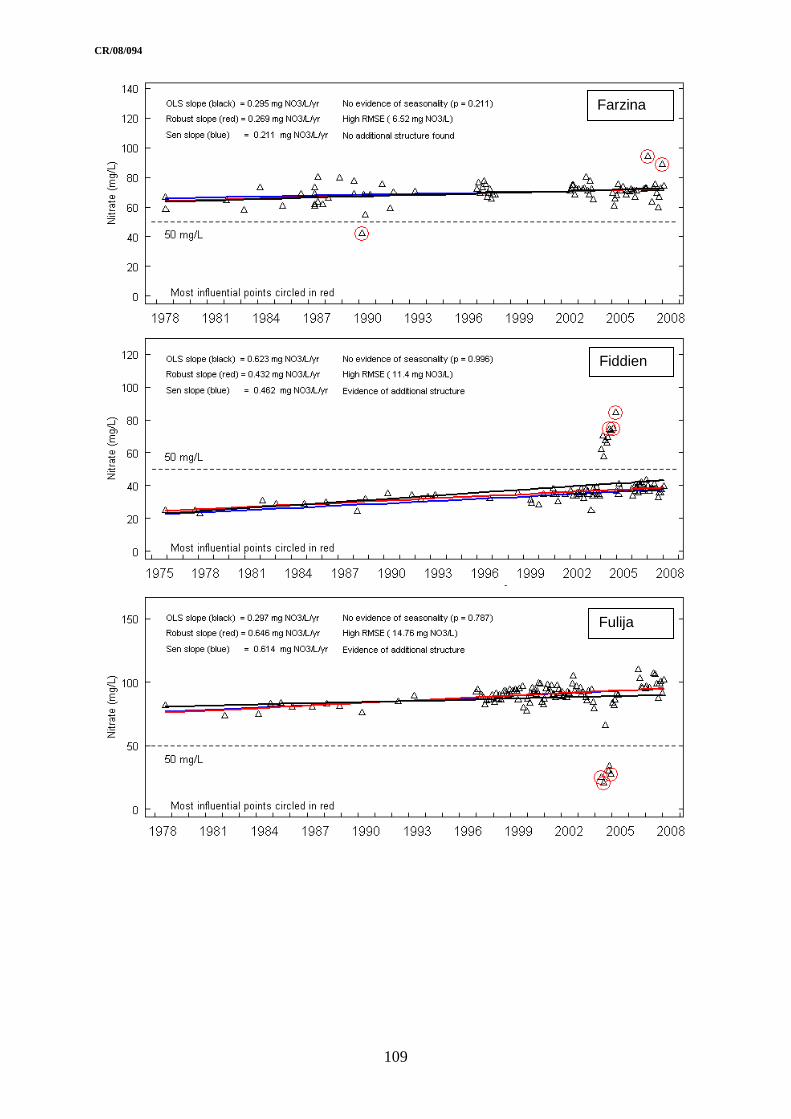
CR/08/094
109
Fiddien
Farzina
Fulija

CR/08/094
110
Hemsija
Samra
Hal Far Road

CR/08/094
111
San Niklaw
Schinas
Srina
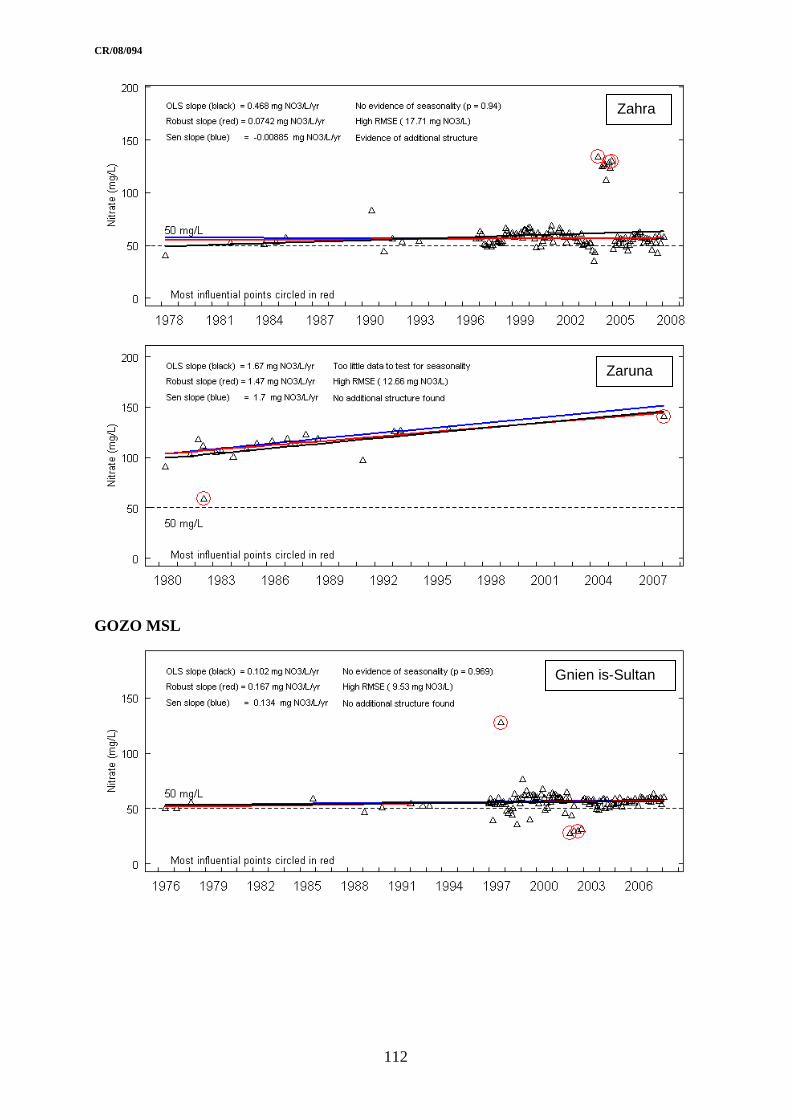
CR/08/094
112
GOZO MSL
Gnien is-Sultan
Zahra
Zaruna

CR/08/094
113
Sannat
Kappella
Munxar Old Road
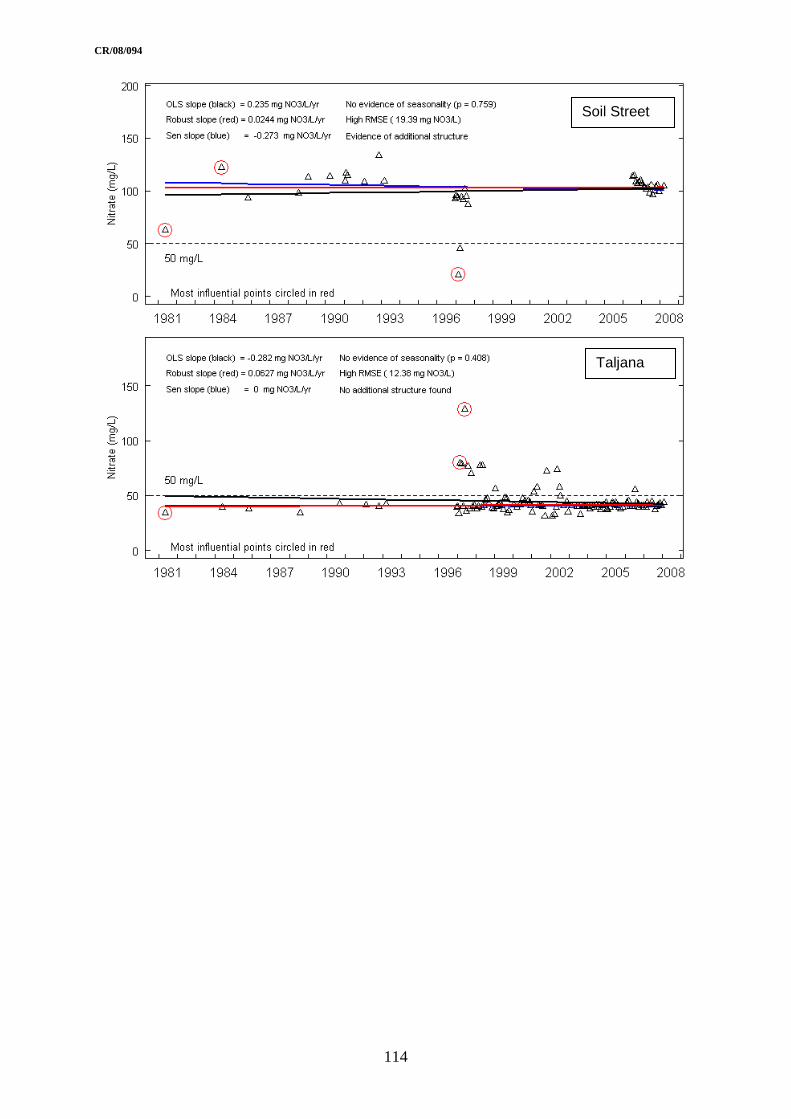
CR/08/094
114
Soil Street
Taljana