Embed Size (px)
Citation preview
IOSR Journal of Electrical and Electronics Engineering (IOSR-JEEE)
e-ISSN: 2278-1676,p-ISSN: 2320-3331, Volume 10, Issue 1 Ver. I (Jan – Feb. 2015), PP 46-57 www.iosrjournals.org
DOI: 10.9790/1676-10114657 www.iosrjournals.org 46 | Page
A Power Flow Analysis of the Nigerian 330 KV Electric Power
System
*Ogbuefi U. C.1 and Madueme T. C.
2
Department of Electrical Engineering University of Nigeria, Nsukka
Abstract: Management of reactive power and voltage control constitute part of the major challenge in power
system industry. Adequate reactive power control solves power quality problems like voltage profile
maintenance at all power transmission levels, transmission efficiency and system stability. Power demand
increases steadily while the expansion of power generation and transmission has been severely limited due to
the inadequate resources and environmental forces. These give cause for concern as they contribute to the
constant power failure in the Nigeria power system. In this work the Nigeria 330KV network, 30 bus system is
considered. To alleviate/eradicate some of these problems mentioned, compensation in power system becomes
very essential. Compensation reduces generating MVA and MVAR. The reduction in MVAR helps electrical
companies to transmit more power and absorbing more customers without expanding their power networks.
Newton-Raphson’s solution method was used to carry out the analysis because of its sparsity, fast convergence
and simplicity attribute as compared to other solution methods using the relevant data as obtained from power
holding company of Nigeria (PHCN). MAT LAB/SIMULINK software was used to carry out the simulation analysis. The results obtained showed that the bus voltages outside the statutory limit of 0.95 – 1.05p.u that is
313.5 – 346.5KV were buses 14(Jos) with value 0.8171pu, bus 17(Gombe) 0.8144p.u bus 18(Abuja) 0.9402pu,
bus 19(Maiduguri) 0.8268pu, bus 22(Kano) 0.7609pu, bus 29(Kaduna) 0.8738pu, and bus 30(Makurdi)
0.8247pu under normal uncompensated condition. Capacitive shunt compensation because of its advantages
was implemented on these buses, and the results recorded appreciable values. Results obtained after
compensation reveal acceptable voltage levels at the problem buses. For instance bus 14(Jos) come up to
0.9823p.u, bus 17(Gombe) 1.0242p.u, bus 18(Abuja) 0.9667p.u, bus 19(Maiduguri) 1.0455p.u, bus 22(Kano)
which is heavily loaded was linked to Jos and a 60 percent compensation on Kano bus yielded an increase of
0.7609pu to 0.947p.u.
Keywords: Power System, Compensation, Reactive Power, Power Flow
I. Introduction The rate at whichpower supply fails in Nigeria has reached an unprecedented level that the public is
almost demanding for a state of emergency in respect of electricity supply. The various efforts made to rescue
the power short fall has not yielded the expected outcome.
Reactive power is both the challenge and the solution to power system network voltage control. It is
important that a balance of reactive power be obtained in the operation of a power system because control of
voltage can be lost if this is not achieved. The electrical machines and apparatus have a certain maximum and
minimum operating voltage range in which the normaloperation is maintained. Beyond the voltagelimits, the
operating characteristics may be seriously affected in terms of speed, output torque, energy losses, and the
continuity of the process may be lost.Adequate reactive power control and compensation of transmission networks solve power quality problems by improving the system stability and control voltage. In Nigeria, power
demand increases steadily while the expansion of power generation and transmission has been severely limited
due to inadequate resources and environmental factors. This gives cause for concern as it contributes to the
constant power failure in the Nigeria power system, since greater demands have been placed on the transmission
network by the continuous addition of load due to the increasing number of consumers.Compensation provides a
veritable way to reduce the excess voltage/current to avoid damage to the utility centers. Compensation
techniques such asStatic VAR Compensators (SVC), Static Synchronous Compensators(STACOM) and
Synchronous condensers play a very important role in this case.
Shunt and series reactive compensation using capacitors has been widely recognized as powerful tools
to combat the problems of voltage drops, power losses, and voltage flickers in power distribution networks. The
importance of compensation schemes has increased in recent years due to the increased awareness of energy
conservation and quality of supply on the part of the Power Utility as well as power consumers. Though shunt compensation are expensive but they control voltage directly and also control temporary over voltage
rapidly.Compensation in power system becomes very essentialsincepower flow problem is the computation of
voltage magnitude and phase angle at each bus in a power system under balanced three-phase steady-state
conditions.
A power flow analysis of the nigerian 330 KV electric power system
DOI: 10.9790/1676-10114657 www.iosrjournals.org 47 | Page
The voltage magnitude statutorilyshould lie between puVi 05.195.0 and the angle should be
very small for a balanced steady state 50Hz power station to achieve the effective operation. Against these
backdrops, this paper will address the following issues: (i) develop a model-based simulation algorithm that will
be used to solve the network problems due to reactive and real power imbalance (ii) determine causes of
constant power failure that de-stabilizes the Nigeria power system with a view to achieve high performance and
efficient stability of the power system (iii) evaluate individual buses to make sure that based on the demand
imposed on it that the voltage lies within %5 of the normal voltage. Also compensation on the problem buses to improve the system efficiency will be presented.
II. Nigeria 330kv Interconnected Electric Power System The engineer who works in the electrical power industry will encounter some challenges in designing
future power systems to deliver increasing amounts of energy in a safe, clean and economical manner [1]. The origin of the Nigeria Electric power System can be traced back to the year 1898 [2] when a small generating
plant was installed in Lagos. The first power interconnection was a 132KV link constructed in 1962 between
Lagos and Ibadan. By 1968 the first National grid structure emerged with the construction of the kainji hydro
station which supplied power via a 330KV, primarily radial type transmission network into the three members’
132KV subsystem then existing in the Western, Northern and Eastern parts of the country. The 330KV and
132KV systems were initially run by two separate bodies- “Nigeria Dams Authority (NDA)”, and “Electricity
Corporation of Nigeria (ECN)” respectively. Central control for the 330KV Network was coordinated from
kainji power supply control room, while the 132KV Network was run by load dispatcher located at Ijora Power
Supply Lagos. These two bodies were merged formally into single power utility known as National Electric
Power Authority (NEPA) in 1972 thus ushering in centralized regulation and coordination of the entire rapidly
growing 330KV and 132KV National network. These networks are characterized by many disturbances which cause various hindrances and outages..
2.1 Network Description
The Nigerian power network like many practical systems in developing countries consists of a few
generating stations mostly sited in remote locations near the raw fuel sources which are usually connected to the
load centers by long transmission lines.
Generation, transmission, distribution and marketing of electricity in Nigeria are the statutory functions
of the National Electric Power Authority (NEPA) now known as Power Holding Company of Nigeria (PHCN).
Presently, the national electricity grid consists of nine generating stations comprising three (3) hydro and six (6)
thermal with a total installed generating capacity of 6500MW. The thermal stations are mainly in the southern
part of the country located at Afam, Okpai, Delta (Ughelli), Egbin and Sapele. The hydroelectric power stations
are in the country’s middle belt and are located at Kainji, Jebba and Shiroro. The transmission network is made up of 5000km of 330KV lines, 6000km of 132KV lines, 23km of 330/132KV sub-stations and 91 of 132/33KV
substations. The distribution sector is comprised of 23,753km of 33KV lines 19,226km of 11kv lines, 679 of
33/11KV sub-stations. There are also 1790 distribution transformers and 680 injection substations [3].Although,
the installed capacity of the existing power stations is 6500MW the maximum load ever recorded was
4,000MW. Presently, most of the generating units’ have broken down due to limited available resources to carry
out the needed maintenance. The transmission lines are radial and are overloaded. The switchgears are obsolete
while power transformers have not been maintained for a long time.
The present installed generating capacity is about 6000MW and the maximum generation of 4000MW
for a population of about 160 million. This indeed is grossly inadequate to meet the demand of electricity
consumers’. The current projected capacity that needs to be injected into the system is estimated at 10,000MW
which is hoped to come in through the independent power producers (IPPs) as soon as the deregulation of electricity supply industry is successfully achieved. Also, massive injection of funds is needed to expand the
distribution and transmission networks to adequately transport the power generated to consumers[4,5,6]. The
existing generating stations in the country are shown in table 1 and those under construction are shown in table
2.
S/No Power Station Name Location/State Status Capacity (MW)
1 Egbin Thermal Power Station Lagos Operating 1320
2 Afam Thermal PS Rivers Operating 969.6
3 Sapele Thermal PS Delta Operating 1020
4 Ijora Thermal PS Lagos Operating 40
5 Delta Thermal PS Delta Operating 912
6 Kainji Hydro PS Niger Operating 760
7 Jebba Hydro PS Niger Operating 578
A power flow analysis of the nigerian 330 KV electric power system
DOI: 10.9790/1676-10114657 www.iosrjournals.org 48 | Page
8 Shiroro Hydro PS Niger Operating 600
9 AES Thermal PS Lagos Operating 300
TOTAL CAPACITY = 6500
Source: [7]
Table 2 Power Stations/plants Under Construction S/N NAME STATE
Thermal Power Plant Under Construction
1 Eyeon Edo
2 Sapele Delta
3 Omoku Rivers
4 Egbema Rivers
5 GbaranUbic Beyelsa
6 Onne Rivers
7 Calabar Cross River
Proposed Hydro Power Plant
1 Dadinkowa Gombe
Proposed Biomass Power Plant
1 Ikeja Lagos
Total 9
Source: [7]
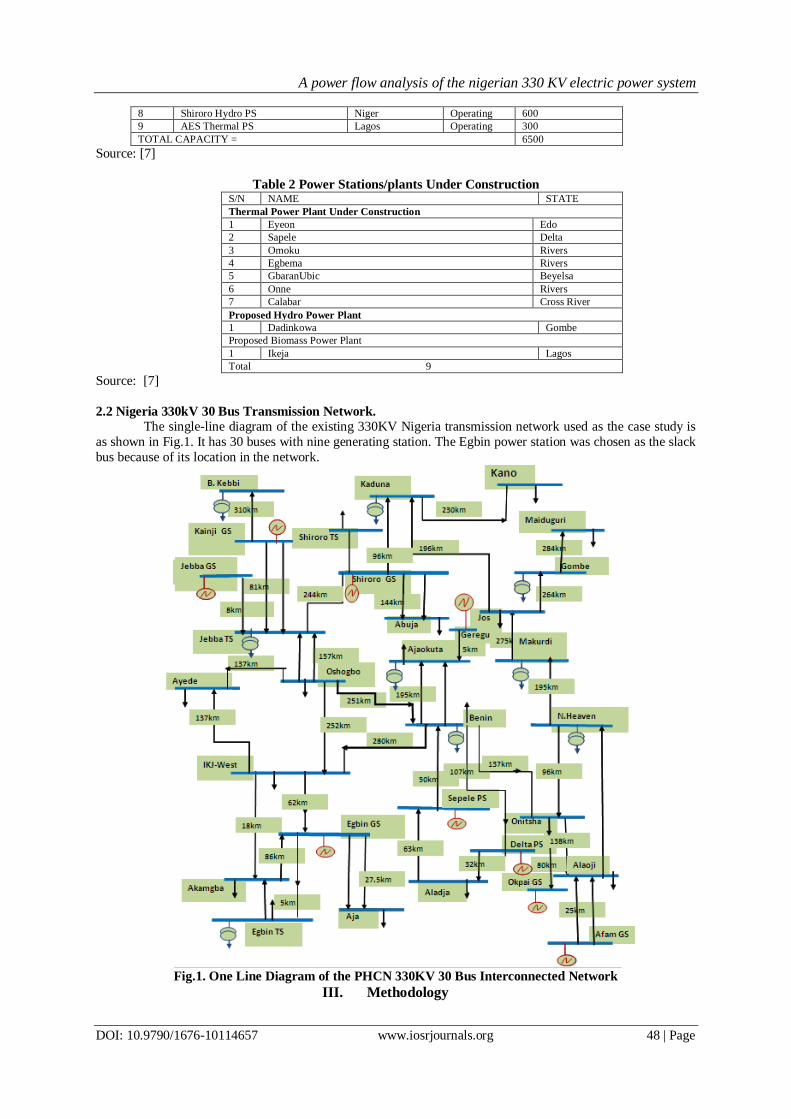
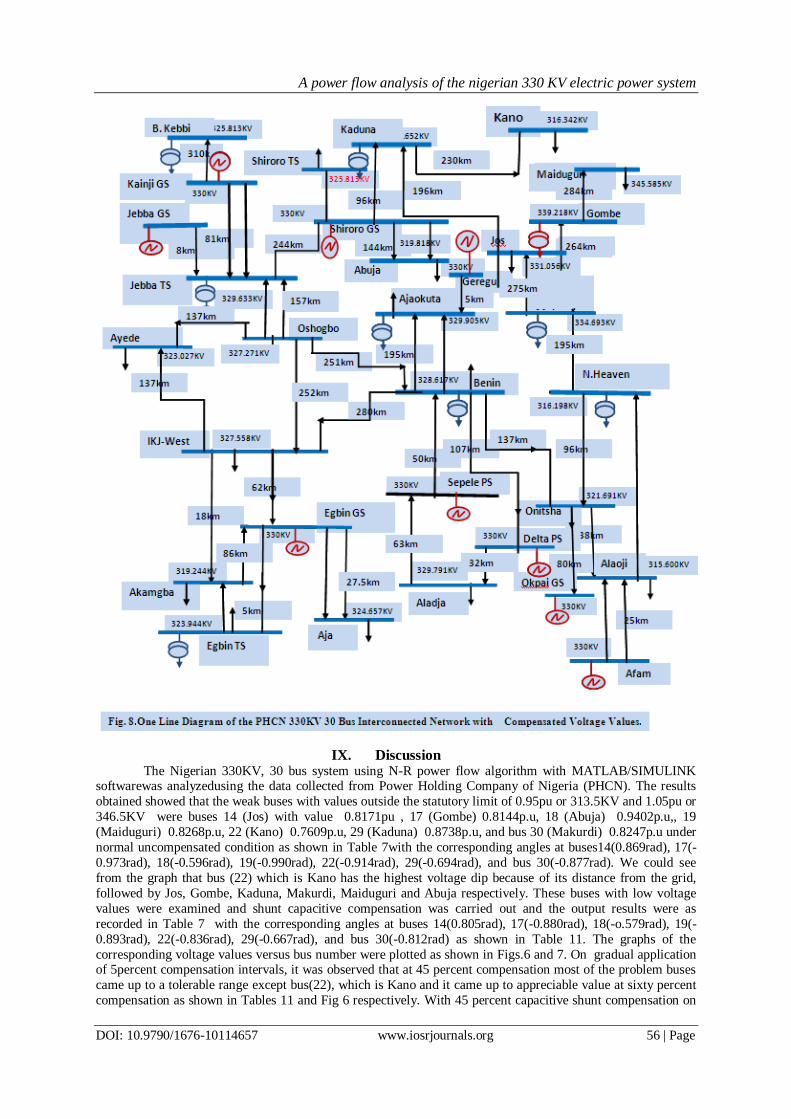
2.2 Nigeria 330kV 30 Bus Transmission Network.
The single-line diagram of the existing 330KV Nigeria transmission network used as the case study is
as shown in Fig.1. It has 30 buses with nine generating station. The Egbin power station was chosen as the slack
bus because of its location in the network.
Fig.1. One Line Diagram of the PHCN 330KV 30 Bus Interconnected Network
III. Methodology

A power flow analysis of the nigerian 330 KV electric power system
DOI: 10.9790/1676-10114657 www.iosrjournals.org 49 | Page
The Nigeria330KV transmission Integrated Power Plant (NIPP) network system in its current state has
been presented in this work. For the investigation of the existing 330KV 30 bus system of Nigeria transmission
network the Egbin power station was chosen as the slack bus. Data collection from PHCN are based on 2008 to 2010 reports. Line data, load data, the generators and other system components were also collected. Equations
for the power flow analysis are formulated incorporating these parameters. The algorithm was developed,
andNewton-Raphson’s solution method was used to carry out the analysis with equations. 1 and2 because of its
sparsity, fast convergence and simplicity attributes when compared to other solution methods. Using the
relevant data as obtained from Power Holding Company of Nigeria (PHCN). MATLAB m-file program and
SIMULINK model were developed and used for the simulation analysis.The mismatch in real and reactive
power can be written as follows:
11J 1
||22 VJQ 2
IV. Input Data The input data for the power flow analysis include the bus data that is real and reactive powers of the
generator buses, transmission line data (impedance of lines), voltages and transformer/load data obtained from
Power Holding Company of Nigeria (PHCN) are as presented in Tables 1 to 11. They were used to carry out the
simulation analysis.
Table 3 Transmission Line Data (of Bison, two conductors per phase & 2x350 mm2X-section
Conductor) for 330KV Lines. S/N Bus Name Length
(km)
R1(P.U) X1(p.u) Shunt
).(2
upy From To
1. Akamgbe Ik-West 17 0.0006 0.0051 0.065
2. Ayede Oshogbo 115 0.0041 0.0349 0.437
3. Ik-West Egbin 62 0.0022 0.0172 0.257
4. Ik-West Benin 280 0.0101 0.0799 1.162
5. Oshogbo Jebba 249 0.0056 0.477 0.597
6. Oshogbo Benin 251 0.0089 0.0763 0.954
7. JebbaTs JebbaGs 8 0.003 0.0022 0.033
8. Jebba TS Shiroro 244 0.0087 0.0742 0.927
9. Jebba TS Kainji 81 0.0022 0.0246 0.308
10. Kainji B.Kebbi 310 0.0111 0.942 1.178
11. Shiroro Kaduna 96 0.0034 0.0292 0.364
12. Kaduna Kano 320 0.0082 0.0899 0.874
13. Jos Gombe 265 0.0095 0.081 1.01
14 Benin Ajaokuta 195 0.007 0.056 0.745
15. Benin Sapele 50 0.0018 0.0139 0.208
16. Benin Onitsha 137 0.0049 0.0416 0.521
17. Onitsa N.Heaven 96 0.0034 0.0292 0.0355
18. Onitsha Alaoji 138 0.0049 0.0419 0.524
19. Alaoji Afam 25 0.009 0.007 0.104
20. Sapele Aladja 63 0.0023 0.019 0.239
21. Delta Aladja 30 0.0011 0.0088 0.171
22. *Kainji GS Jebba TS 81 0.0022 0.0246 0.308
23. Ayede lk West 137 0.0049 0.0416 0.521
24. Egbin TS Aja 27.5 0.0022 0.0172 0.257
25 Egbin TS Aja 27.5 0.0022 0.0172 0.257
26. Kaduna Jos 197 0.007 0.0599 0.748
27. Jos Makurdi 275 0.0029 0.0246 0
28. Oshogbo lk West 252 0.0049 0.0341 0.521
29. Benin Delta 107 0.0022 0.019 0.239
30 Onitsha Okpai 80 0.009 0.007 0.104
31. Geregu Ajokuta 5 0.0022 0.0172 0.257
32. Shiroro Kaduna, 96, 0.0034 0.0292 0.364
Source: [7]
4.1 Line Data
The load and generation expressed in per unit values is given as ..valuebase
jMVArMW
Slack Bus = Egbin GS
Table4 Line Data
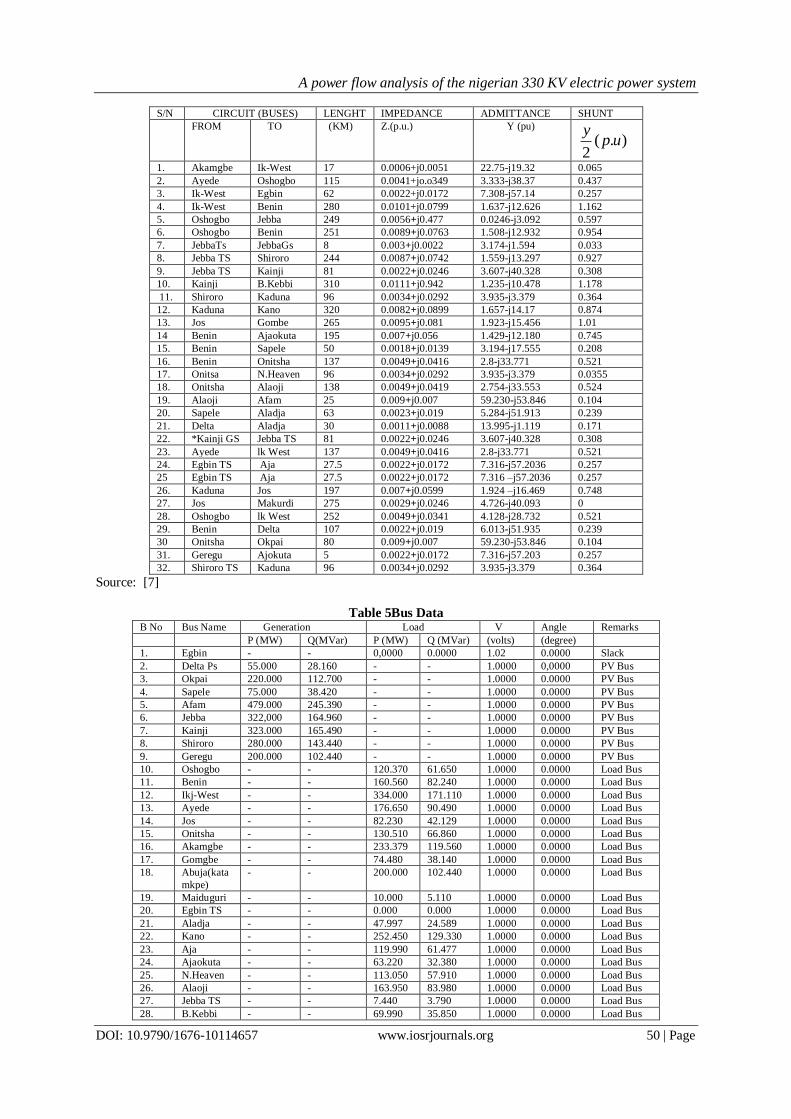
A power flow analysis of the nigerian 330 KV electric power system
DOI: 10.9790/1676-10114657 www.iosrjournals.org 50 | Page
S/N CIRCUIT (BUSES) LENGHT IMPEDANCE ADMITTANCE SHUNT
FROM TO (KM) Z.(p.u.) Y (pu)
).(2
upy
1. Akamgbe Ik-West 17 0.0006+j0.0051 22.75-j19.32 0.065
2. Ayede Oshogbo 115 0.0041+jo.o349 3.333-j38.37 0.437
3. Ik-West Egbin 62 0.0022+j0.0172 7.308-j57.14 0.257
4. Ik-West Benin 280 0.0101+j0.0799 1.637-j12.626 1.162
5. Oshogbo Jebba 249 0.0056+j0.477 0.0246-j3.092 0.597
6. Oshogbo Benin 251 0.0089+j0.0763 1.508-j12.932 0.954
7. JebbaTs JebbaGs 8 0.003+j0.0022 3.174-j1.594 0.033
8. Jebba TS Shiroro 244 0.0087+j0.0742 1.559-j13.297 0.927
9. Jebba TS Kainji 81 0.0022+j0.0246 3.607-j40.328 0.308
10. Kainji B.Kebbi 310 0.0111+j0.942 1.235-j10.478 1.178
11. Shiroro Kaduna 96 0.0034+j0.0292 3.935-j3.379 0.364
12. Kaduna Kano 320 0.0082+j0.0899 1.657-j14.17 0.874
13. Jos Gombe 265 0.0095+j0.081 1.923-j15.456 1.01
14 Benin Ajaokuta 195 0.007+j0.056 1.429-j12.180 0.745
15. Benin Sapele 50 0.0018+j0.0139 3.194-j17.555 0.208
16. Benin Onitsha 137 0.0049+j0.0416 2.8-j33.771 0.521
17. Onitsa N.Heaven 96 0.0034+j0.0292 3.935-j3.379 0.0355
18. Onitsha Alaoji 138 0.0049+j0.0419 2.754-j33.553 0.524
19. Alaoji Afam 25 0.009+j0.007 59.230-j53.846 0.104
20. Sapele Aladja 63 0.0023+j0.019 5.284-j51.913 0.239
21. Delta Aladja 30 0.0011+j0.0088 13.995-j1.119 0.171
22. *Kainji GS Jebba TS 81 0.0022+j0.0246 3.607-j40.328 0.308
23. Ayede lk West 137 0.0049+j0.0416 2.8-j33.771 0.521
24. Egbin TS Aja 27.5 0.0022+j0.0172 7.316-j57.2036 0.257
25 Egbin TS Aja 27.5 0.0022+j0.0172 7.316 –j57.2036 0.257
26. Kaduna Jos 197 0.007+j0.0599 1.924 –j16.469 0.748
27. Jos Makurdi 275 0.0029+j0.0246 4.726-j40.093 0
28. Oshogbo lk West 252 0.0049+j0.0341 4.128-j28.732 0.521
29. Benin Delta 107 0.0022+j0.019 6.013-j51.935 0.239
30 Onitsha Okpai 80 0.009+j0.007 59.230-j53.846 0.104
31. Geregu Ajokuta 5 0.0022+j0.0172 7.316-j57.203 0.257
32. Shiroro TS Kaduna 96 0.0034+j0.0292 3.935-j3.379 0.364
Source: [7]
Table 5Bus Data B No Bus Name Generation Load V Angle Remarks
P (MW) Q(MVar) P (MW) Q (MVar) (volts) (degree)
1. Egbin - - 0,0000 0.0000 1.02 0.0000 Slack
2. Delta Ps 55.000 28.160 - - 1.0000 0,0000 PV Bus
3. Okpai 220.000 112.700 - - 1.0000 0.0000 PV Bus
4. Sapele 75.000 38.420 - - 1.0000 0.0000 PV Bus
5. Afam 479.000 245.390 - - 1.0000 0.0000 PV Bus
6. Jebba 322,000 164.960 - - 1.0000 0.0000 PV Bus
7. Kainji 323.000 165.490 - - 1.0000 0.0000 PV Bus
8. Shiroro 280.000 143.440 - - 1.0000 0.0000 PV Bus
9. Geregu 200.000 102.440 - - 1.0000 0.0000 PV Bus
10. Oshogbo - - 120.370 61.650 1.0000 0.0000 Load Bus
11. Benin - - 160.560 82.240 1.0000 0.0000 Load Bus
12. Ikj-West - - 334.000 171.110 1.0000 0.0000 Load Bus
13. Ayede - - 176.650 90.490 1.0000 0.0000 Load Bus
14. Jos - - 82.230 42.129 1.0000 0.0000 Load Bus
15. Onitsha - - 130.510 66.860 1.0000 0.0000 Load Bus
16. Akamgbe - - 233.379 119.560 1.0000 0.0000 Load Bus
17. Gomgbe - - 74.480 38.140 1.0000 0.0000 Load Bus
18. Abuja(kata
mkpe)
- - 200.000 102.440 1.0000 0.0000 Load Bus
19. Maiduguri - - 10.000 5.110 1.0000 0.0000 Load Bus
20. Egbin TS - - 0.000 0.000 1.0000 0.0000 Load Bus
21. Aladja - - 47.997 24.589 1.0000 0.0000 Load Bus
22. Kano - - 252.450 129.330 1.0000 0.0000 Load Bus
23. Aja - - 119.990 61.477 1.0000 0.0000 Load Bus
24. Ajaokuta - - 63.220 32.380 1.0000 0.0000 Load Bus
25. N.Heaven - - 113.050 57.910 1.0000 0.0000 Load Bus
26. Alaoji - - 163.950 83.980 1.0000 0.0000 Load Bus
27. Jebba TS - - 7.440 3.790 1.0000 0.0000 Load Bus
28. B.Kebbi - - 69.990 35.850 1.0000 0.0000 Load Bus
A power flow analysis of the nigerian 330 KV electric power system
DOI: 10.9790/1676-10114657 www.iosrjournals.org 51 | Page
29. Kaduna - - 149.77 76.720 1.0000 0.0000 Load Bus
30. ShiroroTS - - 73.070 37.430 1.0000 0.0000 Load Bus
Source: [7]
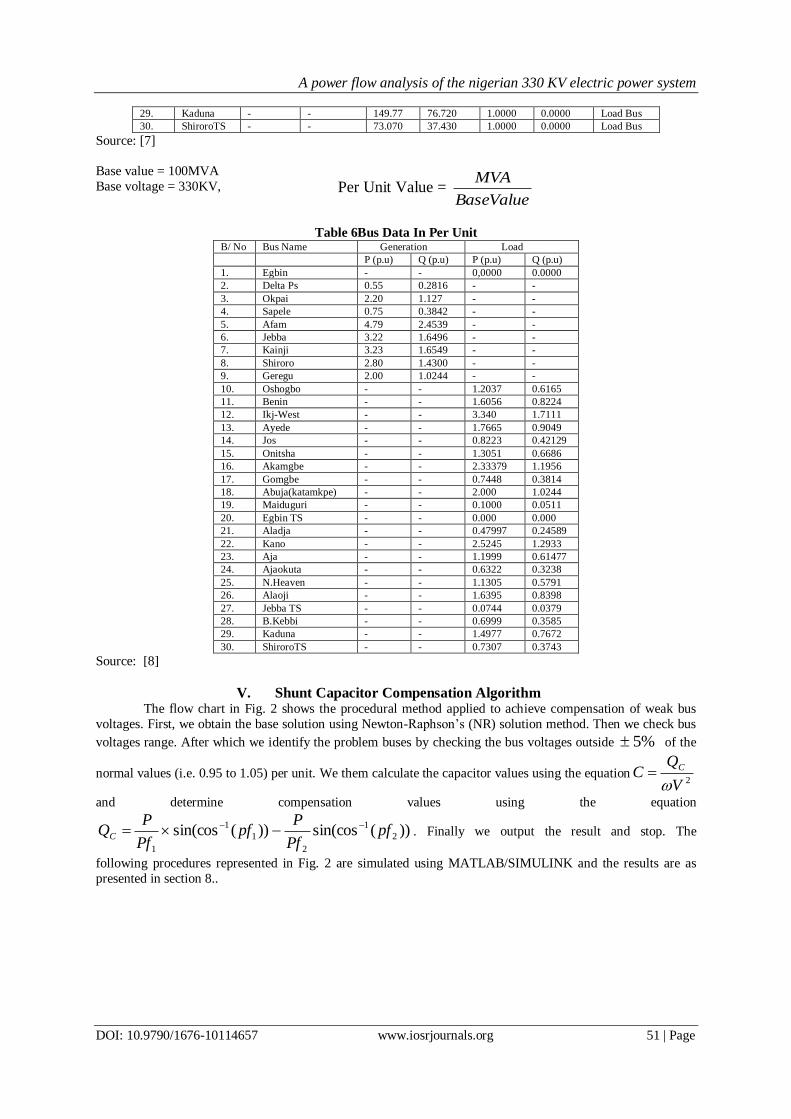
Base value = 100MVA
Base voltage = 330KV,
Table 6Bus Data In Per Unit B/ No Bus Name Generation Load
P (p.u) Q (p.u) P (p.u) Q (p.u)
1. Egbin - - 0,0000 0.0000
2. Delta Ps 0.55 0.2816 - -
3. Okpai 2.20 1.127 - -
4. Sapele 0.75 0.3842 - -
5. Afam 4.79 2.4539 - -
6. Jebba 3.22 1.6496 - -
7. Kainji 3.23 1.6549 - -
8. Shiroro 2.80 1.4300 - -
9. Geregu 2.00 1.0244 - -
10. Oshogbo - - 1.2037 0.6165
11. Benin - - 1.6056 0.8224
12. Ikj-West - - 3.340 1.7111
13. Ayede - - 1.7665 0.9049
14. Jos - - 0.8223 0.42129
15. Onitsha - - 1.3051 0.6686
16. Akamgbe - - 2.33379 1.1956
17. Gomgbe - - 0.7448 0.3814
18. Abuja(katamkpe) - - 2.000 1.0244
19. Maiduguri - - 0.1000 0.0511
20. Egbin TS - - 0.000 0.000
21. Aladja - - 0.47997 0.24589
22. Kano - - 2.5245 1.2933
23. Aja - - 1.1999 0.61477
24. Ajaokuta - - 0.6322 0.3238
25. N.Heaven - - 1.1305 0.5791
26. Alaoji - - 1.6395 0.8398
27. Jebba TS - - 0.0744 0.0379
28. B.Kebbi - - 0.6999 0.3585
29. Kaduna - - 1.4977 0.7672
30. ShiroroTS - - 0.7307 0.3743
Source: [8]
V. Shunt Capacitor Compensation Algorithm The flow chart in Fig. 2 shows the procedural method applied to achieve compensation of weak bus
voltages. First, we obtain the base solution using Newton-Raphson’s (NR) solution method. Then we check bus
voltages range. After which we identify the problem buses by checking the bus voltages outside %5 of the
normal values (i.e. 0.95 to 1.05) per unit. We them calculate the capacitor values using the equation2V
QC C
and determine compensation values using the equation
))(sin(cos))(sin(cos 2
1
2
1
1
1
pfPf
Ppf
Pf
PQC
. Finally we output the result and stop. The
following procedures represented in Fig. 2 are simulated using MATLAB/SIMULINK and the results are as
presented in section 8..
Per Unit Value = BaseValue
MVA
A power flow analysis of the nigerian 330 KV electric power system
DOI: 10.9790/1676-10114657 www.iosrjournals.org 52 | Page
Fig. 2 Flow Chart for the Analysis of Shunt Capacitor Compensation Algorithm
The results from the N.R. iterative solution method give the bus voltages, line flows, and power losses
under normal (uncompensated) conditionas shown in Tables 7 and 8 respectively. The voltages at buses 14, 17, 18, 19, 22, 29 and 30 are low and in order to ensure that they are within acceptable limits, shunt capacitive
compensation were injected into the buses. Based on Power Holding Company of Nigeria (PHCN) power factor
of 0.85 for transmission lines the MVAR capacities of the various capacitors required to carry out compensation
of the network at the buses were determined using
Abuja Bus
Total Load =200MW
)95.0sin(cos95.0
200)85.0sin(cos
85.0
200 11
MVAr212.58736.56948.123
Rating of Capacitor Bank =58.212MVAr.
Kano Bus
Total Load =252.45
)95.0sin(cos95.0
45.252)85.0sin(
85.0
45.252 11 coa
MVAr45.73976.8245.156
Rating of Capacitor Bank = 73.45MVAr. etc.
The following capacitor sizes were selected for the various lines. Jos bus (30MVAr), Gombe bus (30MVAr),
Abuja bus (60MVAr), Kano bus (40MVAr), Kaduna bus (40MVAr), Makurdi bus (30MVAr). These were
injected into the network and the results were as shown in Tables 11 and Fig. 6.
)(sin(cos))(sin(cos 2
1
2
1
1
1
pfPf
Ppf
Pf
PQC
Q
Fig.3. Determination of Capacity of Shunt
Capacitors
200,KW
95.02
85.01
KVAr1
KVAr2
2Q
2QQ

A power flow analysis of the nigerian 330 KV electric power system
DOI: 10.9790/1676-10114657 www.iosrjournals.org 53 | Page
VI. Production And Absorption Of Reactive Power Synchronous generators can absorb or generate reactive power depending on the excitation pattern. If
the system is overexcited, they supply reactive power and as well absorb reactive power when under excited.
The capacity to continuously absorb or supply reactive power is limited by the field current and armature
current. Synchronous generators are normally equipped with automatic voltage regulators which continually
adjust the excitation so as to control the armature voltage [9].
Loads normally absorb reactive power. Both active power and reactive power of the composite loads vary
as a function of voltage magnitudes. Loads at low-lagging power factors cause excessive voltage drops in
the transmission network and are uneconomical to supply.
Transformers always absorb reactive power regardless of their loading; at no load, the shunt magnetizing
reactance effects predominate; and at full load, the series leakage inductance effects predominate[10,11].
Reactive power compensation in transmission systems improves the stability of the ac system by increasing the maximum active power that can betransmitted. It also control steady-state and temporal over voltages.
This results in an improved functionality of the power system.
VII. Effect Of Reactive Power Flow On Line Voltage Drop The voltage variation is due to imbalance in the generation and consumption of reactive power in the
system. If the generated reactive power is more than the consumed power, the voltage levels go up and vice
versa. However, if the two are equal, then the voltage profile becomes flat and it happens only when the load is
equal to the natural load. Unfortunately the reactive power in the system keeps varying because of different
types of load and if the reactive power generation is simultaneously controlled, a more or less flat voltage profile could be maintained. Too wide variation of voltage causes excessive heating of distribution transformers thereby
reducing the transformer capacity [9, 12].
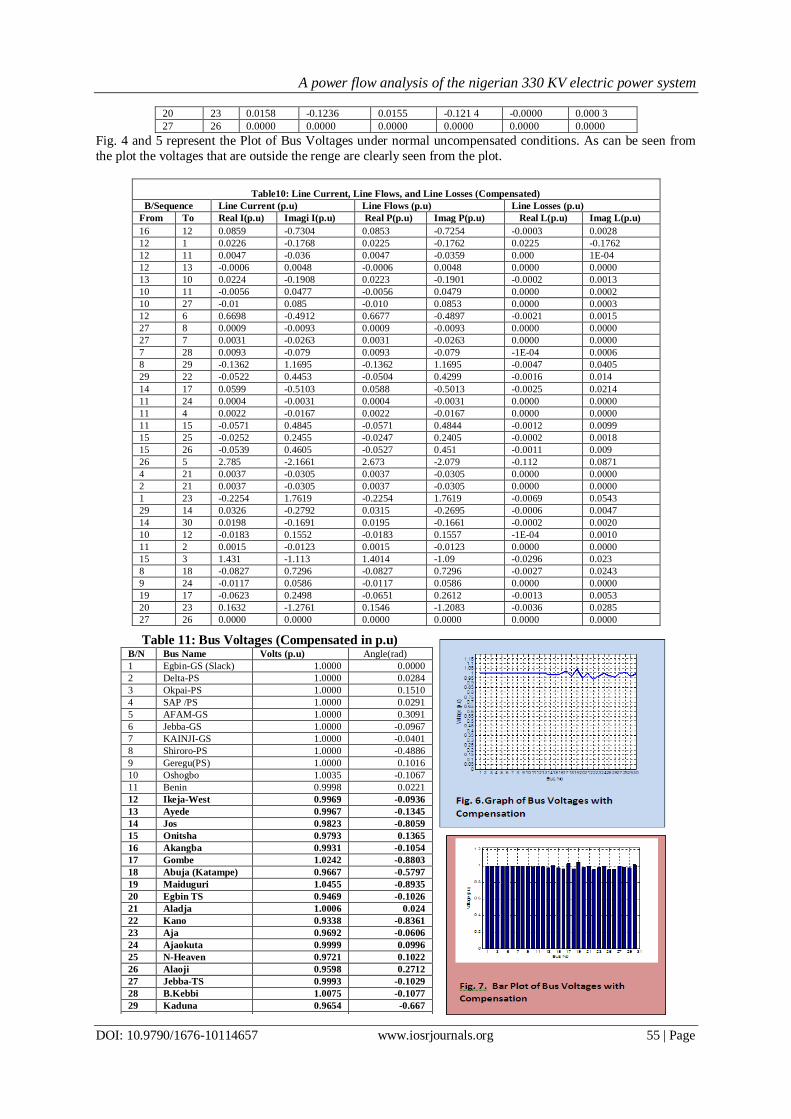
VIII. Results The results obtained using the source (m-file codes) are recorded in Tables 7 to 11.The buses with
weak values are identified.The plots of the tables are as shown in Figs. 4 to 8.
Table 7: Per Unit Bus Voltages for Compensated and
Uncompensated With
Compensation
Without
Compensation
B/N Bus Name Volts (p.u) Volts (p.u)
1 Egbin-GS
(Slack) 1.0000 1.0000
2 Delta-PS 1.0000 1.0000
3 Okpai-PS 1.0000 1.0000
4 SAP /PS 1.0000 1.0000
5 AFAM-GS 1.0000 1.0000
6 Jebba-GS 1.0000 1,0000
7 KAINJI-GS 1.0000 1,0000
8 Shiroro-PS 1.0000 1,0000
9 Geregu(PS) 1.0000 1,0000
10 Oshogbo 1.0035 0.9919
11 Benin 0.9998 0.9957
12 Ikeja-West 0.9969 0.993
13 Ayede 0.9967 0.9792
14 Jos 0.9823 0.8171
15 Onitsha 0.9793 0.9748
16 Akangba 0.9931 0.9859
17 Gombe 1.0242 0.8144
18 Abuja
(Katampe) 0.9667 0.9402
19 Maiduguri 1.0455 0.8268
20 Egbin TS 0.9469 0.9816
21 Aladja 1.0006 0.9994
22 Kano 0.9338 0.7609
23 Aja 0.9692 0.9838
24 Ajaokuta 0.9999 0.9997
25 N-Heaven 0.9721 0.9582
26 Alaoji 0.9598 0.9564
27 Jebba-TS 0.9993 0.9988
28 B.Kebbi 1.0075 0.9873
29 Kaduna 0.9654 0.8738
30 Makurdi 0.9943 0.8247
1 3 5 7 9 11 13 15 17 19 21 23 25 27 29 31
0
0.2
0.4
0.6
0.8
1
1.2
Bus No
Vol
tage
(p.
u)
Fig. 5 Bar Plot of Bus Voltages
under normal (Uncompensated)
condition
1 2 3 4 5 6 7 8 9 101112131415161718192021222324252627282930
00.050.1
0.150.2
0.250.3
0.350.4
0.450.5
0.550.6
0.650.7
0.750.8
0.850.9
0.951
1.051.1
1.15
Bus No
Vol
tage
(p.
u)
Fig. 4 Plot of Bus Voltages under
normal (Uncompensated)
condition.

A power flow analysis of the nigerian 330 KV electric power system
DOI: 10.9790/1676-10114657 www.iosrjournals.org 54 | Page
Table 7 gives the per unit bus voltages of Newton-Raphson (N-R) for compensated and uncompensated
Table8: Bus Angle, Shunt (Y-shunt) and Injection Powers (Sg) (Uncompensated) B/N BUS NAME Angle(rad) Yshunt Sg(p.u) Real Sg(p.u) Imaginary
1 Egbin-GS (Slack) 0 0.5140 0.0000 0.0000
2 Delta-PS 0.02565 0.4780 0.5500 0.2816
3 Okpai-PS 0.1437 0.1040 2.2000 1.1270
4 SAP /PS 0.0263 0.44700 0.7500 0.3842
5 AFAM-GS 0.3043 0.1040 4.7900 2.4539
6 Jebba-GS -0.1049 0.0200 3.2200 1.6496
7 KAINJI-GS -0.0484 1.4860 3.2300 1.6547
8 Shiroro-PS -0.5057 1.8150 2.8000 1.4344
9 Geregu(PS) 0.0992 0.0332 2.0000 1.0244
10 Oshogbo -0.1103 2.0770 1.2037 -0.6165
11 Benin 0.0198 2.8750 1.6056 -0.8224
12 Ikeja-West -0.0961 1.7000 3.3400 -1.7111
13 Ayede -0.1373 0.9580 1.7665 -0.9049
14 Jos -0.8691 1.3000 -0.8223 -0.4212
15 Onitsha 0.135 1.5140 1.3051 -0.6686
16 Akangba -0.1076 0.2570 2.3337 -1.1956
17 Gombe -0.9738 1.0500 -0.74480 -0.3814
18 Abuja (Katampe) -5964 0.2000 2.0000 -1.0244
19 Maiduguri -0.9903 0.6000 0.1000 -0.0511
20 Egbin TS -0.1038 0.5140 -2.3500 -0.0200
21 Aladja 0.0214 0.4780 0.4800 -0.2459
22 Kano -0.9144 0.4000 2.5245 -1.2933
23 Aja -0.0615 0.2570 1.1999 -0.6147
24 Ajaokuta 0.0972 0.7650 0.6322 -0.3238
25 N-Heaven 0.101 0.3650 -1.1305 -0.5791
26 Alaoji 0.2707 0.6280 1.6395 -0.8398
27 Jebba-TS -0.1111 1.8650 -0.0744 -0.0379
28 B.Kebbi -0.1149 0.7000 0.6999 -0.3685
29 Kaduna -0.694 0.9000 1.4977 -0.7672
30 Makurdi -0.8779 0.4000 -0.0744 -0.0379
Table 9: Line Current, Line Flows, and Line Losses (Uncompensated) B/Sequence Line Current (p.u) Line Flows (p.u) Line Losses (p.u)
From To Real Imaginary Real Imaginary Real Imaginary
16 12 0.1842 -1.4405 0.1783 -1.3941 -0.0046 0.036 3
12 1 0.0514 -0.4023 0.05109 -0.3994 0.051 1 -0.399 5
12 11 0.0047 -0.036 4 0.004 7 -0.0361 -0.00001 0.0001
12 13 -0.0386 0.3280 -0.038 4 0.3257 -0.0005 0.0045
13 10 0.0423 -0.3605 0.041 5 -0.3530 -0.0005 0.004 6
10 11 0.0059 -0.0512 0.0059 -0.0507 -0.00002 0.0002
10 27 0.0166 -0.1417 0.0165 -0.140 6 -0.0001 0.0009
12 6 1.5244 -1.1179 1.5137 -1.110 1 -0.011 0.0078
27 8 0.0016 -0.0177 0.001 7 -0.0177 -0.0000 0.00002
27 7 0.0059 -0.050 4 0.0059 -0.0503 -0.0000 0.00006
7 28 -0.0156 0.1328 -0.0156 0.1328 -0.000 2 0.001 7
8 29 -0.5455 4.6854 -0.5456 4.685 4 -0.0756 0.6497
29 22 -0.3214 2.7405 -0.2769 2.360 5 -0.0624 0.532 2
14 17 0.0054 -0.0462 0.0046 -0.039 6 -0.00002 0.000 2
11 24 0.0085 -0.0678 0.0084 -0.067 6 -0.00003 0.000 3
11 4 0.0380 -0.2938 0.0378 -0.2926 -0.000 2 0.0012
11 15 -0.0587 0.498 4 -0.0584 0.496 3 -0.0012 0.010 5
15 25 -0.0579 0.564 1 -0.0565 0.5498 -0.0009 0.009 4
15 26 -0.0508 0.4346 -0.049 6 0.4237 -0.0009 0.0080
26 5 3.0208 -2.3495 2.8890 -2.2470 -0.1318 0.1025
4 21 -0.0039 0.0327 -0.00396 0.0327 -0.0000 0.0000 2
2 21 -0.0039 0.0327 -0.0039 0.0327 -0.000 0 0.00002
1 23 -0.1185 0.9261 -0.1184 0.9261 -0.0019 0.0149
29 14 -0.0094 0.0807 -0.0081 0.0695 -0.0000 0.0004
14 30 0.0137 -0.1170 0.0117 -0.1002 -0.0001 0.0009
10 12 0.0030 -0.0256 0.0029 -0.0254 -0.0000 0.0000
11 2 0.026 1 -0.217 3 0.0259 -0.2145 -0.0001 0.0009
15 3 1.742 7 -1.35 6 1.6988 -1.3213 -0.0439 0.0341
8 18 -0.1486 0.6769 -0.1486 1.3112 -0.00890 0.0784
9 24 -0.056 7 0.2838 -0.0566 0.283 3 -0.0000 2 0.000 1
19 17 -0.0408 0.226 5 -0.0357 0.1432 -0.000 6 0.002 3
A power flow analysis of the nigerian 330 KV electric power system
DOI: 10.9790/1676-10114657 www.iosrjournals.org 55 | Page
20 23 0.0158 -0.1236 0.0155 -0.121 4 -0.0000 0.000 3
27 26 0.0000 0.0000 0.0000 0.0000 0.0000 0.0000
Fig. 4 and 5 represent the Plot of Bus Voltages under normal uncompensated conditions. As can be seen from
the plot the voltages that are outside the renge are clearly seen from the plot.
Table10: Line Current, Line Flows, and Line Losses (Compensated)
B/Sequence Line Current (p.u) Line Flows (p.u) Line Losses (p.u)
From To Real I(p.u) Imagi I(p.u) Real P(p.u) Imag P(p.u) Real L(p.u) Imag L(p.u)
16 12 0.0859 -0.7304 0.0853 -0.7254 -0.0003 0.0028
12 1 0.0226 -0.1768 0.0225 -0.1762 0.0225 -0.1762
12 11 0.0047 -0.036 0.0047 -0.0359 0.000 1E-04
12 13 -0.0006 0.0048 -0.0006 0.0048 0.0000 0.0000
13 10 0.0224 -0.1908 0.0223 -0.1901 -0.0002 0.0013
10 11 -0.0056 0.0477 -0.0056 0.0479 0.0000 0.0002
10 27 -0.01 0.085 -0.010 0.0853 0.0000 0.0003
12 6 0.6698 -0.4912 0.6677 -0.4897 -0.0021 0.0015
27 8 0.0009 -0.0093 0.0009 -0.0093 0.0000 0.0000
27 7 0.0031 -0.0263 0.0031 -0.0263 0.0000 0.0000
7 28 0.0093 -0.079 0.0093 -0.079 -1E-04 0.0006
8 29 -0.1362 1.1695 -0.1362 1.1695 -0.0047 0.0405
29 22 -0.0522 0.4453 -0.0504 0.4299 -0.0016 0.014
14 17 0.0599 -0.5103 0.0588 -0.5013 -0.0025 0.0214
11 24 0.0004 -0.0031 0.0004 -0.0031 0.0000 0.0000
11 4 0.0022 -0.0167 0.0022 -0.0167 0.0000 0.0000
11 15 -0.0571 0.4845 -0.0571 0.4844 -0.0012 0.0099
15 25 -0.0252 0.2455 -0.0247 0.2405 -0.0002 0.0018
15 26 -0.0539 0.4605 -0.0527 0.451 -0.0011 0.009
26 5 2.785 -2.1661 2.673 -2.079 -0.112 0.0871
4 21 0.0037 -0.0305 0.0037 -0.0305 0.0000 0.0000
2 21 0.0037 -0.0305 0.0037 -0.0305 0.0000 0.0000
1 23 -0.2254 1.7619 -0.2254 1.7619 -0.0069 0.0543
29 14 0.0326 -0.2792 0.0315 -0.2695 -0.0006 0.0047
14 30 0.0198 -0.1691 0.0195 -0.1661 -0.0002 0.0020
10 12 -0.0183 0.1552 -0.0183 0.1557 -1E-04 0.0010
11 2 0.0015 -0.0123 0.0015 -0.0123 0.0000 0.0000
15 3 1.431 -1.113 1.4014 -1.09 -0.0296 0.023
8 18 -0.0827 0.7296 -0.0827 0.7296 -0.0027 0.0243
9 24 -0.0117 0.0586 -0.0117 0.0586 0.0000 0.0000
19 17 -0.0623 0.2498 -0.0651 0.2612 -0.0013 0.0053
20 23 0.1632 -1.2761 0.1546 -1.2083 -0.0036 0.0285
27 26 0.0000 0.0000 0.0000 0.0000 0.0000 0.0000
Table 11: Bus Voltages (Compensated in p.u) B/N Bus Name Volts (p.u) Angle(rad)
1 Egbin-GS (Slack) 1.0000 0.0000
2 Delta-PS 1.0000 0.0284
3 Okpai-PS 1.0000 0.1510
4 SAP /PS 1.0000 0.0291
5 AFAM-GS 1.0000 0.3091
6 Jebba-GS 1.0000 -0.0967
7 KAINJI-GS 1.0000 -0.0401
8 Shiroro-PS 1.0000 -0.4886
9 Geregu(PS) 1.0000 0.1016
10 Oshogbo 1.0035 -0.1067
11 Benin 0.9998 0.0221
12 Ikeja-West 0.9969 -0.0936
13 Ayede 0.9967 -0.1345
14 Jos 0.9823 -0.8059
15 Onitsha 0.9793 0.1365
16 Akangba 0.9931 -0.1054
17 Gombe 1.0242 -0.8803
18 Abuja (Katampe) 0.9667 -0.5797
19 Maiduguri 1.0455 -0.8935
20 Egbin TS 0.9469 -0.1026
21 Aladja 1.0006 0.024
22 Kano 0.9338 -0.8361
23 Aja 0.9692 -0.0606
24 Ajaokuta 0.9999 0.0996
25 N-Heaven 0.9721 0.1022
26 Alaoji 0.9598 0.2712
27 Jebba-TS 0.9993 -0.1029
28 B.Kebbi 1.0075 -0.1077
29 Kaduna 0.9654 -0.667
30 Makurdi 0.9943 -0.8127
A power flow analysis of the nigerian 330 KV electric power system
DOI: 10.9790/1676-10114657 www.iosrjournals.org 56 | Page
IX. Discussion
The Nigerian 330KV, 30 bus system using N-R power flow algorithm with MATLAB/SIMULINK softwarewas analyzedusing the data collected from Power Holding Company of Nigeria (PHCN). The results
obtained showed that the weak buses with values outside the statutory limit of 0.95pu or 313.5KV and 1.05pu or
346.5KV were buses 14 (Jos) with value 0.8171pu , 17 (Gombe) 0.8144p.u, 18 (Abuja) 0.9402p.u,, 19
(Maiduguri) 0.8268p.u, 22 (Kano) 0.7609p.u, 29 (Kaduna) 0.8738p.u, and bus 30 (Makurdi) 0.8247p.u under
normal uncompensated condition as shown in Table 7with the corresponding angles at buses14(0.869rad), 17(-
0.973rad), 18(-0.596rad), 19(-0.990rad), 22(-0.914rad), 29(-0.694rad), and bus 30(-0.877rad). We could see
from the graph that bus (22) which is Kano has the highest voltage dip because of its distance from the grid,
followed by Jos, Gombe, Kaduna, Makurdi, Maiduguri and Abuja respectively. These buses with low voltage
values were examined and shunt capacitive compensation was carried out and the output results were as
recorded in Table 7 with the corresponding angles at buses 14(0.805rad), 17(-0.880rad), 18(-o.579rad), 19(-
0.893rad), 22(-0.836rad), 29(-0.667rad), and bus 30(-0.812rad) as shown in Table 11. The graphs of the
corresponding voltage values versus bus number were plotted as shown in Figs.6 and 7. On gradual application of 5percent compensation intervals, it was observed that at 45 percent compensation most of the problem buses
came up to a tolerable range except bus(22), which is Kano and it came up to appreciable value at sixty percent
compensation as shown in Tables 11 and Fig 6 respectively. With 45 percent capacitive shunt compensation on

A power flow analysis of the nigerian 330 KV electric power system
DOI: 10.9790/1676-10114657 www.iosrjournals.org 57 | Page
these buses, bus 14 (Jos) became 0.9823.u, bus 17 (Gombe) 1.0242p.u, bus 18(Abuja) 0.9667pu, bus 19
(Maiduguri) 1.0455p.u, 29 (Kaduna) 0.9654 and 30 (Makurdi) 0.9943. Kano which is heavily loaded was
provided with additional line between Jos and Kano, and this made compensation effect very fast. Bus 22 (Kano) at 60 percent compensation yielded an increase from 0.7609p.u to 0.947 p.u.
The analysis from the compensated results shows that a reasonable and appreciable values better than
when uncompensated with improved network performance was recorded as shown in Table 7. The graphs of the
corresponding compensated voltage values versus bus number were plotted as shown in Figs.6 and 7. From the
values recorded in Table 11, it could be seen that the values of the angles are improved to the acceptable values.
System efficiency improved from 65 percent (uncompensated) to 85 percent after compensation. The losses in
the system are minimal as can be seen through Table 10.
It is also seen from the computer results that the use or incorporation of system compensation will lead
to many benefits like increasing transmission lines loadability which enable electrical company to transmit more
power with the existing transmission lines. And also to absorbs more customers without increasing the number
of generators.it was also noticed that all these buses are in the Northern part of the country and some are still far from the generating stations.
X. Conclusion The Nigerian 330KV transmission system associated with various challengeslike instability of the
system as a result of voltage profile violation, transmission line inefficiency, problem of long transmission lines,
network being stretched beyond thermal limit, and poor power quality that causes constant power failure in
Nigeria power system were discussed.Solution methods were examined and Newton-Raphson’s solution method
because of its sparsity, fast convergence and simplicity attributes compared to other solution methods was
chosen. Various compensation techniques were reviewed. Shunt and series reactive compensation using capacitors has been widely recognized as powerful methods to combat the problems of voltage drops (reactive
power control), power losses, and voltage flicker in power system networks. Though each compensating
technique has its area and limit of application, but shunt capacitor compensation method was used because of its
outstanding performance in long transmission lines and its control of reactive power flow. Though they are
expensive but they control voltage directly and also control temporary over voltage rapidly.
Finally, more Substations and additional lines should be introduced into the network to assist in the
strengthening and reduction of long lines to improve the voltage profile of the network, especially Kano,
Kaduna and Maiduguri lines. Also planned and routine maintenance should be carried out on the network to
reduce the incident of collapsed spans. Importation and installation of high quality power equipment like
transformers, breakers & control panels.
References [1]. B. Caven, “A Study of Voltage Profile in the NEPA Network: Analysis and Recommendation”, Engineering Focus, Jan/April 1992.
[2]. F.O. Enemuoh, “Simulation Modeling of Voltage Stability of an Interconnected Electric Power Network” Ph.D Thesis, Electrical
Engineering Dept. University of Nigeria, Nsukka, pp22, April 2012.
[3]. O.A. Komolafe, A. Momoh and M.O. Omoigui, “Reliability Investigation of the Nigerian Electric Power Authority Transmission
Network in a Deregulated Environment”, Conference record of the IEEE industry applications conference 12-16, vol. 2, pp 1328 –
1335, October 2003.
[4]. F. Dawalibi and W. G. Finney, “Transmission Line Tower Grounding Performance in Non-Uniform Soil”, – IEEE Trans. PAS vol.
No.2, pp 471 1989.
[5]. Nigeria National Daily, “NEPA Blames Outages on Erosion, Others”, – The Punch Newspaper, July 23rd
1999
[6]. PHCN National Control Centre Oshogbo, “Generation and Transmission Grid Operations”, Annual Technical Report for 2005,
PHCN publisher, 2006.
[7]. NIPP In-House Grid Studies 330kVand 132kV Transmission Line Data, 2006
[8]. PHCN National Control Center Oshogbo Daily Operational Report, May 2012.
[9]. R. Shankar and P. Kundur, “Power System Stability and Control II”, 2nd
Ed New York, McGraw-Hill Books pp581, 1994.
[10]. T.B. Gupta and S.K. Kotari, “A Course in Electrical Power,”Publishers Sarak Delhi, 2008.
[11]. F. IIiceto and E Cinieri, “Comparative Analysis of Series and Shunt Compensation Schemes for A.C Transmission Systems,”
IEEE Trans, Vol, PAS-96, pp1819, May/June 1991.
[12]. H. Saadat, “Power System Analysis”, “Milwaukee School of Engineering, Tata McGraw-Hill Publishing Company Ltd New
DELHI, pp189, 2002.