Embed Size (px)
Citation preview

Copyright is owned by the Author of the thesis. Permission is given for a copy to be downloaded by an individual for the purpose of research and private study only. The thesis may not be reproduced elsewhere without the permission of the Author.

i
A population genetics approach to species delimitation in the genus Selliera (Goodeniaceae).
A thesis submitted in partial fulfilment of the requirements for the degree of
Master of Science in
Plant Biology
at Massey University, Palmerston North
New Zealand
Kay Margaret Pilkington
2014

ii
iii
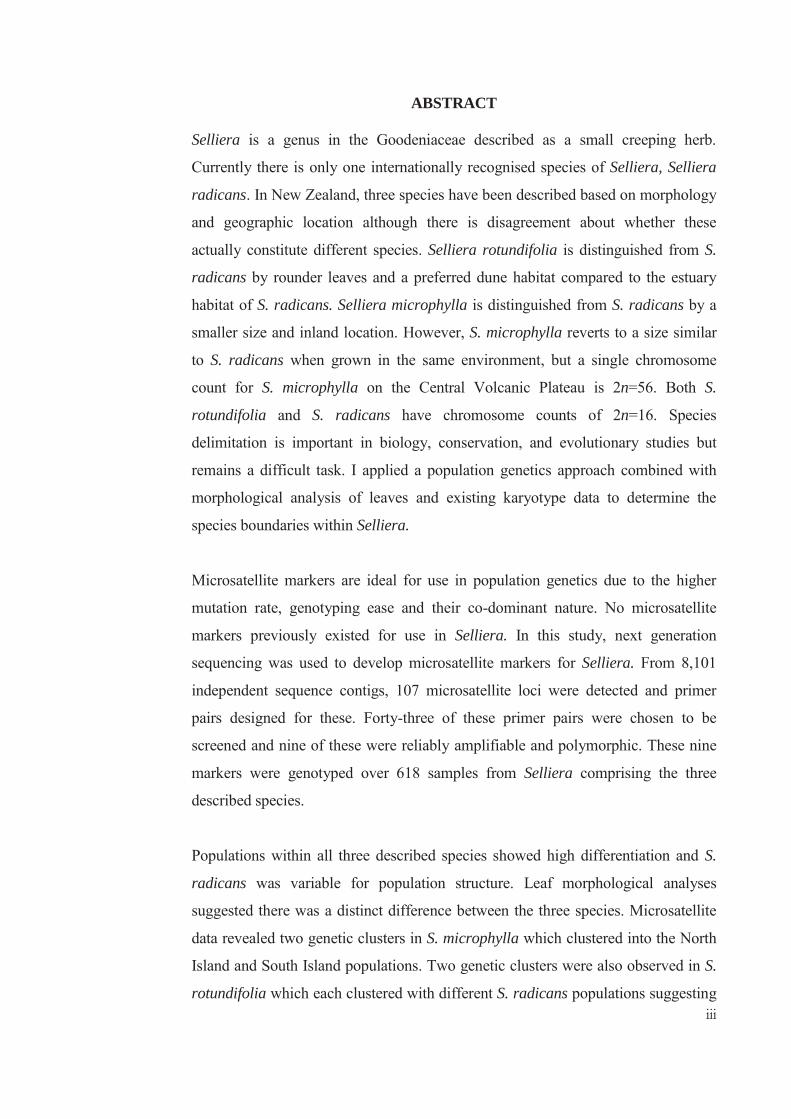
ABSTRACT
Selliera is a genus in the Goodeniaceae described as a small creeping herb.
Currently there is only one internationally recognised species of Selliera, Selliera
radicans. In New Zealand, three species have been described based on morphology
and geographic location although there is disagreement about whether these
actually constitute different species. Selliera rotundifolia is distinguished from S.
radicans by rounder leaves and a preferred dune habitat compared to the estuary
habitat of S. radicans. Selliera microphylla is distinguished from S. radicans by a
smaller size and inland location. However, S. microphylla reverts to a size similar
to S. radicans when grown in the same environment, but a single chromosome
count for S. microphylla on the Central Volcanic Plateau is 2n=56. Both S.
rotundifolia and S. radicans have chromosome counts of 2n=16. Species
delimitation is important in biology, conservation, and evolutionary studies but
remains a difficult task. I applied a population genetics approach combined with
morphological analysis of leaves and existing karyotype data to determine the
species boundaries within Selliera.
Microsatellite markers are ideal for use in population genetics due to the higher
mutation rate, genotyping ease and their co-dominant nature. No microsatellite
markers previously existed for use in Selliera. In this study, next generation
sequencing was used to develop microsatellite markers for Selliera. From 8,101
independent sequence contigs, 107 microsatellite loci were detected and primer
pairs designed for these. Forty-three of these primer pairs were chosen to be
screened and nine of these were reliably amplifiable and polymorphic. These nine
markers were genotyped over 618 samples from Selliera comprising the three
described species.
Populations within all three described species showed high differentiation and S.
radicans was variable for population structure. Leaf morphological analyses
suggested there was a distinct difference between the three species. Microsatellite
data revealed two genetic clusters in S. microphylla which clustered into the North
Island and South Island populations. Two genetic clusters were also observed in S.
rotundifolia which each clustered with different S. radicans populations suggesting

iv
round leaves may have had multiple origins. Hybridization was observed at one
sympatric site between S. radicans and S. rotundifolia and apparent reproductive
isolation for S. rotundifolia was observed at another site.
These results suggest that the South Island S. microphylla population may be an
inland variant of S. radicans which may continue to diverge if it remains isolated,
while the North Island populations should retain the S. microphylla name due to the
2n=56 chromosome count, geographic isolation and genetic distinction although
this needs further review. There is evidence of reproductive isolation for S.
rotundifolia at one of the sympatric sites suggesting this is a distinct species but it
appears round leaves may have had multiple origins so may not be suitable to
describe the species according to the lineage species concept. This study provides
insights into the population structure within and between the described species and
has identified interesting areas of future study.

v
ACKNOWLEDGMENTS
First of all I would like to express my deep appreciation and gratitude to my
supervisors Vaughan Symonds and Jennifer Tate for allowing me to undertake this
study and for the guidance and help along the way.
I am also grateful for the help of Peter Heenan and Peter deLange on information
about Selliera and the support of DOC staff who helped with identifying
populations to collect. I would not have achieved such a great sample size without
that information.
Thanks to all the LoST lab members who helped me at some point in my study and
for all the great advice you gave me. I would especially like to express my thanks
to Prashant Joshi for all the help provided over the course of my study.
I would like to thank the Heseltine Trust for the Heseltine Trust Bursary, the
Graduate Women Manawatu Charitable Trust for the Graduate Women Manawatu
Postgraduate scholarship and Massey University for the JP Skipworth scholarship.
Finally I would like to thank my close friends and family who supported me though
my studies.

vi
ABBREVIATIONS
%P - percentage polymorphic loci
A - number of alleles
AMOVA - Analysis of molecular variance
ANOVA - Analysis of variance
bp - base pairs
cm - centimeters
CTAB - cetyltrimethylammonium bromide
d.f - degrees of freedom
DNA - deoxyribonucleic acid
dNTP - deoxyribonucleotide triphosphate
FIS - factor in Sewell Wrights F statistic. FIS is the inbreeding coefficient
that is the proportion of the variance in the subpopulation within an
individual.
FIJI - FIJI is just imageJ (image analysis software)
FST - factor in Sewell Wrights F statistic. FST is the proportion of the total
genetic variance in the subpopulation contained in an individual.
GST - coefficient of genetic differentiation. Defined as the expected
heterozygosity for the total population minus the expected
heterozygosity within the subpopulations divided by the expected
heterozygosity for the total population.
Ho - observed heterozygosity
He - expected heterozygosity
HT - species-wide expected heterozygosity
ISSR - inter simple sequence repeat
ITS - internal transcribed spacer
n – chromosome number in a haploid
N - number of individuals
NA - number of alleles
Ne - number of effective alleles
NZGL - New Zealand Genomic Limited

vii
P value - probability of obtaining a test statistic at least as extreme as the one
observed assuming the null hypothesis is true
PCR – polymerase chain reaction
RNA - ribonucleic acid
Rxy - correlation coefficient of Mantel test
SNP - single nucleotide polymorphism
STE - sucrose, tris, EDTA
Ta - melting temperature
TE - Tris-EDTA buffer
viii
TABLE OF CONTENTS
1. Introduction 1
1.1 The Genus Selliera 1
1.1.1 Selliera in New Zealand 1
1.2 Taxonomy 3
1.2.1 Species concepts 3
1.3 Speciation 6
1.3.1 Models of speciation 6
1.3.2 Speciation by polyploidy 7
1.3.3 Speciation and hybridization 8
1.4 Methods of species delimitation 10
1.5 Population genetics 12
1.5.1 Markers used in population genetics 12
1.5.2 Analysis methods in population genetics 14
1.6 Focus of this research 16
1.7 References 17
2. Microsatellite primers in Selliera radicans (Goodeniaceae) 24
2.1 Abstract 24
2.2 Introduction 25
2.3 Methods and Results 26
2.4 Conclusion 30
2.5 References 31
3. Population genetics and species delimitation in the genus Selliera
(Goodeniaceae) 33
3.1 Abstract 33
3.2 Introduction 35
3.3 Methods 39
3.3.1 Sample collection 39
3.3.2 DNA extraction and genotyping 39
3.3.3 Data analysis 42

ix
3.3.4 Morphological analysis 43
3.4 Results 44
3.4.1 Genetic variation 45
3.4.2 Morphological analysis 47
3.4.3 STRUCTURE 48
3.4.4 NEIGHBORNET 51
3.5 Discussion 54
3.5.1 Variation among Selliera 55
3.5.2 Species in Selliera 55
- Selliera radicans 55
- Selliera rotundifolia 58
- Selliera microphylla 61
3.5.2 Hybridization and introgression in Selliera 65
3.5.3 Future directions 68
3.6 Conclusion 69
3.7 References 70
4. Conclusion 77
4.1 Introduction 77
4.2 Findings 78
4.3 Limitations 81
4.4 References 83

x
LIST OF FIGURES
Page 1. Introduction
Figure 1.1 Examples of Selliera species in New Zealand 2
Figure 1.2 Representation of the general lineage species concept 5
3. Population genetics and species delimitation in the genus Selliera
(Goodeniaceae)
Figure 3.1 Representatives of Selliera radicans (A), S. rotundifolia (B)
and S. microphylla (C) with insets showing the typical leaf shape found in
each of the species. 38
Figure 3.2 Distribution map of populations of Selliera collected for this
study. 40
Figure 3.3 Mantel test results displayed in graphs of log(geographic
distance) against FST(1-FST) for each of the species in Selliera, S.
microphylla, S. rotundifolia and S. radicans. 46
Figure 3.4 Histograms of the leaf morphology roundness index. 48
Figure 3.5 Plot of ΔK vs. K for STRUCTURE results following Evanno
(2005). 49
Figure 3.6 STRUCTURE cluster assignment and morphology score for
individuals in Selliera. 51
Figure 3.7 Neighbor-net based on pairwise genetic distances between all
populations of all Selliera species. 53

xi
LIST OF TABLES
Page
2. Microsatellite primers in Selliera radicans (Goodeniaceae)
Table 2.1 Characteristics of 9 microsatellite primer pairs developed
for use in Selliera. 28
Table 2.2 Results of the primer screening in populations of Selliera. 29
Table 2.3 Voucher information for Selliera populations used in this
study. 30
3. Population genetics and species delimitation in the genus Selliera
(Goodeniaceae)
Table 3.1 Population information and genetic diversity estimates for
35 populations in Selliera. 41-42
Table 3.2 Characteristics of 9 microsatellite markers in Selliera. 44
Table 3.3 F statistics of populations for species not including hybrid
populations and for all populations. 45
Table 3.4 AMOVA results for Selliera species. 46
Table 3.5 Mantel test results 47

1
C h a p t e r 1
Introduction
1.1 The Genus Selliera Selliera Cav. is a genus within the Goodeniaceae family. The Goodeniaceae are
predominately found in the Southern Hemisphere and consists of 12 genera and at
least 300 species (Allan 1961). They are easily distinguished by the indusium, a
unique cup-shaped structure, located at the top of the style. In New Zealand only
four indigenous species are present; three endemic species and one non-endemic
(FloraCommittee. 2013). Selliera is described as a small creeping herb (Allan
1961) and occurs in Australia, Chile and New Zealand. There are three described
species in New Zealand, Selliera radicans Cav., S. rotundifolia Heenan., and S.
microphylla Colenso. In 1876, Cheeseman reported findings on fertilization in S.
radicans suggesting that self-fertilization cannot take place as the pollen is shed
and dispersed long before the stigma is mature. Therefore transfer of pollen is
thought to be carried out by insects, primarily a species of Diptera although other
insects have been observed visiting the flowers. However, although this suggests
Selliera is an out-crosser, all species can also be clonally propagated easily from
division of whole plants.
1.1.1 Selliera in New Zealand
Selliera radicans was first described in 1799. Selliera radicans is described with
spathulate elongated leaves (Figure 1.1) but is noted to be highly polymorphic in
form and size (Allan 1961) and occurs in Australia, Chile and New Zealand. It has
a chromosome number of 2n=16 (Dawson et al. 2000) although a count of 2n=48
has been reported in Tasmania (Jackson 1958). It mainly occurs in coastal estuary
habitats, although it can be found in dune habitats, and has also been recorded
inland in the South Island and around Lake Taupo on the North Island (Allan
1961). Ogden (1974) performed experimental garden studies with spathulate–
leaved S. radicans from an estuary habitat and a round-leaved dune form collected
from the Manawatu coast. These two forms retained the leaf shape and dimensions
when grown in identical conditions implying they are genetically distinct although

2
Ogden still regarded these forms as ecotypes rather than distinct species (Ogden
1974).
In 1997, Heenen described the round-leaved “ecotype” as a new species, Selliera
rotundifolia as the distinguishing characteristics of the two forms were retained in
identical environments. S. rotundifolia is distinguished from S. radicans by rotund
leaves (Figure 1.1) with a distinct petiole from the leaf lamina (Heenan 1997). It
has the same chromosome number as S. radicans, 2n=16 (Dawson et al. 2000), but
is endemic only to the lower western North Island where it is mainly found in dune
habitats (Heenan 1997). This species is rated in decline due to faster and taller
growing weed species that are rapidly modifying the dune habitats (de Lange et al.
2009).
The third Selliera species, Selliera microphylla, was described by Colenso in 1889.
It is indistinguishable from S. radicans except for a smaller size and inland
location, however, when cultivated it reverts to a larger size making it
indistinguishable from S. radicans. This has lead to suggestions that it is in fact a
mountain version of S. radicans which is known to be highly polymorphic with a
large variation in habitat (De Lange 2014) even with the segregation of S.
rotundifolia (Murray and de Lange 2013). Endemic to New Zealand, S.
microphylla is mainly found on the Central Volcanic Plateau and adjacent
mountains but has also been collected from the Eyre Mountains in the Southland
Land district. A single chromosome count of 2n=56 for S. microphylla has been
A B C
Figure 1.1 Examples of Selliera species in New Zeland. Selliera radicans (A) showing elongated spathulate leaves, S. rotundifolia (B) showing the rounder leaf with distinct petiole and leaf lamina and S. microphylla (C) distinct from S. radicans only in size.

3
reported for the Central North Island population in Matea Swamp but the South
Island populations still retained a chromosome number of 2n=16 (Murray and de
Lange 2013). As a result of these observations, the status of these three ‘species’
needs further investigation. To date, no genetic studies have been performed on any
of these species. In this thesis a population genetics approach was employed to
attempt to determine the species boundaries within Selliera.
1.2 Taxonomy Taxonomy is the classification of living organisms. It involves grouping organisms
based on relationships and can be at the species level or higher. This forms a
taxonomic hierarchy where the higher groupings contain all the groups below them,
for example, the phylum Magnoliophyta contains all angiosperms which are then
grouped further into order, family, genus and species. Understanding the
classification of organisms is important for all biological research providing
continuity across disciplines. In conservation it is important to make sure effort and
funding are best utilised. For these reasons species delimitation is an important part
of taxonomy essential for many fields of study to aid in knowledge and
conservation of threatened species.
Yet species delimitation remains one of the most difficult tasks in biology (Birky et
al. 2010) particularly on younger islands where there is generally less time for
speciation processes to complete (Whittaker et al. 2007). The properties of species,
such as monophyly, reproductive isolation, distinct morphology and habitat are
often used as criteria to delimit species but can cause disagreements between
species concepts as these are biological properties (De Queiroz 2007). This
disagreement between species concepts has been called the “species problem” (Hey
2001) with at least 24 different species concepts historically described (Mayden
1997).
1.2.1 Species concepts
To be able to delimit species we must have a species concept to describe what a
species is. There are at least 24 species concepts in the literature (Hey 2001) which

4
try to define a species but these concepts often don’t apply to all organisms, for
example, the biological species concept (Dobzhansky 1935; Mayr 1942) uses
reproductive incompatibility, a major factor in speciation, to distinguish species but
plants can have high rates of hybridization within and between genera (Whitney et
al. 2010) so many described species of plants are not reproductively isolated.
Furthermore, allopatric species, which are geographically isolated, may not develop
reproductive isolation over time even if they become morphologically and
genetically differentiated from each other and may still be capable of reproduction
if introduced together again leading to confusion over whether these are the same
species or not under the biological species concept. Also ring species such as
Ensatina eschscholtzii Gray. (Plethodontidae) can be difficult to delimit under this
concept as all subspecies can interbreed with the adjacent subspecies except for the
geographically terminal and most distantly related subspecies thereby making it
difficult to determine where to draw the species boundaries (Wake 2006). The
biological species concept encounters even more problems with fossils, where
evidence of reproductive isolation can no longer be determined, or typically
asexual organisms such as bacteria which do not undergo typical forms of sexual
reproduction (Mayden 1997).
Another example, the phylogenetic species concept is often used in systematics and
defines a species as the smallest group of organisms that share a common ancestor
and can be distinguished from other such groups. This concept often requires
monophyly but many species, especially plant species, are not monophyletic due to
hybridization or polyploidy. Chrisp and Chandler (1996) tested monophyly in
several studies which suggested that estimates of paraphyly range from 20 -50%.
Bacon et al. (2012) tested monophyly in Pritchardia Seem & H Wendl.
(Arecaceae) species with only 5 of 27 species showing monophyly although these
five species also only had weak support in a maximum parsimony analysis. Ring
species can be an example of paraphyletic species which could be considered
monophyletic under this concept even if reproductive isolation occurred between
some of the ‘species’ so the divergence of these potential ‘species’ would not be
recognised by the phylogenetic concept (Crisp and Chandler 1996). This is
important as these paraphyletic species could produce misleading results if

5
assumed monophyletic when they are not. These species concepts are based on
single characters, particularly ecological and biological characters, which cause
disagreements between different taxa and even between the different concepts.
De Queiroz (2007) suggested that these species concepts had an underlying unity
and the incompatibility of them is based on biological properties such as character
states, reproduction or ecological niche and habitat, and proposed an alternative
concept now called the “general lineage concept” (Figure 1.2). This concept defines
a species as a lineage that is evolving separately to other lineages. During the
existence of a species lineage some or all of the properties of a species, that result
in incompatibilities between previous species concepts, may be acquired by the
evolving “species” which is considered evidence that a lineage is a distinguished
species (De Queiroz 2007). At the symposium for the Society of Systematic
Biologists there was general agreement by almost all present that species are
lineages (Wiens 2007).
The important part of the lineage concept is that it does not define a separate
lineage based on only one or more biological properties but uses all these properties
as evidence for the separation of lineages. However a disadvantage of the lineage
concept is that lineages that haven’t completed speciation or are currently diverging
will be difficult to identify as they will not show clear boundaries from the ancestor
Figure 1.2 Representation of the general lineage species concept. The arrows indicate the process of speciation where species properties are acquired and so species delimitation is difficult during this time. The black and white circles represent the two new distinct species that can easily be differentiated. Figure modified from De Queiroz (2007).

6
species (De Queiroz 2007). Also there is no way of knowing whether these lineages
will complete speciation rather than return to one (the ancestor) species or become
extinct (Crisp and Chandler 1996).
The species description used in this thesis will be the “general lineage concept”
where the biological properties of species, reproductive isolation, morphology and
genetic structure will be used to determine species boundaries. To aid
determination of species boundaries it may be helpful to consider how species
arise.
1.3 Speciation 1.3.1 Models of speciation
Speciation is the process whereby new species arise. As the forces that drive
genetic differentiation, random genetic drift, mutation, migration and natural
selection, act on populations, we could consider species to be groups of populations
that contain distinguishing characteristics and remain distinct (Futuyma 2005).
There are several models of speciation. Firstly allopatric speciation occurs when
populations become geographically isolated and gene flow between them is
disrupted resulting in the populations evolving into distinct species. The
Dobhansky-Muller-Bateson (Orr 1996) model of speciation describes how
reproductive isolation can evolve between two geographically isolated populations.
In this model isolation between populations over time leads to an accumulation of
incompatible mutations. These incompatible mutations, when fixed in at least two
loci will prevent reproduction between populations. If the separated populations
integrate again they are reproductively isolated, due to incompatibilities of the loci
involved, leading to the formation of a new species (Bateson 1909; Dobzhansky
1934; Muller 1942). Reproductive isolation is not required to consider allopatric
species as separate species under the general lineage concept as long as they have
acquired some of the biological properties that constitute a species and remain
distinct lineages. Instead the two geographically isolated populations may acquire
all or just some of the properties that provide evidence of a new species (De
Queiroz 2007). This can be seen in plants as hybridization occurs frequently

7
between described species (Whitney et al. 2010) and reproductive isolation is not
required to form separate species under the general lineage concept.
Sympatric speciation occurs within a population where a genetic mutation or niche
selection for some of the individuals provides a reproductive isolating mechanism
allowing each new lineage to evolve leading to a potential new species if they
remain reproductively or habitually isolated (Smith 1966). Disruptive selection is
often proposed as a method of sympatric speciation (Futuyma 2005) where
homozygous genotypes have a higher fitness than the heterozygote genotypes.
1.3.2 Speciation by polyploidy
Polyploidy has been observed as an important method of speciation especially in
plants (Wendel 2000). For example, diploid parents form tetraploid offspring that
produce sterile triploids when backcrossed with the diploid parents, but these can
potentially produce fertile offspring with other tetraploids. This situation leads to
isolation from the parents and may result in speciation as there will be reduced
gene flow between the parental species and the polyploids. However, how these
polyploid species establish is unknown because if crossing with parents produces
sterile offspring, then the reproductive success would be lower than the parents.
However, self-fertilization, higher fitness, a new environment from the diploid or
vegetative reproduction could help a polyploid population establish (Rodriguez
1996). In polyploids chromosomal rearrangements are often observed (Chester et
al. 2012; Lagercrantz 1998; Soltis and Soltis 1999) which also can result in
reproductive incompatibility from the parental diploids. Also polyploidy, especially
allopolyploids formed from two different species, may have the potential to adapt
to environments that are unsuitable for the parents, due to the doubling of
chromosome number and therefore the genetic material, allowing ecological and
morphological divergence from the diploid parents. Speciation by polyploidy has
been observed in treefrogs where the tetraploid species Hyla versicolor Le Conte.
(Hylidae) has multiple origins from the diploid H. chrysoscelis Cope. with each
tetraploid lineage more closely related to different diploid lineages (Ptacek et al.
1994). In plants polyploid speciation has been observed in Asplenium cimmeriorum
Brownsey & de Lange. (Aspleniaceae) and A. gracillimum Colenso. Each of these

8
species contains at least two allopolyploids that are genetically distinguished even
in sympatry indicating they can be considered distinct species (Perrie et al. 2010).
1.3.3 Speciation and Hybridization
Hybridization is among one of the most complicating factors in species delimitation
and has an important role in the evolution of many lineages. In plants hybridization
between species and some genera is common (Whitney et al. 2010). Whitney et al.
(2010) found that hybrids occurred in 40% of the plant families examined, although
these were in only about 16% of genera surveyed, indicating hybridization is
common but not pervasive. However the estimation of hybridization frequency in
this study likely underestimates the actual frequency because many species cannot
be inspected throughout their range so many hybrids may not be documented and
hybrids may not be suspected if the parental taxa are not obvious, for example the
parental species have become extinct (Whitney et al. 2010).
Hybridization between species is a form of gene flow and can potentially dissolve
the barriers between species, prevent divergence of populations into new species or
cause extinction of less aggressive species, as has been happening with some island
species (Rhymer and Simberloff 1996). Therefore for species to remain isolated
while hybridization is occurring, there must be strong selection on each of the
parent species to allow them to remain diverged (Pinho and Hey 2010).
Alternatively post- and pre-zygotic mechanisms are strategies that prevent
hybridization or establishment of hybrids and therefore gene flow between species.
Post-zygotic isolation, such as hybrid sterility, prevents gene flow between species,
which can allow them to remain distinct, but this also has the effect of wasted
reproductive effort (Allendorf et al. 2001) which can be significant especially in
endangered populations. In post-zygotic isolation, the hybrid zygote is formed but
either doesn’t develop or develops but is sterile or inviable; this is considered an
isolating mechanism (Orr and Turelli 2001) as there is consequently no effective
gene flow between populations leading to reproductive isolation and separate
evolutionary lineages. Prezygotic mechanisms act before the zygote is formed to
prevent hybridization and, therefore, gene flow between species (Zenkteler 1990).
An example of a prezygotic mechanism is behavioural isolation, which can be seen
9
in pollinator preference in Mimulus lewisii Pursh. (Phrymaceae) and M. cardinalis
Douglas ex Benth. M. lewisii flower traits are preferred by bees whereas M.
cardinalis flower traits are preferred by hummingbirds preventing reproduction
between the two plant species (Schemske and Bradshaw 1999).
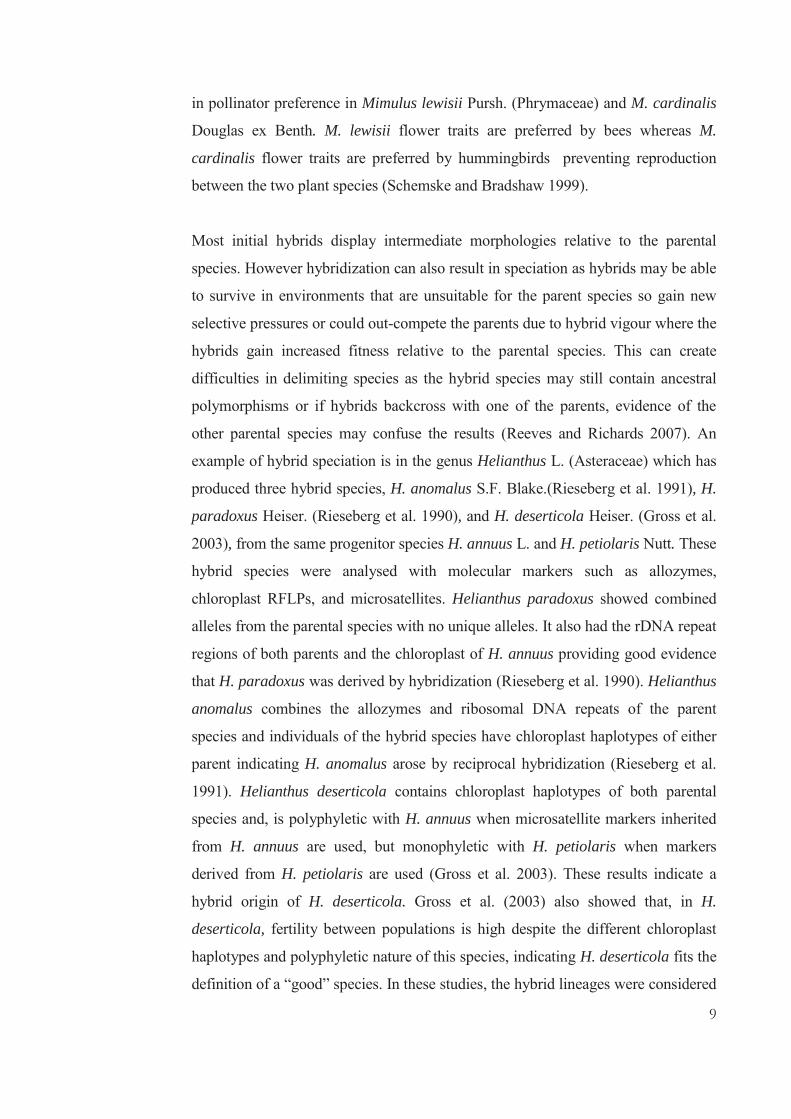
Most initial hybrids display intermediate morphologies relative to the parental
species. However hybridization can also result in speciation as hybrids may be able
to survive in environments that are unsuitable for the parent species so gain new
selective pressures or could out-compete the parents due to hybrid vigour where the
hybrids gain increased fitness relative to the parental species. This can create
difficulties in delimiting species as the hybrid species may still contain ancestral
polymorphisms or if hybrids backcross with one of the parents, evidence of the
other parental species may confuse the results (Reeves and Richards 2007). An
example of hybrid speciation is in the genus Helianthus L. (Asteraceae) which has
produced three hybrid species, H. anomalus S.F. Blake.(Rieseberg et al. 1991), H.
paradoxus Heiser. (Rieseberg et al. 1990), and H. deserticola Heiser. (Gross et al.
2003), from the same progenitor species H. annuus L. and H. petiolaris Nutt. These
hybrid species were analysed with molecular markers such as allozymes,
chloroplast RFLPs, and microsatellites. Helianthus paradoxus showed combined
alleles from the parental species with no unique alleles. It also had the rDNA repeat
regions of both parents and the chloroplast of H. annuus providing good evidence
that H. paradoxus was derived by hybridization (Rieseberg et al. 1990). Helianthus
anomalus combines the allozymes and ribosomal DNA repeats of the parent
species and individuals of the hybrid species have chloroplast haplotypes of either
parent indicating H. anomalus arose by reciprocal hybridization (Rieseberg et al.
1991). Helianthus deserticola contains chloroplast haplotypes of both parental
species and, is polyphyletic with H. annuus when microsatellite markers inherited
from H. annuus are used, but monophyletic with H. petiolaris when markers
derived from H. petiolaris are used (Gross et al. 2003). These results indicate a
hybrid origin of H. deserticola. Gross et al. (2003) also showed that, in H.
deserticola, fertility between populations is high despite the different chloroplast
haplotypes and polyphyletic nature of this species, indicating H. deserticola fits the
definition of a “good” species. In these studies, the hybrid lineages were considered

10
species when they are reproductively isolated from the parents and have a stable
but fertile genotype.
1.4 Methods of species delimitation Species delimitation is often carried out by a morphological or phylogenetic
approach. Morphological species delimitation in plants is difficult because plants
often have plastic phenotypes (Stearns 1989), meaning their phenotype can vary
depending on the environment they are growing in. To differentiate between
genetic and environmental effects, a common garden experiment must be
performed which is often time consuming and difficult so is not a common
practice. Morphological based species delimitation can also incorrectly delimit
cryptic species. Cryptic species are defined as two or more species that are
morphologically similar and so can be classified as the same species but are
actually distinctly evolving lineages (Paris et al. 1989). An example of a cryptic
species is Ceratopteris thalictroides Brongn. (Pteridaceae) which was discovered to
consist of three distinct types based on allozyme analysis and chloroplast DNA
analysis, but which cannot be morphologically distinguished due to the high
morphological plasticity of the species. Crossing experiments determined that one
of the discovered types (the south type) was completely cross-sterile with the other
two types. The other two types, North and third type, were partially cross-sterile but
maintained the genetic distinctiveness despite sporadic crossing suggesting the
species actually contains cryptic species (Masuyama et al. 2002). Therefore
morphological studies should be used in conjunction with genetic analyses (or
reproductive tests) in species delimitation when possible.
Phylogenetic studies use phylogenetic trees to represent relationships between
species and often rely on monophyly (Sites and Marshall 2004). In plants,
speciation by hybridization and recurrent polyploidy are common (Whitney et al.
2010), meaning species are not always monophyletic. As speciation can occur at
the population level, but populations are comprised of genetically diverse
individuals, phylogenetic trees can also disagree between the gene tree and the
species tree. Other causes of phylogenetic incongruence can be caused by
horizontal transfer through hybridization (Doyle 1992), gene duplication (Page

11
1993) or extinction and lineage sorting. This disagreement between phylogenetic
trees can make species delimitation difficult using a phylogenetics approach
especially as usually only one or a few markers are included in the analysis which
may yield different trees depending on the molecular markers used.
The ideal markers for phylogenetics should be single copy, be easy to align, all
sites in a codon should be equally able to vary, have substitution rates high enough
to provide enough informative sites but not too low that reversion mutations can
occur, have approximately equal base composition, and have universal primers
(Cruickshank 2002). Nuclear DNA sequence markers, such as ITS, and chloroplast
markers, are commonly used in phylogenetics (Duminil and Michele 2009).
Chloroplast markers are often highly conserved between species as most plants are
homoplasmic for the organelle genomes so no recombination occurs (Ouborg et al.
1999) making chloroplast markers more suited for use at higher taxonomic levels
(Palmer et al. 1988). ITS, a commonly used nuclear marker, evolves faster than the
chloroplast genome (Gielly and Taberlet 1994) making it suitable for more closely
related species. However ITS can have problems with lineage sorting (Cubas et al.
2006) and concerted evolution (Alvarez and Wendel 2003) confounding species
relationships. ITS and chloroplast markers have universal primers available for
PCR amplification so they can be easily used (Duminil and Michele 2009).
However, the common problem with these markers is the low amount of variation
between closely related species, even in ITS (Baldwin et al. 1995), leading to low
species-level resolution. AFLPs or RAPDs are also used in phylogenetic analyses
(Hodkinson et al. 2000) but they are dominant markers, which means heterozygotes
cannot be differentiated from homozygotes, and they can have problems with
homoplasy (Despres et al. 2003). Homoplastic characters are those shared by
species but not present in a common ancestor, thereby confusing inferences about
historical relationships (Duminil and Michele 2009).
Thus phylogenetic trees are potentially poor indicators of good species especially
where there is gene flow (Reeves and Richards 2007), which may prevent
characters from becoming fixed and causing collapsed nodes. However
phylogenetic trees allow comparison between morphological and molecular data

12
which is useful for inferring species relationships. As the forces driving speciation,
natural selection, mutation, migration, and random genetic drift, act on populations;
studying the population structure may help in determining species boundaries.
Therefore a population genetics approach may succeed in delimitating species
where other methods struggle.
1.5 Population genetics Population genetics is the study of the genetic structure of populations which is
determined mainly by gene flow between populations and the maintenance of
genetic diversity (Michalski and Durka 2007). These factors are influenced by
natural forces such as mutation, migration, assortative mating, natural selection and
population size (Whitlock and McCauley 1999). When these forces are not acting
on a population, the genotype frequencies of any locus are simply dependent on the
allele frequencies, which is termed Hardy-Weinberg equilibrium as it was
described separately in 1908 by Hardy and Weinberg (Wigginton et al. 2005).
Testing whether a population conforms to Hardy-Weinberg equilibrium is common
in population genetic studies where deviations from Hardy-Weinberg equilibrium
may indicate that any of the natural forces, such as natural selection, are acting on
the population (Thompson et al. 2007). Alternatively a deviation can indicate
problems with markers or genotyping (Wigginton et al. 2005). Population structure
can also be evaluated by genetic distances (Kalinowski 2002), fixation indices such
as FST, and other statistical tests such as ANOVA, which compares genetic
variation between and within populations. This genetic structure is detected usually
by analysis of neutral molecular markers such as microsatellites (Michalski and
Durka 2007) or SNPs with many individuals sampled from each population. In
species delimitation studies, these data can also be analysed by phylogenetic trees
or networks to indicate species relationships.
1.5.1 Markers used in population genetics
A population genetic approach uses the genetic structure of populations or
collections of individuals for species delimitation, and therefore, requires markers
different from those used in phylogenetics. In population genetics, markers should
be easily assayed by PCR, comparable, have many loci available, and be easily

13
screened (Sunnucks 2000). Protein molecular markers such as allozymes were the
first molecular markers used for population genetics studies (Hubby and Lewontin
1966). Allozymes are based on enzyme variation in individuals but have mainly
been replaced by DNA markers. However, Duminil et al. (2007) suggest
proteomics can be a useful tool in studying the relationships between genotype and
phenotype and to resolve issues on ecology and evolution of plant species or
populations, but that the area still needs to be further developed. Single nucleotide
polymorphisms (SNPs) are quicker and easier to analyse than microsatellites (Jones
et al. 2007). They are commonly found throughout the genome, but are less
variable than microsatellites and many other markers, so require more loci to be
informative.
Microsatellite markers are being used increasingly in population genetics studies.
The high amount of variability, smaller number of loci needed when compared to
single nucleotide polymorphisms, and genotyping ease (Ashley and Dow 1994)
mean they will most likely continue to be used especially with advances in their
discovery, including next-generation sequencing which increases the efficiency of
developing markers (Gardner et al. 2011). Microsatellite markers are abundant
throughout the genome and di-nucleotide repeat microsatellite loci are often used as
they are highly polymorphic and evolve faster than other repeats, making them
useful for closely related taxa that may not contain a lot of variation, but can stutter
more making genotyping difficult (Gardner et al. 2011). Stutter in microsatellites
can be caused by slip-strand pairing leading to differently sized fragments (Miller
and Yuan 1997). Gardner et al. (2011) recommends using tetranucleotide repeats as
they have high polymorphism and low stutter but the allele ranges can be larger.
Another advantage of microsatellites is that they are expected to be neutral,
reducing the effect of selection pressures, and are co-dominant markers (Duminil
and Michele 2009), so can differentiate between heterozygotes and homozygotes,
which is important for detecting hybridization especially in population genetic
analyses. Microsatellite markers are more species-specific than other markers
where cross-amplification within or between a genus many not always be possible
although this may require markers to be developed for each species or genus
studied (Selkoe and Toonen 2006). Microsatellites can be homoplasious, but using

14
multiple loci can minimise the effect (Duminil and Michele 2009). These
advantages mean microsatellite markers can provide information on species
delimitation and on the genetic structure of populations (Duminil and Michele
2009), and therefore, are excellent markers for use in a population genetics
approach to species delimitation.
A good example of the power of microsatellites for species delimitation in a group
where other markers failed is the study of Schoenoplectiella Lye. (Cyperaceae)
(Kim, et al. 2012). They used microsatellite markers to delimit species in this
taxonomically difficult group and to determine the genetic relationships within the
genus. They resolved the differing results between morphology and ribosomal
sequence data for the hybrid S. x trapezoidea (Koidz.) J. Jung & H. K. Choi. using
microsatellites due to their high level of variability. However the methods used
were to score microsatellite bands as presence or absence as the ploidy level of
some species was unknown. This means they lost the information of codominant
markers but retained more reliable data as variation in ploidy level, when it is
unknown, makes scoring microsatellites difficult (Kim et al. 2012). Microsatellite
markers are becoming the favoured method to use in species delimitation and
detection of natural hybrids due to their resolving power and reproducibility (Kim
et al. 2012).
1.5.2 Analysis methods in population genetics
There are two types of analyses for species delimitation, non-tree based methods
which calculate gene flow or genetic differences between populations or species by
calculating genetic distances and number of migrants (Sites and Marshall 2004)
and tree-based methods, which often use phylogenetic trees using the phylogentic
species concept. Non-tree methods make assumptions about gene flow and certain
properties of populations, which, if not met, can produce incorrect relationships
between species (Sites and Marshall 2003). F statistics are commonly used in
population genetics (Wright 1951). FIS measures the ratio of observed to expected
heterozygosity in a population where a positive value indicates a homozygote
excess and a negative value indicates a heterozygote excess within the population.
Homozygote excess may indicate inbreeding within the population but also can be

15
the result of null alleles or the loci being under selection. A heterozygote excess
may indicate out-crossing between populations. FST measures the genetic
differentiation between populations where a higher value indicates there is a greater
differentiation between populations and a low value indicates less difference
between populations. Tree methods often lean toward monophyly to describe a
species (Sites and Marshall 2004). However, in recent divergences and especially,
in plants, where hybridization is common, monophyly may not be upheld, which
can cause anomalies such as polytomies in bifurcating trees or evidence of
hybridization can be lost during the tree-making process (Reeves and Richards
2007). Also single gene trees may not be representative of phylogenetic
relationships (DeSalle et al. 2005) especially where hybridization has occurred in
the past as different gene trees may show different relationships.
Phylogenetic networks can resolve this problem because they can identify
evolutionary events like hybridization and recombination (Cardona et al. 2009) so
can provide a more accurate portrayal of species relationships. Bacon et al. (2012)
used phylogenetic trees in their study of Pritchardia (Arecaceae); their results
showed unresolved relationships for several species which could be due to the high
rates of gene flow common between species in this genus. As phylogenetic trees
assume that a lack of gene flow between species maintains monophyly (Sites and
Marshall 2004), they are not useful for species without reproductive isolation
where monophyly may not be observed. Phylogenetic networks use distance or
other based methods to produce a network that can represent gene flow events.
STRUCTURE (Pritchard et al. 2000) provides another form of analysis common in
population genetics. This program calculates the proportion of the genome derived
from hypothetical ancestral populations calculated independently of the genome
assignment of individuals thereby showing which individuals are genetically
similar. The K value determines the number of ancestral populations which can be
analysed to find the optimum K value by assessing the likelihood of a model fitting
the data.

16
1.6 Focus of this research Three species of Selliera have been previously described in New Zealand based on
morphological characteristics, particularly leaf morphology and geographic
location. Only one species of Selliera is broadly recognised, Selliera radicans,
(Mabberley 2008) which is known be highly polymorphic and can be found in a
variety of habitats (De Lange 2014) leading to disagreement about the status of
some species. No genetic studies have previously been performed on this genus. A
population genetics approach, using microsatellite markers, is employed here with
aims to:
1. Develop reliable and polymorphic microsatellite markers to use for
Selliera.
2. Determine the species boundaries within Selliera.
3. Examine the population structure within Selliera species.
These aims will be addressed in the following two chapters which have been
written as manuscripts for publication. Chapter 2 was written following the ‘primer
note’ guidelines for Applications in Plant Sciences. Chapter 4 includes a conclusion
and summarises the results from the previous chapters.

17
1.7 References
Allan, H. H. (1961), Flora of New Zealand. Volume I, Indigenous tracheophyta :
psilopsida, lycopsida, filicopsida, gymnospermae, dicotyledones
(Wellington, N.Z.: R.E. Owen Govt. Printer), 1085.
Allendorf, F. W., et al. (2001), 'The problems with hybrids: setting conservation
guidelines', Trends in Ecology & Evolution, 16 (11), 613-22.
Alvarez, I. and Wendel, J. F. (2003), 'Ribosomal ITS sequences and plant
phylogenetic inference', Molecular Phylogenetics and Evolution, 29 (3),
417-34.
Ashley, M. V. and Dow, B. D. (1994), 'The use of microsatellite analysis in
population biology: background, methods and potential applications', Exs,
69, 185-201.
Baldwin, B. G., et al. (1995), 'The ITS region of nuclear ribosomal DNA - a
valuable source of evidence on angiosperm phylogeny.', Annals of the
Missouri Botanical Garden, 82 (2), 247-77.
Bateson, W (1909), 'Heredity and variation in modern lights', Darwin and Modern
Science, (85-81).
Birky, C. W., et al. (2010), 'Using population genetic theory and DNA sequences
for species detection and identification in asexual organisms', Plos One, 5
(5).
Boul, Kathryn E., et al. (2007), 'Sexual selection drives speciation in an Amazonian
frog', Proceedings of the Royal Society B-Biological Sciences, 274 (1608),
399-406.
Cardona, Gabriel, Rossello, Francesc, and Valiente, Gabriel (2009), 'Comparison of
Tree-Child Phylogenetic Networks', Ieee-Acm Transactions on
Computational Biology and Bioinformatics, 6 (4), 552-69.
Cheeseman, T. F. (1876), 'On the Fertilization of Selliera', Transactions and
Proceedings of the Royal Society of New Zealand 1868-1961, 9.
Chester, Michael, et al. (2012), 'Extensive chromosomal variation in a recently
formed natural allopolyploid species, Tragopogon miscellus (Asteraceae)',
Proceedings of the National Academy of Sciences of the United States of
America, 109 (4), 1176-81.

18
Colenso, W (1889), 'A description of some newly-discovered phanogamic plants,
being a further contribution towards the making-known the botany of New
Zealand.', Transactions and Proceedings of the Royal Society of New
Zealand 1868-1961, 22, 459-93.
Crisp, Michael D. and Chandler, Greg T. (1996), 'Paraphyletic species', Telopea, 6
(4), 813-44.
Cruickshank, R. H. (2002), 'Molecular markers for the phylogenetics of mites and
ticks', Systematic and Applied Acarology, 7, 3-14.
Cubas, Palorna, Pardo, Cristina, and Tahiri, Hikmat (2006), 'Morphological
convergence or lineage sorting? The case of Cytisus purgans
(Leguminosae)', Taxon, 55 (3), 695-704.
Dawson, M. I., Brownsey, P. J., and Lovis, J. D. (2000), 'Index of chromosome
numbers of indigenous New Zealand pteridophytes', New Zealand Journal
of Botany, 38 (1), 25-46.
de Lange, P. J. (2014), 'Selliera radicans', New Zealand Plant Conservation
Network <http://www.nzpcn.org.nz/flora_details.aspx?ID=2255>, accessed
22 May.
de Lange, P. J., et al. (2009), 'Threatened and uncommon plants of New Zealand
(2008 revision)', New Zealand Journal of Botany, 47 (1), 61-96.
De Queiroz, K. (2007), 'Species concepts and species delimitation', Systematic
Biology, 56 (6), 879-86.
DeSalle, R., Egan, M. G., and Siddall, M. (2005), 'The unholy trinity: taxonomy,
species delimitation and DNA barcoding', Philosophical Transactions of
the Royal Society B-Biological Sciences, 360 (1462), 1905-16.
Despres, L., et al. (2003), 'Using AFLP to resolve phylogenetic relationships in a
morphologically diversified plant species complex when nuclear and
chloroplast sequences fail to reveal variability', Molecular Phylogenetics
and Evolution, 27 (2), 185-96.
Dobzhansky, T. H. (1934), 'Studies on hybrid sterility. I. Spermatogenesis in pure
and hybrid Drosophila pseudoobscura', Zeitschr Zelljorsch U Mikrosk Anat,
21 ((2)), 169-223.
--- (1935), 'A critique of the species concept in biology', Philosophical Science, 2,
344 -55.

19
Doyle, J. J. (1992), 'Gene trees and species trees - molecular systematics as one-
character taxonomy', Systematic Botany, 17 (1), 144-63.
Duminil, J and Michele, M. Di (2009), 'Plant Species : A comparison of
morphological and molecular markers', Plant Biosystems - An International
Journal Dealing With All Aspects of Plant Biology: Official Journal of the
Societa Botanica Italiana, 143 (3), 528-42.
FloraCommittee. (2014), 'Goodeniaceae', Flora of New Zealand, accessed 14
January.
Futuyma, D J (2005), Evolution (Sunderland, U.S.A.: Sinauer Associates, Inc).
Gardner, Michael G., et al. (2011), 'Rise of the machines - recommendations for
ecologists when using next generation sequencing for microsatellite
development', Molecular Ecology Resources, 11 (6), 1093-101.
Gielly, L. and Taberlet, P. (1994), 'The use of chloroplast dna to resolve plant
phylogenies - noncoding versus rbcl sequences', Molecular Biology and
Evolution, 11 (5), 769-77.
Gross, B. L., Schwarzbach, A. E., and Rieseberg, L. H. (2003), 'Origin(s) of the
diploid hybrid species Helianthus deserticola (Asteraceae)', American
Journal of Botany, 90 (12), 1708-19.
Hardy, G. H. (1908), 'Mendelian proportions in a mixed population', Science, 28,
49-50.
Hartl, D L.; and Clark, A G (2007), Principles of Population Genetics (Sinauer
Associates, Incorporated, 2007).
Heenan, P. B. (1997), 'Selliera rotundifolia (Goodeniaceae), a new, round-leaved,
species from New Zealand', New Zealand Journal of Botany, 35 (2), 133-
38.
Hey, J. (2001), 'The mind of the species problem', Trends in Ecology & Evolution,
16 (7), 326-29.
Hodkinson, T. R., et al. (2000), 'A comparison of ITS nuclear rDNA sequence data
and AFLP markers for phylogenetic studies in Phyllostachys
(Bambusoideae, Poaceae)', Journal of Plant Research, 113 (1111), 259-69.
Hubby, J. L. and Lewontin, R. C. (1966), 'A molecular approach to study of genic
heterozygosity in natural populations .I. number of alleles at different loci
in Drosophila pseudoobscura', Genetics, 54 (2), 577-&.

20
Jackson, W. D. (1958), 'Chromosome numbers in Tasmanian Goodeniaceae and
Brunoniaceae', Papers and Proc Roy Soc Tasmania, 92, 161-63.
Jones, E. S., et al. (2007), 'A comparison of simple sequence repeat and single
nucleotide polymorphism marker technologies for the genotypic analysis of
maize (Zea mays L.)', Theoretical and Applied Genetics, 115 (3), 361-71.
Kalinowski, S. T. (2002), 'Evolutionary and statistical properties of three genetic
distances', Molecular Ecology, 11 (8), 1263-73.
Kim, Changkyun, Jung, Jongduk, and Choi, Hong-Keun (2012), 'Molecular
identification of Schoenoplectiella species (Cyperaceae) by use of
microsatellite markers', Plant Systematics and Evolution, 298 (4), 811-17.
Lagercrantz, U. (1998), 'Comparative mapping between Arabidopsis thaliana and
Brassica nigra indicates that Brassica genomes have evolved through
extensive genome replication accompanied by chromosome fusions and
frequent rearrangements', Genetics, 150 (3), 1217-28.
Mabberley, D.J (2008), Mabberley's plant book, a portable dictionary of plants,
their classification and uses (3rd edn.: Cambridge University Press).
Masuyama, S., et al. (2002), 'Cryptic species in the fern Ceratopteris thalictroides
(L.) Brongn. (Parkeriaceae). 1. Molecular analyses and crossing tests',
Journal of Plant Research, 115 (1118), 87-97.
Mayden, R L (1997), 'A hierarchy of species concepts: the denouement in the saga
of the species problem', Methodology, 54, 381-424.
Mayr, E (1942), Systematics and the Origin of Species (Columbia University Press,
New York. ).
Michalski, S. G. and Durka, W. (2007), 'High selfing and high inbreeding
depression in peripheral populations of Juncus atratus', Molecular Ecology,
16 (22), 4715-27.
Miller, M. J. and Yuan, B. Z. (1997), 'Semiautomated resolution of overlapping
stutter patterns in genomic microsatellite analysis', Analytical Biochemistry,
251 (1), 50-56.
Muller, H. J. (1942), ' Isolating mechanisms, evolution and temperature', Biological
Symposium, 6, 71 - 125.

21
Murray, B. G. and de Lange, P. J. (2013), 'Contributions to a chromosome atlas of
the New Zealand flora - 40. Miscellaneous counts for 36 families', New
Zealand Journal of Botany, 51 (1), 31-60.
Ogden, J. (1974), 'Observations on 2 coastal ecotypes of Selliera-radicans
(Goodeniaceae) growing in the manawatu district of new-zealand', New
Zealand Journal of Botany, 12 (4), 541-50.
Orr, H. A. (1996), 'Dobzhansky, Bateson, and the genetics of speciation', Genetics,
144 (4), 1331-35.
Orr, H. A. and Turelli, M. (2001), 'The evolution of postzygotic isolation:
Accumulating Dobzhansky-Muller incompatibilities', Evolution, 55 (6),
1085-94.
Ouborg, N. J., Piquot, Y., and Van Groenendael, J. M. (1999), 'Population genetics,
molecular markers and the study of dispersal in plants', Journal of Ecology,
87 (4), 551-68.
Page, R. D. M. (1993), 'Genes, organisms and areas - the problem of multiple
lineages', Systematic Biology, 42 (1), 77-84.
Palmer, J D, et al. (1988), 'Chloroplast DNA variation and plant phylogeny', Annals
of the Missouri Botanical Garden, 75, 1180-206.
Paris, C. A., Wagner, F. S., and Wagner, W. H. (1989), 'Cryptic species, species
delimitation, and taxonomic practice in the homosporous ferns', American
Fern Journal, 79 (2), 46-54.
Perrie, Leon R., et al. (2010), 'Parallel polyploid speciation: distinct sympatric
gene-pools of recurrently derived allo-octoploid Asplenium ferns',
Molecular Ecology, 19 (14), 2916-32.
Pinho, Catarina and Hey, Jody (2010), 'Divergence with gene flow: models and
data', Annual Review of Ecology, Evolution, and Systematics, 41, 215-30.
Pritchard, J. K., Stephens, M., and Donnelly, P. (2000), 'Inference of population
structure using multilocus genotype data', Genetics, 155 (2), 945-59.
Ptacek, M. B., Gerhardt, H. C., and Sage, R. D. (1994), 'Speciation by polyploidy
in treefrogs - multiple origins of the tetraploid, Hyla versicolor', Evolution,
48 (3), 898-908.

22
Reeves, Patrick A. and Richards, Christopher M. (2007), 'Distinguishing terminal
monophyletic groups from reticulate taxa: Performance of phenetic, tree-
based, and network procedures', Systematic Biology, 56 (2), 302-20.
Rhymer, J. M. and Simberloff, D. (1996), 'Extinction by hybridization and
introgression', Annual Review of Ecology and Systematics, 27, 83-109.
Rieseberg, L. H., Carter, R., and Zona, S. (1990), 'Molecular tests of the
hypothesized hybrid origin of 2 diploid Helianthus species (Asteraceae).',
Evolution, 44 (6), 1498-511.
Rieseberg, L. H., et al. (1991), 'Phylogenetic and systematic inferences from
chloroplast DNA and isozyme variation in Helianthus sect Helianthus
(Asteraceae)', Systematic Botany, 16 (1), 50-76.
Rodriguez, D. J. (1996), 'A model for the establishment of polyploidy in plants',
American Naturalist, 147 (1), 33-46.
Schemske, D. W. and Bradshaw, H. D. (1999), 'Pollinator preference and the
evolution of floral traits in monkeyflowers (Mimulus)', Proceedings of the
National Academy of Sciences of the United States of America, 96 (21),
11910-15.
Selkoe, K. A. and Toonen, R. J. (2006), 'Microsatellites for ecologists: a practical
guide to using and evaluating microsatellite markers', Ecology Letters, 9
(5), 615-29.
Sites, J. W. and Marshall, J. C. (2003), 'Delimiting species: a Renaissance issue in
systematic biology', Trends in Ecology & Evolution, 18 (9), 462-70.
--- (2004), 'Operational criteria for delimiting species', Annual Review of Ecology
Evolution and Systematics, 35, 199-227.
Smith, J. M. (1966), 'SYMPATRIC SPECIATION', American Naturalist, 100
(916), 637-&.
Soltis, D. E. and Soltis, P. S. (1999), 'Polyploidy: recurrent formation and genome
evolution', Trends in Ecology & Evolution, 14 (9), 348-52.
Stearns, S. C. (1989), 'The evolutionary significance of phenotypic plasticity -
phenotypic sources of variation among organisms can be described by
developmental switches and reaction norms', Bioscience, 39 (7), 436-45.
Sunnucks, P. (2000), 'Efficient genetic markers for population biology', Trends in
Ecology & Evolution, 15 (5), 199-203.

23
Thompson, Graham J., et al. (2007), 'Molecular-genetic analyses of dispersal and
breeding behaviour in the Australian termite Coptotermes lacteus: evidence
for non-random mating in a swarm-dispersal mating system', Australian
Journal of Zoology, 55 (4), 219-27.
Wake, D. B. (2006), 'Problems with species: Patterns and processes of species
formation in salamanders', Annals of the Missouri Botanical Garden, 93
(1), 8-23.
Weinberg, W (1908), 'Über den Nachweis der Vererbung beim Menschen',
Jahreshefte des Vereins Varterländische Naturkdunde in Württemberg, 64,
369-82.
Wendel, J. F. (2000), 'Genome evolution in polyploids', Plant Molecular Biology,
42 (1), 225-49.
Whitlock, M. C. and McCauley, D. E. (1999), 'Indirect measures of gene flow and
migration: F-ST not equal 1/(4Nm+1)', Heredity, 82, 117-25.
Whitney, K. D., et al. (2010), 'Patterns of hybridization in plants', Perspectives in
Plant Ecology Evolution and Systematics, 12 (3), 175-82.
Whittaker, Robert J., et al. (2007), 'The island immaturity - speciation pulse model
of island evolution: an alternative to the "diversity begets diversity" model',
Ecography, 30 (3), 321-27.
Wiens, J J (2007), 'Species delimitation: new approaches for discovering diversity',
Systematic Biology, 56 (6), 875-78.
Wigginton, J. E., Cutler, D. J., and Abecasis, G. R. (2005), 'A note on exact tests of
Hardy-Weinberg equilibrium', American Journal of Human Genetics, 76
(5), 887-93.
Wright, S. (1951), 'The genetical structure of populations', Annals of Eugenics, 15
(4), 323-54.
Zenkteler, M. (1990), 'Invitro fertilization and wide hybridization in higher-plants.',
Critical Reviews in Plant Sciences, 9 (3), 267-79.

24
C h a p t e r 2
Microsatellite primers in Selliera radicans (Goodeniaceae)
2.1 Abstract Premise of the study: Microsatellite markers were developed for species of Selliera
(Goodeniaceae) to investigate population structure and species boundaries within
the genus.
Methods and Results: Using 454 sequencing, 9 primer pairs were isolated from S.
radicans. The primer pairs amplified di- and tri-nucleotide repeats with 1-5 alleles
per locus. All 9 primer pairs amplified in the three species screened; S. radicans, S.
rotundifolia and S. microphylla.
Conclusions: The new primers provide an important resource for future
investigations in the genus Selliera for both population genetics and species
boundary research.

25
2.2 Introduction Selliera is a genus within the Goodeniaceae. In New Zealand three species of
Selliera have been described. Selliera radicans is described as having spathulate
elongated leaves but is also known to be highly polymorphic (Allan 1961), and has
a chromosome count of 2n=16 (Dawson et al. 2000). Selliera rotundifolia is
distinguished by rounded leaves and also has a chromosome count of 2n=16
(Dawson et al. 2000; Heenan 1997). It is endemic to the lower western North Island
(Heenan 1997). Both S. radicans and S. rotundifolia are coastal species. Selliera
microphylla is found inland on the central volcanic plateau on the North Island and
in the Eyre mountains on the South Island (Colenso 1889). It differs from S.
radicans only by smaller size and inland location and some believe it is simply a
mountain form of S. radicans; however a population of S. microphylla from Matea
swamp in the North Island has given a chromosome count of 2n=56 (Murray and
de Lange 2013). As these species have been described based only on morphology
or geography, and two are sympatric in part of their distribution, the status of these
species is questionable.
Future study, using a population genetics approach, may aid species delimitation in
Selliera and provide information on the population structure within groups.
Microsatellite markers are effective tools in population genetics due to their co-
dominance (Duminil and Michele 2009), abundance in the genome, ease of
genotyping (Ashley and Dow 1994), and high variability compared to other
markers meaning fewer loci are needed. High variability also means they are
potentially useful in delimiting closely related species where traditional sequence-
based markers have failed. High-throughput sequencing has made the development
of microsatellite markers more efficient than previous methods (Gardner et al.
2011). Here, using 454 pyrosequencing, microsatellite markers were developed for
Selliera species to be used to assess population structure and determine species
boundaries in subsequent work.

26
2.3 Methods and results
Genomic DNA was extracted from silica dried leaf tissue using a modified
cetyltrimethylammonium bromide (CTAB) method with an initial STE (sucrose,
Tris, and EDTA) wash (Shepherd and McLay 2011) and an additional RNAse step.
The DNA was dissolved in 100μL of TE buffer. DNA from Selliera radicans
collected from a population at Moana roa beach was chosen for 454 sequencing.
The sample had a concentration of 84.8ng/μL and a 260/280 of 1.99 quantified as
measured on a Nanodrop 2000 (Thermo-Scientific) and was run on a 1% agarose
gel to ensure RNA had been successfully removed. This genomic DNA was then
sequenced by shotgun sequencing on the 454 GS-FLX (Roche) by the NZGL (New
Zealand Genomic Limited).
The sequence data received was assembled into contigs in GENEIOUS (v5.6.7)
(Drummond et al. 2010) to increase the reliability of microsatellite detection and
preventing locus duplication. MSATCOMMANDER v0.8.2 (Faircloth 2008) was
used to search the Selliera contigs for di-, tri-, and tetra-nucleotide repeat motifs
with a minimum of seven uninterrupted repeats and with the requirement to design
primers at least 50 bp from the repeat region using Primer3 (Rozen and Skaletsky
2000). Criteria for primer pairs selected for testing included size between 150-
350bp, with no long repeats in the region surrounding the microsatellite (for
example mononucleotide repeats) and primers optimally would have 60% GC
content with a GC clamp at the 3’ end.
The total number of sequences generated by the 454 run was 57,561 with an
average sequence length of 407 bp. These sequences assembled into 8,101 contigs
where the average sequence length was 672 base pairs. From these contigs
MSATCOMMANDER (Faircloth 2008) detected 227 repeat motifs. Of the 227
repeat motifs found, 196 were dinucleotide repeats (86%), which had a high
frequency of AT repeats (51%), 30 were trinucleotide repeats (13%) and one
tetranucleotide repeat (0.4%). PRIMER3 designed primers for 107 of the 227
repeats detected. Of these 107, 90 primer pairs were designed for the dinucleotide
repeats, 17 primer pairs were designed for the trinucleotide repeats and no primer
pairs could be designed for the tetranucleotide repeat.

27
From the 107 microsatellite loci detected, 43 suitable primer pairs were chosen for
initial testing. Selected primer pairs were screened initially on 15 individuals
consisting of individuals from S. radicans and S. rotundifolia populations. PCR
amplification was performed in a volume of 10μL with 1X buffer BD (Solis
Biodyne, Tartu, Estonia), 50 μM of each of the dNTPs, 2.5 μM MgCl2, 0.5U of
Firepol polymerase (Solis Biodyne, Tartu, Estonia), 20 nM of forward primer, 450
nM of reverse primer and 450 nM M13 primer. Amplification by PCR was attained
by: 95ºC for 3 minutes, 35 cycles of 95ºC for 30 seconds, 53º C for 30 seconds and
72ºC for 1 minute and a 72ºC hold step for 20 minutes. The ABI3730 DNA
analyzer at the Massey Genome Service was used to genotype samples with alleles
scored manually in GENEMAPPER (v4.0) using CASS size standard (Symonds
and Lloyd 2004). The observed and expected heterozygosity and the number of
alleles per locus were calculated using GenAlEx 6.5 (Peakall and Smouse 2012).
Loci that were consistently amplifiable, clean, and amplified in all three species
were then chosen for further testing over six different populations. These
populations consisted of 20 individuals from each of the populations collected for
the three species. S. radicans populations consisted of Moana Roa, Napier,
Tauranga, and Ohiwa. Himatangi and Central Volcanic Plateau are populations of
S. rotundifolia and S. microphylla, respectively (Table 2.3). From the 43 primer
pairs, 24 were suitable for screening over the larger sample size of 100 individuals
which resulted in 9 markers that amplified consistently (Table 2.1). All nine of
these were polymorphic. Observed heterozygosity ranged from 0.000 to 0.737 and
expected heterozygosity ranged from 0.000 to 0.672 (Table 2.2).

28
Table 2.1. Characteristics of nine microsatellite primer pairs developed for use
in Selliera.
Locus Primer sequence
Repeat
motif
Size range
(bp) Ta
SR17 F AATGGAAAGCAACCAATCCC
AT^12
252 - 258
57.31
SR17 R TGTTCCAACGATTTGACCAAC 58.05
SR24 F GGCAAGTAGGAAATGTGGGC
AT^8
203 - 209
59.94
SR24 R TCTCCTGAACCAGCAACCG 60.38
SR29 F GAACGGCAGCAAACTACCC
AG^7
397 -399
59.86
SR29 R AGCCTCCAAGAGACTTGACC 59.79
SR31 F CAGCCGAGTGCCTACCTTC
CT^7 369 - 373
60.9
SR31 R CGCCCAACTATCAAGCCAC 59.64
SR37 F TCAAGCCTTTGGCAAGATAGTC
AG^10 296 - 302
59.42
SR37 R ACTCGTGGACGTAGGTTCTG 59.87
SR45 F CTGCGATAGCGTCGATTCC
GAT^9 271 - 283
59.3
SR45 R GTGGTTGATCCATATTACCAGGC 59.95
SR6 F GAGCTTGAGCTGGTTCCTC 208 – 214
55.5
SR6 R CCAGTCTCAGTCACAAGCG GA^8 55.6
SR11 F GCTCTACTTGCACGGCTTC 182 - 194
56.3
SR11 R GTGCTCACATGGGATCTGC GT^8 56.2
SR13 F AGGTCCTCACCCTCTTGAAC 313 - 315
56.3
SR13 R CAGCATGTTTGAAGCTACGTG TC^7 54.5
Ta =annealing temperature

29
Tabl
e 2.
2. R
esul
ts o
f the
pri
mer
scre
enin
g in
pop
ulat
ions
of S
ellie
ra.
Cent
ral V
olca
nic
Plat
eau
He
0.25
5
0.09
5
0.39
9
0.58
6
0.18
0
0.00
0
0.13
9
0.00
0
0.00
0
A, n
umbe
r of
alle
les;
HO
, obs
erve
d (h
eter
ozyg
osity
and
He,
expe
cted
het
eroz
ygos
ity.
Ho
0.00
0
0.10
0
0.45
0
0.10
5
0.20
0
0.00
0
0.15
0
0.00
0
0.00
0
A 2 2 2 3 2 1 2 1 1
Him
atan
gi
He
0.28
9
0.52
1
0.61
4
0.00
0
0.32
0
0.00
0
0.39
5
0.00
0
0.00
0
Ho
0.05
0
0.60
0
0.80
0
0.00
0
0.20
0
0.00
0
0.15
8
0.00
0
0.00
0
A 2 3 3 1 2 1 4 1 1
Taur
anga
He
0.18
8
0.00
0
0.65
9
0.63
0
0.00
0
0.50
0
0.50
0
0.00
0
0.00
0
Ho
0.00
0
0.00
0
0.73
7
0.42
1
0.00
0
1.00
0
0.00
0
0.00
0
0.00
0
A 2 1 3 4 1 2 2 1 1
Ohi
wa
He
0.00
0
0.00
0
0.09
5
0.50
0
0.00
0
0.00
0
0.38
8
0.00
0
0.00
0
Ho
0.00
0
0.00
0
0.10
0
0.70
0
0.00
0
0.00
0
0.42
1
0.00
0
0.00
0
A 1 1 2 2 1 1 2 1 1
Nap
ier
He
0.00
0
0.00
0
0.13
9
0.00
0
0.00
0
0.00
0
0.50
0
0.00
0
0.00
0
Ho
0.00
0
0.00
0
0.05
0
0.00
0
0.00
0
0.00
0
1.00
0
0.00
0
0.00
0
A 1 1 2 1 1 1 2 1 1
Moa
na R
oa
He
0.00
0
0.36
1
0.61
9
0.56
3
0.05
1
0.23
9
0.67
2
0.00
0
0.26
6
Ho
0.00
0
0.36
8
0.73
7
0.05
6
0.05
3
0.05
6
0.68
4
0.00
0
0.21
1
A 1 2 4 3 2 2 5 1 2
Locu
s
SR17
SR31
SR45
SR37
SR6
SR11
SR24
SR29
SR13
30
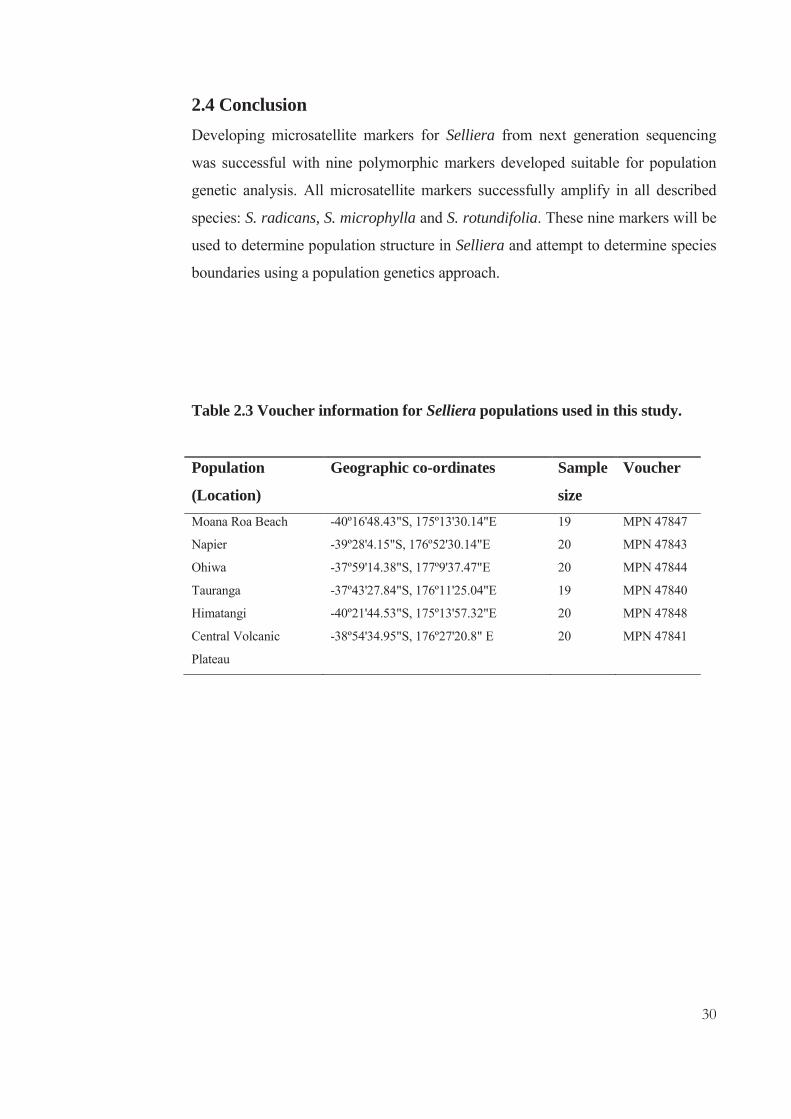
2.4 Conclusion Developing microsatellite markers for Selliera from next generation sequencing
was successful with nine polymorphic markers developed suitable for population
genetic analysis. All microsatellite markers successfully amplify in all described
species: S. radicans, S. microphylla and S. rotundifolia. These nine markers will be
used to determine population structure in Selliera and attempt to determine species
boundaries using a population genetics approach.
Table 2.3 Voucher information for Selliera populations used in this study.
Population
(Location)
Geographic co-ordinates Sample
size
Voucher
Moana Roa Beach -40º16'48.43"S, 175º13'30.14"E 19 MPN 47847
Napier -39º28'4.15"S, 176º52'30.14"E 20 MPN 47843
Ohiwa -37º59'14.38"S, 177º9'37.47"E 20 MPN 47844
Tauranga -37º43'27.84"S, 176º11'25.04"E 19 MPN 47840
Himatangi -40º21'44.53"S, 175º13'57.32"E 20 MPN 47848
Central Volcanic
Plateau
-38º54'34.95"S, 176º27'20.8" E 20 MPN 47841

31
2.5 References Allan, H. H. (1961), Flora of New Zealand. Volume I, Indigenous tracheophyta :
psilopsida, lycopsida, filicopsida, gymnospermae, dicotyledones
(Wellington, N.Z.: R.E. Owen Govt. Printer), 1085.
Ashley, M. V. and Dow, B. D. (1994), 'The use of microsatellite analysis in
population biology: background, methods and potential applications', Exs,
69, 185-201.
Colenso, W (1889), 'A description of some newly-discovered phanogamic plants,
being a further contribution towards the making-known the botany of New
Zealand.', Transactions and Proceedings of the Royal Society of New
Zealand 1868-1961, 22, 459-93.
Dawson, M. I., Brownsey, P. J., and Lovis, J. D. (2000), 'Index of chromosome
numbers of indigenous New Zealand pteridophytes', New Zealand Journal
of Botany, 38 (1), 25-46.
Drummond AJ, et al. (2010), 'Geneious v5.3 '.
Duminil, J and Michele, M. Di (2009), 'Plant Species : A comparison of
morphological and molecular markers', Plant Biosystems - An International
Journal Dealing With All Aspects of Plant Biology: Official Journal of the
Societa Botanica Italiana, 143 (3), 528-42.
Faircloth, BC (2008), 'MSATCOMMANDER: detection of microsatellite repeat
arrays and automated, locus-specific primer design.', Molecular Ecology
Resources
8, 92-94.
Gardner, Michael G., et al. (2011), 'Rise of the machines - recommendations for
ecologists when using next generation sequencing for microsatellite
development', Molecular Ecology Resources, 11 (6), 1093-101.
Heenan, P. B. (1997), 'Selliera rotundifolia (Goodeniaceae), a new, round-leaved,
species from New Zealand', New Zealand Journal of Botany, 35 (2), 133-
38.
Murray, B. G. and de Lange, P. J. (2013), 'Contributions to a chromosome atlas of
the New Zealand flora - 40. Miscellaneous counts for 36 families', New
Zealand Journal of Botany, 51 (1), 31-60.

32
Peakall, Rod and Smouse, Peter E. (2012), 'GenAlEx 6.5: genetic analysis in Excel.
Population genetic software for teaching and research-an update',
Bioinformatics, 28 (19), 2537-39.
Rozen S and HJ, Skaletsky (2000), 'Primer3 on the WWW for general users and for
biologist programmers.', Bioinformatics Methods and Protocols: Methods
in Molecular Biology (eds Krawetz S, Misener S) (Totowa, NJ: Humana
Press).
Shepherd, Lara D. and McLay, Todd G. B. (2011), 'Two micro-scale protocols for
the isolation of DNA from polysaccharide-rich plant tissue', Journal of
Plant Research, 124 (2), 311-14.
Symonds, V. V. and Lloyd, A. M. (2004), 'A simple and inexpensive method for
producing fluorescently labelled size standard', Molecular Ecology Notes, 4
(4), 768-71.

33
C h a p t e r 3
Population genetics and species delimitation in the genus Selliera (Goodeniaceae)
3.1 Abstract Species delimitation is an important but difficult task in biology. A good example
of the difficulties inherent in species delimitation is in the genus Selliera as species
have been described based on morphological features or geographic location.
Selliera consists of three described species; Selliera radicans, S. rotundifolia and S.
microphylla. Selliera rotundifolia is distinguished from S. radicans by rounder
leaves whereas S. microphylla is distinguished from S. radicans by an overall
smaller size and inland location. Here we applied a population genetics approach
using nine microsatellite markers combined with analysis of leaf morphology and
existing karyotype data to attempt to determine species boundaries within Selliera.
Two of the species, S. rotundifolia and S. microphylla, both had high
interpopulation divergence and two genetic lineages were identified within each of
these species which clustered with different S. radicans populations. Morphology
analysis of leaf shape suggested there are distinct morphologies between the three
species. Hybridization was observed between S. rotundifolia and S. radicans at one
of the sympatric sites but no gene flow was observed with S. rotundifolia at the
other site suggesting reproductive isolation in S. rotundifolia may have evolved
although there is evidence of possible introgression from S. rotundifolia to S.
radicans. Round leaves which are used to distinguish S. rotundifolia may have
originated multiple times and there is some evidence for reproductive isolation
between S. rotundifolia and S. radicans suggesting that at least one lineage of S.
rotundifolia is a distinct species. We suggest that the South Island S. microphylla
lineage is a mountain variant of S. radicans while the North Island lineage is
maintained as S. microphylla due to genetic distinction, geographic isolation and

34
polyploidy. This study provides important insights into species boundaries within
Selliera and has revealed interesting possibilities for future study with regard to
species boundaries especially in the areas of sympatry.

35
3.2 Introduction Species are described as the fundamental unit of biology (Hull 1977). As such, the
species is often the subject of study so it is important to be able to properly identify
the organism of interest. Identifying species is also important in conservation to
ensure that limited resources receive the proper focus. Historically, this has made
species delimitation an essential task however it has also proven difficult. Many
different species concepts have been described but none of these have been suitable
for all organisms. The disagreement between species concepts has been termed the
‘species problem’ (Hey 2001).
De Queiroz (2007) suggested a unified species concept, the general lineage
concept, where species are described as separately evolving metapopulations and
the biological properties of a species that were previously used to define species
concepts are evidence for separately evolving lineages. There is general agreement
among biologists that species are lineages (Wiens 2007), reducing the conflict
caused by different species concepts, but delineating the lineages still remains a
difficult task. Some suggest that species should be treated as hypotheses that can be
revised as evidence from natural populations becomes available (Sites and Crandall
1997; Templeton 2001); however, in delimiting species, evidence from several
sources should be considered, for example molecular and morphological, with a
sample size large enough to reduce the likelihood of sampling artefacts. Even with
multiple lines of evidence, events like hybridization, introgression, polyploidy and
incomplete lineage sorting can further increase the difficulty in delimiting species,
especially on younger islands where the evolutionary processes may not have had
time to complete (Birky et al. 2010) and ancestral signals may still be present in
divergent taxa.
Hybridization is common in plant species. Whitney, et al. (2010) observed hybrids
in at least 40% of the plant families they reviewed. Most initial hybrids have
intermediate morphologies to the parents although sometimes effects like hybrid
vigour can result in offspring that are larger and more successful than the parental
species. For species to remain distinct there must be strong selection against
hybrids, for example diversifying selection (Chapman et al. 2013), or reproductive

36
isolating measures such as infertile hybrids preventing backcrossing with the
parental species. Hybridization is a form of gene flow which has many effects,
including dissolving the boundaries between species and even speciation (James
and Abbott 2005; Wolfe et al. 1998) making this an interesting issue, especially
with regard to speciation and the development of reproductive isolation. However
for species delimitation hybridization can result in conflicting phylogenetic signals
making species boundaries difficult to determine.
A further complicating factor in species delimitation is interspecific variation.
Individual variation within a species is important to allow the maintenance of
genetic diversity preventing inbreeding depression or extinction. This means that
not all individuals within a species will be identical although most will share
similar distinguishing features. Populations of a species that are experiencing no or
low gene flow may be exposed to different environmental conditions and so will
acquire different allele frequencies and possibly morphologies, due to different
selective pressures which is termed local adaptation (Williams 1966). However,
isolated populations may also acquire different allele frequencies (and
morphologies) via genetic drift. Local adaptation may result in the evolution of
reproductive isolation, and therefore speciation, if populations are isolated over a
long period of time with no gene flow (Lenormand 2012). In addition to genetic
variation, plants often demonstrate phenotypic plasticity (Stearns 1989), resulting
in variable morphology simply caused by environmental factors. A common garden
experiment can often identify if the variation in morphology is due to genetic or
environmental factors although these can be difficult and time consuming to
conduct. When studying species boundaries we need to differentiate interspecific
variation from intraspecific variation. As a population genetics approach involves
determining interpopulation variation it can be a suitable approach to use in species
delimitation, especially for closely related species.
Population genetic approaches would appear well-suited to species delimitation in
closely related plant groups given the often larger sample sizes, the utilization of
more markers with greater resolution, and more flexible analytical approaches than
traditional systematics. Indeed such strategies have been successfully applied to

37
identify species where other methods have failed (Bacon et al. 2012; Edwards et al.
2009; Kim et al. 2012) and this approach is steadily growing in popularity. The
ideal marker for population genetics should be easily assayed by PCR, comparable,
have many loci available, and be easily screened (Sunnucks 2000). Microsatellite
markers are commonly used in population genetics due to the ease of genotyping
(Ashley and Dow 1994), their co-dominant nature (Duminil and Michele 2009),
and the relatively faster evolution compared to other markers, thereby making them
suitable for use in closely related species where hybridization may be expected.
An excellent group to assess species delimitation with a population genetics
approach is Selliera. Selliera is a genus in the Goodeniaceae which are identified
by their distinctive pollen cup or indusium. Members of the genus are described as
small creeping herbs which can form large mats and are mainly found in coastal
areas. Currently there is only one generally acknowledged species of Selliera,
Selliera radicans (Mabberley 2008; The Plant List 2013). Selliera radicans is
described with spatulate elongated leaves (Figure 3.1) and is found in Australia,
New Zealand and Chile; it can be found throughout the coast of New Zealand.
Chromosome counts reveal a chromosome number of 2n=16 (Dawson et al. 2000)
although a count of 2n=48 has been reported in Tasmania (Jackson 1958). Selliera
radicans is commonly found in estuarine areas although can be found in other
habitats, such as in dunes and on stream banks, and is noted to be highly
polymorphic (Allan 1961).
In New Zealand three species of Selliera (S. radicans, S.rotundifolia and
S.microphylla) have been described based on morphology or geographic location
although no genetic studies have been performed previously. Selliera rotundifolia
is distinguished from S. radicans by rounder leaves (Figure 3.1) (Heenan 1997)
that retain their shape in a common garden experiment (Ogden 1974). It is endemic
to the southwestern coast of the North Island and prefers a dune environment.
There is some overlap between the ranges of S. radicans and S. rotundifolia which
suggests the potential for hybridization to occur. Chromosome counts for S.
rotundifolia also have a chromosome number of 2n = 16 (Heenan 1997).

38
Selliera microphylla is described based on its overall smaller size and inland
distribution on the Central Volcanic Plateau and Eyre Mountains (Colenso 1889)
but is otherwise indistinguishable from S. radicans (Figure 3.1) and reverts to a
similar size when grown in a common garden (De Lange 2012a). However a
chromosome count for one population on the Central Volcanic Plateau has given
2n=56 (Murray and de Lange 2013) although it is noted as being doubtfully distinct
(De Lange 2012a).
In this study we used a population genetics approach utilizing new microsatellite
markers combined with morphology analysis of leaf shape and existing karyotype
data to assess the species boundaries within the three species of Selliera in New
Zealand. Using the general lineage concept which considers evidence from the
biological properties of species such as reproductive isolation, morphological
differences and genetic similarity we attempt to 1) Determine the species
boundaries within Selliera and 2) Examine the population structure within all
Selliera species.
A B C
Figure 3.1. Representatives of Selliera radicans (A), S. rotundifolia (B) and S. microphylla (C) with insets showing the typical leaf shape found in each of the species and scale bar at 10mm.
39
3.3 Methods
3.3.1 Sample collection
A total of 618 individuals were collected from 35 populations (Table 3.1)
representing all described species of Selliera from throughout New Zealand (Figure
3.2). All sampling was completed from November 2012 to March 2013. Several
leaves were collected from each plant sampled and placed in silica gel to preserve
the tissue until DNA extraction . At the time of collection three leaves from each
plant sampled were chosen as representative of the plant and photographed using a
digital camera next to a cm ruler for a scale for analysis of leaf morphology.
Twenty individuals per population were collected except where the population size
did not permit. Species designations were made at the time of collection based on
previous species descriptions including leaf shape and geographic location.
3.3.2 DNA extraction and genotyping
DNA was extracted from dried tissue using a modified CTAB method (L. E. Doyle
and Doyle 1987) and then frozen until needed. Each sample was screened at nine
microsatellite loci described previously (Chapter 2). PCR amplification was
performed in a volume of 10 μL with 1x buffer BD (Solis Biodyne, Tartu, Estonia),
50 μM of each DNTP, 2.5 μM MgCl2, 0.5U of Firepol polymerase (Solis Biodyne,
Tartu, Estonia), 20 nM of M13-tailed forward primer, 450 nM of reverse primer
and 450 nM dye-labelled M13 primer. Amplification by PCR was attained by:
95ºC for 3 minutes, then 35 cycles of 95ºC for 30 seconds, 53º C for 30 seconds
and 72ºC for 1 minute follwed by a 72ºC hold step for 20 minutes. One of three
fluorescent dyes, FAM, NED, or VIC, was incorporated into each marker and three
markers each containing a different dye were pooled for genotyping. The samples
were genotyped on a ABI3730 DNA analyzer at the Massey Genome Service
(Palmerston North, New Zealand) with alleles scored manually in GENEMAPPER
(v4.0) using CASS size standard (Symonds and Lloyd 2004).

40
Wk2 &
Wk1 HC
OPE
Wai
Figure 3.2 Distribution map of populations of Selliera collected for this study. Map was created in DIVA-GIS v7.5. Selliera radicans in blue, S. rotundifolia in yellow and S. microphylla in red. Insets show distribution of populations in closer detail for Auckland area and the Lower Western North Island.
Wk3

41
Table 3.1: Population information and genetic diversity estimates for 35
populations in Selliera. Populations are ordered by designated species.
Population Code N NA Ne %P Ho He FIS
S. rotundifolia
Kaupokonui KP 20 1.333 1.024 33.33 0.012 0.022 0.486
Manutahi Ma 20 1.778 1.327 55.56 0.189 0.198 0.078
Himatangi Ha 20 2.000 1.338 66.67 0.222 0.191 -0.140
Himatangi HB 10 1.667 1.109 66.67 0.167 0.153 -0.038
Himatangi HC 20 2.000 1.467 55.56 0.201 0.238 0.180
Waikawa Wk2 20 1.667 1.347 55.56 0.208 0.195 -0.043
Waverly* Wav 26 2.000 1.727 77.78 0.300 0.356 0.175
S. radicans
Castlepoint CSP 20 1.889 1.429 44.44 0.132 0.212 0.399
Waikawa Wk1 20 2.222 1.634 66.67 0.250 0.289 0.164
Waikawa Wk3 20 2.111 1.368 66.67 0.133 0.219 0.414
Tauranga WB 20 1.889 1.652 55.56 0.240 0.275 0.156
Hobson Bay HOB 20 1.111 1.006 11.11 0.006 0.005 0.000
Lion Rock (Piha) Li 20 1.333 1.133 33.33 0.088 0.082 -0.038
Cape Palliser CP 20 1.444 1.244 33.33 0.132 0.119 -0.014
Napier Na 20 1.222 1.129 22.22 0.117 0.071 -0.629
Plimmerton PLM 20 1.333 1.141 33.33 0.107 0.081 -0.280
Moana Roa Mo 20 2.444 1.695 77.78 0.240 0.308 0.246
Paterau Pat 15 1.556 1.357 33.33 0.141 0.172 0.214
Wharariki beach Wri 10 1.889 1.510 44.44 0.128 0.209 0.432
Makara MAK 20 2.000 1.437 44.44 0.141 0.204 0.332
Otaki Otk 20 2.222 1.362 66.67 0.119 0.188 0.391
Waikanae Wai 10 1.333 1.333 33.33 0.333 0.167 -1.000º
Auckland KES 10 1.111 1.111 11.11 0.111 0.056 -1.000º
Auckland Br 15 1.333 1.127 22.22 0.119 0.070 -0.684
Paraparaumu Prm 20 2.111 1.489 55.56 0.144 0.227 0.385

42
Population Code N NA Ne %P Ho He FIS
Dunedin EST 20 2.111 1.560 55.56 0.146 0.248 0.433
Ohope OPE 20 1.556 1.218 33.33 0.139 0.128 -0.063
Ohiwa Oh 20 1.333 1.193 33.33 0.136 0.109 -0.217
Tunnel Beach TB 20 1.778 1.351 44.44 0.068 0.178 0.633
Tiwai Point Tw 20 1.889 1.517 55.56 0.113 0.262 0.588
S. microphylla
West Dome WD1 20 1.444 1.240 44.44 0.044 0.137 0.689
West Dome WD2 20 1.778 1.384 55.56 0.045 0.208 0.795
Central Volcanic
Plateau
NT 20 1.778 1.323 66.67 0.112 0.184 0.414
Central Volcanic
Plateau
M1 1 1.111 1.111 22.22 0.222 0.111 NA
Central Volcanic
Plateau
M2 1 1.111 1.111 22.22 0.222 0.111 NA
N, number of individuals; NA, number of alleles/locus Ne, number of effective
alleles; (averaged for all markers) %P, percentage polymorphic loci; Ho,
observed heterozygosity; He, expected heterozygosity; and FIS (fixation index)
population mean. * denotes the Waverly population that consisted of both S.
rotundifolia and S. radicans plants. º indicates populations where all
individuals were identical and either all homozygous or all heterozygous for a
given marker. HO and He are calculated including the homozygous markers
but FIS is calculated excluding the homozygous markers resulting in the
discrepancy in FIS value.
3.3.3 Data Analysis
Individuals that had missing data for four or more microsatellite markers were
removed from the data set (six individuals: PLM9, PLM15, PLM18, Mo10, WB16,
and Li10). Data were organised in GenAlEx v6.5 (Peakall and Smouse 2012)
which was used to export data to formats suitable for MSA (Dieringer and
Schlotterer 2003), FSTAT (Goudet 1995), and STRUCTURE (Pritchard et al.
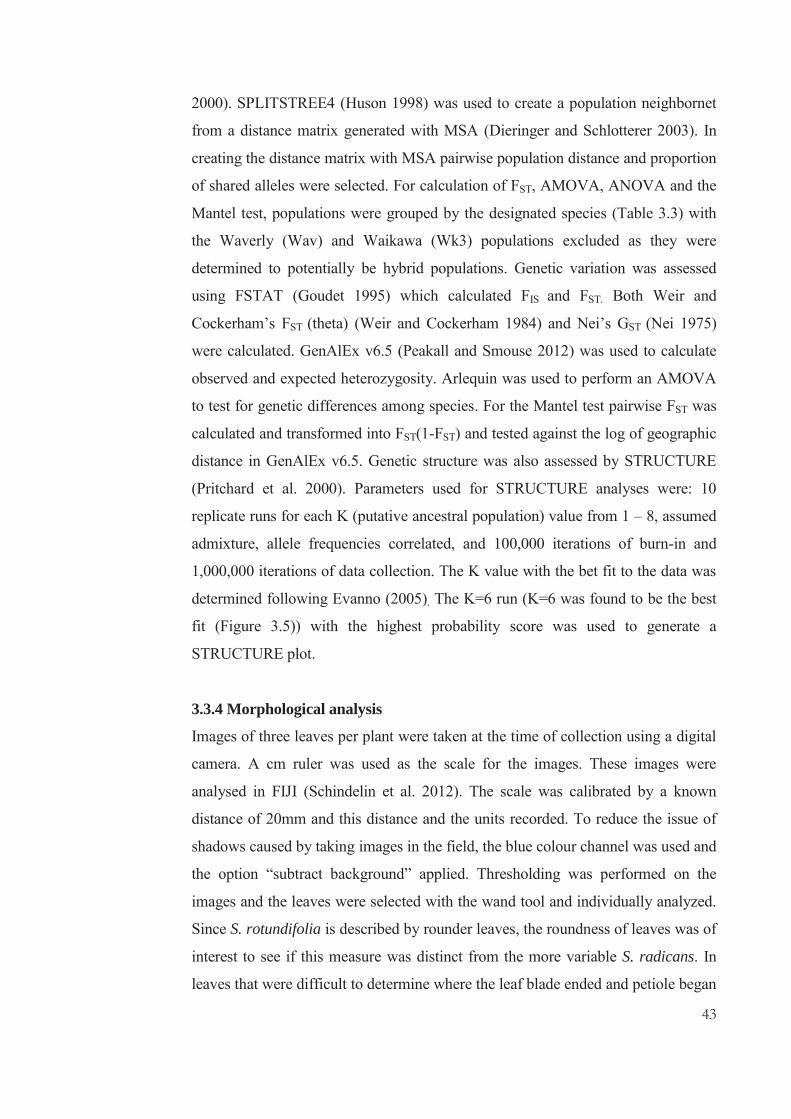
43
2000). SPLITSTREE4 (Huson 1998) was used to create a population neighbornet
from a distance matrix generated with MSA (Dieringer and Schlotterer 2003). In
creating the distance matrix with MSA pairwise population distance and proportion
of shared alleles were selected. For calculation of FST, AMOVA, ANOVA and the
Mantel test, populations were grouped by the designated species (Table 3.3) with
the Waverly (Wav) and Waikawa (Wk3) populations excluded as they were
determined to potentially be hybrid populations. Genetic variation was assessed
using FSTAT (Goudet 1995) which calculated FIS and FST. Both Weir and
Cockerham’s FST (theta) (Weir and Cockerham 1984) and Nei’s GST (Nei 1975)
were calculated. GenAlEx v6.5 (Peakall and Smouse 2012) was used to calculate
observed and expected heterozygosity. Arlequin was used to perform an AMOVA
to test for genetic differences among species. For the Mantel test pairwise FST was
calculated and transformed into FST(1-FST) and tested against the log of geographic
distance in GenAlEx v6.5. Genetic structure was also assessed by STRUCTURE
(Pritchard et al. 2000). Parameters used for STRUCTURE analyses were: 10
replicate runs for each K (putative ancestral population) value from 1 – 8, assumed
admixture, allele frequencies correlated, and 100,000 iterations of burn-in and
1,000,000 iterations of data collection. The K value with the bet fit to the data was
determined following Evanno (2005). The K=6 run (K=6 was found to be the best
fit (Figure 3.5)) with the highest probability score was used to generate a
STRUCTURE plot.
3.3.4 Morphological analysis
Images of three leaves per plant were taken at the time of collection using a digital
camera. A cm ruler was used as the scale for the images. These images were
analysed in FIJI (Schindelin et al. 2012). The scale was calibrated by a known
distance of 20mm and this distance and the units recorded. To reduce the issue of
shadows caused by taking images in the field, the blue colour channel was used and
the option “subtract background” applied. Thresholding was performed on the
images and the leaves were selected with the wand tool and individually analyzed.
Since S. rotundifolia is described by rounder leaves, the roundness of leaves was of
interest to see if this measure was distinct from the more variable S. radicans. In
leaves that were difficult to determine where the leaf blade ended and petiole began

44
the leaves were measured from the top of the leaf to the narrowest point. Leaf
measurements excluded the petiole. Leaves that were damaged, were not lying flat
or leaves that could not undergo thresholding were not analysed. If possible three
leaves were measured per sample and the average roundness score was then used
for the morphology analysis. An ANOVA was performed on the morphology data
using existing species as groups (Table 3.3) with Waverly (Wav) and Waikawa
(Wk) omitted as they are suspected hybrid populations. Frequency data from the
morphology analyses were graphed to assess the shape of the data for further
analysis. Microsoft Excel was used to run a one way ANOVA and to produce the
frequency graphs for morphology analysis. Following the ANOVA, pairwise
species comparisons were made by Tukey’s HSD test using the Harmonic mean for
each comparison. Morphological comparisons of flowers were not made due to the
difficulties of measuring on site, small size of the flowers and absence of flowers in
many populations at the time of collection.
3.4 Results: Nine markers were screened in 612 Selliera individuals. Success rate of marker
amplification ranged from 73 – 100% across individuals (Table 3.2).
Table 3.2: Characteristics of 9 microsatellite markers in Selliera.
Number of alleles (A), size range in bp, observed heterozygosity (Ho), species-
wide expected heterozygosity (Ht), percentage amplification (%) and estimates
of Wright’s fixation index (FIS and FST) for all micorsatellite markers.
Loci A Size range Ho Ht FIS FST % amplification
SR17 4 252 - 258 0.001 0.399 0.980 0.818 99.2
SR31 5 369 - 373 0.181 0.192 -0.345 0.298 99.2
SR45 8 271 - 283 0.356 0.654 -0.053 0.483 99.2
SR37 7 296 - 302 0.102 0.670 0.684 0.519 97.1
SR6 3 208 – 214 0.070 0.135 -0.170 0.556 99.1
SR11 4 182 - 194 0.087 0.246 -0.027 0.790 73.2
SR24 5 203 - 209 0.416 0.726 0.071 0.382 90
SR29 2 397 -399 0.013 0.089 0.739 0.444 98.7
SR13 2 313 - 315 0.122 0.318 0.027 0.604 99.2

45
3.4.1 Genetic variation
Average FIS for all populations was 0.124 however FIS per population varied from
-0.629 to 0.795 (Table 3.1) (excludes populations Wai and KES; see Table 3.1)
with only four populations, all S. radicans, showing a significant heterozygote
excess with negative values. FST for all populations was 0.525 showing a high
degree of differentiation between populations. All currently described species also
had high FST values (Table 3.3) indicating populations within the species have a
high degree of differentiation.
Table 3.3. F statistics of populations for species not including hybrid
populations and for all populations. Populations are grouped into the
currently described species and Nei’s Gst and Weir and Cockerham’s are
reported for each of the species and for all populations combined.
Species Populations Nei’s
Gst
W-C
S. microphylla M1,M2,NT,WD 0.477 0.563
S. rotundifolia HA, HB, HC KP, Ma 0.441 0.497
S. radicans CP, CSP, MAK, Otk, Wai,
EST, KES, Na, Oh, Tw, WB,
Wri, Mo, TB, PLM, HOB, Li,
Pat, Prm, OPE, Br,
0.434 0.453
All All populations 0.516 0.525
AMOVA suggests that 25.41 percent of the variation occurs between the currently
described species while 37.49 percent occurs among populations within species and
37.10 percent of the variation occurs within populations (Table 3.4), indicating
there is greater variation within species than between species. Mantel tests suggest
there is isolation by distance for both Selliera microphylla and Selliera rotundifolia,
although it is not significant in Selliera microphylla (Table 3.5) likely due to the

46
Selliera radicans y = 0.0051x + 1.135R2 = 1E-05
0.000
5.000
10.000
15.000
20.000
-1.000 0.000 1.000 2.000 3.000 4.000 5.000 6.000 7.000 8.000
log(geographic)
Fst(1
-Fst
)
Selliera rotundifolia y = 1.1869x - 0.5913R2 = 0.3564
-2.000-1.0000.0001.0002.0003.0004.0005.0006.000
0 1 1 2 2 3
Log(geographic)
Fst(1
-Fst
)
Selliera microphylla y = 0.1034x + 0.7058R2 = 0.074
0.000
0.500
1.000
1.500
2.000
2.500
0.000 1.000 2.000 3.000 4.000 5.000 6.000 7.000 8.000
log (geographic)
Fst(1
-Fst
)
West Coast S. radicans y = -0.0033x + 0.2877R2 = 0.0002
0.000
0.200
0.400
0.600
0.800
1.000
1.200
-1.000 0.000 1.000 2.000 3.000 4.000 5.000
log(geographic)
Fst(1
-Fst
)
small sample size. The same test indicates that there is no correlation between
genetic distance and geographic distance Selliera radicans (Figure 3.3).
Table 3.4. AMOVA results for Selliera species, including the degrees of
freedom (d.f), sum of squares, variance components and percentage variation.
p < 0.01.
Source of Variation d. f. Sum of
Squares
Variance
components
Percentage
of variation
Among species 2
223.239 0.34914 Va 25.41
Among populations
within species
28 535.993 0.51520 Vb 37.49
Within populations 1097 559.207 0.50976 Vc 37.10
Total 1127 1318.439 1.37410
Figure 3.3 Mantel test results displayed in graphs of log(geographic distance) against FST(1-FST) for each of the species in Selliera, S. microphylla, S. rotundifolia and S. radicans. S. rotundifolia and S. microphylla both show a positive correlation between geographic distance and genetic distance. A mantel test for population of S. radicans along the described range of S. rotundifolia (West Coast S. radicans) was also performed but no correlation was observed in either analyses for S. radicans.

47
Table 3.5 Mantel test results. Rxy and p values for each of the species are
reported.
Rxy = correlation coefficient of the Mantel test. P(rxy-rand >= rxy-data) = the
probability of a positive autocorrelation (one tailed t test).
3.4.2 Morphological analysis
A one way ANOVA was used to test for a significant difference in leaf morphology
among the three species as described in Table 3.3. Leaf morphology differed
significantly between the three species, F (2, 382) = 452.6793, p < 0.001. S.
rotundifolia and S. radicans both show a normal distribution and are mostly distinct
with a small overlap whereas S. microphylla leaf morphology falls within the upper
range of S. radicans (Figure 3.4). Waverly is a site where hybridization is
suspected between S. radicans and S. rotundifolia; individuals at Waverly show a
range in leaf morphology spanning from S. radicans and S. rotundifolia (Figure
3.4). Waikawa is another site of sympatry for S. rotundifolia and S. radicans where
hybridization may occur but no hybrid morphologies were found with a clear
distinction in morphology between the species (Figure 3.6).
Species Rxy p (rxy-rand >= rxy-
data)
S. microphylla 0.272 0.238
S. rotundifolia 0.597 0.002
S. radicans 0.004 0.490
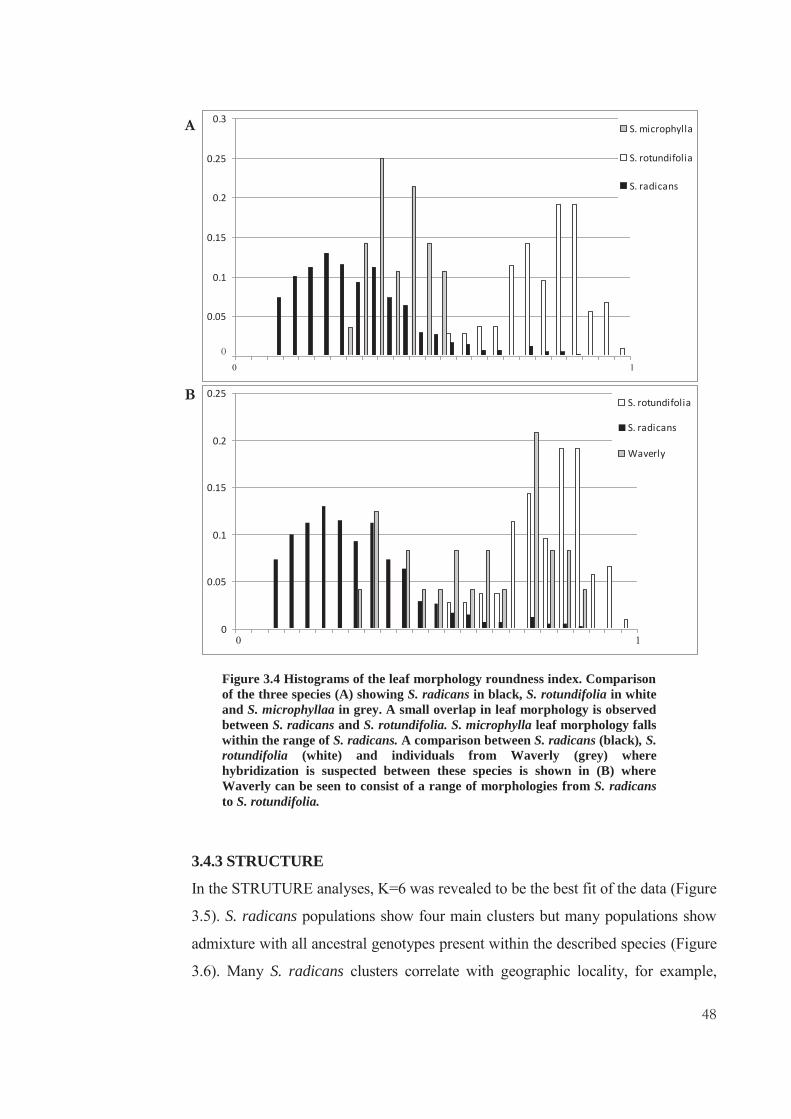
48
3.4.3 STRUCTURE
In the STRUTURE analyses, K=6 was revealed to be the best fit of the data (Figure
3.5). S. radicans populations show four main clusters but many populations show
admixture with all ancestral genotypes present within the described species (Figure
3.6). Many S. radicans clusters correlate with geographic locality, for example,
Figure 3.4 Histograms of the leaf morphology roundness index. Comparison of the three species (A) showing S. radicans in black, S. rotundifolia in white and S. microphyllaa in grey. A small overlap in leaf morphology is observed between S. radicans and S. rotundifolia. S. microphylla leaf morphology falls within the range of S. radicans. A comparison between S. radicans (black), S. rotundifolia (white) and individuals from Waverly (grey) where hybridization is suspected between these species is shown in (B) where Waverly can be seen to consist of a range of morphologies from S. radicans to S. rotundifolia.
B
A
0
0.05
0.1
0.15
0.2
0.25
1 2 3 4 5 6 7 8 9 10 11 12 13 14 15 16 17 18 19 20 21 22 23 24 25
S. rotundifolia
S. radicans
Waverly
0
0.05
0.1
0.15
0.2
0.25
0.3
1 2 3 4 5 6 7 8 9 10 11 12 13 14 15 16 17 18 19 20 21 22 23 24 25
S. microphylla
S. rotundifolia
S. radicans
0 0 1
0 1

49
Ohope (OPE) and Ohiwa (Oh) cluster which are both North Island populations
collected from the Bay of Plenty (Figure 3.2) But often the clusters in
STRUCTURE for S. radicans do not correlate with geographic location where
populations from the North Island may cluster with South Island populations and
not populations geographically closer to them, for example Ohope (OPE) and
Ohiwa (Oh) also cluster with the South Island populations Tunnel Beach (TB) and
Dunedin (EST). In another example, from the North Island populations, Cape
Palliser (CP) clusters with Napier (Na), and Plimmerton (PLM) but not Makara
(MAK) or Castlepoint (CSP) which are geographically closer. Many of the S.
radicans populations cluster with some populations described as S. microphylla or
S. rotundifolia suggesting these species may have originated from those
populations. The population WB from Tauranga revealed a clear genetic distinction
between the first and second halves of the population suggesting a lack of gene
flow between these individuals within this population.
ΔK vs K
05
10152025303540
0 2 4 6 8 10
K
Δ K
Figure 3.5 Plot of ΔK vs K for STRUCTURE results following Evanno (2005). K = 6 was the best fit to describe the data. Results are based on 10 replicates for each K value.

50
Populations that have been described as Selliera microphylla show two genetic
clusters, one made up of the populations from the central volcanic plateau (NT/M1)
which clusters with several S. radicans populations while the other forms the South
Island populations of S. microphylla collected from West Dome (WD) near the
Eyre Mountains. The West Dome populations only cluster with one other
population, Tiwai Point (Tw), which is the most proximal S. radicans population
collected. Populations from Selliera rotundifolia also show two genetic clusters
(Figure 3.6). The three Himatangi (H) populations cluster together along with the
Waikawa round leaved population (WK2) and S. radicans from Castlepoint (CSP).
The second cluster consists of populations Kaupokonui (KP) and Manutahi (Ma)
found north of Himatangi which also cluster with many other S. radicans
populations.
The Waverly (Wav) population, which consists of sympatric S. rotundifolia, and S.
radicans individuals, has genotypes representing both species. This is consistent
with the range in leaf morphology, both of which support hybridization at this site.
The Waikawa (Wk) population is another population where S. radicans and S.
rotundifolia grow in sympatry. An additional S. radicans estuary population also
was collected at this site. The S. rotundifolia individuals at Waikawa mostly cluster
with other S. rotundifolia populations from Himatangi (H). S. radicans growing
sympatrically, and at the estuary, consist of genotypes from S. radicans and a small
percentage of S. rotundifolia genotype.

51
3.4.4 NEIGHBORNET
Patterns similar to those identified in the STRUCTURE analyses were observed in
the population-level Neighbor-Net (Figure 3.7). S. microphylla populations show
the same distinct groupings. The West Dome (WD) populations cluster together
and are most closely related to Tiwai Point (Tw). The Central Volcanic Plateau S.
microphylla populations (NT) are placed next to the West Dome populations
meaning the S. microphylla populations appear to cluster together although the
Central Volcanic Plateau population also clusters with other S. radicans
populations. This is further considered in the discussion.
Wav
erly
Castl
epoi
nt
Wai
kaw
a S.
ra
dica
ns
Figure 3.6 STRUCTURE cluster assignment and morphology score for individuals in Selliera. A, K=6 STRUCTURE cluster plot for Selliera individuals grouped by current species descriptions. Two genetic clusters can be observed in both S. rotundifolia and S. microphylla. S. radicans consists of four main clusters although all genotypes are present in this species. B, morphology score for individuals corresponding to STRUCTURE. Morphology data for two populations was not collected, Pat and Wri. M1 and M2 individuals (not labelled) are the last two individuals next to the NT population.
S. rotundifolia S. radicans S. microphylla
A
B

52
S. rotundifolia populations also are positioned near each other but show two main
clusters. The first is a cluster with the Himitangi populations (H), round leaved
Waikawa (Wk2), Castlepoint (CSP) and some S. radicans populations (Wk1, Wk3
and Mo) which is the same pattern observed in STRUCTURE. The second main
cluster consists of Kaupokonui (KP) and Manutahi (Ma) which is also observed in
the STRUCTURE results. KP/Ma is also closely related to several other S. radicans
populations.
S. radicans populations do not form a single cluster in the NEIGHBORNET with
many populations of S. radicans more closely related to the other described species
in Selliera. However, many of the clusters observed in STRUCTURE are also
present in the NEIGHBORNET. The sympatric site of S. radicans and S.
rotundifolia, Waverly (Wav), is not clustered with any other populations possibly
due to hybridization at this site. Waikawa individuals, from the other sympatric
population, are closely related to the Himatangi cluster although the Waikawa
round leaved population (Wk2) is distinct from the S. radicans populations at
Waikawa (Wk1 and Wk3) which are more closely related to an S. radicans
population (Mo).
53
Figure 3.7 Neighbornet based on pairwise genetic distances between all populations of all Selliera species. The neighbornet was generated in SPLITSTREE4. S. rotundifolia population lineages observed in STRUCTURE are indicated by the green and purple circles and S. microphylla population lineages observed in STRCUTRE are identified by the red and blue circles. Populations Wk2 and WB were each split into two groups, Wka, Wkb, Wb1 and Wb2 respectively, due to the distinct genotypes observed in STRCUTURE in each of these populations.

54
3.5 Discussion: Species delimitation is an important but difficult task in biology (Birky et al. 2010).
While most agree that species can be defined as lineages that are separately
evolving from other such lineages (Wiens 2007), identifying these lineages can be
problematic. Hybridization, polyploidy, introgression and incomplete lineage
sorting are examples of biological processes that increase the difficulty of species
delimitation particularly in plants where these processes can occur frequently
(Wendel 2000; Whitney et al. 2010) and instances where speciation processes have
not had time to complete such as younger islands (Whittaker et al. 2007).
Furthermore, both local adaptation and random genetic drift (Williams 1966) can
result in divergent populations within a species, so among the difficulties is
distinguishing between intraspecific and interspecific variation. Natural selection,
geographic isolation and gene flow, which influence the genetic structure of
populations, are often described as the driving forces of speciation (Harrison 2012).
As these forces act at the population level a population genetic approach, which
examines the genetic structure of populations, may aid in species delimitation
especially in closely related species where speciation processes may not be
complete.
An example of a genus where species delimitation has been difficult is Selliera, a
genus in the Goodeniaceae. There have not been many population genetic studies
performed within the Goodeniaceae. One study on Scaevola hainanensis Hance.
(Goodeniaceae) revealed low levels of genetic differentiation (GST = 0.172)
between the study sites indicating gene flow between sites was likely high (Ho et
al., 2005). Only 6 of 233 ISSR bands were polymorphic indicating low genetic
diversity overall however S. hainanensis is an endangered species and was
restricted to a small site of less than 1ha. Another study on Scaevola plumieri Vahl.
(Goodeniaceae) used ISSR markers to investigate population structure. S. plumieri
is a primary dune coloniser from southern Africa, described as a small shrub which
can be propagated by seed, sprawling stems and stem cuttings, similar to
propagation in Selliera. They revealed high differentiation between populations and
concluded individual isolated dunes usually contained individual plants or clones
but sexual reproduction occurred between populations and dunes (Barker, Harman,
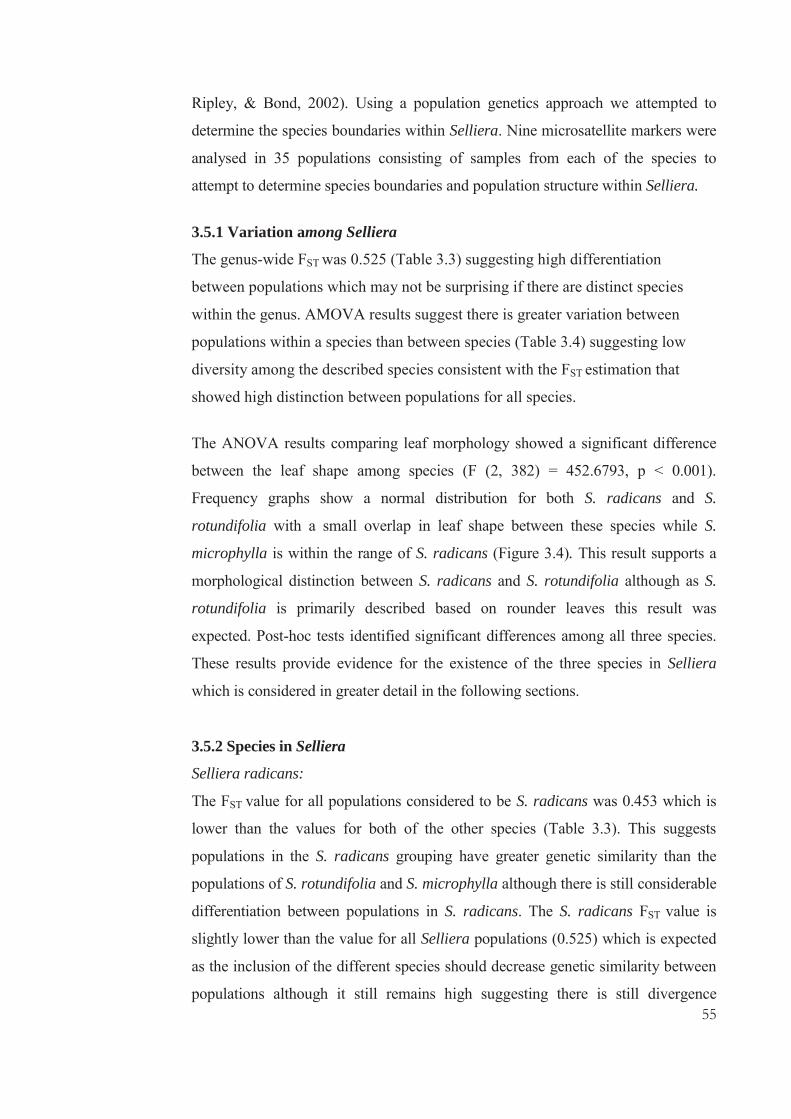
55
Ripley, & Bond, 2002). Using a population genetics approach we attempted to
determine the species boundaries within Selliera. Nine microsatellite markers were
analysed in 35 populations consisting of samples from each of the species to
attempt to determine species boundaries and population structure within Selliera.
3.5.1 Variation among Selliera
The genus-wide FST was 0.525 (Table 3.3) suggesting high differentiation
between populations which may not be surprising if there are distinct species
within the genus. AMOVA results suggest there is greater variation between
populations within a species than between species (Table 3.4) suggesting low
diversity among the described species consistent with the FST estimation that
showed high distinction between populations for all species.
The ANOVA results comparing leaf morphology showed a significant difference
between the leaf shape among species (F (2, 382) = 452.6793, p < 0.001).
Frequency graphs show a normal distribution for both S. radicans and S.
rotundifolia with a small overlap in leaf shape between these species while S.
microphylla is within the range of S. radicans (Figure 3.4). This result supports a
morphological distinction between S. radicans and S. rotundifolia although as S.
rotundifolia is primarily described based on rounder leaves this result was
expected. Post-hoc tests identified significant differences among all three species.
These results provide evidence for the existence of the three species in Selliera
which is considered in greater detail in the following sections.
3.5.2 Species in Selliera
Selliera radicans:
The FST value for all populations considered to be S. radicans was 0.453 which is
lower than the values for both of the other species (Table 3.3). This suggests
populations in the S. radicans grouping have greater genetic similarity than the
populations of S. rotundifolia and S. microphylla although there is still considerable
differentiation between populations in S. radicans. The S. radicans FST value is
slightly lower than the value for all Selliera populations (0.525) which is expected
as the inclusion of the different species should decrease genetic similarity between
populations although it still remains high suggesting there is still divergence

56
between some populations within S. radicans. Species with large geographic
ranges, such as S. radicans, are expected to maintain genetic diversity so they
would have higher FST values than species in more restricted ranges (Hamrick &
Godt, 1996).
The Mantel test was performed on each of the species separately (Figure 3.4) and
suggests no isolation by distance for S. radicans (Table 3.5). Theoretical research
has suggested that founder effects will likely lead to greater differentiation
between populations (Slatkin 1977; Wade and McCauley 1988) where differences
between populations can be a result of colonization history rather than migration
or selection. This situation has been observed in several field and laboratory trials
(Kolbe et al. 2012; Moya et al. 1995; Travisano et al. 1995) and has been
suggested to be the cause of population differentiation in an island bird species
Anthus berthelotii (Motacillidae) where genetic structure within the species was
not consistent with isolation by distance or adaptation (Spurgin et al. 2014). The
lack of isolation by distance in S. radicans may be caused by colonization history
where population differentiation is based on the ancestral coloniser resulting in
geographically close populations highly differentiated due to different
colonization events. This founder effect and restricted gene flow between
populations could result in speciation through adaptation to different habitats
although founder effects do not necessarily result in speciation (Moya et al.
1995). A lack of gene flow between close populations or gene flow over large
distances may also increase genetic distance and explain the lack of isolation by
distance.
Gene flow over large distances could be explained by pollinator movement
which, in Selliera, is thought to be a species of Diptera (Cheeseman 1876).
Sitodiplosis mosellana Gehin. (Diptera: Cecidomyiidae) has been observed to
travel distances up to 195 Km, suggesting long distance pollen dispersal may be
possible although it is not known if this is a mechanism for pollen dispersal in
Selliera. Gene flow over a large distance could also be due to sea currents as S.
radicans habitat is coastal and seeds could be dispersed by the sea allowing long
distance dispersal. Selliera seeds have no significant mortality after treatment in a

57
saline solution (Partridge and Wilson, 1987) indicating survival in salt water may
be possible. Seed dispersal by sea currents was shown to allow gene flow
between populations of Cakile maritima Scop. (Brassicaceae), which had no
evidence of isolation by distance, and showed that seed buoyancy was important
in allowing dispersal and survival of seeds (Gandour, et al. 2008) which has not
been assessed in Selliera. There is a greater amount of admixture between the S.
radicans populations than in the other described species (Figure 3.6).
STRUCTURE showed a value of K=6 to best describe the data (Figure 3.5) with
all six ancestral genotypes present in S. radicans populations which indicates that
the other species may have evolved from S. radicans. This result might also
suggest that divergence of the other species is relatively recent.
There are four main genetic clusters within S. radicans populations. One of these
clusters consists of two Auckland populations, HOB and Li, and half the population
at Tauranga (WB). The Tauranga population revealed an interesting pattern with a
clear distinction between the first half of samples from the population and the
second half. This can be explained by the distribution of individuals within this site
which consists of two separate areas. The first area of samples was taken from a
muddy estuarine area around a small drain, while the second half of samples were
taken from a grassy bank next to the estuary. The spacing between these two areas
is ~10 meters. The distinct genotypes found within this population suggest there is
a lack of gene flow between these sites within this population despite the small
geographic distance. This could be due to selection pressures in the different
environments at this site selecting for certain genotypes that confer an advantage to
the plants in that environment, for example, flood tolerance or soil composition
differences between the muddy estuary and the grassy bank. However it is possible
gene flow is resticted at this site through other means, such as a lack of pollinators,
as it is next to an inhabited area in the city which may deter insects.
A cluster of three S. radicans populations, Cape Palliser (CP), Napier (Na) and
Plimmerton (PLM) show almost no evidence of gene flow with other populations.
These populations are not geographically close, with CP found at the lower eastern

58
North Island, Na on the East Coast and PLM on the West Coast of the North Island,
but there is evidence of some gene flow to other populations from these three. Why
these three geographically distant populations cluster together is not clear, although
it may be a result of colonization history as suggested in other systems (Kolbe et al.
2012; Spurgin et al. 2014). The lack of genotypes from nearby populations suggests
lack of gene flow although Na and PLM have significant negative FIS values, -
0.629 and -0.280 repectively, (Table 3.1) indicating heterozygote excess within the
populations. Another obvious cluster of S. radicans populations is Ohiwa (Oh) and
Ohope (OPE) which also show no evidence of gene flow from other populations.
Oh also has a significant negative FIS value of -0.629 suggesting a heterozygote
excess in this population, but as these populations are geographically close it is
possible gene flow occurs between them. Negative FIS values can also be attributed
to gene flow, selection for heterozygotes, increased genetic drift in small
populations or marker error.
Selliera radicans is known to be highly polymorphic in leaf shape but S.
rotundifolia is described primarily based on leaf shape; specifically, a rounder leaf
shape with the apex and base obtuse (Heenan 1997). Morphological analysis on
leaf roundness reflects this polymorphic leaf shape in S. radicans (Figure 3.6) and
shows a small overlap between the leaf morphology of S. rotundifolia and S.
radicans (Figure 3.4), but reveals a distinction between the two species. The likely
hybrid population, Waverly (Wav), does contain a range in morphology between
the ‘typical’ S. radicans and S. rotundifolia forms, which is consistent with the
range of genotypes (Figure 3.6) suggesting hybridization occurs at this site. This is
in stark contrast with the Waikawa (WK) site where these two species also occur.
There are essentially two distinct classes of leaf morphology (S. radicans-like, Wk1
and 3, and S. rotundifolia-like, Wk2) at Waikawa (Figure 3.6), although there is
evidence of introgression from S. rotundifolia into S. radicans suggesting
hybridization has occurred in the past. These sites are discussed further in the
section on hybridization.

59
Selliera rotundifolia:
Populations described as Selliera rotundifolia form two distinct clusters in both the
Neighbornet and STRUCTURE results (Figure 3.6 and 3.7), suggesting that the
species may not be monophyletic. These clusters each also cluster with different S.
radicans populations. The FST value for S. rotundifolia is 0.497 indicating
populations are distinct from each other which supports the distinct genetic clusters
of S. rotundifolia seen in the different analyses. This suggests there may have been
multiple origins, at least two, of round leaves appearing in S. rotundifolia which,
under the lineage species concept, may not accept these different lineages as one
species. Alternatively, these two lineages may have resulted from isolation of
populations from a single origin of S. rotundifolia leading to divergence due to lack
of gene flow between populations, but this is unlikely as each lineage shows a
closer relationship with different S. radicans populations indicating round leaves
has arisen multiple times. The Mantel test suggests a positive relationship in S.
rotundifolia (Figure 3.3) which may be a result of the two clusters within this
species (Figure 3.6) which are geographically distinct from each other.
Currently, S. rotundifolia has been described as endemic to the lower western
North Island (Heenan 1997) which is where all round-leaved populations occur.
However, a population on the East Coast of the lower North Island, Castlepoint
(CSP), also clusters with the Himatangi/Waikawa grouping of S. rotundifolia in
both the Neighbornet and STRUCTURE results (Figures 3.6 and 3.7). The results
of the morphological analysis show that Castlepoint individuals do not have as
strongly rounded leaves as those of other S. rotundifolia populations, but they are at
the top end of the measurements for S. radicans samples. STRUCTURE reveals
genotypes from both S. rotundifolia and S. radicans in the Castlepoint samples,
suggesting this may be a population where hybridization has occurred between
species although this will need to be investigated in more detail. The KP/Ma S.
rotundifolia grouping clusters with many S. radicans species in STRUCTURE
(Figure 3.6) and is more closely related to some of the same S. radicans
populations than the other S. rotundifolia populations in the Neighbor-net (Figure
3.7), indicating a distinct origin for rounder leaves in this group.

60
The shape of leaves in Selliera may not be a suitable method to describe species, as
round leaves appears to have multiple origins. Matching the current geographic
distribution of S. rotundifolia, round-leaved plants were located in the lower
western North Island and so far no other locations have produced similarly shaped
round leaves. While it is documented that the round leaf morphology is genetically
determined (Ogden 1974), it is unknown whether the genetic variation for
roundness only occurs in the southwest region of the North Island.
There are only two sampled sites where S. rotundifolia and S. radicans are clearly
sympatric, Waverly and Waikawa. At Waverly, the morphology indicates there is a
range of hybrid morphologies from round-leaved plants to more elongated,
spatulate leaves. This can also be observed in the STRUCTURE results where there
is a range in the percentage of genotype from each species (Figure 3.6), indicating
there is gene flow between these species. The range of morphology suggests leaf
shape is controlled by multiple genes. The S. radicans genotype at Waverly clusters
with the more northern populations of S. radicans (HOB/Li/WB) and both S.
rotundifolia genotypes are present, which may suggest hybridization between these
distinct lineages is possible, possibly supporting the two S. rotundifolia lineages
considered as a single species.
At Waikawa, morphology does not show a gradient between the distinct
morphologies of S. rotundifolia and S. radicans plants that are completely
interspersed (Figure 3.6). The round-leaved S. rotundifolia plants of Waikawa
(WK2) mostly cluster with the Himatangi S. rotundifolia grouping and appear to be
reproductively isolated from the sympatric S. radicans as there is no evidence of
gene flow despite complete sympatry. The sympatric S. radicans population,
despite having typical S. radicans leaf morphology, shows possible gene flow from
S. rotundifolia. STRUCTURE results reveal that this population contains genotypes
mostly from S. radicans but also contains some S. rotundifolia genotypes. The low
degree of similarity to the sympatric S. rotundifolia and the S. radicans-like
morphology indicate there may be introgression occurring from S. rotundifolia into
S. radicans although this needs further study. Further, there is evidence of a low
level of gene flow with the estuary population of S. radicans at the Waikawa site

61
(Wk1), which is not sympatric with the other Waikawa populations, suggesting
possible hybridization with S. rotundifolia or the sympatric S. radicans.
As the Waikawa round-leaved population (Wk2) clusters with the Himatangi S.
rotundifolia grouping (HA/HB/HC), which is fairly distinct from most S. radicans
populations (Figure 3.7), it may be more distant from S. radicans and so may have
evolved reproductive barriers with S. radicans at Waikawa. Reproductive isolation
would indicate a species under the general lineage concept as they would form
distinct lineages if gene flow is resticted, however more research on this would be
needed especially crossing experiments to see if populations are indeed
reproductively isolated. There are other possibilities for why hybridization occurs
differently at the Waverley and Waikawa sites such as pollinator preference where
pollinators may prefer flowers that resemble the parent so can be a barrier to reduce
gene flow; however in Selliera the flowers are indistinguishable among the
described species, differing only slightly in size (Heenan 1997) so pollinator
preference is unlikely to play a significant role.
The rounder leaves of S. rotundifolia may not confer any significant advantage to
the plant in the dune habitat, but may be pleiotropic with traits that are under
selection or linked to genes that do give an advantage to the plants, for example
genes that aid water stress as water may not be as easily available in a dune
environment compared to an estuary environment. Linanthus parryae
(Polemoniaceae) is an example of a species with an obvious morphological
polymorphism linked to a more cryptic variable trait under strong selection. L.
parryae has two flower colour morphs, blue and white, which differ in frequency in
different populations. Initially this was thought to be the effect of random genetic
drift (Wright 1943), but later studies showed that natural selection appeared to be
the driving force in maintaining the flower colour polymorphism as the soil types
differed between regions. The authors suggested a pleiotropic effect where
differential cation uptake by the different flower morphs was the mechanism of
selection (Schemske and Bierzychudek 2007).

62
Selliera microphylla:
As currently described, S. microphylla is found on the Central Volcanic Plateau in
the North Island and the Eyre mountains in the South Island. FIS for all populations
was positive (Table 3.1) indicating significant homozygote excess. Significant
homozygote excess is likely a result of inbreeding, reducing the amount of
heterozygotes in the population (Wright 1951), especially as Selliera can form
large mats and spread clonally. However, small population sizes or null alleles can
also result in a high level of homozygosity. Inbreeding is particularly an issue in
geographically isolated populations where gene flow with other populations is not
possible, such as in S. microphylla. Consequently, this high homozygosity in S.
microphylla is expected as gene flow between the North and South Island
populations or with other Selliera species is unlikely and the geographically
isolated nature of these populations from other Selliera populations may promote
inbreeding. Unsurprisingly, FST for S. microphylla populations was the highest of
the three species at 0.563 suggesting S. microphylla populations are strongly
genetically differentiated from each other. A positive relationship was observed in
the Mantel test for S. microphylla (Figure 3.3) but was not significant (Table 3.5)
likely due to the smaller sample size.
This lack of gene flow and distinct population structure within S. microphylla was
seen in the STRUCTURE results and Neighbour-net which revealed two clusters
for S. microphylla one including populations from the North Island and one for the
South Island populations (Figures 3.6 and 3.7). The North Island S. microphylla
populations cluster with Oh/OPE and a few individuals also cluster with the
CP/Na/PLM cluster. Tiwai Point (Tw) is the only S. radicans population that
contains any genotypes from the South Island S. microphylla; Tw is the closest
known S. radicans population to the Eyre Mountain S. microphylla populations. In
the Neighbor-net the S. microphylla populations form a cluster, but each is also
more closely related to S. radicans populations than each other; the STRUCTURE
results support this, showing the North Island and South Island S. microphylla
samples to be unique. The apparent clustering of all S. microphylla in the
Neighbor-Net is likely due to a long branch attraction (Bryant and Moulton 2004)
anomaly more than biological reality. The high differentiation between populations

63
of S. microphylla and closer relationship to S. radicans populations that are
geographically proximal indicate separate colonisations of S. radicans into the
mountain habitat rather than a single species of mountain Selliera that has spread
throughout the islands. As these populations are isolated from the other coastal
populations of S. radicans they may continue to diverge and could potentially form
new species, but there is no evidence to cluster the North and South Island S.
microphylla as a single species. The shared smaller size difference may be due to
the environmental conditions of the mountains, given that plants are usually smaller
at higher altitudes (Billings and Mooney 1968) and S. microphylla plants revert to a
similar morphology to S. radicans when grown in the same habitat (De Lange
2012a and K Pilkington personal observe.) suggesting habitat differences cause the
shared morphology in the currently described S. microphylla.
As the South Island populations have the same chromosome number as S. radicans,
2n=16 (Murray and de Lange 2013), they likely are an inland population of S.
radicans although further experiments on reproductive isolation may be helpful to
understand if these populations can still reproduce with other S. radicans
populations, particularly as they appear highly genetically distinct from most
populations in Selliera. These populations have low heterozygosity (Table 3.1) and
with geographic isolation from other populations could suffer from inbreeding
depression affecting their future. North Island populations of S. microphylla have
shown a single chromosome count of 2n=56 (Murray and de Lange 2013), much
higher than the 2n=16 of S. radicans indicating these plants have undergone
polyploidy. In Tasmania there has been a report of 2n=48 (Jackson 1958) for S.
radicans, which was found in the same location as the diploid, suggesting that
polyploidy has occurred in this species in other sites, although in New Zealand only
Selliera microphylla in the North Island has revealed a higher chromosome number
so far.
In Arabidopsis Heynh. the frequency of diploid male gamete production increased
in periods of cold stress (De Storme et al. 2012) and cold shock is known to result
in polyploidy, not only in plants (Wang et al. 2010), but also in fish (Donaldson et
al. 2008) and shrimp (Wood et al. 2011). The higher altitudes which harbour colder

64
temperatures may facilitate the production of unreduced gametes and therefore
result in polyploidy which may be a factor of the increase in chromosome number
in Selliera microphylla. Analysis of Artic plants showed that at least 40% of these
plants were polyploid and this frequency increased further northwards (Brochmann
et al. 2004) where the temperature is colder and where plants likely experience cold
shock. It is also possible that polyploidy increases the survival chances of plants at
higher altitudes and is a result of adaptation to the environment. Induced tetraploids
of Dendranthema nankingense (DC.) Des Moul. (Asteraceae) showed increased
tolerance to cold, drought and salinity stress compared to the diploids (Liu et al.
2011) indicating these polyploids had a greater potential to survive in more extreme
environments.
As the mountain habitat is vastly different to the coastal habitat of Selliera the
potential to adapt to the differing conditions would give an advantage to plants
growing there and increase the capacity for divergence into a distinctly evolving
lineage. Due to the large difference in chromosome number, it is unlikely that the
Volcanic Plateau Selliera plants could reproduce with other S. radicans
populations, although this still needs to be investigated further with crossing
experiments. However, the strong genetic divergence, increased chromosome
number, and geographic isolation of this population support the North Island S.
microphylla be maintained as a distinct species.
Species delimitation in Selliera remains difficult, however this study has revealed
evidence for each of the described species, although with modified boundaries. We
suggest that the S. microphylla name is maintained for the North Island volcanic
plateau populations, but the South Island Eyre Mountain populations be named a
variant of S. radicans. While the South Island populations are genetically distinct
and are unlikely to experience gene flow with any other Selliera populations, there
is currently no evidence for reproductive isolation. There is evidence that S.
rotundifolia is reproductively isolated from S. radicans at one site of sympatry
suggesting that this is a distinct species. However, two lineages were identified
within the currently described S. rotundifolia suggesting not all round-leaved plants
may be considered a single species under the general lineage concept but possible

65
evidence of gene flow between these lineages was observed at Waverly but needs
further investigation. It appears as though there may be multiple origins of S.
rotundifolia and there is some variation in the completeness of the speciation
process among sites and potentially among origins.
3.5.3 Hybridization and introgression in Selliera
Hybridization between different species is not uncommon and has the potential to
dissolve the barriers between species. Whitney et al (2010) found hybridization in
40% of the plant families they studied, although these were in only about 16% of
genera surveyed, indicating hybridization is common but not pervasive. However,
the estimation of hybridization frequency in this study may underestimate the
actual number, because many species cannot be inspected throughout their range so
many hybrids may not be documented and hybrids may not be suspected if the
parental species are not obvious, for example the parental species have become
extinct (Whitney et al. 2010). If hybrid offspring are infertile, this results in a
barrier to gene flow as wasted reproductive effort, which may be a significant loss
for endangered species. Alternatively, hybrids may be able to survive in
environments that are less suited to the parents so inhabit a different niche (Kunte
et al. 2011; Mao and Wang 2011) or are selected against (Vamosi and Schluter
1999) allowing the parental species to remain distinct especially if the parents are
more successful in the original habitat. Hybridization accompanying polyploidy
may also allow expansion into new niches or habitats relative to the parents
(Ramsey and Schemske 1998) although most initial hybrids are morphological
intermediates of the parental species. Hybrids can also result in extinction of one or
both of the parental species if they out-compete the parents (Hegde et al. 2006). In
New Zealand hybridization has played an important role in the evolution of many
endemic species, both plant and animal. Additionally many distinct species remain
able to hybridise, resulting in low levels of gene flow, but still maintain their
distinctive lineages (Morgan-Richards et al. 2009).
Within Selliera there are two locations where both S. rotundifolia and S. radicans
are currently found growing sympatrically, Waverly and Waikawa. At these sites
there is the possibility for hybridization between these two species. At Waverly the

66
morphology of leaf roundness shows a range from round leaves, like that of S.
rotundifolia, to elongated leaves, similar to those of S. radicans, with various
intermediate forms indicating hybridization is occurring and producing
intermediate leaf shapes. The range in leaf morphology is mirrored by the
genotypes in the STRUCTURE results (Figure 3.6) indicating there is gene flow
between S. rotundifolia and S. radicans. Hybridization between these two species,
at Waverly, indicates they have not yet evolved reproductive isolation but does not
necessarily mean they are not distinct species. Hybrid infertility or forces that
maintain the genetic lineage of the parental species despite hybridization can allow
a species to maintain its lineage and therefore remain distinct despite hybridization.
In New Zealand at least 19 hybridization events between endemic species have
been observed where the parental species maintain themselves as distinct species
(Morgan-Richards et al. 2009). Further testing of hybrid individuals at Waverly
may indicate whether hybrids are able to backcross with one or both parents and
provide further insights into reproductive barriers between Selliera species.
For the two species to remain distinct at Waverly, the hybrids would need to be
infertile to prevent backcrossing with the parental species. Alternatively, selection
pressures on the hybrids that prevent them from inhabiting the preferred habitat of
the parental species may allow the parental species to remain distinct. If the hybrids
can backcross with the parents, introgression may allow them to expand into the
parental habitat. Further, if the hybrids are more successful than the parents, then
they may out-compete them and cause extinction of the parental species at Waverly
or dissolve the boundaries between the parental species by forming a hybrid
swarm.
At Waikawa there also are two distinct morphologies which are completely
interspersed, round leaves and more elongated leaves that fall in the range of S.
radicans but no intermediate morphology, so it appears that hybridization is not
occurring between these species. However, genetic analyses indicate that
hybridization may have occurred in the past as the S. radicans like plants show
evidence of some gene flow from the S. rotundifolia plants. Genetic analyses for S.
rotundifolia show no evidence of hybridization with S. radicans suggesting that at

67
this site gene flow from S. radicans to S. rotundifolia is no longer possible and S.
rotundifolia may have evolved a reproductive isolating mechanism. This suggests
that reproductive isolation may be preventing S. rotundifolia from crossing with S.
radicans which would be evidence that they are distinct lineages and so distinct
species. The estuary population at Waikawa (Wk1), which is not sympatric with the
other Waikawa populations, shows some evidence of gene flow with S. rotundifolia
but contains typical S. radicans morphology and could be the parental S. radicans
population which may be able to cross with the dune S. radicans hybrids. It is
possible that there is gene flow from S. rotundifolia to S. radicans directly but we
would expect a hybrid morphology unless the elongated leaf morphology is
dominant which is not seen in the Waverly hybrids. An alternative explanation for
the presence of the S. rotundifolia genotype in the S. radicans populations at
Waikawa is that S rotundifolia may have evolved from S. radicans at this site. The
S. radicans populations may have retained some of the genotype that S.
rotundifolia arose from, although it is also possible hybridization occurred between
these species early in speciation.
Introgression has been suggested to create genetic variation and even aid adaptation
or possibly adaptive radiation (Arnold and Martin 2009). At Waikawa,
hybridization between S. rotundifolia and S. radicans, and subsequent backcrossing
with S. radicans may have allowed the S. radicans hybrids to thrive in the dune
flats rather than an estuary habitat which is their preferred habitat. If S. radicans
can now out-compete S. rotundifolia this could pose a problem for the latter which
is already rated in decline due to taller and faster growing weed species (De Lange
2012b). An example of adaptive introgression is in Iris L. between a flood tolerant
species, Iris fulva Ker Gawl. and the dry adapted Iris brevicaulis Raf. The ability to
survive flooding for up to four months was shown to have a genetic basis with
genotypes of I. fulva surviving at significantly higher frequencies than I.
brevicaulis genotypes. Hybridization and subsequent backcrosses to I. brevicaulis
showed greater survival when they contained introgressed alleles from I. fulva
involved in flood adaptation indicating that introgression can facilitate spread to
new environments (Martin et al. 2006). Introgression has been observed in many
New Zealand species such as, Metrosideros Banks ex Gaertn. (Gardner et al. 2004),

68
Coprosma J.R.Forst. & G.Forst. and alpine cicadas (Maoricicada) (Buckley et al.
2006) leading to questions whether this is a characteristic common to the New
Zealand flora (Morgan-Richards et al. 2009).
Different hybridization rates among different sympatric populations have been
observed previously in many different species, for example Ipomosis (Aldridge and
Campbell 2009) and Lomatia R.BR. (McIntosh et al. 2014). The difference in
hybridization rates is often attributed to ecological differences at the sites which
can result in different selective pressures on hybrids (Aldridge and Campbell
2009). Alternatively, it is possible that there is a genotypic difference that prevents
hybridization at some sites but not others, particularly as S. rotundifolia may have
multiple origins so the different lineages could possess different genotypes some of
which are more incompatible with S. radicans than others. These hybridization
events between two Selliera species indicate that reproductive isolation occurs at
one site providing strong evidence that the HB/HC/Wk cluster are a distinct species
from S. radicans. Because S. rotundifolia has two genetic clusters that are more
closely related to different S. radicans populations than to each other suggests that
there are two lineages within S. rotundifolia which may explain the hybridization at
Waverly but apparent reproductive isolation at Waikawa.
3.5.4 Future directions
These results provide insights into the population structure and species boundaries
within Selliera but also raise further questions for investigation. It is not known if
S. microphylla is capable of hybridizing with the other species so reproductive
isolation tests and further chromosome analyses may be useful. It would be of
interest to determine if the Central Volcanic Plateau population that has a
chromosome count of 2n=56 can hybridize with the other species, which is unlikely
but would provide evidence that this is a distinct species. It also would be of
interest to confirm the chromosome count and frequency of polyploids in other
populations on the Central Volcanic Plateau. Studying the two sympatric sites of S.
radicans and S. rotundifolia and the different lineages within S. rotundifolia in
greater depth would be helpful in determining the status of these populations and
the species. As hybridization appears to be restricted at Waikawa but not at

69
Waverly, comparing the differences between these sites including geographic and
genetic factors that may be influencing the different rates of hybridization may help
to identify the isolating mechanisms that prevent hybridization between the species
and provide insights into the evolution of S. rotundifolia as well as determining
species boundaries. An in depth study of the different preferred habitats for these
species to investigate whether round leaves confers any advantage to S. rotundifolia
in a dune environment compared to S. radicans preferred estuary habitat may
reveal why the round-leaved form evolved and aid determination of species
boundaries, although one might imagine that the round leaf form is either
pleiotropic or genetically linked to another trait that is under selective pressure. As
the Castlepoint population may be another S. rotundifolia population or a hybrid
population where S. rotundifolia may have gone extinct, further investigation of
this site may be an interesting study. As polyploidy has been documented in
Selliera radicans in Tasmania (Jackson 1958) it would be interesting to make
chromosome counts for populations of Selliera radicans from around New Zealand
to assess if polyploidy is more extensive in New Zealand populations.
3.6 Conclusion Species delimitation is an important task in biology but biological events such as
hybridization, introgression and polyploidy can increase the difficulty in delimiting
species. Population genetic approaches have been successful in delimiting closely
related species that were previously difficult to determine (Bacon et al. 2012) and
so is an ideal approach for use in Selliera which consists of closely related species
described based on morphology or geographic location leading to disagreements
about the status of some species.
We investigated the status of species in Selliera with microsatellite markers using a
population genetics approach. Our results suggest there is evidence for the
existence of each of the species previously described although this may need to be
reviewed in the future. S. rotundifolia shows high differentiation between
populations and distinct genetic lineages indicating round leaves may have arisen,
twice in the history of Selliera in New Zealand and may not be suitable to identify
a distinct species. There is evidence of hybridization between S. rotundifolia and S.
radicans which differs between the two sympatric sites. At Waikawa S.

70
rotundifolia appears reproductively isolated from S. radicans although this needs to
be confirmed through crossing studies but may suggest distinctly evolving lineages
of Selliera. Introgression back to S. radicans at Waikawa may have allowed S.
radicans to adapt to the dune environment that is preferred by S. rotundifolia which
could pose a problem for S. rotundifolia which is already rated in decline due to
faster and taller growing weed species. We also identified a further possible hybrid
site at Castlepoint although this needs further investigation. Selliera microphylla
also showed a high differentiation between populations. Two genetic lineages are
each more closely related to different S. radicans populations suggesting that the
South Island population may be an inland variant of S. radicans although if the
population remains isolated it would be expected to continue to diverge into a new
species.
3.7 References Aldridge, G. and Campbell, D. R. (2009), 'Genetic and morphological patterns
show variation in frequency of hybrids between Ipomopsis
(Polemoniaceae) zones of sympatry', Heredity, 102 (3), 257-65.
Allan, H. H. (1961), Flora of New Zealand. Volume I, Indigenous tracheophyta :
psilopsida, lycopsida, filicopsida, gymnospermae, dicotyledones
(Wellington, N.Z.: R.E. Owen Govt. Printer) 1085.
Arnold, Michael L. and Martin, Noland H. (2009), 'Adaptation by introgression',
Journal of Biology (London), 8, 82-Article No.: 82.
Ashley, M. V. and Dow, B. D. (1994), 'The use of microsatellite analysis in
population biology: background, methods and potential applications', Exs,
69, 185-201.
Bacon, C. D., et al. (2012), 'Evaluating multiple criteria for species delimitation: an
empirical example using Hawaiian palms (Arecaceae: Pritchardia)', BMC
Evolutionary Biology, 12 (23).
Barker, N. P., et al. (2002), 'The genetic diversity of Scaevola plumieri
(Goodeniaceae), an indigenous dune coloniser, as revealed by Inter Simple
Sequence Repeat (ISSR) fingerprinting', South African Journal of Botany,
68 (4), 532-41.

71
Billings, W.D and Mooney, H.A (1968), 'The ecology of artic and alpine plants',
Biological Reviews, 43, 481-589.
Birky, C. W., et al. (2010), 'Using population genetic theory and DNA sequences
for species detection and identification in asexual organisms', Plos One, 5
(5).
Brochmann, C., et al. (2004), 'Polyploidy in arctic plants', Biological Journal of the
Linnean Society, 82 (4), 521-36.
Bryant, D. and Moulton, V. (2004), 'Neighbor-Net: An agglomerative method for
the construction of phylogenetic networks', Molecular Biology and
Evolution, 21 (2), 255-65.
Buckley, T. R., Attanayake, D., Park, D., Ravindran, S., Jewell, T. R., and
Normark,B. B. (2008), 'Investigating hybridization in the parthenogenic
New Zealand stick insect Acanthoxyla (Plasmatodea) using single-copy
nuclear loci'. Molecular Phylogenetics and Evolution, 48 (1), 335-49.
Chapman, Mark A., Hiscock, Simon J., and Filatov, Dmitry A. (2013), 'Genomic
Divergence during Speciation Driven by Adaptation to Altitude', Molecular
Biology and Evolution, 30 (12), 2553-67.
Cheeseman, T. F. (1876), 'On the Fertilization of Selliera', Transactions and
Proceedings of the Royal Society of New Zealand 1868-1961, 9.
Colenso, W (1889), 'A description of some newly-discovered phanogamic plants,
being a further contribution towards the making-known the botany of New
Zealand.', Transactions and Proceedings of the Royal Society of New
Zealand 1868-1961, 22, 459-93.
Dawson, M. I., Brownsey, P. J., and Lovis, J. D. (2000), 'Index of chromosome
numbers of indigenous New Zealand pteridophytes', New Zealand Journal
of Botany, 38 (1), 25-46.
De Lange, P. J. (2014), 'Selliera rotundifolia', New Zealand Plant Conservation
Network <http://www.nzpcn.org.nz/flora_details.aspx?ID=204>, accessed 9
May.
--- (2014), 'Selliera microphylla ', New Zealand Plant Conservation Network
<http://www.nzpcn.org.nz/flora_details.aspx?ID=1293>, accessed March.
De Queiroz, K. (2007), 'Species concepts and species delimitation', Systematic
Biology, 56 (6), 879-86.

72
De Storme, Nico, Copenhaver, Gregory P., and Geelen, Danny (2012), 'Production
of Diploid Male Gametes in Arabidopsis by Cold-Induced Destabilization
of Postmeiotic Radial Microtubule Arrays', Plant Physiology, 160 (4),
1808-26.
Dieringer, D. and Schlotterer, C. (2003), 'MICROSATELLITE ANALYSER
(MSA): a platform independent analysis tool for large microsatellite data
sets', Molecular Ecology Notes, 3 (1), 167-69.
Donaldson, M. R., et al. (2008), 'Cold shock and fish', Journal of Fish Biology, 73
(7), 1491-530.
Doyle, L. E and Doyle, J. L. (1987), 'A rapid DNA isolation procedure for small
quantities of fresh leaf tissue.', Phytochem Bull 19, 11-15.
Duminil, J and Michele, M. Di (2009), 'Plant Species : A comparison of
morphological and molecular markers', Plant Biosystems - An International
Journal Dealing With All Aspects of Plant Biology: Official Journal of the
Societa Botanica Italiana, 143 (3), 528-42.
Edwards, Christine E., et al. (2009), 'Using Population Genetic Data as a Tool to
Identify New Species: Conradina cygniflora (Lamiaceae), a New,
Endangered Species from Florida', Systematic Botany, 34 (4), 747-59.
Evanno, G., Regnaut, S., and Goudet, J. (2005), 'Detecting the number of clusters
of individuals using the software STRUCTURE: a simulation study',
Molecular Ecology, 14 (8), 2611-20.
Gandour, Mhemmed, Hessini, Kamel, and Abdelly, Chedly (2008), 'Understanding
the population genetic structure of coastal species (Cakile maritima): seed
dispersal and the role of sea currents in determining population structure',
Genetics Research, 90 (2), 167-78.
Gardner, R.C., De Lange, P. J.,Keeling, D. J. et al. (2004), 'A late Quaternary
phylogeography for Metrosideros (Mytaceae) in New Zealand inferred
from chloroplast DNA haplotypes', Biological Journal of the Linnean
Society, 83, 399-412.
Goudet, J. (1995), 'FSTAT (Version 1.2): A computer program to calculate F-
statistics', Journal of Heredity, 86 (6), 485-86.

73
Hamrick, J. L. and Godt, M. J. W. (1996), 'Effects of life history traits on genetic
diversity in plant species', Philosophical Transactions of the Royal Society
of London Series B-Biological Sciences, 351 (1345), 1291-98.
Harrison, Richard G. (2012), 'The language of speciation', Evolution, 66 (12),
3643-57.
Heenan, P. B. (1997), 'Selliera rotundifolia (Goodeniaceae), a new, round-leaved,
species from New Zealand', New Zealand Journal of Botany, 35 (2), 133-
38.
Hegde, Subray G., et al. (2006), 'The evolution of California's wild radish has
resulted in the extinction of its progenitors', Evolution, 60 (6), 1187-97.
Hey, J. (2001), 'The mind of the species problem', Trends in Ecology & Evolution,
16 (7), 326-29.
Ho, Kuen-Yih, et al. (2005), 'Genetic variation of the endangered Scaevola
hainanensis (Goodeniaceae) in the Jiangjun Stream Mouth, Taiwan',
Taiwan Journal of Forest Science, 20 (3), 193-202.
Hull, D.L (1977), The Ontological Status of Species as Evolutionary Units
(Foundational Problems in the Special Sciences; Dordrecht-Holland: D.
Reidel Publishing Company).
Huson, D. H. (1998), 'SplitsTree: analyzing and visualizing evolutionary data',
Bioinformatics, 14 (1), 68-73.
Jackson, W. D. (1958), 'Chromosome numbers in Tasmanian Goodeniaceae and
Brunoniaceae', Papers and Proc Roy Soc Tasmania, 92, 161-63.
James, J. K. and Abbott, R. J. (2005), 'Recent, allopatric, homoploid hybrid
speciation: The origin of Senecio squalidus (Asteraceae) in the British Isles
from a hybrid zone on Mount Etna, Sicily', Evolution, 59 (12), 2533-47.
Kim, Changkyun, Jung, Jongduk, and Choi, Hong-Keun (2012), 'Molecular
identification of Schoenoplectiella species (Cyperaceae) by use of
microsatellite markers', Plant Systematics and Evolution, 298 (4), 811-17.
Kolbe, Jason J., et al. (2012), 'Founder Effects Persist Despite Adaptive
Differentiation: A Field Experiment with Lizards', Science, 335 (6072),
1086-89.
Kunte, Krushnamegh, et al. (2011), 'Sex Chromosome Mosaicism and Hybrid
Speciation among Tiger Swallowtail Butterflies', Plos Genetics, 7 (9).

74
Lenormand, Thomas (2012), 'From Local Adaptation to Speciation: Specialization
and Reinforcement', International Journal of Ecology, 2012, 11.
Liu, Siyu, et al. (2011), 'In vitro induced tetraploid of Dendranthema nankingense
(Nakai) Tzvel. shows an improved level of abiotic stress tolerance', Scientia
Horticulturae, 127 (3), 411-19.
Mabberley, D.J (2008), Mabberley's plant book, a portable dictionary of plants,
their classification and uses (3rd edn.: Cambridge University Press).
Mao, Jian-Feng and Wang, Xiao-Ru (2011), 'Distinct Niche Divergence
Characterizes the Homoploid Hybrid Speciation of Pinus densata on the
Tibetan Plateau', American Naturalist, 177 (4), 424-39.
Martin, N. H., Bouck, A. C., and Arnold, M. L. (2006), 'Detecting adaptive trait
introgression between Iris fulva and I. brevicaulis in highly selective field
conditions', Genetics, 172 (4), 2481-89.
McIntosh, Emma J., et al. (2014), 'Maintenance of strong morphological
differentiation despite ongoing natural hybridization between sympatric
species of Lomatia (Proteaceae)', Annals of Botany, 113 (5), 861-72.
Morgan-Richards, M., Smissen, R. D., Shepherd, L. D., Wallis, G. P., Hayward, J.
J., Chan, C., Chambers, G. K., and Chapman, H. M. (2009), 'A review of
genetic analyses of hybridisation in New Zealand', Journal of the Royal
Society of New Zealand, 39 (1), 15-34.
Moya, A., Galiana, A., and Ayala, F. J. (1995), 'Founder-effect speciation theory -
failure of experimental corroboration', Proceedings of the National
Academy of Sciences of the United States of America, 92 (9), 3983-86.
Murray, B. G. and de Lange, P. J. (2013), 'Contributions to a chromosome atlas of
the New Zealand flora - 40. Miscellaneous counts for 36 families', New
Zealand Journal of Botany, 51 (1), 31-60.
Nei, M. (1975), 'Molecular population genetics and evolution', Frontiers of biology,
40, I-288.
Ogden, J. (1974), 'Observations on 2 coastal ecotypes of Selliera-radicans
(Goodeniaceae) growing in the manawatu district of new-zealand', New
Zealand Journal of Botany, 12 (4), 541-50.

75
Partridge, T. R. and Wilson, J. B. (1987), 'Germination in relation to salinity in
some plants of salt marshes in otago, new-zealand', New Zealand Journal of
Botany, 25 (2), 255-61.
Peakall, Rod and Smouse, Peter E. (2012), 'GenAlEx 6.5: genetic analysis in Excel.
Population genetic software for teaching and research-an update',
Bioinformatics, 28 (19), 2537-39.
Pritchard, J. K., Stephens, M., and Donnelly, P. (2000), 'Inference of population
structure using multilocus genotype data', Genetics, 155 (2), 945-59.
Ramsey, J. and Schemske, D. W. (1998), 'Pathways, mechanisms, and rates of
polyploid formation in flowering plants', Annual Review of Ecology and
Systematics, 29, 467-501.
Schemske, Douglas W. and Bierzychudek, Paulette (2007), 'Spatial differentiation
for flower color in the desert annual Linanthus parryae: Was Wright right?',
Evolution, 61 (11), 2528-43.
Schindelin, Johannes, et al. (2012), 'Fiji: an open-source platform for biological-
image analysis', Nature Methods, 9 (7), 676-82.
Sites, J. W. and Crandall, K. A. (1997), 'Testing species boundaries in biodiversity
studies', Conservation Biology, 11 (6), 1289-97.
Slatkin, M. (1977), 'Gene flow and genetic drift in a species subject to frequent
local extinctions', Theoretical Population Biology, 12 (3), 253-62.
Spurgin, Lewis G., et al. (2014), 'Genetic and phenotypic divergence in an island
bird: isolation by distance, by colonization or by adaptation?', Molecular
Ecology, 23 (5), 1028-39.
Stearns, S. C. (1989), 'The evolutionary significance of phenotypic plasticity -
phenotypic sources of variation among organisms can be described by
developmental switches and reaction norms', Bioscience, 39 (7), 436-45.
Sunnucks, P. (2000), 'Efficient genetic markers for population biology', Trends in
Ecology & Evolution, 15 (5), 199-203.
Symonds, V. V. and Lloyd, A. M. (2004), 'A simple and inexpensive method for
producing fluorescently labelled size standard', Molecular Ecology Notes, 4
(4), 768-71.
Templeton, A. R. (2001), 'Using phylogeographic analyses of gene trees to test
species status and processes', Molecular Ecology, 10 (3), 779-91.

76
The Plant List (2014), 'Selliera',
<http://www.theplantlist.org/1.1/browse/A/Goodeniaceae/Selliera/>,
accessed 20 May.
Travisano, M., et al. (1995), 'Experimental tests of the roles of adaptation, chance,
and history in evolution', Science, 267 (5194), 87-90.
Vamosi, S. M. and Schluter, D. (1999), 'Sexual selection against hybrids between
sympatric stickleback species: Evidence from a field experiment',
Evolution, 53 (3), 874-79.
Wade, M. J. and McCauley, D. E. (1988), 'Extinction and recolonization - their
effects on the genetic differentiation of local populations', Evolution, 42 (5),
995-1005.
Wang, FengBao, Fu, JinFeng, and Dong, LiFeng (2010), 'Study on inducing
homologous polyploidy pea ( Pisum sativum) with heat and cold shock',
Seed, 29 (10), 24-27&31.
Weir, B. S. and Cockerham, C. C. (1984), 'Estimating f-statistics for the analysis of
population-structure', Evolution, 38 (6), 1358-70.
Wendel, J. F. (2000), 'Genome evolution in polyploids', Plant Molecular Biology,
42 (1), 225-49.
Whitney, K. D., et al. (2010), 'Patterns of hybridization in plants', Perspectives in
Plant Ecology Evolution and Systematics, 12 (3), 175-82.
Whittaker, Robert J., et al. (2007), 'The island immaturity - speciation pulse model
of island evolution: an alternative to the "diversity begets diversity" model',
Ecography, 30 (3), 321-27.
Wichman, S. R., Wright, S. D., Cameron, E. K., Keeling, D. J., and Gardner, R. C.
(2002), 'Elevated genetic heterogenity and Pleistocene climatic instability:
inferences from nrDNA in New Zealand Coprosma (Rubiaceae)', Journal
of Biogeography, 29, 943-954.
Wiens, J J (2007), 'Species delimitation: new approaches for discovering diversity',
Systematic Biology, 56 (6), 875-78.
Williams, G.C (1966), Adaptation and Natural Selection (Princeton: Princeton
University Press).

77
Wolfe, A. D., Xiang, Q. Y., and Kephart, S. R. (1998), 'Diploid hybrid speciation in
Penstemon (Scrophulariaceae)', Proceedings of the National Academy of
Sciences of the United States of America, 95 (9), 5112-15.
Wood, Andrew T., et al. (2011), 'Triploid induction of black tiger shrimp, Penaeus
monodon (Fabricius) using cold shock', Aquaculture Research, 42 (11),
1741-44.
Wright, S. (1943), 'An analysis of local variability of flower color in Linanthus
parryae', Genetics, 28 (2), 139-56.

78
C h a p t e r 4
Conclusion
4.1 Introduction This study attempted to investigate the status of species in Selliera,
(Goodeniaceae), which is controversial due to descriptions from only morphology
and geographic distributions. Species delimitation is important in biology to
provide consistancy, ensure the correct species is studied, conservation funding is
spent where needed and may provide insights into evolution and the species
process. However species delimitation remains one of the more difficult tasks in
biology. The idea that species are lineages has been widely accepted by biologists
(Wiens 2007) although this still leaves difficulty in defining a lineage, especially if
the species are still in the speciation process, for example on younger islands (Birky
et al. 2010). Factors such as hybridization, introgression, polyploidy, and
incomplete lineage sorting can increase this difficulty in species delimitation. As
these factors often act at the population level a population genetics approach, which
studies the genetic structure of populations, may be informative in determining
species boundaries. Population genetic approaches have been previously successful
in delimiting species complexes where other methods have been unsuccessful
(Bacon et al. 2012; Edwards et al. 2009; Kim et al. 2012) so may be an informative
approach for Selliera where species are closely related and have the potential to
hybridize.
Three species of Selliera have been previously described in New Zealand. Selliera
radicans which is also present in Australia and Chile, S. rotundifolia (Heenan
1997), endemic to the lower Western North Island, and S. microphylla (Colenso
1889). Selliera radicans and S. rotundifolia are coastal species with S. radicans
preferring an estuary habitat, although it can be found in a variety of habitats (De
Lange 2014), and S. rotundifolia preferring a dune habitat (Heenan 1997). Selliera
79
microphylla is the only found inland mainly on the Central Volcanic Plateau
(Colenso 1889) but has also been reported in West Dome in the South Island.
These species were described mainly based on geographic location and
morphology. However in plants, morphology can be very plastic, where the
environment can affect the phenotype seen, as plants cannot move once
germinated, unlike animals, so need to be able to cope with minor environmental
changes throughout their lifespan. Selliera rotundifolia has been described based on
a preferred dune habitat and rounder leaves (Heenan 1997) than S. radicans, which
is described with spathulate, elongated leaves although is noted to be highly
polymorphic (Allan 1961). These rounder leaves were maintained in a common
garden experiment suggesting that environmental conditions did not influence the
rounder leaf shape (Ogden 1974). Selliera microphylla is noted to be smaller in size
than S. radicans and grows inland although it has been noted to revert to similar
morphology to S. radicans in similar environments (De Lange 2012a; K Pilkington,
personal observ.).We utilised a population genetics approach combined with an
analysis of morphology with aims to:
1. Develop reliable and polymorphic microsatellite markers to use for Selliera.
2. Determine the species boundaries within Selliera.
3. Examine the population structure within Selliera species.
Microsatellite markers were chosen for this study due to the ease of genotyping
(Ashley and Dow 1994), co-dominance which allows detection of heterozygotes
(Duminil and Michele 2009), and relative faster evolution (Li et al. 2002) making
them informative for closely related species.
4.2 Findings Nine microsatellite markers were developed for use in Selliera to attempt to
determine species boundaries. The main findings were summarised within the
previous chapters: Microsatellite primers in Selliera radicans (Goodeniaceae) and
Species delimitation and population genetics in Selliera (Goodeniaceae). This
section will use these findings to address the aims of the study:

80
1. Develop reliable and polymorphic microsatellite markers to use for
Selliera.
454 next generation sequencing was utilized in sequencing Selliera DNA
which was sorted into contigs and microsatellite loci detected by
MSATCOMMANDER. Forty three detected loci were tested on samples of
each of the described species in Selliera for reliable and polymorphic loci that
could be used a markers for the second part of the study. Nine microsatellite
markers were developed that amplified consistently and were polymorphic.
These markers were used to screen all 618 samples of Selliera collected; only
five of these samples failed to amplify for four or more markers and were
removed from the analysis. Most markers amplified more than 90% of the
samples with only one marker amplifying just 73% of the samples indicating
these markers are reliable to use in a population genetics approach to
delimiting species in Selliera. All markers were polymorphic with allele
numbers ranging from 2 to 8 which may be low polymorphism but may be
typical of the species.
2. Determine the species boundaries within Selliera and examine population
structure within Selliera species.
Our results do suggest that the three species previously described in Selliera
exist with some variation in species boundaries. There was greater variation
within species than between them with only 25.4% of the variation attributed
to between species, consistent with species in Selliera being closely related,
and that the majority of populations within species were differentiated from
others. Analyses showed that both S. microphylla and S. rotundifolia had high
interpopulation differentiation and two genetic lineages were identified within
each of the species indicating these species are not distinctly evolving
lineages. Morphological analyses revealed distinct differences between the
species with S. rotundifolia leaf morphology only slightly overlapping with S.
radicans leaf shape and S. microphylla falling within the range of S. radicans.
Selliera radicans showed greater admixture than the other species indicating
more gene flow occurring between populations. S. radicans and S.
rotundifolia are sympatric at two of the sampled sites which may result in

81
hybridization. We observed hybridization at one site, Waverly, with
morphological and genetic intermediates and apparent reproductive isolation
with possible past introgression, at another, Waikawa. We also identified
another site, Castlepoint, where hybridization may have occurred although no
S. rotundifolia plants were identified in this population.
The presence of reproductive isolation, distinct morphology and genetic
distinction is strong evidence for a separate species, Selliera rotundifolia, and
is also supported with previous analyses suggesting that rounder leaves is
genetically determined (Ogden 1974). However the presence of two lineages
in S. rotundifolia indicates rounder leaves may have evolved twice from S.
radicans and therefore round leaves may not be a good indicator of a single
species. This may explain why hybridization occurs at Waverly and not
Waikawa with the different lineages of round leaves at different stages of
evolution and have not yet evolved reproductive isolation so speciation is not
complete for S. rotundifolia at all sites. With time and isolation all round
leaved populations may evolve reproductive isolation and continue to diverge
separately unless gene flow occurs between the two lineages which is possibly
seen at Waverly and may indicate one species. Analyses suggest introgression
back to S. radicans may have occurred in the past at Waikawa which may
allow S. radicans to adapt to the dune environment of S. rotundifolia and
could pose problems for S. rotundifolia as it is already threatened by faster and
taller growing weed species (De Lange 2012b). Alternatively Waikawa may
be the origin for the Himatangi/Waikawa lineage of S. rotundifolia.
Analyses suggest that the North and South Island S. microphylla are not
consistent with one species and the South Island populations may in fact be an
inland S. radicans population but, due to the isolation of this population, may
diverge into a new species over time as analyses show this population is
distinct from all others except one other South Island population (Tw) which
may be due to shared ancestry. The North Island Central Volcanic Plateau
population also clusters with other S. radicans populations but has a single
chromosome count of 2n=56 (Murray and de Lange 2013) which is much

82
higher than the 2n=16 of S. radicans and S. rotundifolia. We would expect a
chromosome count this different to prevent reproduction with the other
species indicating the Central Volcanic Plateau populations should retain the
S. microphylla species name. Although reproductive isolation has not been
confirmed yet in these populations and further cytological studies are required
to examine the frequency of 2n=56 individuals.
These results will aid in the understanding of the species within Selliera and
help to determine the species boundaries. The identification of two lineages
within S. rotundifolia may be useful in future if conservation of this species is
needed. However further research is needed to investigate the species
boundaries. It may be helpful to investigate whether hybridization is possible
between the Central Volcanic Plateau S. microphylla and the other species and
confirm the higher chromosome count in other individuals and populations
from the Central Volcanic Plateau. Investigation and comparison of the
sympatric sites of Selliera radicans and Selliera rotundifolia and the
frequency of hybridization within these sites may provide insights into the
development of reproductive isolation, identify environmental or genetic
factors that are involved and more clearly identify if introgression has
occurred at Waikawa. Further investigation of the Castlepoint population may
indicate whether hybridization has occurred or if this is a population of S.
rotundifolia despite the S. radicans morphology.
4.3 Limitations For this study there are a number of limitations to be considered. Morphological
images were taken in the field using a digital camera due to time constraints which
resulted in shadow from the sun on some images, and some leaves that would not
lay flat which resulted in some leaves unable to be measured, which were excluded
from the analysis but a large sample size was still obtained. Selliera radicans leaves
do not always have a clear petiole from the leaf blade unlike Selliera rotundifolia
so was measured from where the smallest part of the leaf could be found which
may affect the results. The number of plants in a population was not estimated as it
is difficult to tell separate plants apart due to the creeping nature of Selliera

83
although this was addressed by not sampling within one meter of other sampled
plants but it is not known if individual Selliera plants can grow that large so it may
still be possible sampling from the same plant occurred.
For marker development it was difficult to get the required quality of DNA from
Selliera tissue which resulted in a lot of low quality reads returned although this
was solved by forming contigs from the sequences. Sampling within S. rotundifolia
and S. microphylla was smaller than for S. radicans and may not consist of a large
enough sample size for some species however sampling was conducted on all
populations that could be found at the time of collection for these species and this
smaller size may be typical of the species. Finally, although microsatllite markers
are assumed to be nearly neutral, we do not know if any markers are linked to
selected phenotypes but using multiple markers should negate this effect. Despite
the limitations within this study it provides an important initial assessment of
population structure and species boundaries within Selliera where issues raised can
be addressed in future with greater sampling of S. microphylla and S. rotundifolia
and increased emphasis on sympatric populations. Future studies perhaps with
more specific markers to study hybridization and introgression will further help in
determining species boundaries.

84
4.4 References Allan, H. H. (1961), Flora of New Zealand. Volume I, Indigenous tracheophyta :
psilopsida, lycopsida, filicopsida, gymnospermae, dicotyledones
(Wellington, N.Z.: R.E. Owen Govt. Printer) liv, 1085.
Ashley, M. V. and Dow, B. D. (1994), 'The use of microsatellite analysis in
population biology: background, methods and potential applications', Exs,
69, 185-201.
Bacon, C. D., et al. (2012), 'Evaluating multiple criteria for species delimitation: an
empirical example using Hawaiian palms (Arecaceae: Pritchardia)', BMC
Evolutionary Biology, 12 (23).
Birky, C. W., et al. (2010), 'Using population genetic theory and DNA sequences
for species detection and identification in asexual organisms', Plos One, 5
(5).
Colenso, W (1889), 'A description of some newly-discovered phanogamic plants,
being a further contribution towards the making-known the botany of New
Zealand.', Transactions and Proceedings of the Royal Society of New
Zealand 1868-1961, 22, 459-93.
De Lange, P. J. (2014), 'Selliera microphylla ', New Zealand Plant Conservation
Network <http://www.nzpcn.org.nz/flora_details.aspx?ID=1293>, accessed
March.
--- (2014), 'Selliera rotundifolia', New Zealand Plant Conservation Network
<http://www.nzpcn.org.nz/flora_details.aspx?ID=204>, accessed 9 May.
Duminil, J and Michele, M. Di (2009), 'Plant Species : A comparison of
morphological and molecular markers', Plant Biosystems - An International
Journal Dealing With All Aspects of Plant Biology: Official Journal of the
Societa Botanica Italiana, 143 (3), 528-42.
Edwards, Christine E., et al. (2009), 'Using Population Genetic Data as a Tool to
Identify New Species: Conradina cygniflora (Lamiaceae), a New,
Endangered Species from Florida', Systematic Botany, 34 (4), 747-59.
Heenan, P. B. (1997), 'Selliera rotundifolia (Goodeniaceae), a new, round-leaved,
species from New Zealand', New Zealand Journal of Botany, 35 (2), 133-
38.

85
Kim, Changkyun, Jung, Jongduk, and Choi, Hong-Keun (2012), 'Molecular
identification of Schoenoplectiella species (Cyperaceae) by use of
microsatellite markers', Plant Systematics and Evolution, 298 (4), 811-17.
Li, Y. C., et al. (2002), 'Microsatellites: genomic distribution, putative functions
and mutational mechanisms: a review', Molecular Ecology, 11 (12), 2453-
65.
Murray, B. G. and de Lange, P. J. (2013), 'Contributions to a chromosome atlas of
the New Zealand flora - 40. Miscellaneous counts for 36 families', New
Zealand Journal of Botany, 51 (1), 31-60.
Ogden, J. (1974), 'Observations on 2 coastal ecotypes of Selliera-radicans
(Goodeniaceae) growing in the manawatu district of new-zealand', New
Zealand Journal of Botany, 12 (4), 541-50.
Wiens, J J (2007), 'Species delimitation: new approaches for discovering diversity',
Systematic Biology, 56 (6), 875-78.