Embed Size (px)
Citation preview
Journal of Controlled Release 66 (2000) 293–306www.elsevier.com/ locate / jconrel
A particulate pulse-release system and mathematical descriptionwith the Maxwell–Stefan theory
*P.J.A. Hartman Kok , P. Vonk, N.W.F. KossenDepartment of Industrial Pharmacy, University of Groningen, 9713 AV Groningen, The Netherlands
Received 12 September 1999; accepted 9 December 1999
Abstract
In this contribution both the development of a multi-particulate delayed release system with release properties dependenton the swelling of an UV crosslinked coating and a mathematical model to describe its release properties are presented. Theformulation consists of a water-soluble core coated with a copolymer of methacrylic acid and ethyl acrylate. Incorporating anetwork of crosslinked pentaerythritol triacrylate decreases the water-solubility of the coating. After immersing theformulation in water the coating will take up water and subsequently swell in such a degree that the diffusion coefficient ofwater in the coating will increase. This makes the coating permeable to the dissolved components present in the core. Theswelling kinetics of the coating are such that the formulation has a pulse-release profile, i.e. a fast release of the contents isobtained after a pre-determined lag-time. Both the coating thickness and the duration of the UV crosslinking time can beused to adjust the lag-time. The experimental results are used to estimate the Maxwell–Stefan diffusion coefficients of waterin the coating. The relation between the Maxwell–Stefan diffusion coefficient and the mole fraction of water in the coatingdiffers from results found in the literature. However, the prediction of the release time based on the presented model is ingood agreement with the experimental findings. 2000 Published by Elsevier Science B.V. All rights reserved.
Keywords: Coating; Pulse release; Swelling; Diffusion; Maxwell–Stefan
1. Introduction mathematical model several physical properties ofthe coating material were determined.
In this contribution a multi-particulate controlled It is not always desired that a controlled releaserelease formulation is developed with a pulse-release formulation has a zero- or first-order release of itsof its contents after a predetermined lag-time. The contents. Some pharmaceutical applications requireemphasis is laid on formulations with a lag-time less to be administered in a pulse [1] and also in the fieldthan 1 h. Also an attempt is made to predict the of insecticides or detergents the pulse-release of anpulse-release by a mathematical model; for this active component can be beneficial [2–5]. In phar-
maceutical applications a multi-particulate formula-tion is preferred because they are more reliable in
*Corresponding author. Tel.: 131-50-363-3172; fax: 131-50-terms of a smaller variation in the gastric transit time363-2500.and the smaller risk of dose dumping.E-mail address: [email protected] (P.J.A. Har-
tman Kok) Several multi-particulate pulse-release formula-
0168-3659/00/$ – see front matter 2000 Published by Elsevier Science B.V. All rights reserved.PI I : S0168-3659( 99 )00279-5

294 P.J.A. Hartman Kok et al. / Journal of Controlled Release 66 (2000) 293 –306
tions have been developed so far. Ueda et al. have a five. The outer film has the function of protecting thepatent [6] and published three articles [7–9] about a system from the fluids in the stomach and dissolvesparticulate pulse-release device which they named a when it has entered the small intestine. The functionTime controlled Explosion System (TES). It consists of the HPMC layer is to delay the release of the drugof an inert core (polystyrene balls or non-pareil for 3–4 h when the system is transported through thesucrose beads) coated with, respectively, a drug small intestine. The HPMC layer is capable of doinglayer, a swelling agent layer (low-substituted hy- this because it dissolves and erodes very slowly indroxypropylcellulose) and a water-insoluble layer water. The release profile obtained is a pulse-release(ethylcellulose). When water diffuses through the of the drug after an initial lag-time.ethylcellulose coating the hydroxypropylcellulose US patent 4933185 [14] by Wheatley et al.layer will swell and rupture the ethylcellulose layer describes a controlled release system for delivery ofinducing immediate release. The lag-time is con- a biologically active substance. The principle used totrolled by the thickness of the outer ethylcellulose achieve a pulse-release is enzymatic degradation.membrane. The enzyme is selected to degrade the core to a point
Schultz and Kleinebudde [10] wrote an article on a at which the core can no longer maintain thedevice similar to the bursting devices discussed integrity of the skin, so that the capsule falls apart.before. It consists of a water-soluble core coated The controlled release formulation developed inwith a water-insoluble film-former (cellulose ace- our contribution consists of a spherical water-solubletate). Release depends on the increase of the core core coated with a copolymer of methacrylic acidvolume due to the diffusion of water though the and ethyl acrylate. The ratio of free carboxyl groupscoating. The coating is not totally ruptured but pores to ester groups is approximately 1:1. The averageare formed when a certain amount of water has molecular weight is 250 000 [15]. The copolymer isdiffused into the core. Through these pores the active an enteric film-former, i.e. it dissolves only aboveagent is released. Changing the ratio between water- pH 6–7. The pH of the release medium used in oursoluble and water-insoluble material in the core experiments (demineralised water) is above the pH atalters the release profile from a release controlled by which the copolymer dissolves and thus no or only adrug diffusion through the coating to a pulse-release small period of time in which the release is delayedprofile. can be obtained. The dissolution rate of the coating
Narisawa et al. [11,12] developed a device capable can be decreased by creating a semi-interpenetratingof pulse-release depending on the change in diffusion network (semi-IPN) [16]. To achieve this a poly-properties of a copolymer of methacrylic acid (Eud- functional molecule is incorporated to form a net-ragit RS) by uptake of acids. They found that a core work in-between the polymer molecules. The re-coated with Eudragit RS showed very slow release action between the poly-functional molecules isrates in pure water but significant increase in the initiated by a photo-initiator that is activated by UVrelease rate was found when the microcapsules were light at a wavelength of 365 nm.immersed in an organic acid solution. This wascaused by structural changes in the film caused byinteractions of the acids with the quartenary am-monium groups in the polymer. These interactions 2. Theorywere used to achieve a pulse-release by incorporatingan organic acid in the core of the formulation. The release mechanism of this formulation de-
A device dependent on the slow dissolution be- pends on the swelling of the coating. From thehavior of high viscosity polymers is described by literature [17] it is known that the diffusivities ofGazzaniga et al. [13]. It consists of mini-tablets with penetrants are low in non-swollen or glassy poly-therein dispersed a drug substance which is coated mers. As the swelling of the polymer increases (e.g.with a high viscosity polymer (hydroxypropyl- by a temperature increase) the diffusivities increasemethylcellulose 4000, abb. HPMC 4000) and an with order of magnitudes. This can be visualized byouter coating which dissolves at a pH higher than the free volume theory that originally has been used

P.J.A. Hartman Kok et al. / Journal of Controlled Release 66 (2000) 293 –306 295
to describe diffusional properties of simple liquids. 2.2. Calculating diffusion coefficients with theDiffusion of penetrants is said to take place only second law of Fickthrough the available free volume in the polymer.Thus, for small values of the free volume (when the Fick assumed that the diffusion of a component ispolymer is in its glassy state) the diffusion of proportional to the concentration gradient of thepenetrants is slow. When the free volume is in- component. According to the first law of Fick thecreased (e.g. by increasing the temperature or swell- diffusive flux is given by:ing induced by a penetrant) the diffusion will
≠cibecome faster. Above a certain free volume the ]J 5 c v 2 v 5 2 D (3)s di i i mix ≠zdiffusivity increases rapidly, at this point there is atransition of the polymer from a glassy state into a Here J is the diffusive flux, v the drift velocity ofi mix
rubbery state. Thus, the diffusion coefficient of the the mixture, and D the Fick diffusion coefficient ofpenetrant in the coating depends on the water the component. When the swelling of a polymer isconcentration in the coating especially above the neglected, the drift velocity of the mixture becomesglass transition temperature. zero and the diffusive flux becomes equal to the
We can calculate these concentration dependent molar flux. The one-dimensional mass balance rear-diffusion coefficients by using data gathered from ranges to the second law of Fick:water sorption experiments. The sorption experi- ≠c ≠c≠i i
] ] ]S DN 5 J ⇒ 5 D (4)ments were divided into small increases in the water i i ≠t ≠z ≠zactivity and it is assumed that the diffusion coeffi-
The second law of Fick can be solved if a constantcient is constant over such a small increase in thediffusion coefficient is assumed. A solution is givenwater activity. The diffusion coefficients are calcu-by Eq. (5) for a polymeric film of thickness d placedlated on the basis of the second law of Fick and thein an infinite bath of diffusant [18].Maxwell–Stefan transport equations. Fick’s law
results in algebraic equations, while the Maxwell– ` n 2 2C 4 (21) D(2n 1 1) p tStefan transport equation results in a numerical ] ] ]] ]]]]5 1 2 O expF G2C p 2n 1 1 d` n50model. Both diffusion laws are used and the resultsare compared. (2n 1 1)px
]]]]F G? cos (5)d
The boundary conditions for this equation being zero2.1. Description of the moisture uptakeinitial concentration of diffusant at t50 and theconcentration at both surfaces being instantaneouslyA mass balance describes the uptake of moistureestablished at a concentration C at any time.`by a polymeric film. The general mass balance of aIntegrating Eq. (5) over the thickness of the film toone-dimensional uptake is given by:obtain the sorbed mass as a function of time yields:
≠c ≠N `i i M 8] ]5 2 (1) t≠t ≠z ] ]]]]5 1 2O 2 2M (2n 1 1) p` n50
Here c is the concentration of the permeating 2 2i 2 D(2n 1 1) p tcomponent, t the time, N the molar flux and z the ]]]]]? exp (6)F Gi 2ddirection of permeation. The molar flux is given by:
where M is the sorbed mass in the film at time t andtN 5 c v (2) M the sorbed mass at equilibrium. For the initiali i i `
water uptake ((M /M )#0.5) Eq. (6) can be writtent `Here v is the species velocity of the permeatingi as:component. In order to describe the permeation of a
1 1M 4 D ]t ]component, the species velocity has to be calculated 2 2] ] ]S D5 t (7)M d pon the basis of a diffusion theory. `

296 P.J.A. Hartman Kok et al. / Journal of Controlled Release 66 (2000) 293 –306
For longer periods of time Eq. (6) can be written as: way the swelling of the polymer is incorporated inthe description. When water diffuses in the film, an
2M 8 2 Dp tt equal amount (by volume) of polymer has to move in] ] ]]]5 1 2 exp (8)S D2 2M an opposite direction. The zero volume flux isp d`
obtained by:For the initial water uptake (‘penetration’) the diffu-sion coefficient is determined by measuring the slope x V v 1 x V v 5 0 (11)w w w p p p
2of the absorption curve (M /M ) against t. Fort `
Here V is the partial molar volume of water and Vlonger periods of time (‘steady state’) the diffusion w p
the partial molar volume of the polymer.coefficient is determined by measuring the slope ofThe one-dimensional mass balance, the Maxwell–the curve ln (12M /M ) against t.t `
Stefan transport equation and the zero volume fluxequation can be used to describe the concentration2.3. Calculating diffusion coefficients with theprofile in the film. This set of equations is in fact aMaxwell–Stefan mass transfer theorypartial differential equation, which has to be solvednumerically. The partial differential equation (massThe Maxwell–Stefan mass transfer theory takes abalance) is transformed into a set of ordinary dif-starting point that differs considerably from Fick’sferential equations when the directional derivative islaw. The main idea of the Maxwell transport equa-written as a finite difference for a number of grid-tions is that the driving forces on each individualpoints inside the polymeric film:component in a mixture are balanced by the friction
forces exerted on that component (–driving forces on ≠N N 2 Ni z11 / 2 z21 / 2] ]]]]]component i5friction forces on component i). In the 5 (12)≠z z 2 zz11 / 2 z21 / 2sorption experiments the driving force is the gradient
of the chemical potential, the friction force with the Here the subscript z indicates the flux and the61 / 2other component (the polymer) balances this driving position between two grid-points.force. Eq. (9) gives the one-dimensional (direction z) Over each individual set of grid-points Eqs. (9)Maxwell–Stefan equation for component i. In this and (10) are integrated with a 4th order Runga–equation D is the inverse friction coefficient be-ij Kutta method [19]. The concentration profile is thentween component i and j or the Maxwell–Stefan optimized to fit the experimental sorption curve ofdiffusion coefficient. Furthermore is m the chemicali water in the polymer film by changing the diffusionpotential of component i, R the gas constant, T the coefficient. The fit procedure used to determine theabsolute temperature, v the component velocity and diffusion coefficients is the Levenberg–Marquardtx the mole fraction of component j.j method [19].
In order to be able to perform the numericalRT(v 2 v )xdm j i ji] ]]]] method some calculations have to be done on the2 5O (9)dz Dijj data obtained from the water sorption experiments.
First the wet mass fractions and mole fractions ofThe chemical potential m of component i is given byiwater in the film as a function of the outside waterEq. (10), in which g is the activity coefficient ofiactivity are calculated. The mole fraction coating iscomponent i.defined as the total number of moles of material in
0 the coating (polymer, crosslinker and plasticizer).m 5 m 1 RT ln (g x ) (10)i i i i
The mole fraction polymer is defined by using theThe Maxwell–Stefan equation contains differences mole weight of one single monomer unit, or if ain species velocity; i.e. it contains relative velocities. copolymer is used, the average mole weight of theTo calculate the absolute species velocity of a single monomer units.component a so-called bootstrap relation is required. Then the total molar volume, needed to calculateIn this case the bootstrap relation is that we assume the water concentration in the polymer, is calculatedthat the total volume flux is equal to zero. In this by summation of the molar volume of water and the
P.J.A. Hartman Kok et al. / Journal of Controlled Release 66 (2000) 293 –306 297
molar volume of the polymer. Due to the swelling processing time was 24 min (including 5 minthe molar volume of the polymer will increase but premixing). During the whole experiment, the im-the increasing water concentration will decrease the peller speed was set at 400 rpm. The chopper speedtotal molar volume. was set at 3000 rpm during the liquid addition and
The activity coefficients are calculated with the the first 4 min of the kneading stage; the chopperknowledge that at equilibrium the activity outside the was turned off during the last 15 min of the kneadingfilm is equal to the activity inside the film. Since stage. All pellets were tray-dried at 508C for 24 h.g 5 a /x we can calculate the activity coefficient at For the coating process a sieve fraction of 0.6–0.7w
equilibrium sorption values and find a relation mm was taken.between the activity coefficient and the mole fractionof water in the film. Again to estimate the values of 3.3. Coatingthe activity coefficient at mole fractions in-betweenthe measured values we fit the data with a polyno- The cores were coated in a Uniglatt fluid bed,mial equation. (Uniglatt, Glatt GmbH, Germany), equipped with a
bottom-spray Schlick pneumatic nozzle (Schlick970, Gustav Schlick GmbH & Co., Germany). The
3. Material and methods process conditions were as follows:
3.1. Materials Inlet temperature: 608CProduct temperature: 35–408C
The core of the formulation consists of Mi- Batch size: 300 gcrocrystalline cellulose (Pharmacel ph102, DMV, Atomizing pressure: 1 barThe Netherlands) and milled sodium chloride (NaCl Spraying rate: 2 g /min
3USP powder, Mallinckrodt, USA). The coating used Fluidizing air flow: 1–1.5 m /minwas a 30 w/w% copolymer of methacrylate andethyl acrylate latex in water (Eudragit L30D55, The experimental procedure was as follows: the
¨Rohm Pharma, Darmstadt, Germany), plasticized photo-initiator and crosslinker were dissolved in thewith 10 w/w% (based on dry polymer content) plasticizer to give a clear solution and were thentriethylcitrate (TEC, Merck, Germany). The poly- added to the polymer latex. This mixture was stirredfunctional molecule or crosslinker used is the tri- overnight to ensure that all the plasticizer (and thefunctional acrylic monomer pentaerythritol tri- compounds dissolved in the plasticizer) was diffusedacrylate (PET, Sigma–Aldrich, USA) and the photo- into the polymer. The coating was applied in a fluidinitiator 2,2-dimethoxy-2-phenyl-acetophenone bed at 608C and the coated pellets were dried in an(DMPA, Sigma–Aldrich, USA), the weight percent- oven at 608C for 12 h. The crosslinking reaction wasages added based on dry polymer content were 10 initiated by exposing the pellets to a UV lamp
¨and 5, respectively. (Uvaspot 400, dr. Honle GmbH, Germany) emittingUV light with an average wavelength of 365 nm and
23.2. Core preparation an intensity of approximately 30 mW/cm . To ensurethat the coating on the pellets was evenly crosslinked
A Gral 10 high-shear mixer (Gral 10, Machines the pellets were kept in a fluidized state under theCollette, Belgium) was used for the preparation of UV lamp by vibration.cores. After 5 min of premixing a precisely de-termined amount of binder liquid was added to a 3.4. Release measurementsmixture of 37.5 w/w% microcrystalline cellulose(MCC) and 62.5 w/w% sodium chloride and the The release of the contents from the coated pelletsmass was kneaded for 4 min. Subsequently, the was measured with a conductivity meter (Knickwall-addition was scraped from the wall, and the Konduktometer 703, Knick GmbH Germany). Twomass was kneaded for another 15 min. The total types of measurement were performed; release ex-

298 P.J.A. Hartman Kok et al. / Journal of Controlled Release 66 (2000) 293 –306
periments on a large number of pellets and release 3.7. DSCexperiments on single pellets. In release experimentswith a large number of pellets 3 g of pellets were The glass transition temperature (T ) of the coat-g
suspended in 1 l of water in a stirred vessel at a ing was measured as a function of the water contentconstant temperature (2560.28C). The release was by means of modulated differential scanningmonitored with a normal sensitivity conductivity calorimetry (DSC 2920 Modulated DSC, TA Instru-electrode (Mettler Toledo 950-K19/120, Mettler ments, USA). The T was determined on the firstg
Toledo Inc., Switzerland). In a single pellet experi- run, the sample size used was approximately 6 mg,ment the release of one single pellet was measured in the heating rate 28C/min, and the modulation tem-10 ml of water in a stirred vessel at a constant perature rate 18C/min. The T was determined byg
temperature (2560.28C). A high sensitivity conduc- the midpoint method.tivity electrode (Knick ZU6985, Knick GmbH, Ger-many) was used to monitor the release. In some with 3.8. Surface characterizationa large number of pellets experiments also the pH ofthe release medium was monitored (electrode: SEM photographs (JEOL 6301, Japan) were takenHamilton gel-plast, pH meter: Consort p614, Con- of the coated pellets to evaluate the coating quality.sort, Belgium).
4. Results and discussion3.5. Water sorption measurements
4.1. Coating characterizationFree films of the coating were prepared with a
casting apparatus (RK print-coat instruments Ltd.,The crosslinking changes the solubility behavior
Royston, UK). Small pieces from these free filmsof the coating. The untreated coatings disintegrate
were cut out and the thickness and surface area werefast but the crosslinked coatings swell to a hydrogel-
measured. The water sorption characteristics of theselike state. This hydrogel does not dissolve, dis-
free films were determined gravimetrically with theintegrate or fail mechanically during the release
use of a Surface Measurement Systems Dynamicexperiments. This is illustrated in Fig. 1c where a
Vapor Sorption apparatus (DVS-1000, SMS Ltd.,photograph of pellets with 154 w/w% coating
UK).immersed in water for 45 min is shown. Almost all
The uptake of pure water of the crosslinked filmsthe pellets show a swollen but intact coating.
was determined by immersing free films in water ofAlso shown in the same figure are two SEM
258C. After fixed time intervals the films werephotographs (Fig. 1b and c) of two pellets with an
removed from the water and weighed after carefullyequal amount of coating as the pellets in Fig. 1a but
drying the films with a paper tissue.in a dry state. No major cracks or pinholes can bedetected on the photographs.
3.6. Swelling measurements The amount of material (polymer, crosslinker orplasticizer) that diffuses out of the coating during a
The swelling of the coating as a function of the release cycle was determined by measuring thewater content was determined by bringing a free film weight loss of a free film before and after immersionat equilibrium at a certain given outside water in water. The time that the film was immersed wasactivity. The outside water activities were established equal to the time needed to complete the releaseusing saturated salt solutions. Subsequently the in- cycle for that coating thickness. It was found that thecrease in thickness and surface area of the film were amount of material diffusing out of the coating inmeasured with a microscope (Nikon SMZ-U, Nikon, that period is negligible (,0.560.3 w/w%, weightJapan) a digital camera (Sony DXC-151P, Sony, loss determined of five free films) for a free film withJapan) and imaging analysis software (Sigma Scan a thickness of 150 mm. This weight loss increases toPro 3.0, Jandel Scientific, USA). 1062 w/w% after 2 days immersion in water.

P.J.A. Hartman Kok et al. / Journal of Controlled Release 66 (2000) 293 –306 299
Fig. 1. (a–b) SEM photographs of dry pellets coated with 154 w/w% coating (percentage coating based on core weight). (c) A photographof pellets with 154 w/w% coating immersed in water after the release cycle was completed (45 min). The transparant part is the coating, thewhite part the core.
4.2. Influence of coating thickness and curing time monitored during the release cycle of the pellets. Itwas seen that the pH does not change significantly
The influence of the coating thickness on the from neutral during the release cycle. Also therelease properties is given in Fig. 2. The coating release of the formulation with 154 w/w% coatingthickness given in the figure can be calculated was measured in a 0.05 M Na HPO /KH PO2 4 2 4
because the mass, and thus the volume, of the buffer (pH56.8) which gave the same result as theapplied coating is known and assuming this volume release experiments in demineralised water.of coating is evenly distributed around sphericalpellets this corresponds to a certain coating thick-ness. In this calculation we take as the diameter of 4.3. Single pellet measurements.the pellets the average diameter of the sieve fractionused in the coating experiments: 0.65 mm. To achieve a better insight into the deviation of
The level of UV curing determines the lag-time the release of individual pellets the release profiles ofuntil a certain maximum lag-time is reached; this is several individual pellets were determined. Theshown in Fig. 3. result is given in Fig. 4 which shows that the release
In some of the release experiments the pH was mechanism is reproducible and only causes a small
300 P.J.A. Hartman Kok et al. / Journal of Controlled Release 66 (2000) 293 –306
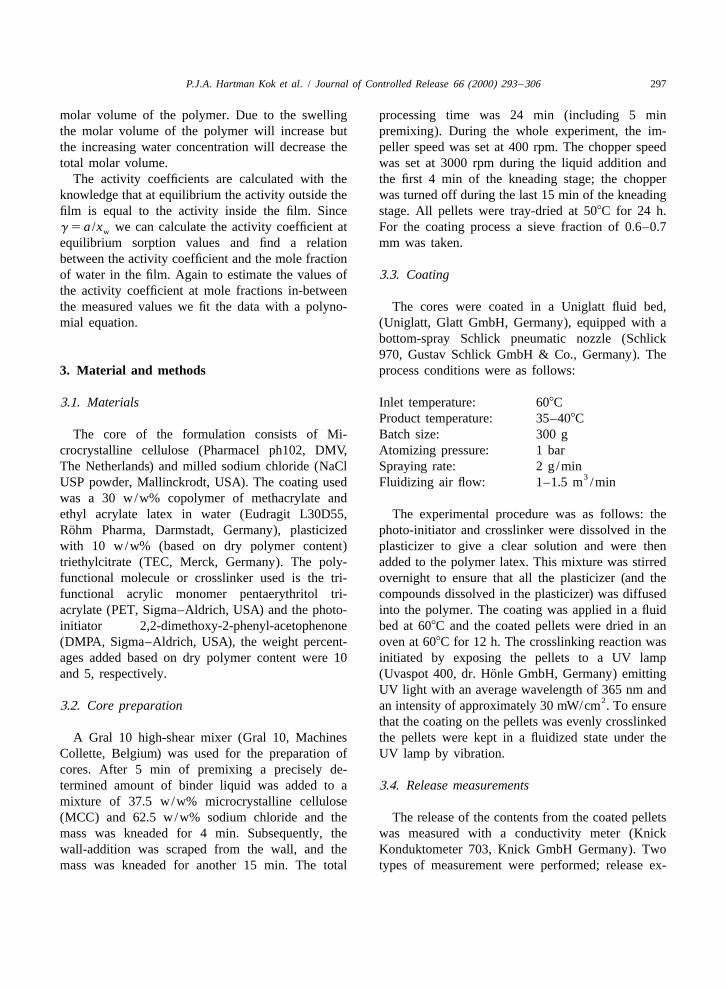
Fig. 2. Release profiles for 3 g of NaCl /MCC pellets (0.6–0.7 mm) coated with different levels of Eudragit L30D55 and crosslinked withUV light of 365 nm for 10 min. Weight percentages coating are based on the weight of the core. Error bars denote standard deviation in twoindependent coating experiments.
deviation in the lag-time, the slope of the release activity of 0.9 the water uptake increases dramatical-curves is equal for all the pellets. ly.
4.4. Sorption measurements 4.5. Swelling and DSC measurements
In Fig. 5 the water uptake is given as a function of In Fig. 6 the relative swelling of the coating isthe water activity. It is seen that above a water given as a function of the water content of a
Fig. 3. The influence of the UV curing time on the release of a formulation with a 70 w/w% or 90 mm thick Eudragit L30D55 coating.
P.J.A. Hartman Kok et al. / Journal of Controlled Release 66 (2000) 293 –306 301
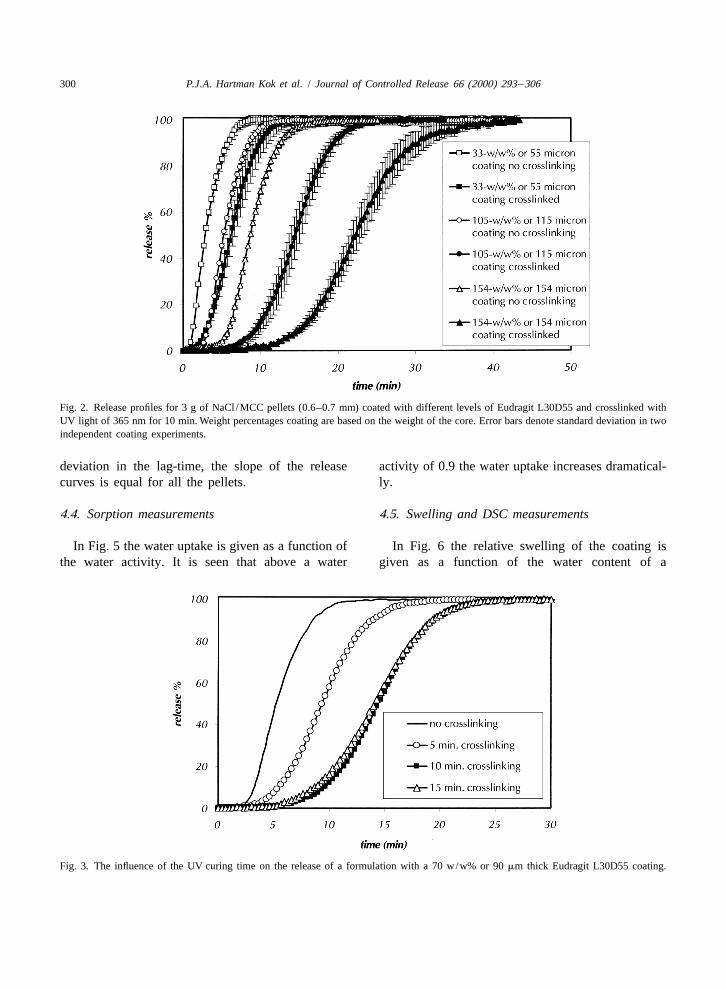
Fig. 4. Single pellet release measurements compared to the release of 3 g of pellets. Measurements for a formulation with 105 w/w% or 115mm thick UV crosslinked Eudragit L30D55 coating.
crosslinked coating. The relative swelling is calcu- In Table 1 the glass transition temperature as alated by Eq. (13). function of the water activity is given. It is seen that
the largest decrease in T is above a water activity ofgrelative increase in volume 0.9.
Concluding it can be said that above an outsidevolume wet 2 volume dry]]]]]]]5 1 1 (13) water activity of approximately 0.9, corresponding tovolume dry
a mole fraction of water in the film of approximatelyAs with the sorption measurements it is seen that the 0.67, the glass transition temperature drops belowmajor part of the swelling takes place at the higher room temperature. This has as an effect that thewater activities. polymer takes up more water and starts to swell.
Fig. 5. Equilibrium water uptake for a crosslinked Eudragit L30D55 coating, water-percentage based on dry polymer weight. Error barsdenote the standard deviation in the water uptake from five independent sorption experiments.

302 P.J.A. Hartman Kok et al. / Journal of Controlled Release 66 (2000) 293 –306
Fig. 6. Relative increase volume at equilibrium as a function of the water content of a crosslinked Eudragit L30D55 film. Error bars denotethe standard deviation in the water uptake from four independent swelling experiments.
4.6. Diffusion coefficient trend is an increase in the diffusion coefficients atthese high water contents the Fick diffusion co-
The result of the calculation of the Fick and efficients are not reliable at high water concen-Maxwell–Stefan diffusion coefficients is given in trations. This was expected because the level ofFig. 7. swelling of the polymer cannot be neglected at
In the activity range 0.1 to 0.7 the three diffusion higher water contents and thus the assumption of nocoefficients all show the same behavior. The diffu- swelling is not valid anymore.sion coefficient is more or less constant till a water In Fig. 8 the Maxwell–Stefan diffusion coefficientactivity of 0.4 and decreases from a water activity of is given as a function of the mole fraction water in0.4 on. From an outside water activity of 0.7 on the the polymer. The initial decrease in the diffusiondiffusion coefficients increase, and at a water activity coefficient (below a water activity of 0.4) is some-of 0.9 (when the glass transition temperature has what surprising because most findings in the litera-fallen below room temperature) the Fick diffusion ture describe an increasing diffusion coefficient withcoefficients decrease again but the Maxwell–Stefan increasing water concentration. However, one mustcoefficients continue to increase. Since the expected keep in mind that the material under investigation is
not a pure component but a mixture of severalcomponents and thus the interaction with water is
Table 1more complicated than most situations described inGlass transition temperature as a function of the water activity forthe literature with pure polymers.a crosslinked Eudragit L30D55 film, T is the average ofg
measurements on three films Because of experimental limitations no estimate ofthe diffusion coefficient can be given at watera (2) T (8C) 6g
activities higher than 0.97. A relation developed by0 102 1
Mackie and Meares [20] (Eq. (14)) gives an estimate0.75 49 0.3in this region. The equation is based on a lattice0.80 44 0.4
0.90 29 1 model with geometric obstruction. In this equation0.95 21 0.5 D is the self-diffusion coefficient of the solute01.0 21 0.5 (water) and F the polymer volume fraction.

P.J.A. Hartman Kok et al. / Journal of Controlled Release 66 (2000) 293 –306 303
Fig. 7. Diffusion coefficients calculated by Fick’s law and Maxwell–Stefan as a function of the outside water activity. Error bars denotestandard deviation in the calculated diffusion coefficients from three independent sorption experiments.
data as well as data obtained by molecular dynamics21 2 F]]S DD(f)[D ? (14) simulation. As can be seen from Fig. 8 the Mackie0 1 1 F
and Meares equation only gives a result similar toThe equation fits the results of Muller-Platte [21] and our experimental results at very high water con-Petit [22] reasonably well (diffusion of water in centrations, which was expected because the equa-swollen polyvinylalcohol membranes), experimental tion was developed for this region.
Fig. 8. Maxwell–Stefan diffusion coefficient for a crosslinked Eudragit L30D55 film as a function of the mole fraction water in the film,compared to a theoretical prediction developed by Mackie and Meares.
304 P.J.A. Hartman Kok et al. / Journal of Controlled Release 66 (2000) 293 –306
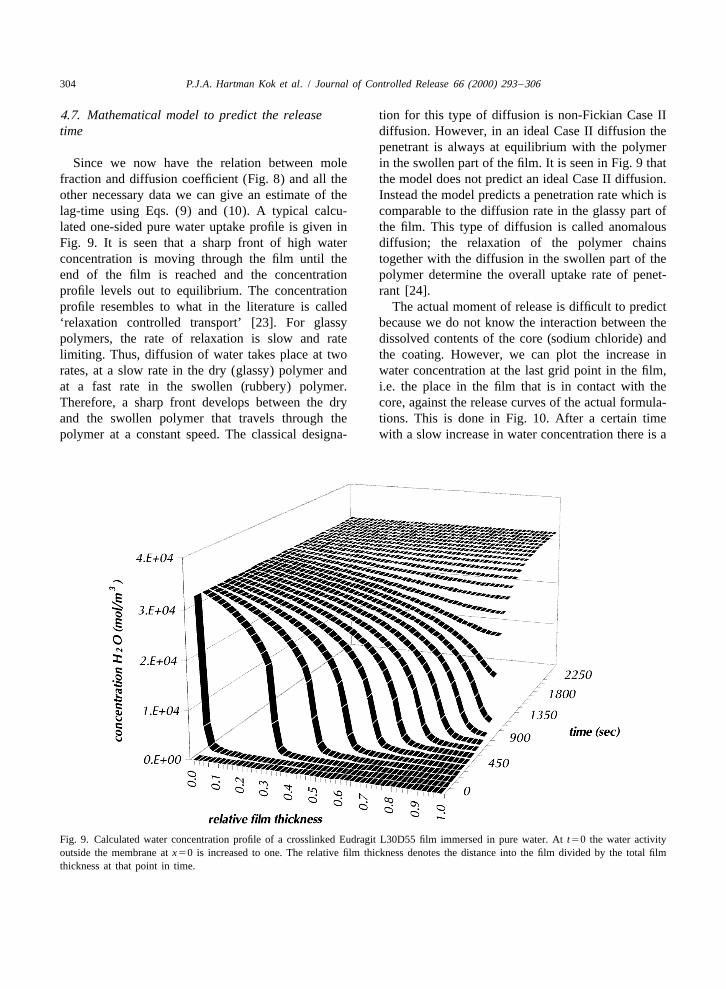
4.7. Mathematical model to predict the release tion for this type of diffusion is non-Fickian Case IItime diffusion. However, in an ideal Case II diffusion the
penetrant is always at equilibrium with the polymerSince we now have the relation between mole in the swollen part of the film. It is seen in Fig. 9 that
fraction and diffusion coefficient (Fig. 8) and all the the model does not predict an ideal Case II diffusion.other necessary data we can give an estimate of the Instead the model predicts a penetration rate which islag-time using Eqs. (9) and (10). A typical calcu- comparable to the diffusion rate in the glassy part oflated one-sided pure water uptake profile is given in the film. This type of diffusion is called anomalousFig. 9. It is seen that a sharp front of high water diffusion; the relaxation of the polymer chainsconcentration is moving through the film until the together with the diffusion in the swollen part of theend of the film is reached and the concentration polymer determine the overall uptake rate of penet-profile levels out to equilibrium. The concentration rant [24].profile resembles to what in the literature is called The actual moment of release is difficult to predict‘relaxation controlled transport’ [23]. For glassy because we do not know the interaction between thepolymers, the rate of relaxation is slow and rate dissolved contents of the core (sodium chloride) andlimiting. Thus, diffusion of water takes place at two the coating. However, we can plot the increase inrates, at a slow rate in the dry (glassy) polymer and water concentration at the last grid point in the film,at a fast rate in the swollen (rubbery) polymer. i.e. the place in the film that is in contact with theTherefore, a sharp front develops between the dry core, against the release curves of the actual formula-and the swollen polymer that travels through the tions. This is done in Fig. 10. After a certain timepolymer at a constant speed. The classical designa- with a slow increase in water concentration there is a
Fig. 9. Calculated water concentration profile of a crosslinked Eudragit L30D55 film immersed in pure water. At t50 the water activityoutside the membrane at x50 is increased to one. The relative film thickness denotes the distance into the film divided by the total filmthickness at that point in time.

P.J.A. Hartman Kok et al. / Journal of Controlled Release 66 (2000) 293 –306 305
Fig. 10. Experimental release curves compared to the calculated relative concentration profiles at the boundary between coating and core atdifferent coating levels. A 100% water concentration denotes the equilibrium concentration of water in the film.
fast increase in the concentration at the last grid Referencespoint in the film. This time period coincides with the
[1] F. Theeuwes, in: L.F. Prescott, W.S. Nimmo (Eds.), Trig-lag-time of the different coating levels. Thus, it isgered, Pulsed and Programmed Drug Delivery, John Wiley &save to say that the model gives an excellentSons Ltd, Chichester, 1989, pp. 323–340.prediction of the lag-time at a certain coating thick-
[2] E.G. Cornelissens, Detergent Composition Containing anness. Alkali Carbonate, US patent 4210550, July 1, 1980.
[3] E.K. Markussen, P. Falholt, Enzyme Containing Granulateand Method for Production Thereof, WO 90/09440, August23, 1990.5. Conclusions
[4] K.E. Olson, Water Insoluble Encapsulated EnzymesProtected Against Deactivation by Halogen Bleaches, US
The formulation developed in this contribution is patent 4965012, October 23, 1990.successful in delivering a pulse-release of the con- [5] J. Jeffrey, J.S. Park, B. Stoddart, Detergents Containing a
Builder and a Delayed Release Enzyme, W095/28469,tents after a pre-determined lag-time. Both theOctober 26, 1995.coating thickness and the duration of the UV cross-
[6] Y. Ueda, T. Hata, Y. Hisami, S. Ueda, M. Kodani, Timelinking time can be used to adjust the lag-time. Controlled Explosion Systems and Process for Preparing the
There is an increase in the Maxwell–Stefan diffu- Same, US patent 4871549, October 3, 1989.sion coefficients of water in the polymer at high [7] S. Ueda, T. Hata, S. Asakura, H. Yamaguchi, M. Kotani, Y.
Ueda, Development of a novel drug release system, timewater concentrations, which is expected due tocontrolled explosion system (TES). I. Concept and design, J.swelling of the polymer. The diffusion is rate-limitedDrug Target. 2 (1) (1994) 35–44.
by both the relaxation of the polymer chains and the [8] S. Ueda, R. Ibuki, S. Kimura, S. Murata, T. Takahashi, Y.diffusion in the swollen part. The mathematical Tokunaga, T. Hata, Development of a novel drug releasemodel gives a good estimation of the lag-time. system, time controlled explosion system (TES). III. Rela-
306 P.J.A. Hartman Kok et al. / Journal of Controlled Release 66 (2000) 293 –306
tion between lag time and membrane thickness, Chem. Application Properties of Polymethacrylate Coating Systems,Pharm. Bull. 42 (2) (1994) 364–367. Marcel Dekker Inc, New York, 1989, pp. 153–245.
[9] S. Ueda, H. Yamaguchi, M. Kotani, S. Kimura, Y. Tokunaga, [16] L.H. Sperling, Interpenetrating Polymer Networks and Re-A. Kagayama, T. Hata, Development of a novel drug release lated Materials, Plenum Press, New York, 1981.system, time controlled explosion system (TES). II. Design [17] J.A. Wesselingh, Controlling diffusion, J. Control. Release 24of multiparticulate TES and in vitro drug release properties, (1993) 47–60.Chem. Pharm. Bull. 42 (2) (1994) 359–363. [18] J. Crank, G.S. Park, Diffusion in Polymers, Academic Press,
[10] P. Schultz, P. Kleinebudde, A new multiparticulate delayed London, 1986.release system. Part I: Dissolution properties and release [19] W.H. Press, S.A. Teukolsky, W.T. Vetterling, B.P. Flannery,mechanism, J. Control. Release 47 (1997) 181–189. Numerical Recipes in C, 2nd Edition, Cambridge University
[11] S. Narisawa, M. Nagata, C. Danyoshi, H. Yoshino, K. Press, Cambridge, 1988.Murata, Y. Hirakawa, K. Noda, An organic acid induced [20] J.S. Mackie, P. Meares, The diffusion of electrolytes in asigmoidal release system for oral controlled release prepara- cation-exchange resin membrane, Proc. R. Soc. Londontions, Pharm. Res. 11 (1) (1993) 111–116. A232 (1955) 498–509.
[12] S. Narisawa, M. Nagata, Y. Hirakawa, M. Kobayashi, H. [21] F. Muller-Plathe, Diffusion of water in swollen Polyvinylal-Yoshino, An organic acid induced sigmoidal release system cohol membranes studied by molecular dynamics simulation,for oral controlled release preparations. 2. Permeability J. Membrane Sci. 141 (1998) 147–154.enhancement of Eudragit RS coating led by the physico- [22] J.M. Petit, X.X. Zhu, P.M. MacDonald, Solute probe diffu-chemical interactions with organic acid, J. Pharm. Sci. 85 (2) sion in aqueous solutions of poly(vinyl alcohol) as studied by(1996) 184–188. pulsed-gradient spin-echo NMR spectroscopy, Macromole-
[13] A. Gazzaniga, P. Iamartino, G. Maffione, M.E. Sangalli, Oral cules 29 (1996) 70–76.delayed-release system for colonic specific delivery, Int. J. [23] N.J.M. Kuipers, Thesis, Gas–Solid Hydroxyethylation ofPharm. 108 (1994) 77–83. Potato Starch, University of Groningen, 1995.
[14] M.A. Wheatley, R.S. Langer, H.N. Eisen, System for Con- [24] N.J.M. Kuipers, A.A.C.M. Beenackers, Non-Fickian diffu-trolled Release of Biologically Active Compounds, US sion with chemical reaction in glassy polymers with swellingpatent 4933185, June 12, 1990. induced by the penetrant: a mathematical model, Chem. Eng.
[15] K.O.R. Lehmann, in: J.W. McGinity (Ed.), Chemistry and Sci. 48 (16) (1993) 2957–2971.


![Predicting the coefficient of restitution of impacting ... the coefficient of... · Predicting the coefficient of restitution of impacting elastic-perfectly plastic spheres [23]](https://img.dokumen.tips/doc/110x75/5ee3db26ad6a402d666d6c2d/predicting-the-coeficient-of-restitution-of-impacting-the-coefficient-of.jpg)