Embed Size (px)
Citation preview

A Case Study of Nearshore Drag Coefficient Behavior during Hurricane Ike (2008)
BRIAN C. ZACHRY* AND JOHN L. SCHROEDER
Wind Science and Engineering Research Center, Texas Tech University, Lubbock, Texas
ANDREW B. KENNEDY AND JOANNES J. WESTERINK
Department of Civil and Environmental Engineering and Earth Sciences, University of Notre Dame, Notre Dame, Indiana
CHRIS W. LETCHFORD
Department of Civil and Environmental Engineering, Rensselaer Polytechnic Institute, Troy, New York
MARK E. HOPE
Department of Civil and Environmental Engineering and Earth Sciences, University of Notre Dame, Notre Dame, Indiana
(Manuscript received 30 November 2012, in final form 26 March 2013)
ABSTRACT
Over the past decade, numerous field campaigns and laboratory experiments have examined air–sea mo-
mentum exchange in the deep ocean. These studies have changed the understanding of drag coefficient be-
havior in hurricane force winds, with a general consensus that a limiting value is reached. Near the shore, wave
conditions are markedly different than in deep water because of wave shoaling and breaking processes, but
only very limited data exist to assess drag coefficient behavior. Yet, knowledge of the wind stress in this region
is critical for storm surge forecasting, evaluating the low-level wind field across the coastal transition zone, and
informing the wind load standard along the hurricane-prone coastline. During Hurricane Ike (2008), a Texas
Tech University StickNet platform obtained wind measurements in marine exposure with a fetch across the
Houston ship channel. These data were used to estimate drag coefficient dependence on wind speed. Wave
conditions in the ship channel and surge level at the StickNet location were simulated using the Simulating
Waves Nearshore Model coupled to the Advanced Circulation Model. The simulated waves were indicative
of a fetch-limited condition with maximum significant wave heights reaching 1.5m and peak periods of 4 s. A
maximum surge depth of 0.6m inundated the StickNet. Similar to deep water studies, findings indicate that
the drag coefficient reaches a limiting value at wind speeds near hurricane force. However, at wind speeds
below hurricane force, the drag coefficient is higher than that of deep water datasets, particularly at the
slowest wind speeds.
1. Introduction
Over 37 million people currently live in hurricane-
prone coastal regions stretching from Texas to North
Carolina and a continued increase in population is in-
evitable. As a result, there is an urgent need for nearshore
observations of surface layer quantities to improve hur-
ricane storm surge forecasting and to accurately define
wind-loading provisions in theAmerican Society of Civil
Engineers (ASCE) standard for this critical region.Over
the past decade, numerous field and laboratory experi-
ments have examined air–sea momentum exchange in
the deep ocean during hurricane conditions, but there is
a significant gap in our understanding in shallow water
and near the coast.
The transfer of momentum from the air to the sea is
described in terms of a 10-mdrag coefficientCD defined as
CD 5 to/(raU210)5 u2*/U
210 , (1)
where ra is the density of air, to is the surface wind stress,
u* is the shear velocity, and U10 is the mean wind speed
*Current affiliation:National HurricaneCenter,Miami, Florida.
Corresponding author address: Brian C. Zachry, Storm Surge
Unit, National Hurricane Center, Miami, FL 33165.
E-mail: [email protected]
SEPTEMBER 2013 ZACHRY ET AL . 2139
DOI: 10.1175/JAMC-D-12-0321.1
� 2013 American Meteorological Society

measured at 10m. Powell et al. (2003) andDonelan et al.
(2004) found that CD increases with increasing wind
speed and reaches a limiting value of around 0.0025 near
hurricane force. Black et al. (2007) found that CD satu-
rates to a value of 0.0018 at wind speeds of 22–23m s21.
The limiting nature of the drag coefficient has been at-
tributed to the effects of spray droplets acting to limit
turbulent mixing along with surface tension effects asso-
ciated with a surface emulsion consisting of a deep layer
of foam, and in short-fetch conditions, saturation is likely
a result of airflow separation from the dominant waves
(e.g., Powell et al. 2003; Kudryavtsev and Makin 2007).
Near the shore, wave interaction with the local ba-
thymetry causes wave conditions to be markedly dif-
ferent from those in deep water due to wave shoaling
and breaking transformation processes. At present,
nearshore wind stress is not completely understood and
only a few studies exist on this topic. Anctil andDonelan
(1996) observed increased drag over shoaling waves
compared to both deep water and breaking waves in
Lake Ontario. For wind speeds of around 14m s21, they
estimated the shoaling wave drag to be 0.0028, which is
higher than deep water values at similar wind speeds.
Data reported in Powell (2008) also suggest increased
drag in the nearshore region. Based on these studies and
the wave condition differences stated above, it is be-
lieved that deep water wind stress parameterizations do
not allow for reliable estimation of the nearshore wind
setup and are a potential culprit for the inaccurate pre-
dictions of storm surge.
The work presented here aims to advance our un-
derstanding of momentum exchange at the coast and
in complex wave conditions. Rare measurements of
hurricane winds in marine exposure were obtained by
a Texas Tech University rapidly deployable surface
weather observing station, termed StickNet (Weiss and
Schroeder 2008), during the passage of Hurricane Ike in
2008. The StickNet platform was inundated by surge
during the peak of the storm with a predominant wind
direction arriving from the 3-km-wide Houston ship
channel. The surge at the station and wave conditions
in the channel were estimated using a coupled wave
and circulation approach via Simulating Waves Near-
shore (SWAN) and the Advanced Circulation Model
(ADCIRC), denoted SWAN1ADCIRC (Dietrich et al.
2011a,b). This work examines coastal drag coefficient
behavior for wind speeds reaching hurricane force.
2. Field instrumentation and surge hindcast
A total of 24 StickNet weather stations were deployed
during Hurricane Ike. One of the StickNet platforms
(denoted StickNet 110A) was deployed in an open grassy
area in Fort Travis Seashore Park on the Bolivar Penin-
sula (29.3637088N, 94.7592348W), near Galveston, Texas,
to measure onshore winds in the eyewall (Fig. 1). The
wind data collected from StickNet 110A provide the
foundation for this work. Wind speed and direction
were measured at a height of 2.25m with a sampling
frequency of 5Hz using an R. M. Young Co. wind
monitor. The station was deployed about 90m from the
water at mean tide at an elevation of approximately
3.7m relative to the North American Vertical Datum of
1988 (NAVD88). Ike’s center of circulation roughly
passed directly over StickNet 110A, allowing for ‘‘classic’’
time histories of wind speed and direction indicative of
the passage of the hurricane eye (Fig. 2). During landfall
of Ike’s southern eyewall, wind directions were from 1908to 2308. The wind fetch was from theGulf ofMexico, then
across Galveston and Pelican Islands, across the Houston
ship channel, and finally onto theBolivar Peninsula, where
the wind measurements were sampled (Fig. 3). The de-
rived surface layer quantities presented below are rep-
resentative of the flow transitioning over these surfaces
and ultimately the wave roughness in the ship channel.
Unlike the open ocean where both National Oceanic
and Atmospheric Administration buoys and rapid-
response gauges (e.g., Kennedy et al. 2010) provided wave
observations during Ike’s landfall, no such gauges existed
in the ship channel. Hence, the authors simulated thewave
and surge conditions using a SWAN1ADCIRC hindcast
of Hurricane Ike. The simulation was conducted on
the SL16 1 TX grid, which is an unstructured, finite-
element mesh that contains 9 228245 nodes and 18300169
elements. The hindcast was run for a total of 39 days,
FIG. 1. StickNet 110A deployed in Fort Travis Seashore Park,
Bolivar Peninsula, Texas, during Hurricane Ike (2008). The pho-
tograph was taken by the Galveston County Office of Emergency
Management during retrieval of StickNet 110A facing southwest
toward the Houston ship channel.
2140 JOURNAL OF APPL IED METEOROLOGY AND CL IMATOLOGY VOLUME 52

which included Hurricanes Gustav and Ike and a spinup
time of 18 days to allow the tidal signal to be replicated
with constituents K1, O1, M2, S2, N2, K2, Q1, and P1.
Surface stresseswere calculated using anOceanWeather,
Inc., representation of the wind field (Powell et al. 1996,
1998, 2010; Powell and Houston 1996) and a drag
coefficient formulation following Garratt (1977) with
the radial dependence of Powell (2008). The drag co-
efficient formulation found herein was not applied in the
hindcast due to the circular nature of this result and to
the fact that a sensitivity study will be provided in a fol-
lowing paper. Initial water levels were raised by 0.280m
to adjust for seasonal expansion and the vertical datum
adjustment, and the river flux in the Mississippi was set
to 12 318m3 s21. Wave- and water-level properties were
saved at hourly intervals for the analysis. A complete
validation of the SWAN1ADCIRC hindcast is provided
in Hope et al. (2013) in which they found the coefficient
of determination to be 0.91 between the observed and
modeled high-water marks.
The bathymetry of the channel is not representative
of a typical shoreline, where waves propagate toward
the shore from oceanic deep water. Near the edges the
channel is shallow, but drops off quickly to approxi-
mately 14m deep with a slope of 2.5:1. In the center of
the channel (29.350 3358N, 94.771 2478W), the simulated
waves were indicative of a fetch-limited condition with
maximum significant wave heights reaching 1.5m and
peak periods of 4 s (Fig. 4). A maximum water level of
4.17-m NAVD88 was hindcast in the channel. At the
StickNet, the simulated surge reached a height of 4.3 m
NAVD88 or roughly 0.6m above local ground, which is
FIG. 2. Raw 1-min wind speed (black solid line) and wind direc-
tion (gray circles) time records (at 2.25m) obtained from StickNet
110A during Hurricane Ike (2008). Landfall is denoted by the ver-
tical dashed line.
FIG. 3. The observed path of Hurricane Ike (2008), the wind fetch (wind directions of 1908–2308) used in the analysis, modeled wave heights in the ship channel using SWAN1ADCIRC,
and observed waves offshore in the Gulf of Mexico.
SEPTEMBER 2013 ZACHRY ET AL . 2141

in agreement with a high-water mark of 0.6m measured
on the StickNet. In other words, roughly 1.65m of
StickNet 110A was above the water surface during the
peak of the surge and hence the anemometer height was
1.65m at this time.
3. Methodology
a. StickNet 110A wind measurements
StickNet 110A measured tropical cyclone winds with
a fetch across numerous changes in land and marine
exposures. Wind flow interaction with these varying
surface roughness regimes leads to complex internal
boundary layer (IBL) interaction and transition. Based
on numerous relationships for IBL growth (e.g., Peterson
1969; Wood 1982; Arya 1988; Stull 1988; Kaimal and
Finnigan 1994; Powell et al. 1996; Simiu and Scanlan
1986; Holmes 2001; Savelyev and Taylor 2005), and as-
suming the lowest 10% of the IBL depth is fully adjusted,
StickNet 110A measured marine-type winds associated
with the wave conditions (marine roughness) in the
Houston ship channel. Many of the IBL growth equa-
tions provided in the literature are based on measure-
ments for specific roughness transitions, and the authors
are not generally aware of any literature that directly
applies to the fetch scenario and wind speeds analyzed
herein. Although unlikely, a minimal impact of the up-
stream roughness on the sampled IBL cannot be com-
pletely ruled out because of the complex IBL transition
analyzed (e.g., Schmid and Oke 1990).
Since the StickNet stations only collect single-level u–y
wind data, the turbulence intensity (TI) method was uti-
lized to estimate the roughness length (Beljaars 1987).
Turbulence intensity is a measure of the fluctuating
component of the wind. In general terms, TI charac-
terizes the intensity of gusts in the flow, and is defined as
the ratio of the standard deviation of the fluctuating
component of the wind to the mean wind speed. By
substituting TI into the log law, zo and CD are computed
as follows:
zo 5 za exp
�2
1
TI
�and CD 5 k2
�ln
�zazo
��22
, (2)
where za 5 2.25m is the anemometer height (on dry
land) and k 5 0.4 is the von K�arm�an constant. The TI
method can be applied to wind data based on two main
assumptions. First, this method assumes that a loga-
rithmic wind profile exists. Overwater dropsonde data
from Powell et al. (2003) and Powell (2008) show that
a logarithmic wind profile exists in tropical cyclones.
Second, the method assumes that the ratio of the stan-
dard deviation of the wind to the friction velocity is 2.5
(e.g., Counihan 1975; Beljaars 1987). Conceptually, this
ratio simply states that boundary layer turbulence is
purely driven mechanically with no contribution from
buoyant processes. Although this ratio is well estab-
lished in the published literature (e.g., Barthelmie et al.
1993, Letchford et al. 2001; Paulsen and Schroeder
2005), there is uncertainty around its value and future
research projects aimed at establishing this are greatly
needed. Regardless of the uncertainty in the 2.5 as-
sumption, this ratio has provided comparable results to
other methodologies (e.g., Barthelmie et al. 1993).
The TI varies based on averaging time (Schroeder
et al. 1998). To determine where TI stabilizes, the wind
speed record was windowed into various averaging
times, and mean, maximum, and minimum values were
computed (Fig. 5). An averaging time of 2min was
FIG. 4. SWAN1ADCIRC hindcast of significant wave height
(solid line) and peak period (dashed line) in the center of the
Houston ship channel during Hurricane Ike.
FIG. 5. Dependency of the total TI on averaging time. The 2-min
averaging time used in this study is denoted by the vertical dashed
line.
2142 JOURNAL OF APPL IED METEOROLOGY AND CL IMATOLOGY VOLUME 52
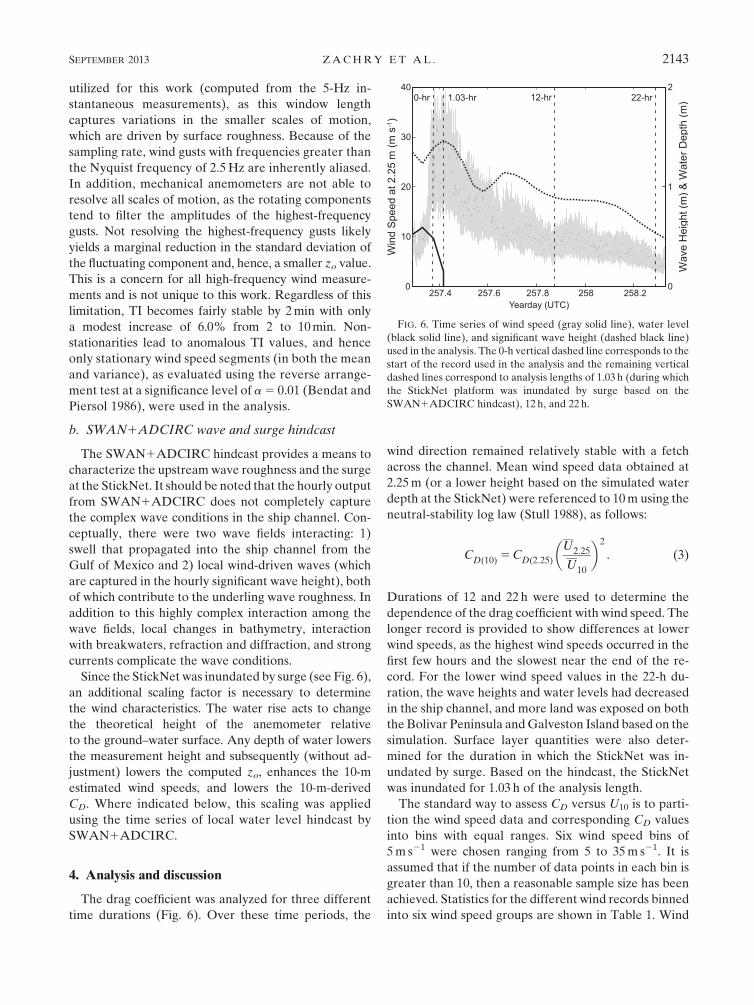
utilized for this work (computed from the 5-Hz in-
stantaneous measurements), as this window length
captures variations in the smaller scales of motion,
which are driven by surface roughness. Because of the
sampling rate, wind gusts with frequencies greater than
the Nyquist frequency of 2.5Hz are inherently aliased.
In addition, mechanical anemometers are not able to
resolve all scales of motion, as the rotating components
tend to filter the amplitudes of the highest-frequency
gusts. Not resolving the highest-frequency gusts likely
yields a marginal reduction in the standard deviation of
the fluctuating component and, hence, a smaller zo value.
This is a concern for all high-frequency wind measure-
ments and is not unique to this work. Regardless of this
limitation, TI becomes fairly stable by 2min with only
a modest increase of 6.0% from 2 to 10min. Non-
stationarities lead to anomalous TI values, and hence
only stationary wind speed segments (in both the mean
and variance), as evaluated using the reverse arrange-
ment test at a significance level of a5 0.01 (Bendat and
Piersol 1986), were used in the analysis.
b. SWAN1ADCIRC wave and surge hindcast
The SWAN1ADCIRC hindcast provides a means to
characterize the upstreamwave roughness and the surge
at the StickNet. It should be noted that the hourly output
from SWAN1ADCIRC does not completely capture
the complex wave conditions in the ship channel. Con-
ceptually, there were two wave fields interacting: 1)
swell that propagated into the ship channel from the
Gulf of Mexico and 2) local wind-driven waves (which
are captured in the hourly significant wave height), both
of which contribute to the underling wave roughness. In
addition to this highly complex interaction among the
wave fields, local changes in bathymetry, interaction
with breakwaters, refraction and diffraction, and strong
currents complicate the wave conditions.
Since the StickNet was inundated by surge (see Fig. 6),
an additional scaling factor is necessary to determine
the wind characteristics. The water rise acts to change
the theoretical height of the anemometer relative
to the ground–water surface. Any depth of water lowers
the measurement height and subsequently (without ad-
justment) lowers the computed zo, enhances the 10-m
estimated wind speeds, and lowers the 10-m-derived
CD. Where indicated below, this scaling was applied
using the time series of local water level hindcast by
SWAN1ADCIRC.
4. Analysis and discussion
The drag coefficient was analyzed for three different
time durations (Fig. 6). Over these time periods, the
wind direction remained relatively stable with a fetch
across the channel. Mean wind speed data obtained at
2.25m (or a lower height based on the simulated water
depth at the StickNet) were referenced to 10m using the
neutral-stability log law (Stull 1988), as follows:
CD(10) 5CD(2:25)
�U2:25
U10
�2
. (3)
Durations of 12 and 22 h were used to determine the
dependence of the drag coefficient with wind speed. The
longer record is provided to show differences at lower
wind speeds, as the highest wind speeds occurred in the
first few hours and the slowest near the end of the re-
cord. For the lower wind speed values in the 22-h du-
ration, the wave heights and water levels had decreased
in the ship channel, and more land was exposed on both
the Bolivar Peninsula andGalveston Island based on the
simulation. Surface layer quantities were also deter-
mined for the duration in which the StickNet was in-
undated by surge. Based on the hindcast, the StickNet
was inundated for 1.03 h of the analysis length.
The standard way to assess CD versus U10 is to parti-
tion the wind speed data and corresponding CD values
into bins with equal ranges. Six wind speed bins of
5m s21 were chosen ranging from 5 to 35m s21. It is
assumed that if the number of data points in each bin is
greater than 10, then a reasonable sample size has been
achieved. Statistics for the different wind records binned
into six wind speed groups are shown in Table 1. Wind
FIG. 6. Time series of wind speed (gray solid line), water level
(black solid line), and significant wave height (dashed black line)
used in the analysis. The 0-h vertical dashed line corresponds to the
start of the record used in the analysis and the remaining vertical
dashed lines correspond to analysis lengths of 1.03 h (during which
the StickNet platform was inundated by surge based on the
SWAN1ADCIRC hindcast), 12 h, and 22 h.
SEPTEMBER 2013 ZACHRY ET AL . 2143

directions are very similar for the strongest wind speeds
(within 208), showing that a very similar fetch existed
throughout the records. At slower speeds the winds have
a greater southerly component. This result is due to the
winds turning counterclockwise as the hurricane moved
north of the region late in the record.
Binned drag coefficients are plotted against wind
speed in Fig. 7. For the 12- and 22-h durations without
correction for water levels at the StickNet, the drag
coefficient increases with wind speed initially, reaches
a limiting value of 0.0022 at a wind speed near 28m s21,
and decreases for wind speeds above 28m s21. Com-
pared to the 12-h record, the drag coefficient is higher at
lower wind speeds for the 22-h record. For the 5–10m s21
wind speed bin, this result could be due to small sample
size or increased land exposure and hence roughness
near the end of the record as the water receded from the
Bolivar. When the correction for water level is taken
into account, only the highest two wind speeds bins are
affected. In the 30–35m s21 wind speed bin, the drag
coefficient increase minimally from the noncorrected
analysis and in the 25–30m s21 bin the values decrease
more significantly. Regardless, a limiting value has been
reached, but data at higher wind speeds would be nec-
essary to confirm any trends beyond the threshold of
hurricane force winds.
Drag coefficients in this complex environment are
compared with previous studies in Fig. 7. The present
work is consistent with the deep water studies in thatCD
reaches a limiting value and either decreases or remains
relatively constant for higher wind speeds. In regard to
the wind speed that CD saturates, the coastal drag co-
efficient reached a limiting value at slower wind speeds
than Powell et al. (2003) andDonelan et al. (2004) and at
faster wind speeds thanBlack et al. (2007). There are not
sufficient data to compare the limiting values to the
nearshore values presented in Powell (2008).
Examination of Fig. 7 also reveals that coastal CD
values are significantly higher for wind speeds of less
than 25m s21. Powell et al. (2003) and Powell (2008)
indicate that deep and shallow water values decrease
rapidly for wind speeds below hurricane force. Crudely
extrapolating their results to slower winds, the drag co-
efficient would be markedly less than those obtained
here during Hurricane Ike. Laboratory observations
from Donelan et al. (2004) also indicate lower drags for
TABLE 1. Drag coefficient referenced to 10m for different wind speed bins and record lengths. Values are also reported with and
without the correction to the wind speeds via SWAN1ADCIRC hindcast water depths (indicated by the asterisk next to the wind speed
bins affected by this correction).
U10 bins (m s21)
Record Statistic 5–10 10–15 15–20 20–25 25–30 25–30* 30–35 30–35*
12 h No. of 2-min segments 13 108 90 33 49 42 18 25
Mean wind speed (m s21) 9.54 12.9 17.4 21.8 27.9 28.0 31.0 31.2
Std dev wind speed (m s21) 0.326 1.50 1.50 1.33 1.41 1.47 0.812 0.971
Mean wind direction (8) 211 213 219 214 217 216 220 220
Std dev wind direction (8) 1.56 3.60 4.70 2.06 5.56 5.52 6.67 6.10
Mean roughness length (mm) 0.760 1.68 1.77 2.14 2.37 1.87 2.11 2.23
Std dev roughness length (mm) 0.710 1.66 1.25 1.63 1.86 1.29 1.37 1.85
Mean drag coefficient 3 103 1.67 1.99 2.07 2.16 2.22 2.11 2.16 2.17
Std dev drag coefficient 3 103 0.362 0.434 0.343 0.365 0.370 0.310 0.353 0.394
22 h No. of 2-min segments 192 196 90 33 49 42 18 25
Mean wind speed (m s21) 8.55 12.1 17.4 21.8 27.9 28.0 31.0 31.2
Std dev wind speed (m s21) 1.07 1.50 1.50 1.33 1.41 1.47 0.812 0.971
Mean wind direction (8) 200 210 219 214 217 216 220 220
Std dev wind direction (8) 4.84 4.64 4.70 2.06 5.56 5.52 6.67 6.10
Mean roughness length (mm) 1.32 1.68 1.77 2.14 2.37 1.87 2.11 2.23
Std dev roughness length (mm) 1.26 1.65 1.25 1.63 1.86 1.29 1.37 1.85
Mean drag coefficient 3 103 1.89 1.99 2.07 2.16 2.22 2.11 2.16 2.17
Std dev drag coefficient 3 103 0.387 0.431 0.343 0.365 0.370 0.310 0.353 0.394
1.03 h No. of 2-min segments — — — — 15 15 12 12
Mean wind speed (m s21) — — — — 28.2 28.8 31.1 31.6
Std dev wind speed (m s21) — — — — 1.08 1.07 0.777 1.019
Mean wind direction (8) — — — — 223 222 225 225
Std dev wind direction (8) — — — — 3.03 3.09 4.02 3.49
Mean roughness length (mm) — — — — 2.72 2.03 2.19 1.97
Std dev roughness length (mm) — — — — 1.82 1.51 1.31 1.06
Mean drag coefficient 3 103 — — — — 2.31 2.14 2.20 2.15
Std dev drag coefficient 3 103 — — — — 0.359 0.344 0.307 0.283
2144 JOURNAL OF APPL IED METEOROLOGY AND CL IMATOLOGY VOLUME 52

lighter winds and that the trend in CD with increasing
wind speed is much steeper than the present study. This
result is likely a consequence of the fetch-limited and
complex wave conditions in the ship channel generating
a rough wave surface even under light-wind conditions.
5. Concluding remarks
Field observations of coastal wind measurements
were obtained during the passage of Hurricane Ike. It
was found that aerodynamic drag increased with wind
speed up to 28m s21, where a limiting value of 0.0022 is
reached. When wind speeds are corrected based on the
SWAN1ADCIRC hindcast water levels at the Stick-
Net, the drag coefficient levels off at slower wind speeds
of 22m s21. These results are similar to deep water
studies. Saturation of CD is likely a result of sea spray
and skimming flow as the waves are fetch limited and
very steep. At slower wind speeds, the drag coefficient
values are higher than those reported in any of the
comparison deep water studies. This result could be
a consequence of the complex wave conditions in the
channel creating a ‘‘rougher than normal’’ surface un-
der light to moderate winds. Similar relationships may
also exist in regions that exhibit complex bathymetry,
coastal formations that interfere with the local waves,
or other types of fetch-limited conditions. Based on
this analysis, storm surge models using a deep water
wind speed–dependent drag coefficient may be slightly
underestimating hurricane storm surge, and additional
forcing parameterizations are needed in such complex
roughness situations.
Based on recent air–sea interaction research, struc-
tures built on the hurricane-prone coast are currently
being designed to withstand wind loads specified by
Exposure D in ASCE 7-10 (i.e., flat, unobstructed areas
and water surfaces with associated roughness lengths of
5mm). The previous standard, ASCE 7-05, was set at
Exposure C (i.e., open terrain with scattered obstruc-
tions having heights generally less than 9.1m with as-
sociated roughness lengths of 20mm). In other words,
the hurricane-prone coast is now smoother from a
roughness perspective and structures must be designed
for higher wind loads (faster winds speeds). Data ob-
tained during Hurricane Ike in complex nearshore
conditions are in agreement with the shift to Exposure
D in this region, as mean zo values are on the order of
2mm. These findings suggest that similar wave envi-
ronments may also exhibit roughness values according
to ExposureD. This work also adds to the literature base
for ensuring reliable design standards in hurricane-
prone regions for all wave conditions.
Acknowledgments. Funding support for the lead
author was provided by the National Science Foun-
dation Interdisciplinary Graduate Research and Train-
ing (IGERT) program under Grant 0221688 and by
Texas Tech University.
FIG. 7. Drag coefficient dependence on wind speed for this study: (a) wind speeds not corrected for water level and (b) wind speeds
corrected for water level at the StickNet via SWAN1ADCIRC hindcast. Results are compared with shallow water values from Powell
(2008), open-ocean measurements from Powell et al. (2003) and Black et al. (2007), and simulated extreme winds in the laboratory from
Donelan et al. (2004). For Powell et al. (2003) the values are an average of the four mean boundary layer groups, and for Donelan et al.
(2004) the values are based on the momentum budget method.
SEPTEMBER 2013 ZACHRY ET AL . 2145

REFERENCES
Anctil, F., and M. A. Donelan, 1996: Air–water momentum flux
observations over shoaling waves. J. Phys. Oceanogr., 26,
1344–1353.
Arya, S. P., 1988: Introduction to Micrometeorology. Academic
Press, 307 pp.
Barthelmie, R. J., J. P. Palutikof, and T. D. Davies, 1993: Estima-
tion of sector roughness lengths and the effect on prediction
of the vertical wind speed profile. Bound.-Layer Meteor., 66,
19–47.
Beljaars, A. C. M., 1987: Themeasurement of gusts at routine wind
stations—A review. KNMI Scientific Rep. WR87-11, 50 pp.
Bendat, J. S., and A. G. Piersol, 1986: Random Data: Analysis and
Measurement Procedures. John Wiley and Sons, 556 pp.
Black, P. G., and Coauthors, 2007: Air–sea exchange in hurricanes:
Synthesis of observations from the coupled boundary layer
air–sea transfer experiment. Bull. Amer. Meteor. Soc., 88,
357–384.
Counihan, J., 1975: Adiabatic atmospheric boundary layers: A
review and analysis of data from the period 1880–1972. Atmos.
Environ., 9, 871–905.
Dietrich, J. C., and Coauthors, 2011a: Hurricane Gustav (2008)
waves and storm surge: Hindcast, synoptic analysis, and vali-
dation in southern Louisiana.Mon.Wea. Rev., 139, 2488–2522.
——, and Coauthors, 2011b: Modeling hurricane waves and storm
surge using integrally-coupled, scalable computations.Coastal
Eng., 58, 45–65.
Donelan, M. A., B. K. Haus, N. Ruel, W. J. Stianssnie, H. C.
Graber, O. B. Brown, and E. S. Saltzman, 2004: On the lim-
iting aerodynamic roughness of the ocean in very strongwinds.
Geophys. Res. Lett., 31, L18306, doi:10.1029/2004GL019460.
Garratt, J. R., 1977: Review of drag coefficients over oceans and
continents. Mon. Wea. Rev., 105, 915–929.
Holmes, J. D., 2001: Wind Loading of Structures. Spon Press,
392 pp.
Hope, M. E., and Coauthors, 2013: Hindcast and validation of
Hurricane Ike (2008) waves, forerunner, and storm surge.
J. Geophys. Res., doi:10.1002/jgrc.20314, in press.
Kaimal, J. C., and J. J. Finnigan, 1994: Atmospheric Boundary
Layer Flows: Their Structure and Measurement. Oxford Uni-
versity Press, 289 pp.
Kennedy, A. B., and Coauthors, 2010: Rapidly installed temporary
gauging for waves and surge, and application to Hurricane
Gustav. Cont. Shelf Res., 30, 1743–1752.
Kudryavtsev, V. N., and V. K. Makin, 2007: Aerodynamic rough-
ness of the sea surface at high winds. Bound.-Layer Meteor.,
125, 289–303.Letchford, C., A. Gardner, R. Howard, and J. Schroeder, 2001: A
comparison of wind prediction models for transitional flow
regimes using full-scale hurricane data. J. Wind Eng. Ind.
Aerodyn., 89, 925–945.
Paulsen, B. M., and J. L. Schroeder, 2005: An examination of
tropical and extratropical gust factors and the associated wind
speed histograms. J. Appl. Meteor., 44, 270–280.Peterson, E. W., 1969: Modification of mean flow and turbulent
energy by a change in surface roughness under conditions
of neutral stability. Quart. J. Roy. Meteor. Soc., 95, 561–
575.
Powell, M. D., 2008: High wind drag coefficient and sea surface
roughness in shallow water. NOAA/AOML Hurricane Re-
search Division Final Rep. to the Joint Hurricane Testbed,
24 pp. [Available online at http://www.nhc.noaa.gov/jht/07-
09reports/final_Powell_JHT08.pdf.]
——, and S. H. Houston, 1996: Hurricane Andrew’s landfall in
south Florida. Part II: Surface wind fields and potential real-
time applications. Wea. Forecasting, 11, 329–349.
——, S. Houston, and T. Reinhold, 1996: Hurricane Andrew’s
landfall in south Florida. Part I: Standardizing measurements
for documentation of surface wind fields.Wea. Forecasting, 11,
304–328.
——, L. Amat, and N.Morrisseau-Leroy, 1998: The HRD real-time
hurricanewind analysis system. J.WindEng. Ind.Aerodyn., 77–
78, 53–64.——, P. J. Vickery, and T. A. Reinhold, 2003: Reduced drag co-
efficient for high wind speeds in tropical cyclones.Nature, 422,
279–283.
——, and Coauthors, 2010: Reconstruction of Hurricane Katrina’s
wind fields for storm surge and wave hindcasting.Ocean Eng.,
37, 26–36.
Savelyev, S. A., and P. A. Taylor, 2005: Internal boundary layers:
I. Height formulae for neutral and diabatic flows. Bound.-
Layer Meteor., 115, 1–25.Schmid, H. P., and T. R. Oke, 1990: Amodel to estimate the source
area contributing to surface layer turbulence at a point over
patchy terrain. Quart. J. Roy. Meteor. Soc., 116, 965–988.
Schroeder, J. L., D. A. Smith, and R. E. Peterson, 1998: Variation
of turbulence intensities and integral scales during the passage
of a hurricane. J. Wind Eng. Ind. Aerodyn., 77–78, 65–72.
Simiu, E., and R. H. Scanlan, 1986:Wind Effects on Structures: An
Introduction to Wind Engineering. 2nd ed. John Wiley and
Sons, 589 pp.
Stull, R. B., 1988:An Introduction to BoundaryLayerMeteorology.
Kluwer Academic, 680 pp.
Weiss, C. C., and J. L. Schroeder, 2008: StickNet: A new portable
rapidly deployable surface observations system. Bull. Amer.
Meteor. Soc., 89, 1502–1503.Wood,D.H., 1982: Internal boundary layer growth following a step
change in surface roughness. Bound.-Layer Meteor., 22, 241–
244.
2146 JOURNAL OF APPL IED METEOROLOGY AND CL IMATOLOGY VOLUME 52

Copyright of Journal of Applied Meteorology & Climatology is the property of AmericanMeteorological Society and its content may not be copied or emailed to multiple sites orposted to a listserv without the copyright holder's express written permission. However, usersmay print, download, or email articles for individual use.