Embed Size (px)
Citation preview

Int. J. Electrochem. Sci., 8 (2013) 10473 - 10486
International Journal of
ELECTROCHEMICAL SCIENCE
www.electrochemsci.org
A Novel Iron(III) Selective Potentiometric Sensor Based on
9- Ethylacenaphtho [1, 2-B]Quinoxaline
F. Mizani1,*
, M.R. Ganjali2, *
, F. Faridbod2, S. Esmaeilnia
1
1 Department of Chemistry, Faculty of Science, Payame Noor University, PO Box 19395-3697 Tehran,
I. R. Iran 2 Center of Excellence in Electrochemistry, Faculty of Chemistry, University of Tehran, Tehran, Iran
*E-mail: [email protected]; [email protected]
Received: 31 May 2013 / Accepted: 9 July 2013 / Published: 1 August 2013
9-ethylacenaphtho[1,2-b]quinoxaline (EANQ) was synthesized and used as an active component for
fabrication of PVC-based polymeric membrane (PME) for sensing Fe3+
ions. The electrodes display a
Nernstian behavior (19.5±0.3mV decade−1
) over wide Fe3+
ion concentration ranges 2.3×10⁻⁷
-5.0×10⁻²
M with very low limits of detection (9.6×10⁻⁸
M). The electrodes have a relatively fast response time
(<25 s), a satisfactory reproducibility and relatively long life time. The proposed sensors show a fairly
good selectivity toward Fe3+
ion in comparison to other common cations. The potentiometric responses
are independent of the pH of the test solutions in the pH range 2.9–7.1. The practical utility of the
proposed electrodes have been demonstrated by their use in potentiometric titration of Fe3+
with
EDTA. It was also successfully applied in the determination of Ferric ions in aqueous samples and the
results obtained agreed with those obtained with atomic absorption spectrometer (AAS).
Keywords: Fe(III) ion-selective electrode; PVC membrane; 9-ethylacenaphtho[1,2-b]quinoxaline;
Potentiometry; sensors
1. INTRODUCTION
Iron is a vital element in the human body and is taking effective role in oxygen transport,
storage and also in electron transport [1,2]. The enzymes which are taking part in the synthesis of
amino acids, hormones and neurotransmitters need Fe3+
. There is around 10-15 mg of iron to be
exhibited in the food daily intake, and studies report that the normal subjects assimilate around 10% of
the amount of iron from the food [3]. Due to the deficiency of iron, the amount of red blood cells in the
body reduces and can be a cause of anemia. In addition, the surplus amount of iron is stored in the
heart, liver and other organs [4,5] and this extra iron cannot be spontaneously released from the body,

Int. J. Electrochem. Sci., Vol. 8, 2013
10474
but it is stored as mentioned above and can put other organs at risk of impairment [6]. Moreover,
excess or less iron pounds in the human body are also cancer causing factors [7]. It is therefore very
important for clinical, environmental and industrial purposes to efficiently detect Fe3+
ion.
There are many methods for the detection of iron ions such as atomic absorption spectroscopy
(AAS) [8], inductively coupled plasma (ICP) [9], etc. But these methods have many limitations such as
high cost and instability if a large number of samples analysis is needed [10,11]. Moreover, the
potentiometric based sensing method is simple, inexpensive, rapid and more reliable for the analysing
for ions detection. In the literature, it is also reported that ion selective electrodes (ISEs) was used for
the determination of cations as well as anions and also used for pharmaceutical compounds [12-22],
with some research also reported on Fe3+
detection [23-30]. It is clear that it is necessary to improve
the sensitivity of Fe3+
sensors and develop selective electrodes having relatively quick response for the
determination of the Fe3+
concentration; especially when small volumes of the sample is available.
In the present work, we used 9- ethylacenaphtho [1, 2-b] quinoxaline (EANQ, Figure 1) as an
excellent carrier in construction of a polymeric membrane (PME) for Iron ion. The influences of the
membrane positions on the potential response of the Fe3+
sensors were investigated.
N
N
Figure 1 Structure of ligand (EANQ)
The PME has limit of detection of 9.6×10⁻⁸
M. The potentiometric response of electrode is
independent of pH in the pH range of 2.9-7.1.
2. EXPERIMENTAL
2.1. Reagents
Reagent grade nitrophenyl octyl ether (NPOE), dibutyl phetalate (DBP), Benzylacetate (BA),
tetrahydrofuron (THF) and high relative molecular weight PVC call from Merck were used as
received. Nitrate slats of all cations used call from Merck were of the highest purity available and used
without any further purification except for vacuum drying over P2O5.Triply distilled deionized water
was used throughout.
2.2. Synthesis of ligand
A round-bottomed flask equipped with a magnet and condenser was charged with 4-
methylbenzene-1, 2-diamine (1.0 mmol), acenaphthylene-1, 2-dione (1.0 mmol), water (5 mL) and

Int. J. Electrochem. Sci., Vol. 8, 2013
10475
FeCl3 catalyst (20 mmol%). The resulting mixture was stirred in an oil bath at reflux temperature (100
˚C) for 80 min, and the course of the reaction was monitored using TLC on silica gel. Finally, the
reaction mixture was cooled and the crude mixture was purified by column chromatography to give the
desired products in 90% yield [31-33].
2.3. Electrode preparation
The general procedure to prepare the PVC membrane was to mix thoroughly 29 mg of
powdered PVC, 60 mg of plasticizer NPOE, 4mg of additive NaTPB, and 7mg of ionophore EANQ in
4mL of fresh THF. The resulting mixture was transferred into a glass dish of 2 cm diameter. The
solvent was evaporated slowly until an oily concentrated mixture was obtained. A Pyrex tube (3–5mm
o.d.) was dipped into the mixture for about 5 s, so that a transparent membrane of about 0.3mm
thickness was formed. The tube was then pulled out from the mixture and kept at the room temperature
for about 24 h. The tube was then filled with an internal filling solution (1.0×10⁻³
M of Fe3+
). The
electrode was finally conditioned by soaking in a 1.0×10⁻²
M Fe3+
solution for 24 h [34-37]. A
silver/silver chloride wire was used as an internal reference electrode.
2.4. The emf measurements
The emf measurements with the polymeric membrane electrodes were carried out with the
following cell assembly:
Ag–AgCl|3M KCl| internal solution, 1.0×10⁻³
M Fe3+
| PVC membrane |test solution | Hg –
Hg2Cl2, KC1 (satd.)
A Corning ion analyzer 250 pH/mV meter was used for the potential measurements at 25.0 ◦C.
Activities were calculated according to the Debye–H˝uckel procedure [38].
3. RESULTS AND DISCUSSION
3.1. Preliminary study of EANQ complexation with some metal ions
To examine ligand selectivity against various metal ions including Fe(III), Ni(II), Cd(II),
Co(II), Zn(II), La(III), Ag(I), etc, the interaction of EANQ with metal ions in an acetonitrile solution
by conductometric method was investigated [39-45]. In all measurements, the cell should be thermo
stated at the temperature of 25.0 °C, using a Phywe immersion thermostat. In typical experiments, 20
mL of an ion solution (1.0×10⁻⁴
mol L-1
) is placed in a water-jacketed cell, equipped with a magnetic
stirrer and connected to the thermostat, circulating water at the desired temperature. Then, a known
amount of an ionophore or a ligand (1.0×10⁻²
mol L-1
) solution is added in a stepwise manner, using a
calibrated micropipette. The conductance of the solution is measured after each addition. The ligand
addition is continued until the desired ionophore-to-ion mole ratio is achieved. The 1:1 binding of the

Int. J. Electrochem. Sci., Vol. 8, 2013
10476
cations with the ionophore and the complex formation constant in terms of the molar conductance can
be expressed as [39]:
(1) ])[(
)(
]][[
][
LLM
MLK
MLobs
obsM
n
n
f
Where:
(2) )(
)(
MLobs
obsMMLf
CCK
Where, ΛM is the molar conductance of the cation before the addition of the ionophore; ΛML is
the molar conductance of the complexes, Λobs the molar conductance of the solution during titration,
CL the analytical concentration of the added ionophore and CM the analytical concentration of the
cation salt. The complex formation constant (Kf) and the molar conductance of the complex, ΛML,
were obtained by computer fitting Eqs. (1) and (2) to the molar conductance–mole ratio data, using the
nonlinear least-squares program KINFIT [46]. In this experiment, the ligand to cation mole ratio was
equal to 1 in all cases. The formation-constant values of the resulting 1:1 complexes in Table 1 showed
that log Kf is 4.93 ± 0.05 for Fe3+
and 3.33 ± 0.07 or less for other metal ions used. As can be seen
from these results, EANQ can be used as a sensing material in a Fe (III) sensor.
Table 1. The formation constants of L -Mn+
complexes at 25.0 ± 0.1 ºC
Log Kf Ion Log Kf Ion
2.76 ± 0.05 Al(III) 4.93 ± 0.05 Fe(III)
2.66 ± 0.04 Zn(II) 3.33 ± 0.07 Co(II)
2.55 ± 0.02 Na(I) 3.25 ± 0.02 Cu(II)
2.39 ± 0.03 K(I) 3.09 ± 0.06 Ni(II)
2.22 ± 0.04 Rb(I) 2.95 ± 0.04 La(III)
<2.0 Hg(II) 2.83 ± 0.04 Be(II)
<2.0 Mg(II) 2.70 ± 0.05 Ag(I)
<2.0 Pb(II) 2.68 ± 0.03 Fe(II)
<2.0 Mn(II) 2.59 ± 0.04 Ca(II)
3.2. Potential response
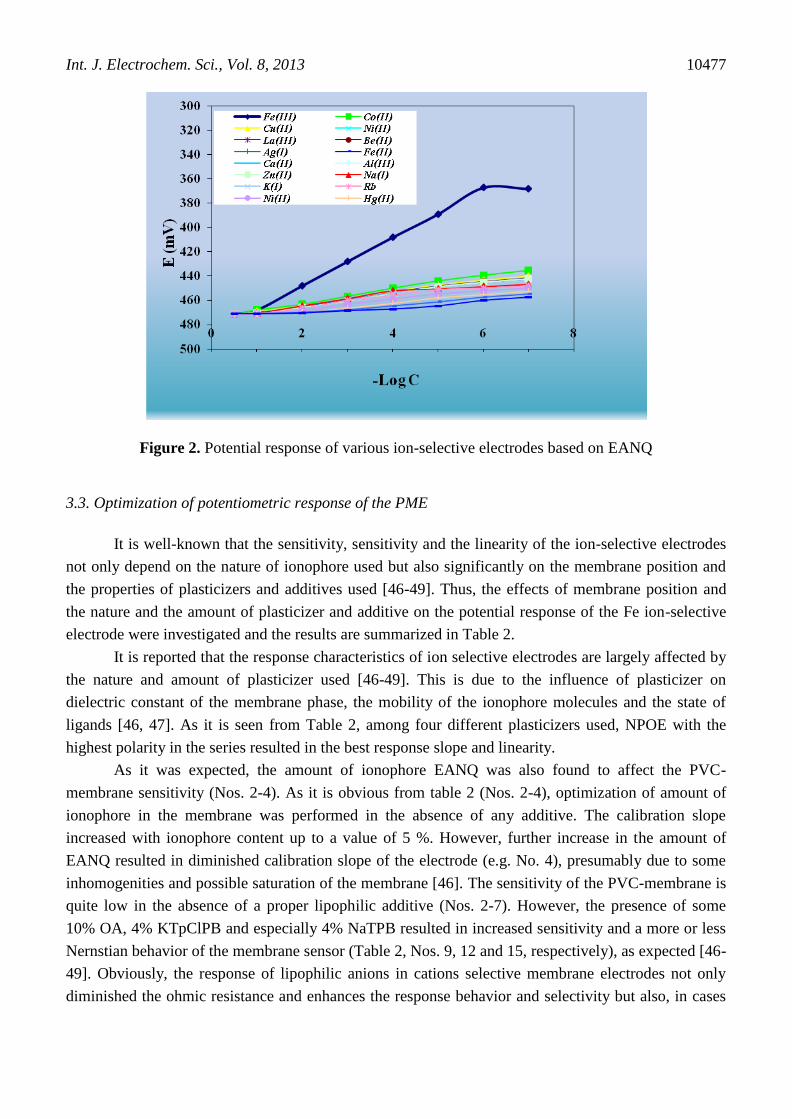
In order to check the suitability of EANQ as an ion carrier for Fe(III) and other metal ions, it
was used to prepare PVC membrane ion-selective electrodes for a wide variety of cations including a
number of metal ion such as Fe(III), Ni(II), Cd(II), Co(II), Zn(II), La(III), Ag(I), etc. At first
experiment we used 30 mg PVC, 60 mg BA, 5 mg EANQ and 5 mg NaTPB for membrane fabrication.
The potential responses different ion-selective electrodes based on EANQ are depicted in Fig. 2. With
the exception of Fe(III) ions, all the tested cations showed relatively weak responses in the
concentration range 1.0×10⁻⁶
to 1.0×10⁻¹
mol L-1
, due to their weak interactions with the ionophore.
Int. J. Electrochem. Sci., Vol. 8, 2013
10477
Figure 2. Potential response of various ion-selective electrodes based on EANQ
3.3. Optimization of potentiometric response of the PME
It is well-known that the sensitivity, sensitivity and the linearity of the ion-selective electrodes
not only depend on the nature of ionophore used but also significantly on the membrane position and
the properties of plasticizers and additives used [46-49]. Thus, the effects of membrane position and
the nature and the amount of plasticizer and additive on the potential response of the Fe ion-selective
electrode were investigated and the results are summarized in Table 2.
It is reported that the response characteristics of ion selective electrodes are largely affected by
the nature and amount of plasticizer used [46-49]. This is due to the influence of plasticizer on
dielectric constant of the membrane phase, the mobility of the ionophore molecules and the state of
ligands [46, 47]. As it is seen from Table 2, among four different plasticizers used, NPOE with the
highest polarity in the series resulted in the best response slope and linearity.
As it was expected, the amount of ionophore EANQ was also found to affect the PVC-
membrane sensitivity (Nos. 2-4). As it is obvious from table 2 (Nos. 2-4), optimization of amount of
ionophore in the membrane was performed in the absence of any additive. The calibration slope
increased with ionophore content up to a value of 5 %. However, further increase in the amount of
EANQ resulted in diminished calibration slope of the electrode (e.g. No. 4), presumably due to some
inhomogenities and possible saturation of the membrane [46]. The sensitivity of the PVC-membrane is
quite low in the absence of a proper lipophilic additive (Nos. 2-7). However, the presence of some
10% OA, 4% KTpClPB and especially 4% NaTPB resulted in increased sensitivity and a more or less
Nernstian behavior of the membrane sensor (Table 2, Nos. 9, 12 and 15, respectively), as expected [46-
49]. Obviously, the response of lipophilic anions in cations selective membrane electrodes not only
diminished the ohmic resistance and enhances the response behavior and selectivity but also, in cases

Int. J. Electrochem. Sci., Vol. 8, 2013
10478
where the extraction capability is poor, increases the sensitivity of the membrane electrode [47-49].
Moreover, additives may catalyze the exchange kinetic at the sample-membrane interface [46]. From
the data presented in Table 2, it is seen that the addition of NaTPB will increase the sensitivity of the
electrode response considerably.
Table 2. Optimization of membrane ingredients during design of Fe(III) selective membrane sensor
DL (M)
Concentration range
M Slope
mV/decade
composition (%) No.
Additive EANQ Plasticizer PVC
- - ~0 - - DBP,62 38 1
3.1×10⁻⁵
5.1×10⁻⁵
-4.0×10⁻²
7.5 - 3 DBP,62 35 2
9.8×10⁻⁶
2.3×10⁻⁵
-1.8×10⁻²
9.1 - 5 DBP,62 33 3
1.0×10⁻⁵
3.9×10⁻⁵
-7.7×10⁻²
8.4 - 7 DBP,62 31 4
2.4×10⁻⁵
5.0×10⁻⁵
-3.5×10⁻²
7.5 - 5 BA,62 33 5
1.0×10⁻⁶
3.6×10⁻⁶
-4.0×10⁻¹
8.9 - 5 DOP,62 33 6
4.8×10⁻⁶
9.5×10⁻⁶
-1.0×10⁻²
10.5 - 5 NPOE,62 33 7
2.9×10⁻⁶
4.5×10⁻⁶
-2.0×10⁻²
12.1 OA,5 5 NPOE,57 33 8
8.9×10⁻⁶
1.0×10⁻⁶
-1.0×10⁻¹
14.8 OA,10 5 NPOE,52 33 9
1.0×10⁻⁶
3.0×10⁻⁶
-5.0×10⁻¹
13.2 OA,15 5 NPOE,47 33 10
8.9×10⁻⁷
1.0×10⁻⁶
-3.3×10⁻³
15.5 KTpClPB,3 5 NPOE,59 33 11
6.8×10⁻⁷
8.9×10⁻⁷
-1.0×10⁻³
16.1 KTpClPB,4 5 NPOE,58 33 12
5.9×10⁻⁷
7.6×10⁻⁷
-2.5×10⁻³
15.9 KTpClPB,5 5 NPOE,57 33 13
2.2×10⁻⁷
5.4×10⁻⁷
-4.9×10⁻²
18.2 NaTPB,3 5 NPOE,59 33 14
9.6 ×10⁻⁸
2.3×10⁻⁷
- 5.0×10⁻² 19.5 NaTPB,4 5 NPOE,58 33 15
1.5 ×10⁻⁷
4.5×10⁻⁷
– 2.0×10⁻²
18.9 NaTPB,5 5 NPOE,57 33 16
As is obvious from Table 2, membrane number 15 with PVC: NPOE: L: NaTPB percent ratio
of 33: 58: 5: 4 resulted in the Nernstian behavior of the membrane electrode over a wide concentration
range the PME.
3.4. Effect of internal solution concentration
The proposed electrode was also used at different concentrations of the internal reference
solution. The Fe3+
concentrations were changed from 1.0×10⁻⁴
to 1.0×10⁻²
M and the emf–p Fe3+
plot
was obtained (Fig 3). It was found that the variation of the concentration of the internal Fe3+
solution
does not cause any significant difference in the potential response, except for an expected change in
the intercept of the resulting Nernstian plots. However, a 1.0×10⁻³
M concentration of the reference
solution found to be quite appropriate for smooth functioning of the system. The optimum conditioning
time for the membrane electrode in a 1.0×10⁻³
M Fe3+
was 24 h, after which it generates stable
potentials in contact with Fe3+
solutions.
Int. J. Electrochem. Sci., Vol. 8, 2013
10479
Figure 3. The effect of different concentrations of the internal reference solution, A) 1.0×10⁻⁴
M, B)
1.0×10⁻⁴
M, C) 1.0×10⁻⁴
M of the Fe3+
as internal solutions respectively
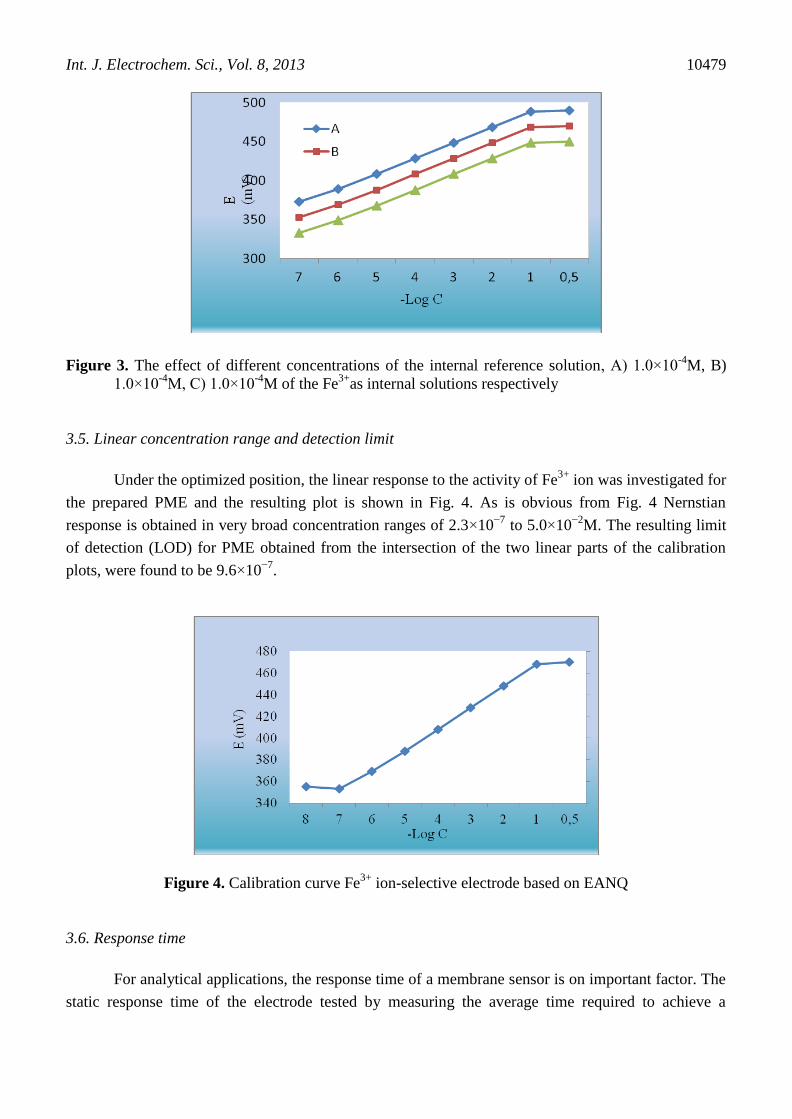
3.5. Linear concentration range and detection limit
Under the optimized position, the linear response to the activity of Fe3+
ion was investigated for
the prepared PME and the resulting plot is shown in Fig. 4. As is obvious from Fig. 4 Nernstian
response is obtained in very broad concentration ranges of 2.3×10⁻⁷
to 5.0×10⁻²
M. The resulting limit
of detection (LOD) for PME obtained from the intersection of the two linear parts of the calibration
plots, were found to be 9.6×10⁻⁷
.
Figure 4. Calibration curve Fe3+
ion-selective electrode based on EANQ
3.6. Response time
For analytical applications, the response time of a membrane sensor is on important factor. The
static response time of the electrode tested by measuring the average time required to achieve a

Int. J. Electrochem. Sci., Vol. 8, 2013
10480
potential within 1mV of the final steady state potential upon successive immersion of a series of Fe3+
ions, each having a tenfold difference in concentrations, was within <25. (Fig. 5)
Figure 5. Dynamic response time of the proposed sensor for step changes in the concentration of Fe3+
(M): A) 1.0×10⁻⁷
, B) 1.0×10⁻⁶
, C) 1.0×10⁻⁵
, D) 1.0×10⁻⁴
, E) 1.0×10⁻³
, F) 1.0×10⁻²
3.7. pH effect on the electrode response
The influence of pH of the test solution on the potential response of the membrane electrode
was tested in the pH range of 2-10, and the results are shown in Fig. 6. As seen, the potential remained
constant from pH 2.9 to 7.1, beyond which the potential changed considerably.
Figure 6 Influences of pH of the test solution on the potential response of electrode in the presence of
1.0×10⁻³
M Fe3+

Int. J. Electrochem. Sci., Vol. 8, 2013
10481
At higher pH values hydroxy complexes of Fe3+
can be formed on the other hand, at lower pH
values the decrease in potential is due to the protonations of ionophore.
3.8. Potentiometric selectivity
The selectivity behavior is obviously one of the most important characteristics of a membrane
sensor, determining whether a reliable measurement in the target sample is possible. In this work, the
influence of several transition and heavy metal ions on the potential response of the Ferric-selective
electrode was tested by determining the potentiometric selectivity coefficients of the electrodes by the
separate solution method (SSM) [50,51]. In this method, the potential of a cell prising an ion selective
electrode and a reference electrode is measured with two separate solutions.
One contains the ion of interest i at the activity ai (but no j) and the other containing the
interfering ion j at the same activity aj=ai (but no i). In this method the values are the selectivity
coefficient can be derived from the following equation:
i
j
i
i
pot
ij aZ
Z
FZRT
EEK log1
303.2
)( 12
Where E1, E2 and Zi, Zj are the respective measured potentials and charges on the ions i and j
The resulting i
pot
MIIIFeK ),(log values obtained are summarized in Table 3. It is seen that, in all
cases, the log selectivity coefficients are in the order of -3.5 and lower, indicating negligible
interference in the performance of the membrane sensor assemblies.
In Table 4, the slope, response time, detection limit, linear range and life time of the proposed
PME are compared with the corresponding values for the best previously reported Ferric ion-selective
electrodes based on different neutral ion carries [23-30].
Table 3. The selectivity coefficients of various interfering cations for the membrane sensor
Log Kpot
Fe(III),M Mn++
Log Kpot
Fe(III),M Mn++
-4.6 Zn2+
-3.5 Co2+
-4.7 Na+ -3.7 Cu
2+
-4.7 K+ -3.8 Ni
2+
-4.9 Rb+ -4.1 La
3+
<-5.0 Ni2+
-4.1 Be2+
<-5.0 Hg2+
-4.2 Ag+
<-5.0 Mg2+
-4.5 Fe2+
<-5.0 Pb2+
-4.6 Ca2+
-4.6 Al3+
From the data given in Table 4 it is immediately obvious that the slope, detection limit, linear
range and life time of the proposed sensor is superior to those reported before.

Int. J. Electrochem. Sci., Vol. 8, 2013
10482
Table 4. Comparison of the slope, response time, detection limit, linear range and life time of present
work and previous studies of other research groups
Ref.
Life times Linear range
(M)
Detection
Limit (M)
Response
time(s)
Slope
(mV/decade)
No.
[23] 9 weeks 1.0×10⁻⁶
- 1.0× 10⁻¹
6.8 ×10⁻⁷
≈ 15 19.4 ± 0.5 1
[24] 2 months 3.5×10⁻⁶
- 4.0×10⁻²
- ≈ 15 28.5 2
[25] 2 months 6.3 ×10⁻⁶
- 1.0×10⁻¹
5.0×10⁻⁶
15 20.0 3
[26] 3 months 1.0×10⁻⁶
- 1.0×10⁻²
- 25 - 30 60.0 4
[27] ≈ 3 months 5.0×10⁻⁷
- 1.0×10⁻²
1.0×10⁻⁶
- 4×10⁻⁸
8 - 15 30.5 – 32 5
[28] 2 months 1.0×10⁻⁶
- 1.0× 10⁻²
3.6×10⁻⁷
- 19.4 ± 0.5 6
[29] 2 months 1.0×10⁻⁴
- 1.0×10⁻¹
1.0×10⁻⁶
30 57.0 7
[30] 2 months 1.0×10⁻⁵
- 1.0×10⁻¹
1.3 ×10⁻⁶
20 20 8
This
work
5 months 2.3×10⁻⁷
- 5.0×10⁻²
9.6×10⁻⁸
25 19.5 ± 0.3 9
3.9. Stability and lifetime
For the investigation of the stability and lifetime of the Fe(III) membrane sensor, two
electrodes were tested over a period of 25 weeks and the results are in Table 5. The main factor
limiting the lifetime of the ion-selective membrane in potentiometric measurements is the leakage of
ionophore into the aqueous solutions. The proposed PVC-based membrane sensor could be used for at
least 20 weeks (use of 1 hour daily). After its utilization, it was washed and kept dry. During this
certain time period, the membrane sensor could be used without any measurable divergence. After 20
weeks changes were observed in the slope and detection limit (from 19.5 to 16.5 mV decade-1
and
9.6×10⁻⁸
to 1.0×10⁻⁷
M or less, respectively).
Table 5. Lifetime of Fe(III) selective membrane sensor
Week Slope (mV decade-1
) Detection Limit (M)
1 19.5±0.3 9.6 ×10⁻⁸
3 19.2±0.2 9.9×10⁻⁸
5 19.4±0.4 9.8×10⁻⁸
7 19.1±0.3 1.1×10⁻⁷
9 18.9±0.3 2.5×10⁻⁷
11 19.0±0.4 4.3×10⁻⁷
13 18.7±0.6 2.9×10⁻⁷
15 18.5±0.5 5.6×10⁻⁷
17 18.8±0.4 6.6×10⁻⁷
19 18.5±0.7 8.5×10⁻⁷
21 16.5±0.5 1.5×10⁻⁶
23 14.2±0.8 5.2×10⁻⁶

Int. J. Electrochem. Sci., Vol. 8, 2013
10483
3.10. Reversibility of the electrode response
To evaluate the reversibility of the electrode, a similar procedure in the opposite direction was
adopted. The measurements were performed in the sequence of high-to-low (from 1.0×10⁻²
to 1.0×10⁻³
M) sample concentrations and the results showed that, the potentiometric responses of the electrode
was reversible; although the time needed to reach equilibrium values (25 s) were longer than that of
low-to-high sample concentrations [52] (Fig.7).
Figure 7. Dynamic response characteristics of the Fe3+
membrane sensor for several high-to-low
sample cycles.
3.11. Analytical applications
3. 11. 1 Determination of Fe(III) in real samples
In order to test the analytical validity of this approach, the electrode has been used for the
determination of iron in pharmaceutical samples (Feriron, Darou Pakhsh, Iran) and water samples (tap
water Qazvin, Iran and mineral water, Damavand, Iran).
Pharmaceutical sample was prepared by dissolving one tablet of Feriron in 10 mL HCl and
heated to dryness. After that, the sample was dissolved in 10 mL distillated water, filtered and
transferred to a 25 mL standard flask and this volume was completed with distillated water. Atomic
absorption spectrometer was also used for the determination of iron contents in these samples. The
results obtained are presented in table 6 and pared with those obtained by using AAS. The sensor is
found to be in satisfactory agreement with that obtained from atomic absorption spectrometer (AAS).

Int. J. Electrochem. Sci., Vol. 8, 2013
10484
These observations and results have been confirmed that present electrode can be used for practical
analysis.
Table 6. Determination of Fe (III) in real samples using AAS and proposed sensor
Sample Adjusted pH Labeled amount AAS Proposed sensor
Feriron 3.5 50 mg/tablet 49.5 ± 0.05mg/tablet 49.3 ± 0.02 mg/tablet
tap water 3.5 - 3.9 ± 0.04mg L–1
4.1 ± 0.05 mg L–1
mineral water 3.5 - 1.8 ± 0.08mg L–1
2.0 ± 0.05 mg L–1
3.11.2. Potentiometric titration
The other analytical application of Fe3+
sensor based on EANQ was tested by the
potentiometric titration of Fe3+
with EDTA solution. A 30 ml (10-3
M) of testing solution was titrated
with 10-3
M EDTA solution. With the addition of EDTA solution into the testing solution, the Fe3+
concentration and the output voltage were decreased because of the formation of Fe-EDTA complex as
shown in figure 8. In figure 8, which exhibits that the end point represent the stochiometric
formulation of Fe-EDTA complex and it also suggests that the almost all of the iron ions are used up in
the formation of Fe-EDTA complex and so after the equivalent point, the potential response was found
to almost be constant. It is therefore suggested that the proposed sensor based on EANQ can
successfully be used as an indicator electrode for the determination of Fe3+
by potentiometric titration
Figure 8. Titration curve of 30mL of 1.0×10⁻³
M Fe3+
with 0.01M EDTA solution
4. CONCLUSION
The membrane assembly prepared using 9- ethylacenaphtho [1,2-b]quinoxaline (EANQ)as
membrane ingredient with plasticizers (NPOE) and anion excluder (NaTPB) exhibited linearity over a
wide concentration range (2.3×10⁻⁷
-5.0×10⁻²
M) with Nernstian slope (19.5±0.3 mV/decade of

Int. J. Electrochem. Sci., Vol. 8, 2013
10485
activity), fast response time (25s), long lifetime (five months) and selectivity (of the order of 10-4
and
10-5
) over a number of cations. The iron ion-selective electrode can be employed as an indicator
electrode in potentiometric titration and the determination of iron ions in Pharmaceutical sample and
water samples.
ACKNOWLEDGEMENTS
We are thankful to Payame Noor University (PNU), Tehran, I. R. IRAN and Research Council of
University of Tehran for the financial support of this research work.
References
1. R. A. Goyer, Toxic effects of metals, in: Casarett & Doull’s Toxicology: the basic science of
poisons, C. D. Klaassen (Eds.), 5th Ed, p. 715, New York City, NY, McGraw-Hill, (1996)
2. W. F. Greentree and J. O. Hall, Iron toxicosis, in: Kirk’s current therapy XII small animal practice.
J.D. Bonagura, (Eds.), p.240, Philadelphia, Pa, WB Saunders Co, (1995)
3. M. Wintrole, Clinical Hematology, Lea and Febiger, p.143, Philadelphia, (1961)
4. J. Porter, Hematol. Oncol. Clin. North Am., 19 (2005) 7
5. N. C. Andrews, N. En.g J. Med., 341 (1999) 1986
6. Z. I. Cabantchik, W. Breuer, G. Zanninelli and P. Cianciulli, Best Pract Res Clin Haematol., 18
(2005) 277
7. E. D. Weinberg, Eur J Cancer Prev., 5 (1996) 19
8. M. B. Gholivand and F. Raheedayat, Electroanalysis, 16 (2004) 1330
9. M. B. Gholivand and F. Sharif pour, Talanta, 60 (2003) 707
10. S. K. Srivastava, V. K. Gupta and S. Jain, Electroanalysis, 8 (1996) 938
11. H. A. Zamani, M. R. Ganjali, P. Norouzi and S. Meghdadi, Anal. Lett., 41 (2008) 902.
12. S. K. Srivastava, V. K. Gupta and S. Jain, Anal. Chem., 68 (1996) 1272
13. H. A. Zamani, M. R. Ganjali, and M. Adib, Sensor Lett., 4 (2006) 345.
14. M. R. Ganjali, P. Norouzi, A. Atrian, F. Faridbod, S. Meghdadi, M. Giahi, Mater. Sci. Eng. C 29
(2009) 205
15. H. A. Zamani, M. R. Ganjali, and P. Norouzi, M. Adib, Mater. Sci. Eng. C, 28 (2008) 157
16. V. K. Gupta, R. N. Goyal and R. A. Sharma, Electrochim. Acta, 54 (2009) 4216
17. V. K. Gupta, R. N. Goyal, A. K. Jain and R. A. Sharma, Talanta, 78 (2009) 484
18. R. N. Goyal, V. K. Gupta, N. Bachheti and R. A. Sharma, Electroanalysis, 20 (2008) 757
19. H.A. Zamani, M. Nekoei, M. Mohammadhosseini, and M.R. Ganjali, Mater. Sci. Eng. C, 30 (2010)
480
20. M. Shamsipur, F. Mizani, A. A. Saboury, H. Sharghi and R. Khalifeh, Electroanalysis, 19 (2007)
587
21. H. A. Zamani, F. Faridbod and M. R. Ganjali, Mater. Sci. Eng. C, 33 (2013), 608.
22. H. A. Zamani, A. Imani, A. Arvinfar, F. Rahimi, M. R. Ganjali, F. Faridbod and S. Meghdadi,
Mater. Sci. Eng. C, 31 (2011) 588
23. V. K. Gupta, A. K. Singh and B. Gupta, Anal. Bioanal. Chem., 389 (2007) 2019
24. M. Pooyamanesh, H. A. Zamani, G. Rajabzadeh, M. R. Ganjali and P. Norouzi, Anal. Lett., 40
(2007) 1596
25. M. H. Mashhadizadeh, I. Sheikh-Shoaei and N. Monadi, Talanta, 64 (2004) 1048
26. V. K. Gupta, A. K. Jain, S. Agarwal and G. Maheshwari, Talanta, 71 (2007) 1964
27. A. Sil, V. S. Ijeri and A. K. Srivastava, Sens. Actuator, B 106 (2005) 648
28. W. H. Mahmoud, Anal. Chem. Acta 436 (2001) 199

Int. J. Electrochem. Sci., Vol. 8, 2013
10486
29. H. A. Zamani, M. R. Abedi and M. R. Ganjali, J. Chilean Chem. Soc. 54 (2009) 186
30. G. Ekmekci, D. Uzun, G. Somer and S. Kalayci, J. Membrane Sci. 288 (2007) 36
31. G. R. Bardajee, F. Mizani, I. Rostami and A. Mohamadi, Polycyclic Aromatic Compounds 2013,
Accepted
32. G. R. Bardajee, R. Malakooti, F. Jami,Z. Parsaei and H. Atashin, Catalysis Munications, 27
(2012) 49
33. G. R. Bardajee, R. Malakooti, I. Abtin , H. Atashin and I. Rostami, Microporous and Mesoporous
Materials, 169 (2013) 67
34. F. Mizani and M. Komeh, Int. J. Electrochem. Sci., 7 (2012) 9186
35. H. A. Zamani, M. R. Ganjali, P. Norouzi, A. Tadjarodi, and E. Shahsavani, Mater. Sci. Eng. C, 28
(2008) 1489.
36. F. Mizani, M. Shamsipur, M. R. Yaftian, D. Matt Anal. Sci., 29 (2013) 361
37. F. Mizani, M. Majdi, S. Taghvaei-Ganjali, Anal. Bioanal. Electrochem., 4 (2012) 529
38. S. Kamata, A. Bhale, Y. Fukunaga and A. Murata, Anal. Chem., 60 (1988) 2464
39. M.R. Ganjali, M.H. Zargazi and A. Mohajeri, Pol. J. Chem., 75 (2001) 743
40. J. L. Dye and V. A. Nicely, J. Chem. Educ., 48 (1971) 443
41. M. R. Ganjali, A. Daftari, M. R. Pourjavid, M. Faal Rastegar and A. Moghimi, Main Group Metal
Chemistry, 25 (2002) 669
42. M. R. Ganjali, M. R. Pourjavid, A. Mouradzadegun, M. Hosseini and F. Mizani, Bull. Korean
Chem. Soc., 24 (2003) 1585
43. T. Rosatzin, E. Bakker, K. Suzuki and W. Simon, Anal. Chim. Acta, 280 (1993) 197
44. IUPAC Analytical Chemistry Division, mission on Analytical Nomenclature Remendations for
nomenclature for ion selective electrodes, Pure Appl. Chem., 48 (1976) 127
45. Z. Marczenko, Separation and Spectrophotometric Determination of Elements, Elis Horwood
Limited, Chichester, UK, (1986)
46. M. R. Ganjali, H. Shams, F. Faridbod, L. Hajiaghababaei, P. Norouzi, Mater. Sci. Eng. C, 29
(2009) 1380
47. X. Yang, N. Kumar, H. Chi, D. B. Hibbert and P. N. W. Alexander, Electroanalysis, 9 (1997) 549
48. P. M. Gehrig, W. E. Morf, M. Weltic, E. Pretsch and W. Simon, Helv. Chim. Acta, 73 (1990) 203
49. R. Eugster, P. M. Morf, U. Spichiger and W. Simon, Anal. Chem., 63 (1991) 2285
50. G. G. Guilbault, R. A. Durst, M. S. Frant, H. Freiser, E. H. Hansen, T. S. Light, E. Pungor, G.
Rechnitz, N. M. Rice, T. J. Rohm, W. Simon and J. D. R. Thomas, Pure Appl. Chem., 48 (1976)
127
51. E. Lindner and Y. Umezawa, Pure Appl. Chem., 80 (2008) 85
52. H. Zhang, D. Yang, S. Li, X. Ma, Y. Ji, J. Xu and D. Qu, Mater. Lett., 59 (2005) 1696
© 2013 by ESG (www.electrochemsci.org)