Embed Size (px)
Citation preview

-Journal of Applied Chemical Research, 11, 1, 81-94 (2017)
Journal of App l ied Chemical Research
www.jacr.k iau.ac. i r
New Coated Graphite Potentiometric Sensor for Selective Determination of Copper (II) Ions
Arezoo Ghaemi*, Zahra SetarehDepartment of Chemistry, Ahvaz Branch, Islamic Azad University, Ahvaz, Iran
(Received 02 Jul. 2016; Final version received 18 Sep. 2016)
AbstractA highly selective copper (II) coated graphite sensor was prepared by 1,13-bis(8-quinolyl)-1,4,7,10,13-pentaoxatridecane (kryptofix 5) as a supramolecule ionophore into plasticized polyvinyl chloride (PVC) membrane. The best response characteristic was observed using the membrane composition of PVC = 30.0 mg, dioctyl sebacate (DOS) = 63.5 mg, palmitic acid (PA) = 3.0 mg and kryptofix 5 = 3.5 mg. The sensor exhibits a nernstian slope (30.0±0.2 mV/decade) in a wide linear concentration range of 1.0×10⁻⁵ to 1.0×10⁻¹ M with detection limit of 8.7×10⁻⁶ M. The electrode has a fast response time of 15 s with a satisfactory reproducibility and relatively long life time of about 16 weeks without significant drift in potential. The sensor operates in the wide pH range of 2.0-10.0. This sensor reveals a good selectivity towards Cu2+ ion over a wide range of alkali, transition and heavy metal cations. The electrode was used as an indicator electrode for potentiometric titration of Cu2+ using EDTA solutions. The proposed sensor was applied for the direct determination of Cu2+ cation and the results were compared with those obtained from atomic absorption spectrometric analysis and were found in good agreement. Also this sensor was successfully used for determination of copper (II) in real samples. Keywords: Coated graphite sensor, Copper (II) cation, Potentiometry, Kryptofix 5.
*Corresponding author: Arezoo Ghaemi, Department of Chemistry, Ahwaz Branch, Islamic Azad University, Ahwaz, Iran.Tel: +98 61 34457612, Fax: +98 61 34435288. E-mail: [email protected].
Introduction
Copper is an essential trace element that is vital
to the health of all living things (humans, plants,
animals and microorganisms). In humans,
copper is essential to the proper functioning of
organs and metabolic processes. The human
body has complex homeostatic mechanisms
which attempt to ensure a constant supply of
available copper, while eliminating excess
copper whenever this occurs. However, like

A. Ghaemi et al., J. Appl. Chem. Res., 11, 1, 81-94 (2017)82
all essential elements and nutrients, too much
or too little nutritional ingestion of copper can
result in a corresponding condition of copper
excess or deficiency in the body, each of
which has its own unique set of adverse health
effects. Copper excess is a subject of much
current research. Distinctions have emerged
from studies that copper excess factors are
different in normal populations versus those
with increased susceptibility to adverse effects
and those with rare genetic diseases. This has
led to statements from health organizations that
could be confusing to the uninformed. [1-5].
Some conditions previously linked to copper
deficiency include osteoporosis, osteoarthritis,
rheumatoid arthritis, cardiovascular disease,
colon cancer and chronic conditions involving
bone, connective tissue, heart and blood
vessels [6-9]. The determination of copper,
therefore, is important and some instrumental
methods such as UV-Vis spectrophotometry
[10,11], stripping voltammetry [12,13],
atomic absorption spectrometry [14,15] and
Chromatography [16,17] are used for the
determination of copper at low concentration
level. These methods require sample
pretreatment, are time consuming and not very
useful for routine analysis of large number of
environmental samples.
Ion-selective electrodes (ISEs) possess many
advantages over traditional methods of analysis
and provide accurate, reproducible, fast and
regular selective determination of various
ionic species. In addition, ion-selective sensors
allow non-destructive, on-line monitoring of
particular ions in a small volume of sample
without any pretreatment. Because of these
merits, the use of ISEs is increasing day by
day in medicinal, environmental, agricultural
and industrial fields [18-21].
Ionophore, also called the “ion carrier,” is the
most important component of any polymeric
membrane sensor with respect to sensitivity
and selectivity, because the molecular-level
phenomenon that is sensed by the ISE is the
binding between the ionophore and target
ion. The different selectivities of an ISE
toward other ions, hence, may be considered
to originate from the difference in binding
strengths between any chosen ionophore,
to be used in the sensor, and various ions.
Supramolecules such as schiff bases,
calixarenes, crown compounds and their
derivatives are the excellent choice as sensing
materials in the construction of potentiometric
ion selective sensors because of their ability
to complex selectively to a particular ion [22].
Further, it is reported that the introduction
of other constituents into the flexible crown
ring may enhance their selectivity towards
a particular charged species. Therefore, in
this study, 1,13-bis(8-quinolyl)-1,4,7,10,13-
pentaoxatridecane (kryptofix 5) (Scheme 1),
a pod and with five donor oxygen atoms, has
been tried as electroactive material for the
fabrication of copper (II) selective sensor.

A. Ghaemi et al., J. Appl. Chem. Res., 11, 1, 81-94 (2017) 83
Scheme 1. Structure of ionophore 1,13-bis(8-quinolyl)-1,4,7,10,13-pentaoxatridecane (kryptofix 5).
Experimental
Materials
All reagents were of analytical grade and used
without further purification. High molecular
weight polyvinyl chloride (PVC) and
graphite powder were from Fluka. Sodium
tetraphenylborate (NaTPB), palmitic acid
(PA), dibutyl phthalate (DBP), dioctyl sebacate
(DOS), dioctyl phthalate (DOP), nitrobenzene
(NB), tetrahydrofuran (THF), nitric acid,
sodium hydroxide, EDTA, 1,13-bis(8-
quinolyl)-1,4,7,10,13-pentaoxatridecane
(kryptofix 5) and nitrate salts were from
Merck. All solutions were prepared with
double distillated deionized water.
Apparatus and EMF measurements
The potential measurements were carried out
with a digital potentiometer Model PTR-79
(Zag Chemi, Iran) having ± 0.01 mV accuracy
and an Ag/AgCl elelectrode (Azar electrode,
Iran) was used as a reference electrode.
Flame atomic absorption spectrometric
(FAAS) measurements were performed on
a 990-PG instrument equipped with an air-
acetylene flame and a copper-hollow cathode
lamp. The pH of the solutions was measured
by a conventional glass pH electrode. All
measurements were carried out at 25 °C with
a cell type:
Ag/AgCl; KCl(satd.) ║Cu2+ sample
solution│ion selective membrane│graphite bar
The potential readings were made after the
potential reached to a constant value. The
performance of the electrode was investigated
by measuring the potential of Cu2+ solutions
over the range of 1.0×10⁻⁸ to 1.0×10⁻¹ M. The
data were plotted as observed potential vs the
logarithm of copper (II) cation concentration.
Potentiometric selectivity coefficient (Kijpot)
was determined by separate solution method
(SSM).
Preparation of membrane and electrode
construction
The electrode was prepared from a graphite bar
(4 mm diameter and 50 mm long) from battery.

A. Ghaemi et al., J. Appl. Chem. Res., 11, 1, 81-94 (2017)84
The graphite bars were polished and put in a
concentrated HNO3 solution overnight to clean
the surface of the electrodes. Then, the bars
were rinsed with THF and once again polished
and washed with distilled water and allowed
to dry. A mixture of PVC (as matrix), DOS (as
plasticizer), palmitic acid (for increasing the
electrical and mechanical conduction of coated
membrane) and kryptofix 5 (as an electroactive
material) to give a total mass of 100 mg, was
dissolved in 2 ml of THF. The resulting clear
solution was evaporated slowly at ambient
temperature until an oily concentrated mixture
was obtained. The graphite bar was then
repeatedly dipped (three times, a few seconds
between dips) into the mixture. A membrane
was formed on the graphite surface as sensing
layer which was allowed to set overnight at
room temperature. The coated electrode was
conditioned in a 1.0×10⁻³ M copper (II) nitrate
solution for 24 h. The coating solutions were
stable for several days and could be used for
construction of new membranes.
Results and discussion
Effect of membrane composition on the sensor
response and calibration curve
It is well known that some important features
of the PVC-based membranes, such as the
nature and amount of the ionophore, the
properties of the plasticizer, the plasticizer/
PVC ratio and especially the nature of the
additives used, significantly influence the
sensitivity and selectivity of the ion selective
sensors [23-26]. Thus, different aspects of
preparation of membranes based on kryptofix
5 were investigated and the results are given
in Table 1.

A. Ghaemi et al., J. Appl. Chem. Res., 11, 1, 81-94 (2017) 85
Table 1. Optimization of the Cu2+ selective membrane ingredients.
MembraneNo.
Membrane mass composition (mg) Slope(mV/decade)
Linearrange(M)PVC Ionophore
(Kryptofix 5)Additive Plasticizer
1 30 7.0 ─ 63.0 (DOS) 17.9±2.7 10-3-10-1
2 30 ─ 7.0 (PA) 63.0 (DOS) 14.2±2.0 10-3-10-1
3 30 4.0 3.0 (PA) 63.0 (DOP) 30.6±0.5 10-4-10-2
4 30 4.0 3.0 (PA) 63.0 (NB) 16.1±2.0 10-3-10-1
5 30 5.0 4.0 (PA) 61.0 (DBP) 26.7±0.3 10-3-10-1
6 30 5.0 3.0 (PA) 62.0 (DBP) 24.8±0.1 10-3-10-1
7 30 3.5 3.0 (PA) 63.5 (DOS) 30.0±0.2 10-5-10-1
8 30 5.5 4.5 (NaTPB) 60.0 (DBP) 31.5±2.2 10-3-10-1
9 30 5.0 5.0 (NaTPB) 60.0 (NB) 18.3±1.9 10-3-10-1
10 30 5.0 5.0 (NaTPB) 60.0 (DOP) 22.0±0.1 10-3-10-1
11 30 5.0 4.0 (NaTPB) 61.0 (DOP) 22.9±1.7 10-5-10-1
12 30 4.0 4.0 (NaTPB) 62.0 (DOS) 28.1±0.8 10-5-10-2
13 30 5.0 3.0 (NaTPB) 62.0 (DOS) 26.6±0.2 10-4-10-1
14 30 4.0 4.0 (NaTPB) 62.0 (DBP) 25.3±0.3 10-6-10-3
15 30 7.0 5.0 (NaTPB) 60.0 (DOS) 27.8±1.1 10-3-10-1
16 30 4.0 4.0 (graphitepowder)
62.0 (DOS) 26.0±0.7 10-3-10-1
17 30 5.0 2.0 (graphitepowder)
63.0 (DBP) 21.0±0.8 10-3-10-1
Ionophores for use in sensors should have
rapid exchange kinetics and adequate complex
formation constants in the membrane. Also,
they should be well soluble in the membrane
matrix and have a sufficient lipophilicity to
prevent leaching from the membrane into the
sample solution. In addition, the selectivity of
the neutral carrier-based ISEs is known to be
governing by stability constant of the neutral
carrier-ion complex and its partition constant
between the membrane and sample solution
[27]. As is shown in Table 1, 3.5 mg of
kryptofix 5 was chosen as the optimum amount
of the ionophore in the PVC-membrane
(membrane No. 7). In the absence of kryptofix
5, a non-Nernstian slope (14.2 mV/decade)
was observed.
Solvent polymeric membrane ion selective
A. Ghaemi et al., J. Appl. Chem. Res., 11, 1, 81-94 (2017)86
electrodes are usually based on a matrix of
the solvent mediator/PVC ratio of about 2.
Polymeric films with such a plasticizer/PVC
ratio will result in optimum physical properties
and high enough mobility of their constituents.
In this study, a plasticizer/PVC ratio of about 2
was found to be the most suitable. It is reported
that the selectivity and working concentration
range of membrane sensors are affected by the
nature and amount of the plasticizer used. This
is due to the influence of the plasticizer on the
dielectric constant of the membrane phase, the
mobility of the ionophore molecules and the
state of ligands [28]. As is obvious from Table
1, among the four different plasticizers used,
DOS (63.5 mg) resulted in the best sensitivity
(membrane No. 7).
The presence of lipophilic anions in cation
selective membrane electrodes is advantageous
for decreasing the ohmic resistance and
anion interference, and for enhancing the
response behavior, selectivity and sensitivity
of the membrane electrodes. In addition,
lipophilic anions induce permselectivity of
the PVC membrane electrodes [29]. The
potential response of the Cu2+-ISE containing
a lipophilic anion additive was investigated
to examine the effect of the additive content
(Table 1). The results revealed that the
potential response of the electrode in the
absence of additives led to weak sensitivity
with a diminished slope of 17.9 mV/decade
over a linear range from 1.0×10⁻³ to 1.0×10⁻¹
M. The sensitivity was greatly improved by
increasing the amount of lipophilic anion,
which led to the best performance with a
Nernstian slope. As is shown in Table 1, it is
evident that the nature and amount of additive
influence the performance of the membrane
sensor. Thus, the addition of 3.0 mg palmitic
acid (membrane No. 7) significantly increased
the sensitivity of the response of the Cu2+
sensor.
Thus, the best response was observed with
the membrane composed of the following
ingredients: 30.0 mg PVC, 63.5 mg DOS,
3.5 mg kryptofix 5 and 3.0 mg palmitic
acid (membrane No. 7). The characteristic
properties of this optimized coated membrane
were studied and the calibration curve for
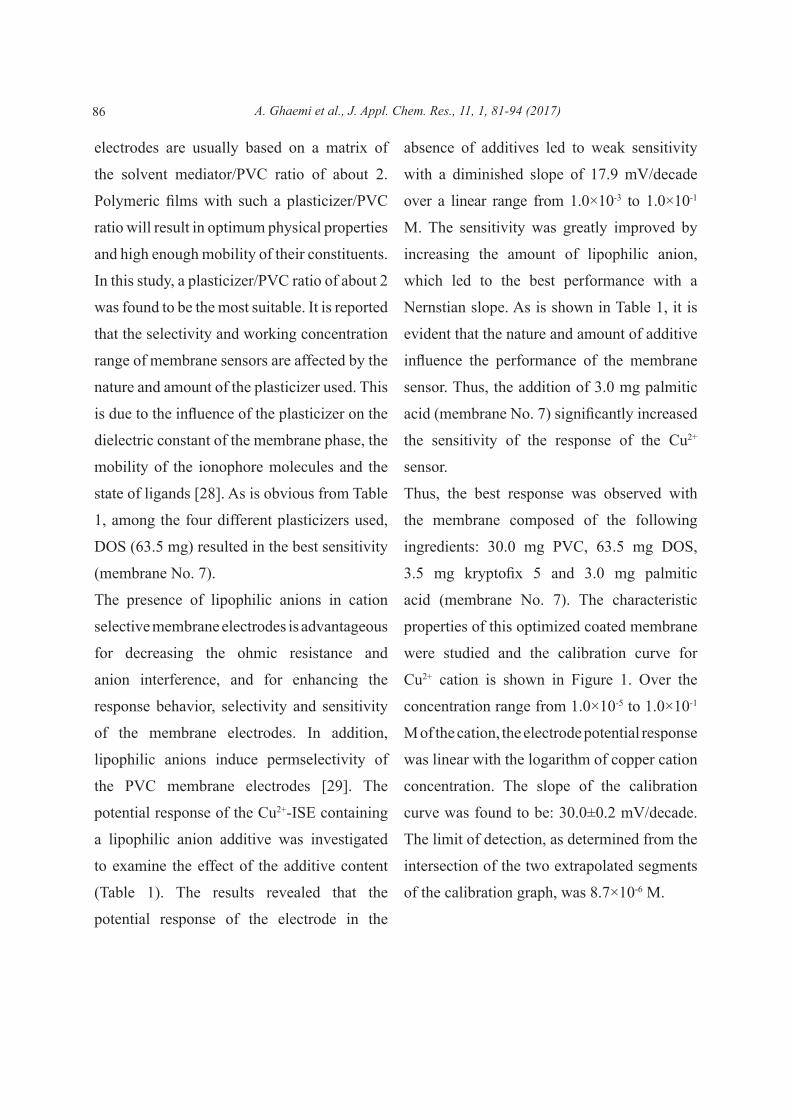
Cu2+ cation is shown in Figure 1. Over the
concentration range from 1.0×10⁻⁵ to 1.0×10⁻¹
M of the cation, the electrode potential response
was linear with the logarithm of copper cation
concentration. The slope of the calibration
curve was found to be: 30.0±0.2 mV/decade.
The limit of detection, as determined from the
intersection of the two extrapolated segments
of the calibration graph, was 8.7×10⁻⁶ M.

A. Ghaemi et al., J. Appl. Chem. Res., 11, 1, 81-94 (2017) 87
Figure 1. Calibration curve of the Cu2+ selective sensor based on kryptofix 5.
500
530
560
590
620
650
680
0 1 2 3 4 5 6 7 8 9
-E (
mV
)
[+ -Log [Cu2
pH effect on potential response
The influence of pH on the potential response
of the optimized sensor was tested over a pH
range of 1.0-12.0 (concentrated NaOH or
HNO3 solutions were employed for the pH
adjustment) and the result is shown in Figure 2.
As it is seen, the pH effect of the test solutions
(1.0×10⁻³ M and 1.0×10⁻² M) on the potential
response of the copper sensor was found to
remain constant in the pH range of 2.0-10.0.
The observed drift at higher pH values could
be due to the formation of some hydroxyl
complexes of Cu (II) in the solution. At the
lower pH values, the potentials decreased.
This is due to the existence of nitrogen donor
atoms in the structure of the ionophore which
can be easily protonated, indicating that the
sensor responds to hydrogen ions.
Figure 2. Effect of pH on potential response of the Cu2+ selective sensor using (■) 1.0×10⁻² M and (▲)1.0×10⁻³ M of Cu2+ solutions.
500
530
560
590
620
650
680
0 1 2 3 4 5 6 7 8 9 10 11 12 13
-E (
mV
)
pH
Static and dynamic response times
Static and dynamic response times are
important factors for the assessment of the
analytical applicability of ion selective sensors.
A. Ghaemi et al., J. Appl. Chem. Res., 11, 1, 81-94 (2017)88
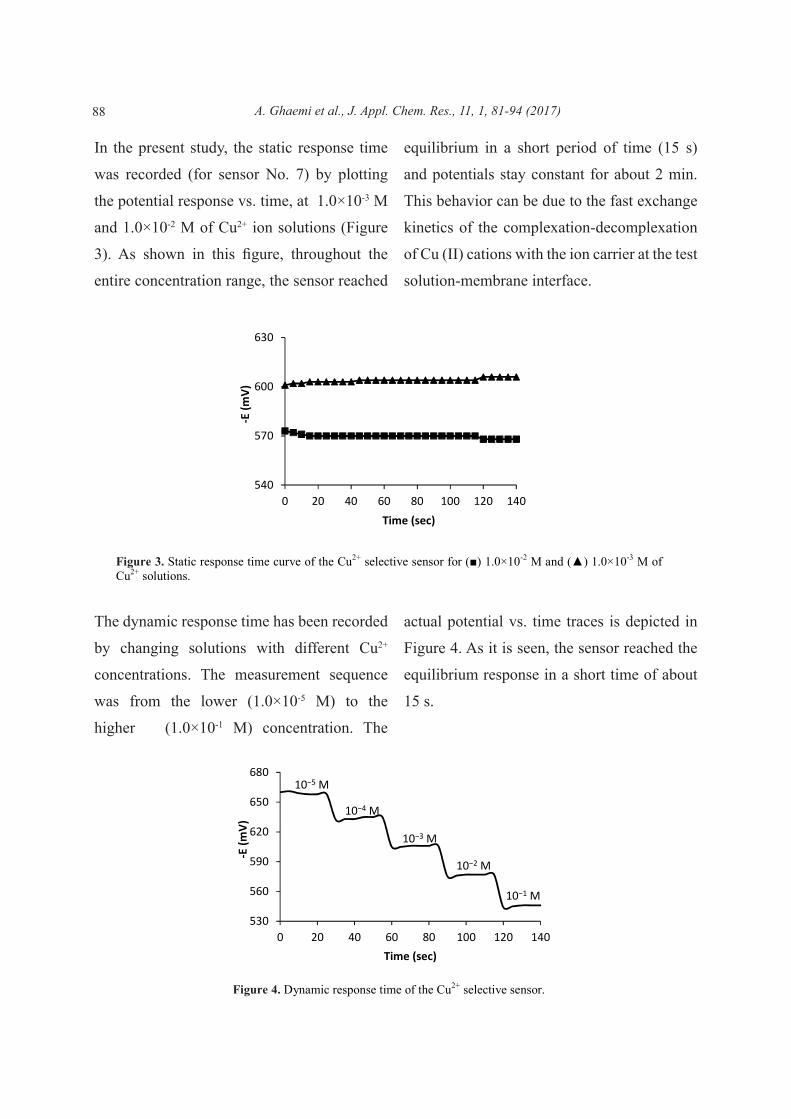
In the present study, the static response time
was recorded (for sensor No. 7) by plotting
the potential response vs. time, at 1.0×10⁻³ M
and 1.0×10⁻² M of Cu2+ ion solutions (Figure
3). As shown in this figure, throughout the
entire concentration range, the sensor reached
equilibrium in a short period of time (15 s)
and potentials stay constant for about 2 min.
This behavior can be due to the fast exchange
kinetics of the complexation-decomplexation
of Cu (II) cations with the ion carrier at the test
solution-membrane interface.
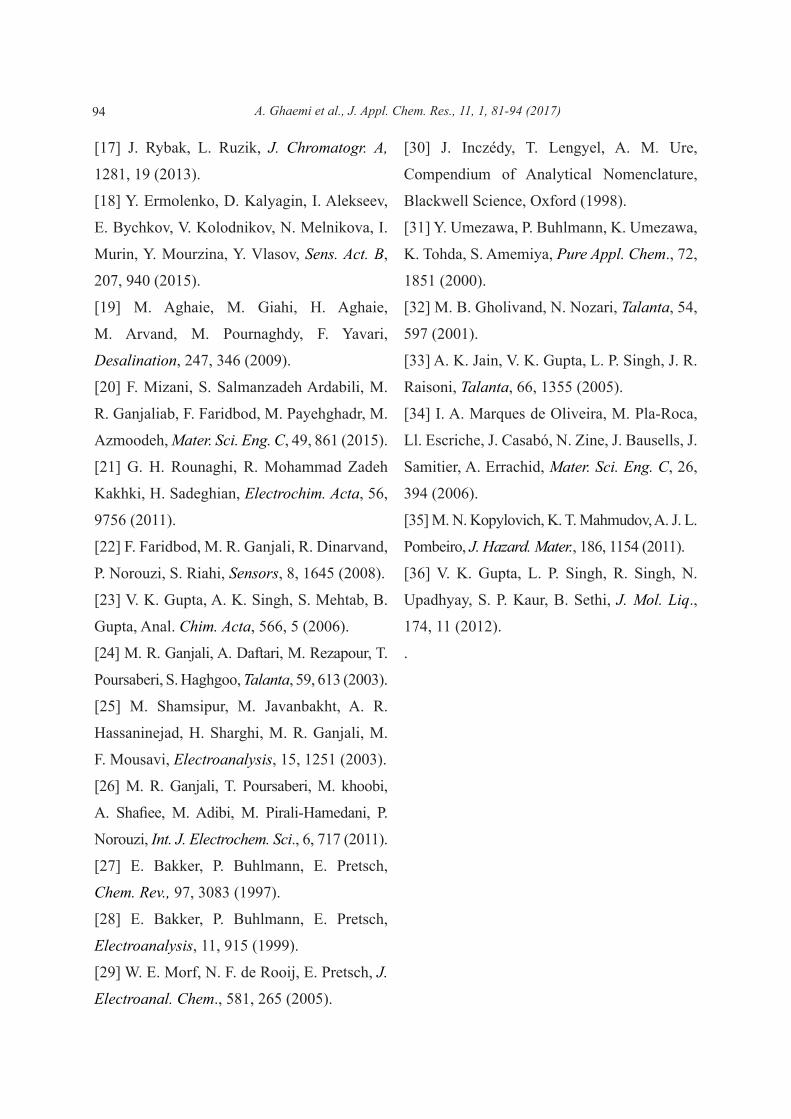
Figure 4. Dynamic response time of the Cu2+ selective sensor.
530
560
590
620
650
680
0 20 40 60 80 100 120 140
-E (
mV
)
Time (sec)
10−5 M
10−4 M
10−3 M
10−2 M
10−1 M
Figure 3. Static response time curve of the Cu2+ selective sensor for (■) 1.0×10⁻² M and (▲) 1.0×10⁻³ M ofCu2+ solutions.
540
570
600
630
0 20 40 60 80 100 120 140
-E (
mV
)
Time (sec)
The dynamic response time has been recorded
by changing solutions with different Cu2+
concentrations. The measurement sequence
was from the lower (1.0×10⁻⁵ M) to the
higher (1.0×10⁻¹ M) concentration. The
actual potential vs. time traces is depicted in
Figure 4. As it is seen, the sensor reached the
equilibrium response in a short time of about
15 s.

A. Ghaemi et al., J. Appl. Chem. Res., 11, 1, 81-94 (2017) 89
To evaluate the reversibility of the optimized
sensor, a similar procedure in the opposite
direction was adopted. The measurements
have been performed in the sequence of high-
to-low from (1.0×10⁻² to 1.0×10⁻³ M) sample
concentrations (Fig. 5). The results showed
that, the potentiometric response of the sensor
was reversible. The sensing behavior of the
electrode remained unchanged when the
potentials recorded either from low-to-high
concentrations or vice versa.
Figure 5. Response characteristics of the Cu2+ selective sensor for several high-to-low (1.0×10⁻² to 1.0×10⁻³
M) sample cycles.
560
580
600
620
٠ ٣١ ٦٠ ٩١ ١٢١ ١٥٢ ١٨٢ ٢١٣ ٢٤٤
-E (
mV
)
Time (sec)
Selectivity
The potentiometric selectivity coefficient
(Kijpot) of an electrode as one of the most
important characteristics is defined by its
relative response for the primary ion over
other ions present in the solution. In this work,
the potentiometric selectivity coefficient was
determined by the separate solution method
(SSM) [30,31]. In this method, the potential
of a cell comprising an ion selective electrode
and a reference electrode is measured with
two separate solutions, one containing the
ion i at the activity ai (but no j), the other one
containing the ion j at the same activity ai = aj
(but no i). If the measured values are Ei and Ej,
respectively, the value of Kij pot is calculated
from the equation:
The resulting selectivity coefficient values
thus obtained for the proposed Cu2+ sensor are
given in Table 2. As can be seen, for all cation
used (except for Li+ and Co2+), the selectivity
coefficients are smaller than 0.01, which seem
to indicate that the disturbance produced by
these cations in the functioning of the Cu2+
sensor are negligible.

A. Ghaemi et al., J. Appl. Chem. Res., 11, 1, 81-94 (2017)90
Table 3. Lifetime of the Cu2+ selective sensor.
WeekSlope
(mV/decade)Linear
concentrationrange (M)
WeekSlope
(mV/decade)Linear
concentrationrange (M)
1 30.0±0.2 10-5-10-1 11 28.3±0.1 10-5-10-1
2 30.0±0.1 10-5-10-1 12 28.5±0.3 10-5-10-1
3 29.8±0.1 10-5-10-1 13 28.8±0.3 10-5-10-1
4 29.6±0.3 10-5-10-1 14 28.7±0.2 10-5-10-1
5 29.5±0.5 10-5-10-1 15 28.6±0.3 10-5-10-1
6 29.3±0.3 10-5-10-1 16 28.6±0.4 10-5-10-1
7 29.1±0.2 10-5-10-1 17 28.0±0.4 10-4-10-1
8 29.0±0.4 10-5-10-1 18 27.8±0.5 10-4-10-1
9 28.7±0.4 10-5-10-1 19 27.3±0.7 10-4-10-1
10 28.8±0.2 10-5-10-1 20 26.0±0.5 10-3-10-1
Lifetime
The lifetime of the Cu2+ coated graphite sensor
was tested over a period of 20 weeks. During
this period, the electrode was in daily use over
an extended period of time (1 h per day), and
the results are provided in Table 3. According
to Table 3, after 16 weeks a very slight gradual
decrease in the slopes and linear concentration
range was observed. This is caused by the
leakage of the ionophore from the membrane
to the solution.

A. Ghaemi et al., J. Appl. Chem. Res., 11, 1, 81-94 (2017) 91
Analytical performance
The proposed Cu2+ sensor was found to
work well under laboratory conditions. This
electrode was used to determine the end-point
in the potentiometric titration of Cu2+ with
EDTA solutions. Two typical titration curves
are shown in Fig. 6. In this process, 25 ml of
1.0×10⁻³ M and 25 ml of 1.0×10⁻⁴ M copper
nitrate solutions were titrated with 1.0×10⁻² M
and 1.0×10⁻³ M EDTA solutions, respectively.
As can be seen, the end points of titration are
sharp and this titration method can determine
the amount of copper ion accurately.
Figure 6. Potentiometric titration curves of 25 ml of Cu2+ (■1.0×10⁻³ M and ▲1.0×10⁻⁴ M) with 1.0×10⁻² Mand 1.0×10⁻³ M of EDTA solutions, respectively.
600
620
640
660
680
0 0.5 1 1.5 2 2.5 3 3.5 4
-E (
mV
)
V EDTA (ml)
This sensor was also used to the direct
determination of copper in doubly distilled
water (DDW) spiked with 4.0 and 8.0
ppm copper (II). The results obtained were
compared with those obtained from atomic
absorption spectrometric (AAS) analysis and
were found in good agreement (Table 4).
Therefore, the designed sensor is preferable to
AAS as an alternative method, because it is
simple, rapid and relatively inexpensive.
Table 4. Determination of Cu2+ concentration in DDW samples spiked with 4.0 and 8.0 ppm copper (II)using the Cu2+ selective sensor and comparison with AAS.
Sample No. AAS (ppm)(n = 3)
Cu2+ selective sensor (ppm)(n = 3)
1 4.2±0.1 4.4±0.3
2 8.1±0.3 8.3±0.5

A. Ghaemi et al., J. Appl. Chem. Res., 11, 1, 81-94 (2017)92
Table 6. Comparison of the characteristics of the proposed sensor with those of the previously reported Cu(II) sensors.
Ref.No. Ionophore
Lifetime(week)
Slope(mV/decade
)
pHrange
Linear range (M) Response time
(s)
[32] 2,2’-dithiodianiline 4 30.0±1.0 1.0-3.0 7.0×10⁻⁷-5.0×10⁻² 10
[33] bis[acetylacetonato] 12 29.3±0.2 2.6-6.0 2.0×10⁻⁶-1.0×10⁻¹ 9
[34] 4-phenyl-4-sulfide-11-(1-oxodecyl)-1,7-dithia-11-aza-4-
phosphacyclotetradecane
7 30.7±1.7 3.9-6.4 3.0×10⁻⁶-1.0×10⁻² ―
[35]1-phenyl-2-(2-
hydroxyphenylhydrazo)butane-1,3-dione
9 28.8±0.1 3.0-8.0 2.0×10⁻⁶-5.0×10⁻³ 10
[36] dimethyl 4, 4′-(o-phenylene)bis(3-thioallophanate)
8 30.3 3.1-7.6 9.8×10⁻⁶-1.0×10⁻¹ 20
[This
work]
1,13-bis(8-quinolyl)-1,4,7,10,13-pentaoxatridecane
(kryptofix 5)
16 30.0±0.2 2.0-10.0 1.0×10⁻⁵-1.0×10⁻¹ 15
Application in real samples
In addition, the Cu2+ selective sensor was
successfully applied to the determination of
copper (II) in neutral water samples and the
results are shown in Table 5. It is obvious that
the recovery of copper from different water
samples is almost quantitative.
Table 5. Potentiometric determination of Cu2+ ion in different real water samples using the Cu2+ selectivesensor.
Real water samples Added Cu2+
concentration(M)
Found Cu2+
concentration(M)
Recovery (%)
Tap water(Ahvaz city, Iran)
1.0×10⁻⁴ 9.6×10⁻⁵ 96.0
River water(Dez river, Iran)
Persian Gulf water
1.0×10⁻⁴
3.0×10⁻⁴
9.5×10⁻⁵
2.8×10⁻⁴
95.0
93.3
Conclusion
Kryptofix 5 can be used as an excellent
supramolecule ion carrier for construction of
a PVC-based coated graphite ion selective
sensor for determination of copper ions.

A. Ghaemi et al., J. Appl. Chem. Res., 11, 1, 81-94 (2017) 93
The best composition of the proposed sensor
was found to be PVC: DOS: PA: ionophore
= 30.0:63.5:3.0:3.5 (w/w). It exhibits
comparable performance to the reported Cu2+
selective sensors in many respects (Table
6), but shows significant superiority over
them in terms of wide pH range (2.0-10.0)
and long lifetime (16 weeks). The sensor
responds to Cu2+ in a Nernstian fashion and
displays good selectivity and detection limit.
The proposed sensor can be used for copper
determination both by direct potentiometry
and potentiometric titration. It was also
applied to determination of copper ions in real
water samples.
Acknowledgement
The authors gratefully acknowledge the
support of this work by Ahvaz Branch, Islamic
Azad University, Ahwaz, Iran.
References
[1] B. R. Stern, M. Solioz, D. Krewski, P.
Aggett, T. C. Aw, S. Baker, K. Crump, M.
Dourson, L. Haber, R. Hertzberg, C. Keen, B.
Meek, L. Rudenko, R. Schoeny, W. Slob, T.
Starr, J. Toxicol. Environ. Health, Part B, 10,
157 (2007).
[2] M. Spinazzi, F. De Lazzari, B. Tavolato, C.
Angelini, R. Manara, M. Armani, J. Neurol.,
254, 1012 (2007).
[3] R. Stern Bonnie, J. Toxicol. Environ.
Health, Part A, 73, 114 (2010).
[4] B. P. Goodman, E. P. Bosch, M. A. Ross, C.
Hoffman-Snyder, D. D. Dodick, B. E. Smith,
J. Neurol., Neurosurgery & Psychiatry, 80,
524 (2009).
[5] N. Kumar, M. A. Elliott, J. D. Hoyer, C. M.
Jr. Harper, J. E. Ahlskog, R. L. Phyliky, Mayo
Clin. Proc., 80, 943 (2005).
[6] A. Cordano, Copper deficiency in clinical
medicine. In Monographs of the American
College of Nutrition, Vol. 2, Zinc and copper
in clinical medicine, K. M. Hambidge and B.
L. Nichols, Jr. (eds), p. 119. Proceedings of
the 17th Annual Meeting. New York: SP Med.
Sci. Books (1978).
[7] D. M. Danks, Annu. Revi. Nutr., 8, 235 (1988).
[8] L. M. Klevay, J. Environ. Pathol.,
Toxicology and Oncology, 4, 281 (1980).
[9] J. J. Strain, Proc. Nutr. Soc., 53, 583 (1994).
[10] X. Wen, L. Ye, Q. Deng, L. Peng,
Spectrochim. Acta Part A: Molecular and
Biomolecular Spectroscopy, 83, 259 (2011).
[11] L. Yuan, S. H. Huo, X. N. Ren, H. Chen,
Chin. Chem. Lett., 19, 92 (2008).
[12] M. Ghiaci, B. Rezaei, M. Arshadi, Sens.
Act. B, 139, 494 (2009).
[13] R. K. Mahajan, T. P. S. Walia, Sumanjit,
T. S. Lobana, Talanta, 67, 755 (2005).
[14] Ş. Saçmacı, S. Şahan, U. Şahin, Ş. Kartal,
A. Ülgen, Mater. Sci. Eng. C, 44, 240 (2014).
[15] A. Mirabi, A. Shokuhi Rad, H. Khodadad, J.
Magnetism and Magnetic Mater., 389, 130 (2015).
[16] Z. Wei, S. Sandron, A. T. Townsend, P. N.
Nesterenko, B. Paull, Talanta, 135, 155 (2015).
A. Ghaemi et al., J. Appl. Chem. Res., 11, 1, 81-94 (2017)94
[17] J. Rybak, L. Ruzik, J. Chromatogr. A,
1281, 19 (2013).
[18] Y. Ermolenko, D. Kalyagin, I. Alekseev,
E. Bychkov, V. Kolodnikov, N. Melnikova, I.
Murin, Y. Mourzina, Y. Vlasov, Sens. Act. B,
207, 940 (2015).
[19] M. Aghaie, M. Giahi, H. Aghaie,
M. Arvand, M. Pournaghdy, F. Yavari,
Desalination, 247, 346 (2009).
[20] F. Mizani, S. Salmanzadeh Ardabili, M.
R. Ganjaliab, F. Faridbod, M. Payehghadr, M.
Azmoodeh, Mater. Sci. Eng. C, 49, 861 (2015).
[21] G. H. Rounaghi, R. Mohammad Zadeh
Kakhki, H. Sadeghian, Electrochim. Acta, 56,
9756 (2011).
[22] F. Faridbod, M. R. Ganjali, R. Dinarvand,
P. Norouzi, S. Riahi, Sensors, 8, 1645 (2008).
[23] V. K. Gupta, A. K. Singh, S. Mehtab, B.
Gupta, Anal. Chim. Acta, 566, 5 (2006).
[24] M. R. Ganjali, A. Daftari, M. Rezapour, T.
Poursaberi, S. Haghgoo, Talanta, 59, 613 (2003).
[25] M. Shamsipur, M. Javanbakht, A. R.
Hassaninejad, H. Sharghi, M. R. Ganjali, M.
F. Mousavi, Electroanalysis, 15, 1251 (2003).
[26] M. R. Ganjali, T. Poursaberi, M. khoobi,
A. Shafiee, M. Adibi, M. Pirali-Hamedani, P.
Norouzi, Int. J. Electrochem. Sci., 6, 717 (2011).
[27] E. Bakker, P. Buhlmann, E. Pretsch,
Chem. Rev., 97, 3083 (1997).
[28] E. Bakker, P. Buhlmann, E. Pretsch,
Electroanalysis, 11, 915 (1999).
[29] W. E. Morf, N. F. de Rooij, E. Pretsch, J.
Electroanal. Chem., 581, 265 (2005).
[30] J. Inczédy, T. Lengyel, A. M. Ure,
Compendium of Analytical Nomenclature,
Blackwell Science, Oxford (1998).
[31] Y. Umezawa, P. Buhlmann, K. Umezawa,
K. Tohda, S. Amemiya, Pure Appl. Chem., 72,
1851 (2000).
[32] M. B. Gholivand, N. Nozari, Talanta, 54,
597 (2001).
[33] A. K. Jain, V. K. Gupta, L. P. Singh, J. R.
Raisoni, Talanta, 66, 1355 (2005).
[34] I. A. Marques de Oliveira, M. Pla-Roca,
Ll. Escriche, J. Casabó, N. Zine, J. Bausells, J.
Samitier, A. Errachid, Mater. Sci. Eng. C, 26,
394 (2006).
[35] M. N. Kopylovich, K. T. Mahmudov, A. J. L.
Pombeiro, J. Hazard. Mater., 186, 1154 (2011).
[36] V. K. Gupta, L. P. Singh, R. Singh, N.
Upadhyay, S. P. Kaur, B. Sethi, J. Mol. Liq.,
174, 11 (2012).
.


![Investigation of properties of boehmitic sol coated ...jcpr.kbs-lab.co.kr/file/JCPR_vol.11_2010/JCPR11-1/13[1].56-60.pdf · Investigation of properties of boehmitic sol coated graphite](https://img.dokumen.tips/doc/110x75/5a78c2877f8b9a273b8e71c8/investigation-of-properties-of-boehmitic-sol-coated-jcprkbs-labcokrfilejcprvol112010jcpr11-113156-60pdfinvestigation.jpg)