Embed Size (px)
Citation preview

A New View of EIT Waves from STEREO
S. Ma1,2,3, M. J. Wills-Davey2, J. Lin1,2, P. F. Chen4,
G. D. R. Attrill2, H. Chen5, S. Zhao1, Q. Li1, and L. Golub2
suli [email protected]
Received ; accepted
1National Astronomical Observatories of China/Yunnan Astronomical Observatory,
Chinese Academy of Sciences(CAS), Kunming, Yunnan 650011, China
2Harvard-Smithsonian Center for Astrophysics, 60 Garden Street, Cambridge, MA 02138,
USA
3Graduate School of CAS, Beijing 100049, China.
4Department of Astronomy, Nanjing University, Nanjing, 210093, China
5China University of Petroleum, 739 Beiyi Road, Dongying, Shandong 257061, China
– 2 –
ABSTRACT
On 2007 December 7, there is an eruption from AR 10977, which also hosted
a sigmoid. An EIT wave associated with this eruption was observed by EUVI
on board the Solar Terrestrial Relations Observatory (STEREO). Using EUVI
images in the 171 A and the 195 A passbands from both STEREO A and B,
we study the morphology and kinematics of this EIT wave. In the early stages,
images of the EIT wave from the two STEREO spacecrafts differ markedly. We
determine that the EUV fronts observed at the very beginning of the eruption
likely include some intensity contribution from the associated CME. Additionally,
our velocity measurements suggest that the EIT wave front may propagate at
nearly constant velocity. Both results offer constraints on current models and
understanding of EIT waves.
Subject headings: Sun: eruption, Sun: EIT wave, Sun: CME, Sun: corona
– 3 –
1. Introduction
The first observations of large-scale transient coronal waves, also known as EIT waves,
were made by the EUV Imaging Telescope (EIT, Delaboudiniere et al. 1995) on board
the Solar and Heliospheric Observatory (SOHO, Domingo et al. 1995). In many events,
the EIT wave appears as a roughly circular diffuse emission enhancement propagating
globally across the solar disk. This is particularly true when the magnetic structure on
the Sun is simple (e.g., Thompson et al. 1998). When the global magnetic structure is
more complicated, EIT waves can propagate in-homogeneously, avoiding strong magnetic
features and neutral lines (e.g., Thompson et al. 1999), and generally stop near to coronal
holes (e.g., Thompson et al. 1999). Although EIT waves are found to be a quite frequent
phenomenon, there are still some open questions. There is debate as to whether EIT
waves are “flare-driven” or “CME-driven” (e.g., Uchida 1968; Warmuth et al. 2001, 2004;
Biesecker et al. 2002; Hudson et al. 2003; Zhukov & Auchere 2004; Cliver et al. 2005;
Vrsnak et al. 2006). Similarly, the physical nature of diffuse EIT waves (Vrsnak 2005) is an
active research topic, with different possible explanations, such as fast-mode MHD waves
(e.g., Thompson et al. 1999; Wills-Davey & Thompson 1999; Wang 2000; Wu et al. 2001;
Ofman & Thompson 2002; Warmuth et al. 2004; Ballai et al. 2005), slow-mode MHD waves
(Krasnoselskikh & Podladchikova 2007; Wills-Davey et al. 2007; Wang et al. 2009), non
wave propagating disturbances related to magnetic field lines opening (e.g., Delannee 2000;
Chen et al. 2002, 2005), restructuring associated with CME expansion in the low corona
(Attrill et al. 2007a,b), or a current shell around the expanding flux rope (Delannee et al.
2008).
The Solar Terrestrial Relations Observatory (STEREO, Kaiser et al. 2008) is the first
mission dedicated to studying the 3D evolution of solar eruptions, providing us with the
opportunity to observe from two different directions simultaneously. STEREO consists of
– 4 –
two identical spacecraft, orbiting the Sun at nearly 1AU, with one ahead (STEREO A)
and one behind (STEREO B) the Earth near the ecliptic plane. With observations from
different angles, it becomes possible to constrain some of the debate about EIT waves. We
briefly introduce our data in the next section, our observations and results are discussed in
Section 3, and we present our conclusions in Section 4.
2. Data
To study EIT wave morphology and propagation in the EUV, we take advantage of the
two perspectives afforded us by both STEREO-EUVI imagers (Wuelser et al. 2004; Howard
et al. 2008). The EUVI instruments image the solar chromosphere and low corona in four
emission lines: 171 A (∼1 MK), 195 A (∼1.5 MK), 284 A (∼2 MK), and 304 A (∼80,000 K)
from the solar surface out to 1.7 R⊙. The pixel-limited spatial resolution of EUVI images is
1.6′′. In this study, we focus on EUVI observations in the 171 A and in 195 A passbands,
with time cadences of 2.5 and 10 minutes, respectively. For comparison, we also use EUV
data from SOHO-EIT.
To study the origin of the EIT wave, we augment our EUV observations with Hα,
X-ray, and magnetogram data. Since such data are not available from the STEREO suite of
instruments, we turn to other sources. Our Hα observations are derived from the Yunnan
Astronomical Observatory (YNAO); we use soft X-ray data from Hinode-XRT (Golub et al.
2007; Kosugi et al. 2007); and we obtain contemporaneous 1-min cadence magnetograms
from SOHO-MDI (Scherrer et al. 1995). Our XRT images were taken using the C-poly filter
with a spatial resolution of 1.028′′ and a cadence of 60 s or less.
– 5 –
3. Observations and Results
On 2007 December 7, a diffuse EIT wave was observed at 04:25 UT, originating from
AR 10977. This event occurred along with the eruption of a filament and the disappearance
of the X-ray sigmoid. The Hα filament, which erupted at 04:33 UT, was associated with
a B1.4 flare beginning at 04:35 UT. An associated CME was later observed by both
STEREO-COR B and SOHO-LASCO.
3.1. Origin
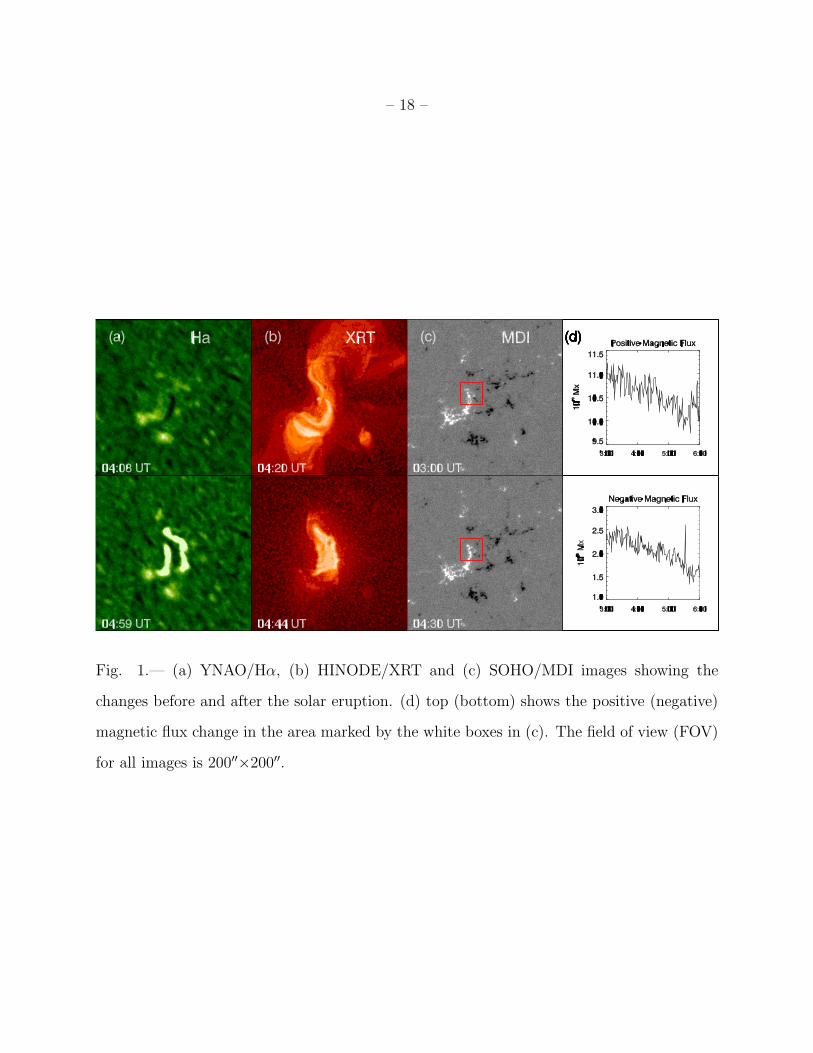
Changes resulting from this eruption were observed in the photosphere, chromosphere,
and corona. Figure 1(a) shows the corresponding Hα observations. The upper panel shows
evidence of a small filament along the neutral line of AR 10977. After the eruption at
∼04:30 UT, a two-ribbon flare appears (lower panel). Similarly, the X-ray sigmoid shows
evidence of an eruption (Figure 2(b)) by the sigmoid-to-arcade evolution (Hudson et al.
1998; Glover et al. 2002). At 04:20 UT, XRT observations show the sigmoid cospatial with
the filament (upper panel). After the eruption, a series of flare loops appears, with their
foot-points corresponding to the two Hα flare ribbons. Close examination of the XRT data
reveals that the sigmoid eruption was initiated near the center of the structure, close to the
location of the filament.
To better understand the effect of the eruption on the surrounding magnetic field, we
examine MDI magnetograph data close to the eruption origin. Figure 1(c) shows the local
magnetic field before and after the eruption; magnetic flux measurements are obtained from
the area marked by the white box, which corresponds to the photosphere below the sigmoid
eruption location. Figure 1(d) demonstrates that both the positive and negative magnetic
flux decreased during the eruption. This result suggests that cancellation occurred as part
– 6 –
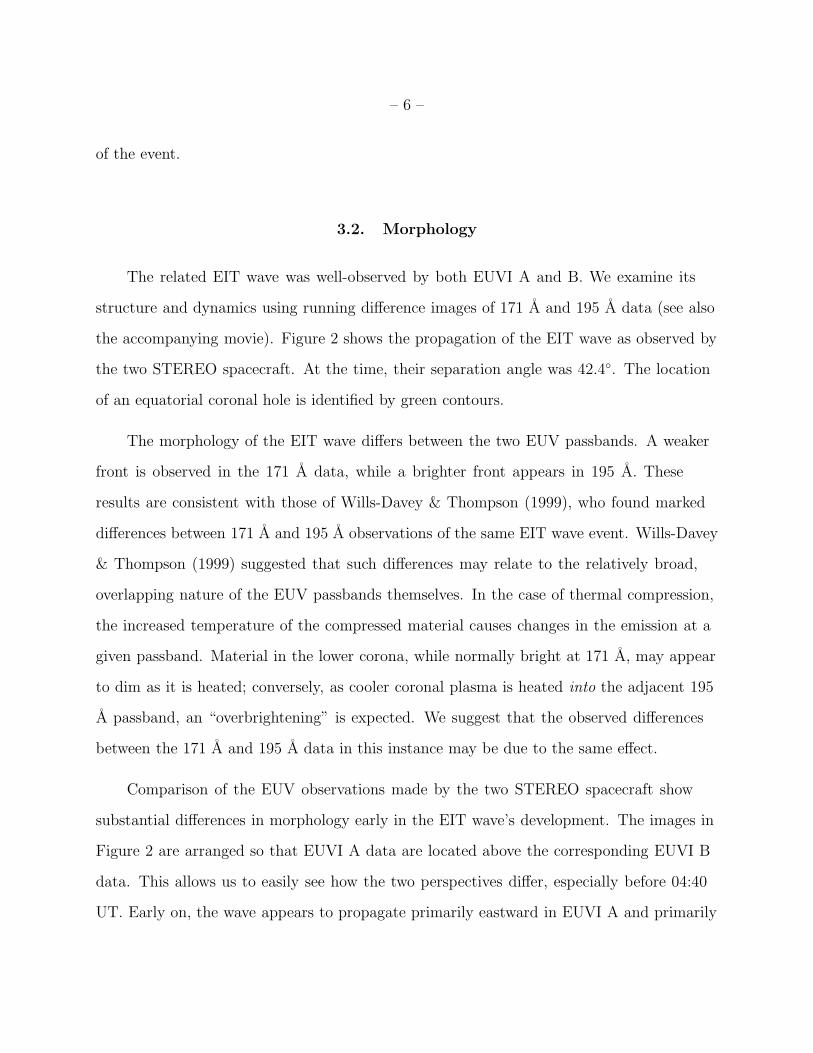
of the event.
3.2. Morphology
The related EIT wave was well-observed by both EUVI A and B. We examine its
structure and dynamics using running difference images of 171 A and 195 A data (see also
the accompanying movie). Figure 2 shows the propagation of the EIT wave as observed by
the two STEREO spacecraft. At the time, their separation angle was 42.4◦. The location
of an equatorial coronal hole is identified by green contours.
The morphology of the EIT wave differs between the two EUV passbands. A weaker
front is observed in the 171 A data, while a brighter front appears in 195 A. These
results are consistent with those of Wills-Davey & Thompson (1999), who found marked
differences between 171 A and 195 A observations of the same EIT wave event. Wills-Davey
& Thompson (1999) suggested that such differences may relate to the relatively broad,
overlapping nature of the EUV passbands themselves. In the case of thermal compression,
the increased temperature of the compressed material causes changes in the emission at a
given passband. Material in the lower corona, while normally bright at 171 A, may appear
to dim as it is heated; conversely, as cooler coronal plasma is heated into the adjacent 195
A passband, an “overbrightening” is expected. We suggest that the observed differences
between the 171 A and 195 A data in this instance may be due to the same effect.
Comparison of the EUV observations made by the two STEREO spacecraft show
substantial differences in morphology early in the EIT wave’s development. The images in
Figure 2 are arranged so that EUVI A data are located above the corresponding EUVI B
data. This allows us to easily see how the two perspectives differ, especially before 04:40
UT. Early on, the wave appears to propagate primarily eastward in EUVI A and primarily
– 7 –
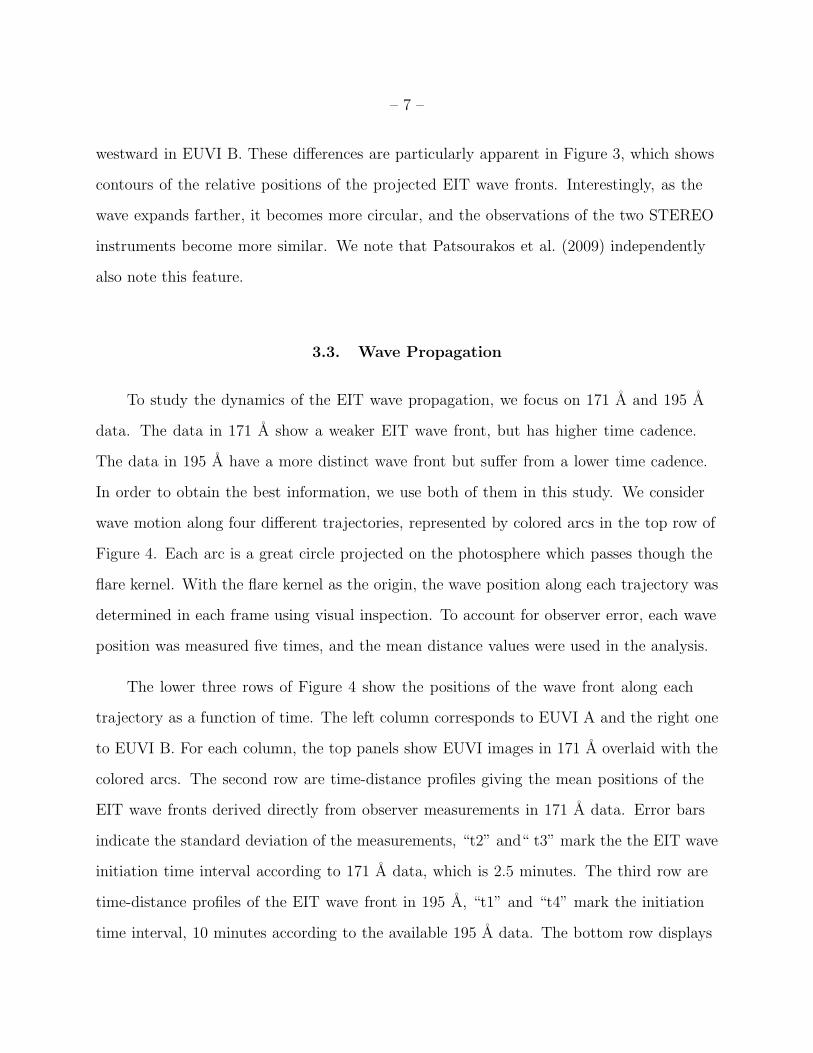
westward in EUVI B. These differences are particularly apparent in Figure 3, which shows
contours of the relative positions of the projected EIT wave fronts. Interestingly, as the
wave expands farther, it becomes more circular, and the observations of the two STEREO
instruments become more similar. We note that Patsourakos et al. (2009) independently
also note this feature.
3.3. Wave Propagation
To study the dynamics of the EIT wave propagation, we focus on 171 A and 195 A
data. The data in 171 A show a weaker EIT wave front, but has higher time cadence.
The data in 195 A have a more distinct wave front but suffer from a lower time cadence.
In order to obtain the best information, we use both of them in this study. We consider
wave motion along four different trajectories, represented by colored arcs in the top row of
Figure 4. Each arc is a great circle projected on the photosphere which passes though the
flare kernel. With the flare kernel as the origin, the wave position along each trajectory was
determined in each frame using visual inspection. To account for observer error, each wave
position was measured five times, and the mean distance values were used in the analysis.
The lower three rows of Figure 4 show the positions of the wave front along each
trajectory as a function of time. The left column corresponds to EUVI A and the right one
to EUVI B. For each column, the top panels show EUVI images in 171 A overlaid with the
colored arcs. The second row are time-distance profiles giving the mean positions of the
EIT wave fronts derived directly from observer measurements in 171 A data. Error bars
indicate the standard deviation of the measurements, “t2” and“ t3” mark the the EIT wave
initiation time interval according to 171 A data, which is 2.5 minutes. The third row are
time-distance profiles of the EIT wave front in 195 A, “t1” and “t4” mark the initiation
time interval, 10 minutes according to the available 195 A data. The bottom row displays
– 8 –
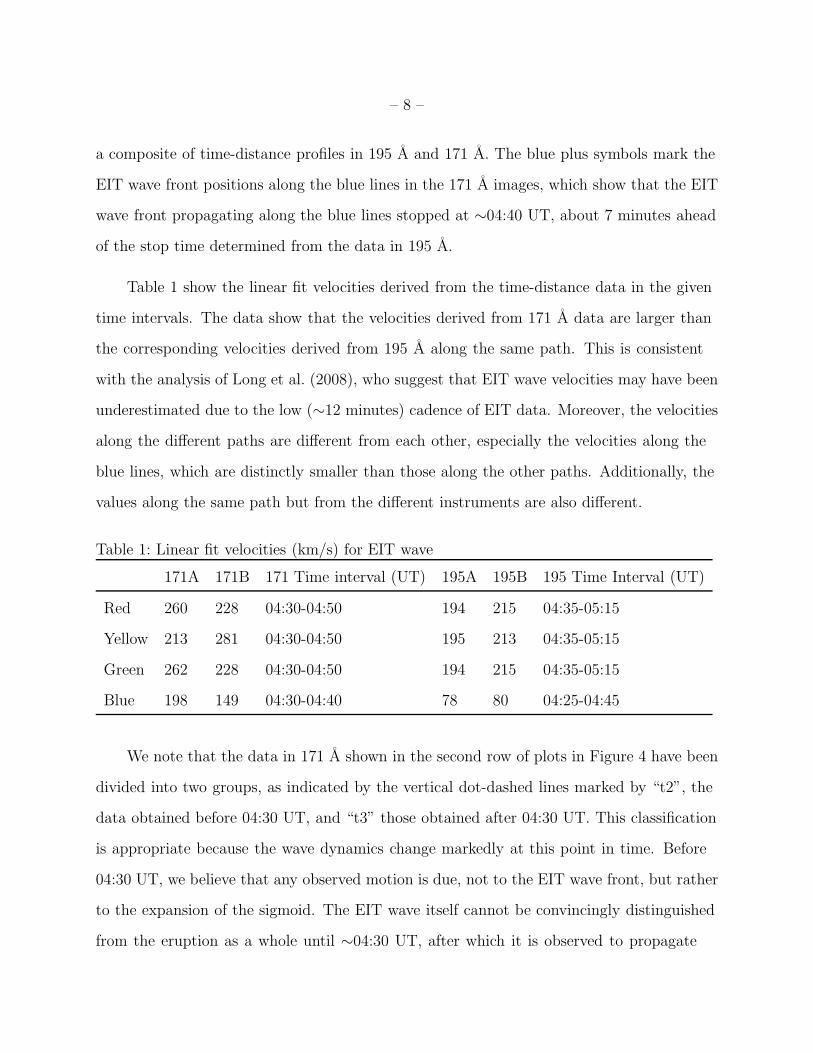
a composite of time-distance profiles in 195 A and 171 A. The blue plus symbols mark the
EIT wave front positions along the blue lines in the 171 A images, which show that the EIT
wave front propagating along the blue lines stopped at ∼04:40 UT, about 7 minutes ahead
of the stop time determined from the data in 195 A.
Table 1 show the linear fit velocities derived from the time-distance data in the given
time intervals. The data show that the velocities derived from 171 A data are larger than
the corresponding velocities derived from 195 A along the same path. This is consistent
with the analysis of Long et al. (2008), who suggest that EIT wave velocities may have been
underestimated due to the low (∼12 minutes) cadence of EIT data. Moreover, the velocities
along the different paths are different from each other, especially the velocities along the
blue lines, which are distinctly smaller than those along the other paths. Additionally, the
values along the same path but from the different instruments are also different.
Table 1: Linear fit velocities (km/s) for EIT wave
171A 171B 171 Time interval (UT) 195A 195B 195 Time Interval (UT)
Red 260 228 04:30-04:50 194 215 04:35-05:15
Yellow 213 281 04:30-04:50 195 213 04:35-05:15
Green 262 228 04:30-04:50 194 215 04:35-05:15
Blue 198 149 04:30-04:40 78 80 04:25-04:45
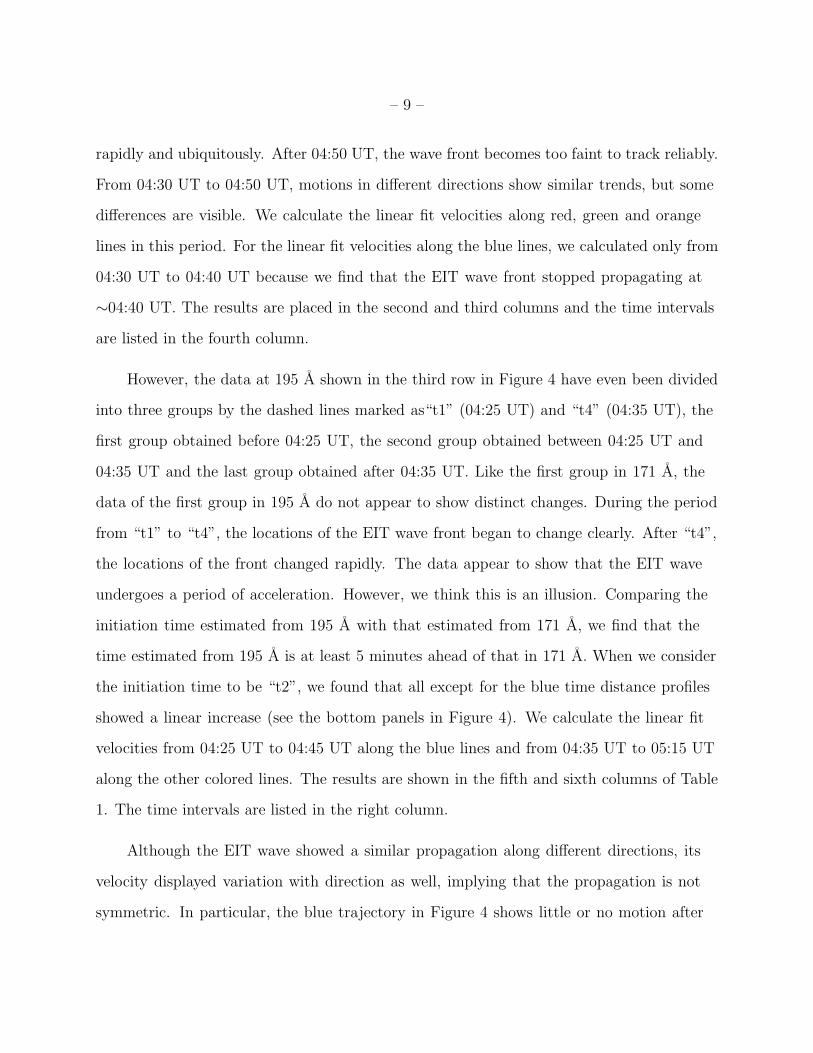
We note that the data in 171 A shown in the second row of plots in Figure 4 have been
divided into two groups, as indicated by the vertical dot-dashed lines marked by “t2”, the
data obtained before 04:30 UT, and “t3” those obtained after 04:30 UT. This classification
is appropriate because the wave dynamics change markedly at this point in time. Before
04:30 UT, we believe that any observed motion is due, not to the EIT wave front, but rather
to the expansion of the sigmoid. The EIT wave itself cannot be convincingly distinguished
from the eruption as a whole until ∼04:30 UT, after which it is observed to propagate
– 9 –
rapidly and ubiquitously. After 04:50 UT, the wave front becomes too faint to track reliably.
From 04:30 UT to 04:50 UT, motions in different directions show similar trends, but some
differences are visible. We calculate the linear fit velocities along red, green and orange
lines in this period. For the linear fit velocities along the blue lines, we calculated only from
04:30 UT to 04:40 UT because we find that the EIT wave front stopped propagating at
∼04:40 UT. The results are placed in the second and third columns and the time intervals
are listed in the fourth column.
However, the data at 195 A shown in the third row in Figure 4 have even been divided
into three groups by the dashed lines marked as“t1” (04:25 UT) and “t4” (04:35 UT), the
first group obtained before 04:25 UT, the second group obtained between 04:25 UT and
04:35 UT and the last group obtained after 04:35 UT. Like the first group in 171 A, the
data of the first group in 195 A do not appear to show distinct changes. During the period
from “t1” to “t4”, the locations of the EIT wave front began to change clearly. After “t4”,
the locations of the front changed rapidly. The data appear to show that the EIT wave
undergoes a period of acceleration. However, we think this is an illusion. Comparing the
initiation time estimated from 195 A with that estimated from 171 A, we find that the
time estimated from 195 A is at least 5 minutes ahead of that in 171 A. When we consider
the initiation time to be “t2”, we found that all except for the blue time distance profiles
showed a linear increase (see the bottom panels in Figure 4). We calculate the linear fit
velocities from 04:25 UT to 04:45 UT along the blue lines and from 04:35 UT to 05:15 UT
along the other colored lines. The results are shown in the fifth and sixth columns of Table
1. The time intervals are listed in the right column.
Although the EIT wave showed a similar propagation along different directions, its
velocity displayed variation with direction as well, implying that the propagation is not
symmetric. In particular, the blue trajectory in Figure 4 shows little or no motion after
– 10 –
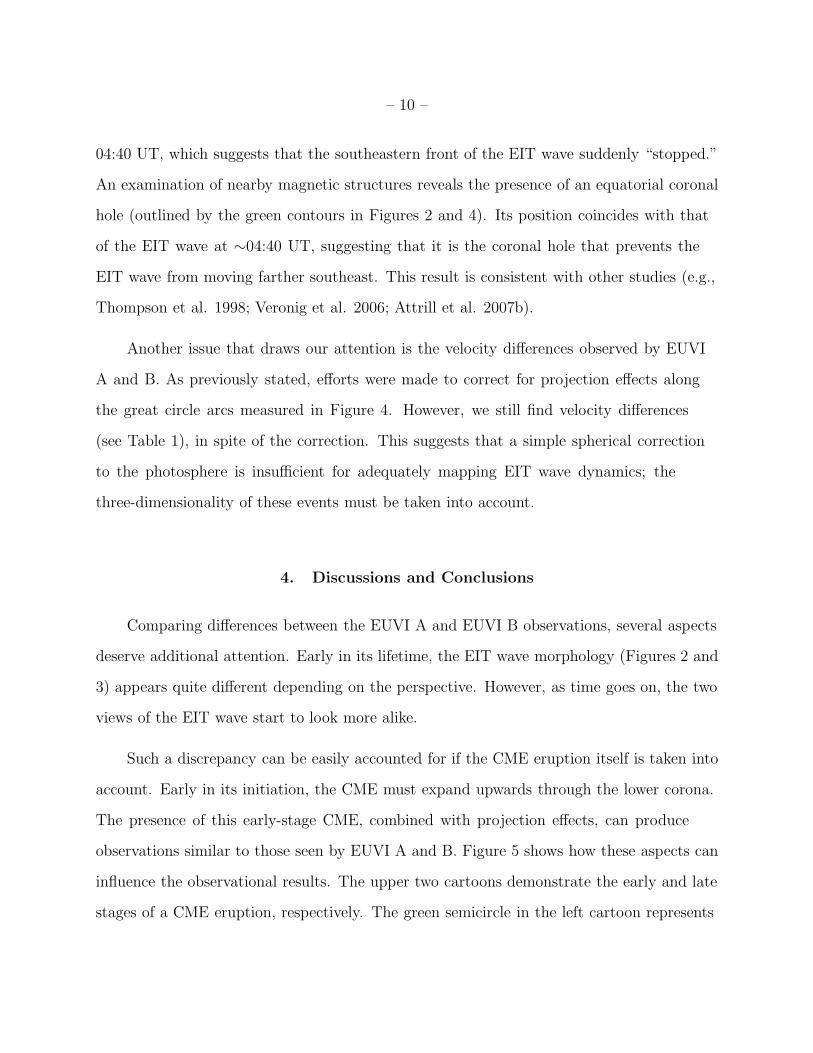
04:40 UT, which suggests that the southeastern front of the EIT wave suddenly “stopped.”
An examination of nearby magnetic structures reveals the presence of an equatorial coronal
hole (outlined by the green contours in Figures 2 and 4). Its position coincides with that
of the EIT wave at ∼04:40 UT, suggesting that it is the coronal hole that prevents the
EIT wave from moving farther southeast. This result is consistent with other studies (e.g.,
Thompson et al. 1998; Veronig et al. 2006; Attrill et al. 2007b).
Another issue that draws our attention is the velocity differences observed by EUVI
A and B. As previously stated, efforts were made to correct for projection effects along
the great circle arcs measured in Figure 4. However, we still find velocity differences
(see Table 1), in spite of the correction. This suggests that a simple spherical correction
to the photosphere is insufficient for adequately mapping EIT wave dynamics; the
three-dimensionality of these events must be taken into account.
4. Discussions and Conclusions
Comparing differences between the EUVI A and EUVI B observations, several aspects
deserve additional attention. Early in its lifetime, the EIT wave morphology (Figures 2 and
3) appears quite different depending on the perspective. However, as time goes on, the two
views of the EIT wave start to look more alike.
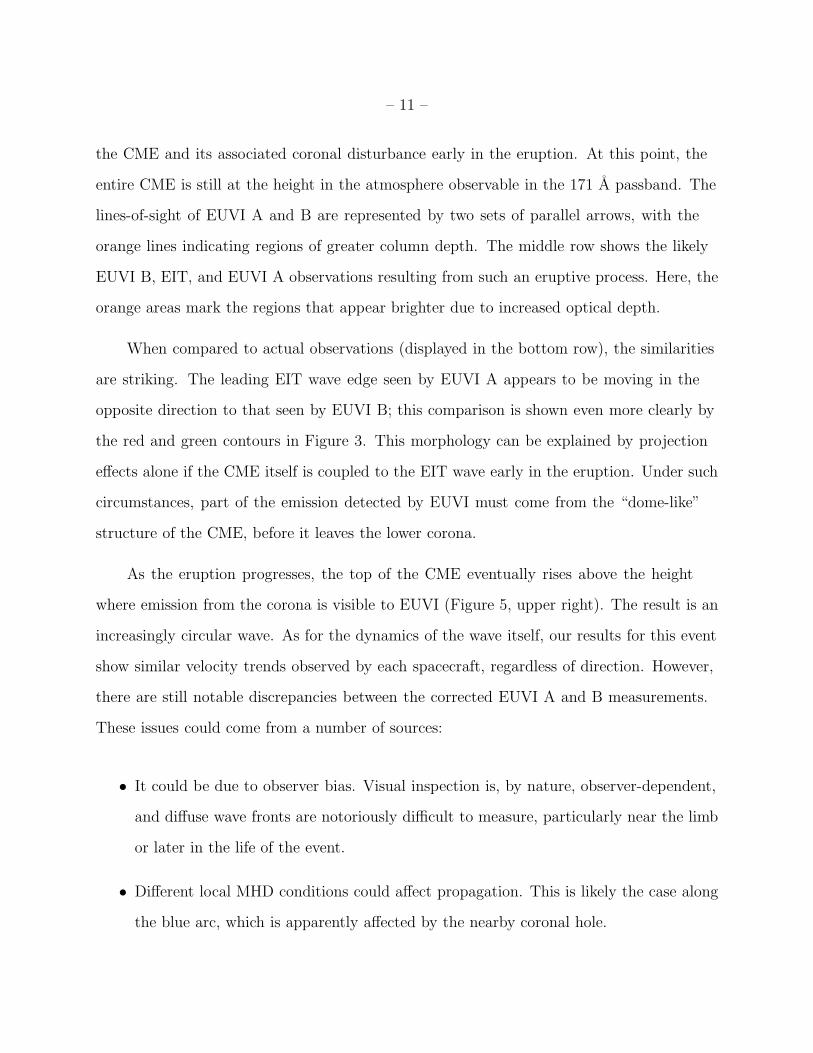
Such a discrepancy can be easily accounted for if the CME eruption itself is taken into
account. Early in its initiation, the CME must expand upwards through the lower corona.
The presence of this early-stage CME, combined with projection effects, can produce
observations similar to those seen by EUVI A and B. Figure 5 shows how these aspects can
influence the observational results. The upper two cartoons demonstrate the early and late
stages of a CME eruption, respectively. The green semicircle in the left cartoon represents
– 11 –
the CME and its associated coronal disturbance early in the eruption. At this point, the
entire CME is still at the height in the atmosphere observable in the 171 A passband. The
lines-of-sight of EUVI A and B are represented by two sets of parallel arrows, with the
orange lines indicating regions of greater column depth. The middle row shows the likely
EUVI B, EIT, and EUVI A observations resulting from such an eruptive process. Here, the
orange areas mark the regions that appear brighter due to increased optical depth.
When compared to actual observations (displayed in the bottom row), the similarities
are striking. The leading EIT wave edge seen by EUVI A appears to be moving in the
opposite direction to that seen by EUVI B; this comparison is shown even more clearly by
the red and green contours in Figure 3. This morphology can be explained by projection
effects alone if the CME itself is coupled to the EIT wave early in the eruption. Under such
circumstances, part of the emission detected by EUVI must come from the “dome-like”
structure of the CME, before it leaves the lower corona.
As the eruption progresses, the top of the CME eventually rises above the height
where emission from the corona is visible to EUVI (Figure 5, upper right). The result is an
increasingly circular wave. As for the dynamics of the wave itself, our results for this event
show similar velocity trends observed by each spacecraft, regardless of direction. However,
there are still notable discrepancies between the corrected EUVI A and B measurements.
These issues could come from a number of sources:
• It could be due to observer bias. Visual inspection is, by nature, observer-dependent,
and diffuse wave fronts are notoriously difficult to measure, particularly near the limb
or later in the life of the event.
• Different local MHD conditions could affect propagation. This is likely the case along
the blue arc, which is apparently affected by the nearby coronal hole.
– 12 –
• The projection effect corrections might not be accurate. Such corrections assume that
the wave exists as an infinitesimally thin layer at the photosphere, which is a poor
approximation at best.
Considering the initiation time of the EIT wave, both the data in 171 A and in 195
A seem to support a time distance fit of a linear increase, indicating constant velocity.
According to this study, the low time cadence of 195 A may mislead to a cursory
examination to the conclusion that the EIT wave experiences an acceleration period at the
beginning of the EIT wave propagation. Due to the low time cadence the initiation time of
the EIT wave is inaccurate.Therefore, the 195 A with 10 minute cadence is not enough to
prove EIT wave experienced an acceleration period.
Our measurement fits suggesting constant velocity are consistent with the new results
of Kienreich et al. (2009), but differ from other previous findings. Warmuth et al. (2004)
and Veronig et al. (2008) find that some EIT waves decelerate as they propagate, and Long
et al. (2008) observe an increase and then decrease in EIT wave velocity. It is possible
that the different results come from the different definition of the EIT wave initiation time.
Rather than marking it as coincident with the first observed motion (which could well be
related to the expansion of the sigmoid), we relate the onset to the first appearance of the
well-defined bright front. Interestingly enough, if a similar assumption of the initiation
time, 12:50 UT, of EIT wave is made for the work of Long et al. (2008), the time-distance
profiles in 171 A at the top panels in Figure 3 in that paper then also show a constant
velocity, which is consistent with our results. Higher time cadence at 195 A are required for
future studies to reliably reconcile such results.
By taking advantage of STEREO’s dual perspective, this study offers compelling
evidence of the ways that observations are affected by the inherent three-dimensionality of
EIT waves. There is much evidence to suggest that EIT waves are confined to a layer within
– 13 –
the lower corona (Thompson et al. 1999; Warmuth et al. 2004, 2005; Vrsnak 2005), recently
this has been determined from STEREO observations as being ∼90 Mm (Patsourakos et al.
2009; Kienreich et al. 2009). However, our study finds that, in the early stages, the EUV
intensity enhancement observed as an “EIT wave” is due, not only to density changes close
to the surface, but also to the added column depth of the CME itself. When considered in
the context of velocity incongruities between EUVI A and B, these results lend credence to
the idea that EIT waves exist over some non-negligible height in the corona. It is apparent
that such morphology, neglected for so long, can materially influence results if not taken
into account, and must be considered in future analyses and modeling efforts.
The STEREO/SECCHI data are produced by an international consortium: NRL,
LMSAL, NASA, GSFC (USA); RAL (UK); MPS (Germany); CSL (Belgium); and IOTA,
IAS (France). Hinode is a Japanese mission developed and launched by ISAS/JAXA,
collaborating with NAOJ as a domestic partner, NASA and STFC (UK) as international
partners. Scientific operation of the Hinode mission is conducted by the Hinode science
team organized at ISAS/JAXA. This team mainly consists of scientists from institutes
in the partner countries. Support for the post-launch operation is provided by JAXA
and NAOJ (Japan), STFC (U.K.), NASA, ESA, and NSC (Norway). SOHO is a project
of international cooperation between ESA & NASA. YNAO/Hα telescope is run by the
Yunnan Astronomical Observatory, Chinese Academy of Science. This work was supported
by Program 973 grant 2006CB806303, by NSFC grants 10873030 and 40636031, and by CAS
grant KJCX2-YW-T04 to YNAO. SM was also supported by NASA grant SP02H1701R and
NNM07AB07C. MJWD and GDRA gratefully acknowledge NASA grant NNX09AB11G.
JL was supported by NASA grant NNX07AL72G when visiting CfA.
– 14 –
REFERENCES
Attrill, G. D. R., Harra, L. K., van Driel-Gesztelyi, L., & Demoulin, P. 2007a, ApJ, 656,
L101
Attrill, G. D. R., Harra, L. K., van Driel-Gesztelyi, L., Demoulin, P., & Wulser, J.-P. 2007b,
Astronomische Nachrichten, 328, 760
Ballai, I., Erdelyi, R., & Pinter, B. 2005, ApJ, 633, L145
Biesecker, D. A., Myers, D. C., Thompson, B. J., Hammer, D. M., & Vourlidas, A. 2002,
ApJ, 569, 1009
Chen, P. F., Fang, C., & Shibata, K. 2005, ApJ, 622, 1202
Chen, P. F., Wu, S. T., Shibata, K., & Fang, C. 2002, ApJ, 572, L99
Cliver, E. W., Laurenza, M., Storini, M., & Thompson, B. J. 2005, ApJ, 631, 604
Delaboudiniere, J.-P., Artzner, G. E., Brunaud, J., Gabriel, A. H., Hochedez, J. F., Millier,
F., Song, X. Y., Au, B., Dere, K. P., Howard, R. A., Kreplin, R., Michels, D. J.,
Moses, J. D., Defise, J. M., Jamar, C., Rochus, P., Chauvineau, J. P., Marioge,
J. P., Catura, R. C., Lemen, J. R., Shing, L., Stern, R. A., Gurman, J. B., Neupert,
W. M., Maucherat, A., Clette, F., Cugnon, P., & van Dessel, E. L. 1995, Sol. Phys.,
162, 291
Delannee, C. 2000, ApJ, 545, 512
Delannee, C., Torok, T., Aulanier, G., & Hochedez, J.-F. 2008, Sol. Phys., 247, 123
Domingo, V., Fleck, B., & Poland, A. I. 1995, Sol. Phys., 162, 1
Glover, A., Ranns, N. D. R., Brown, D. S., Harra, L. K., Matthews, S. A., & Culhane, J. L.
2002, Journal of Atmospheric and Solar-Terrestrial Physics, 64, 497
– 15 –
Golub, L., Deluca, E., Austin, G., Bookbinder, J., Caldwell, D., Cheimets, P., Cirtain, J.,
Cosmo, M., Reid, P., Sette, A., Weber, M., Sakao, T., Kano, R., Shibasaki, K., Hara,
H., Tsuneta, S., Kumagai, K., Tamura, T., Shimojo, M., McCracken, J., Carpenter,
J., Haight, H., Siler, R., Wright, E., Tucker, J., Rutledge, H., Barbera, M., Peres,
G., & Varisco, S. 2007, Sol. Phys., 243, 63
Howard, R. A., Moses, J. D., Vourlidas, A., Newmark, J. S., Socker, D. G., Plunkett, S. P.,
Korendyke, C. M., Cook, J. W., Hurley, A., Davila, J. M., Thompson, W. T., St
Cyr, O. C., Mentzell, E., Mehalick, K., Lemen, J. R., Wuelser, J. P., Duncan, D. W.,
Tarbell, T. D., Wolfson, C. J., Moore, A., Harrison, R. A., Waltham, N. R., Lang, J.,
Davis, C. J., Eyles, C. J., Mapson-Menard, H., Simnett, G. M., Halain, J. P., Defise,
J. M., Mazy, E., Rochus, P., Mercier, R., Ravet, M. F., Delmotte, F., Auchere, F.,
Delaboudiniere, J. P., Bothmer, V., Deutsch, W., Wang, D., Rich, N., Cooper, S.,
Stephens, V., Maahs, G., Baugh, R., McMullin, D., & Carter, T. 2008, Space Science
Reviews, 136, 67
Hudson, H. S., Khan, J. I., Lemen, J. R., Nitta, N. V., & Uchida, Y. 2003, Sol. Phys., 212,
121
Hudson, H. S., Lemen, J. R., St. Cyr, O. C., Sterling, A. C., & Webb, D. F. 1998,
Geophys. Res. Lett., 25, 2481
Kaiser, M. L., Kucera, T. A., Davila, J. M., St. Cyr, O. C., Guhathakurta, M., & Christian,
E. 2008, Space Science Reviews, 136, 5
Kienreich, I. W., Temmer, M., & Veronig, A. M. 2009, ApJ, 703, L118
Kosugi, T., Matsuzaki, K., Sakao, T., Shimizu, T., Sone, Y., Tachikawa, S., Hashimoto,
T., Minesugi, K., Ohnishi, A., Yamada, T., Tsuneta, S., Hara, H., Ichimoto, K.,
Suematsu, Y., Shimojo, M., Watanabe, T., Shimada, S., Davis, J. M., Hill, L. D.,
– 16 –
Owens, J. K., Title, A. M., Culhane, J. L., Harra, L. K., Doschek, G. A., & Golub,
L. 2007, Sol. Phys., 243, 3
Krasnoselskikh, V. & Podladchikova, O. 2007, AGU Fall Meeting Abstracts, A1047
Long, D. M., Gallagher, P. T., McAteer, R. T. J., & Bloomfield, D. S. 2008, ApJ, 680, L81
Ofman, L. & Thompson, B. J. 2002, ApJ, 574, 440
Patsourakos, S., Vourlidas, A., Wang, Y. M., Stenborg, G., & Thernisien, A. 2009,
Sol. Phys., 90
Scherrer, P. H., Bogart, R. S., Bush, R. I., Hoeksema, J. T., Kosovichev, A. G., Schou, J.,
Rosenberg, W., Springer, L., Tarbell, T. D., Title, A., Wolfson, C. J., Zayer, I., &
MDI Engineering Team. 1995, Sol. Phys., 162, 129
Thompson, B. J., Gurman, J. B., Neupert, W. M., Newmark, J. S., Delaboudiniere, J.-P.,
St. Cyr, O. C., Stezelberger, S., Dere, K. P., Howard, R. A., & Michels, D. J. 1999,
ApJ, 517, L151
Thompson, B. J., Plunkett, S. P., Gurman, J. B., Newmark, J. S., St. Cyr, O. C., &
Michels, D. J. 1998, Geophys. Res. Lett., 25, 2465
Uchida, Y. 1968, Sol. Phys., 4, 30
Veronig, A. M., Temmer, M., & Vrsnak, B. 2008, ApJ, 681, L113
Vrsnak, B. 2005, EOS Transactions, 86, 112
Vrsnak, B., Warmuth, A., Temmer, M., Veronig, A., Magdalenic, J., Hillaris, A., &
Karlicky, M. 2006, A&A, 448, 739
Wang, H., Shen, C., & Lin, J. 2009, ApJ, in press

– 17 –
Wang, Y.-M. 2000, ApJ, 543, L89
Warmuth, A., Mann, G., & Aurass, H. 2005, ApJ, 626, L121
Warmuth, A., Vrsnak, B., Aurass, H., & Hanslmeier, A. 2001, ApJ, 560, L105
Warmuth, A., Vrsnak, B., Magdalenic, J., Hanslmeier, A., & Otruba, W. 2004, A&A, 418,
1101
Wills-Davey, M. J., DeForest, C. E., & Stenflo, J. O. 2007, ApJ, 664, 556
Wills-Davey, M. J. & Thompson, B. J. 1999, Sol. Phys., 190, 467
Wu, S. T., Zheng, H., Wang, S., Thompson, B. J., Plunkett, S. P., Zhao, X. P., & Dryer,
M. 2001, J. Geophys. Res., 106, 25089
Wuelser, J.-P., Lemen, J. R., Tarbell, T. D., Wolfson, C. J., Cannon, J. C., Carpenter,
B. A., Duncan, D. W., Gradwohl, G. S., Meyer, S. B., Moore, A. S., Navarro, R. L.,
Pearson, J. D., Rossi, G. R., Springer, L. A., Howard, R. A., Moses, J. D., Newmark,
J. S., Delaboudiniere, J.-P., Artzner, G. E., Auchere, F., Bougnet, M., Bouyries,
P., Bridou, F., Clotaire, J.-Y., Colas, G., Delmotte, F., Jerome, A., Lamare, M.,
Mercier, R., Mullot, M., Ravet, M.-F., Song, X., Bothmer, V., & Deutsch, W. 2004,
in Presented at the Society of Photo-Optical Instrumentation Engineers (SPIE)
Conference, Vol. 5171, Telescopes and Instrumentation for Solar Astrophysics. Edited
by Fineschi, Silvano; Gummin, Mark A. Proceedings of the SPIE, Volume 5171, pp.
111-122 (2004)., ed. S. Fineschi & M. A. Gummin, 111–122
Zhukov, A. N. & Auchere, F. 2004, A&A, 427, 705
This manuscript was prepared with the AAS LATEX macros v5.2.
– 18 –
Fig. 1.— (a) YNAO/Hα, (b) HINODE/XRT and (c) SOHO/MDI images showing the
changes before and after the solar eruption. (d) top (bottom) shows the positive (negative)
magnetic flux change in the area marked by the white boxes in (c). The field of view (FOV)
for all images is 200′′×200′′.
– 19 –
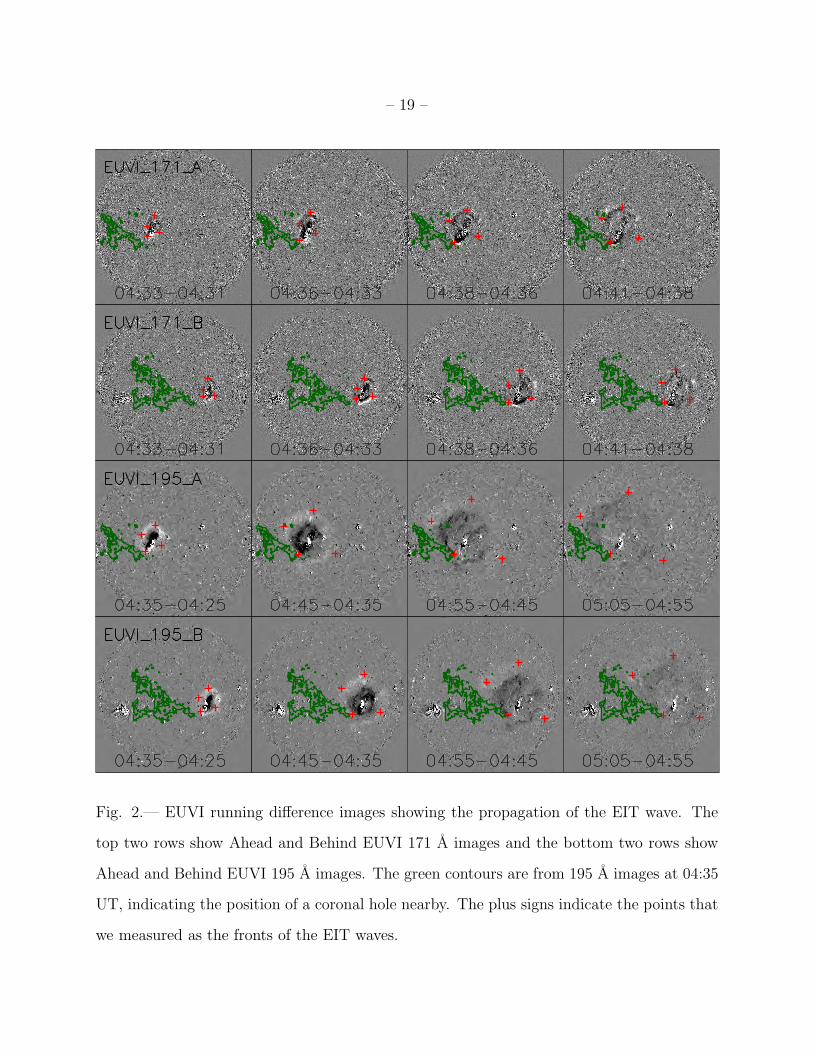
Fig. 2.— EUVI running difference images showing the propagation of the EIT wave. The
top two rows show Ahead and Behind EUVI 171 A images and the bottom two rows show
Ahead and Behind EUVI 195 A images. The green contours are from 195 A images at 04:35
UT, indicating the position of a coronal hole nearby. The plus signs indicate the points that
we measured as the fronts of the EIT waves.

– 20 –
Fig. 3.— Figure 3 is an XRT image of the pre-eruption sigmoidal region. Overlaid are
contours of the EUVI wave fronts at about 04:35 UT. Green (red) contours show the EUVI
A (B) bright fronts rotated to match the XRT data. The figure shows the relationship
between EUVI wave fronts and the surrounding coronal structures.
– 21 –
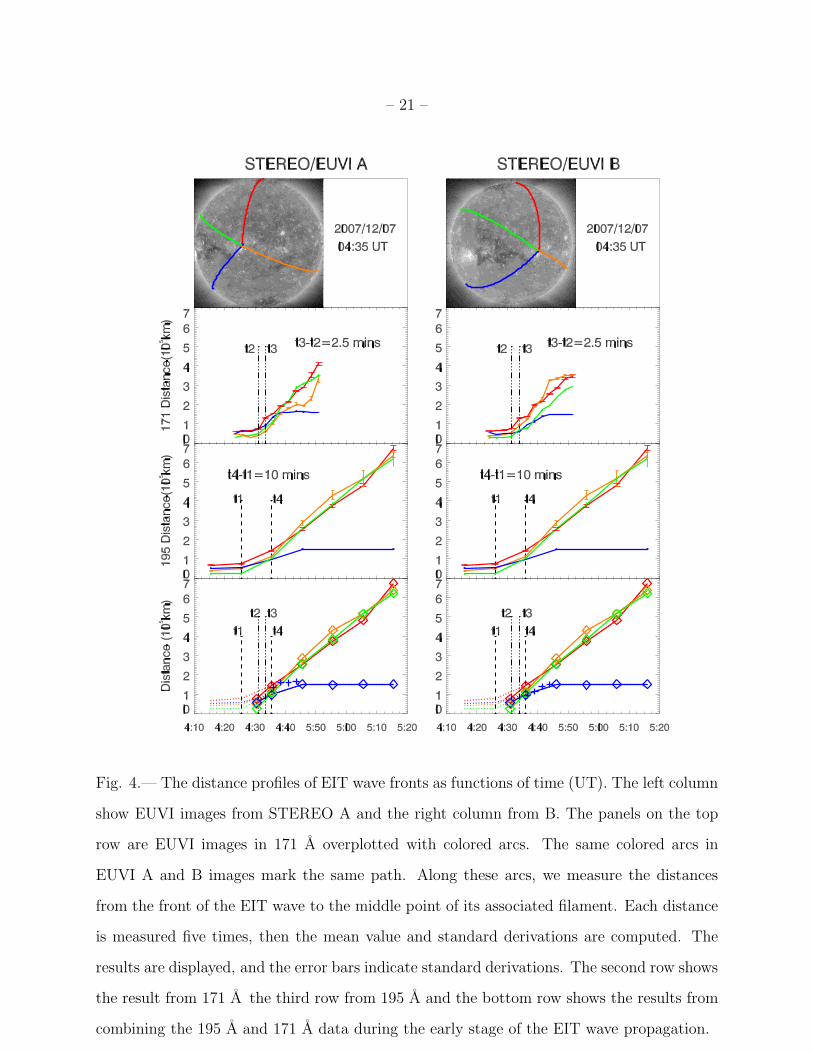
Fig. 4.— The distance profiles of EIT wave fronts as functions of time (UT). The left column
show EUVI images from STEREO A and the right column from B. The panels on the top
row are EUVI images in 171 A overplotted with colored arcs. The same colored arcs in
EUVI A and B images mark the same path. Along these arcs, we measure the distances
from the front of the EIT wave to the middle point of its associated filament. Each distance
is measured five times, then the mean value and standard derivations are computed. The
results are displayed, and the error bars indicate standard derivations. The second row shows
the result from 171 A the third row from 195 A and the bottom row shows the results from
combining the 195 A and 171 A data during the early stage of the EIT wave propagation.
– 22 –
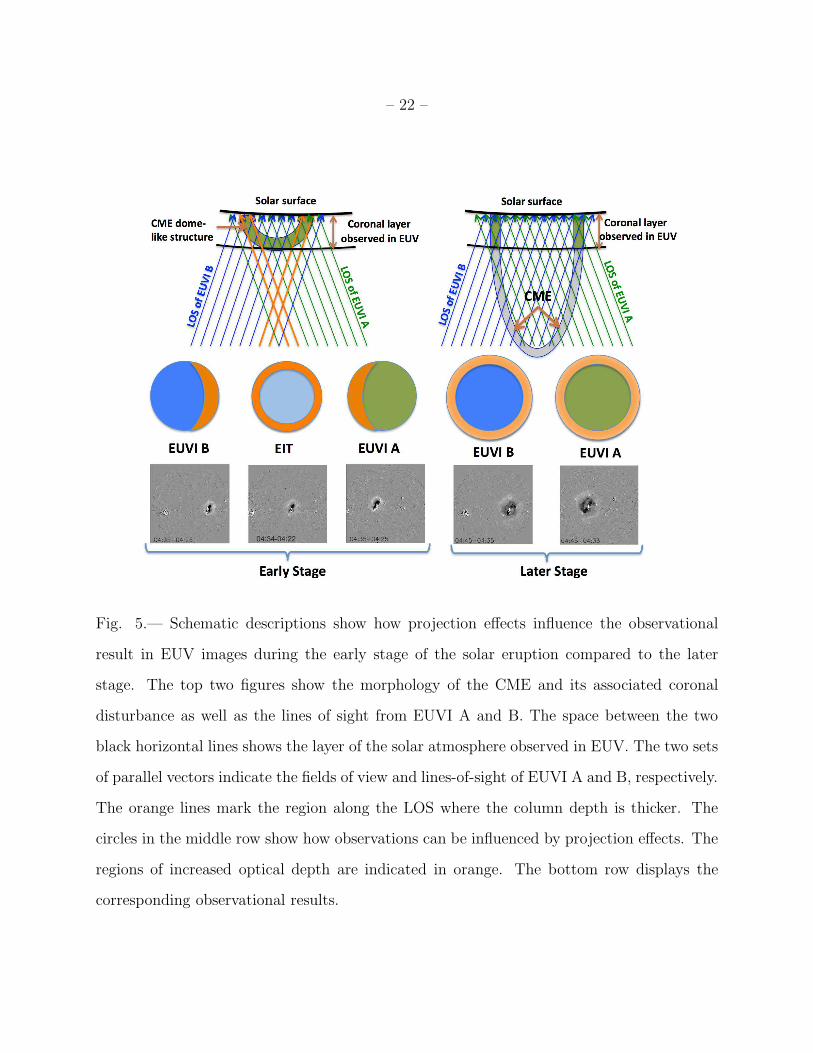
Fig. 5.— Schematic descriptions show how projection effects influence the observational
result in EUV images during the early stage of the solar eruption compared to the later
stage. The top two figures show the morphology of the CME and its associated coronal
disturbance as well as the lines of sight from EUVI A and B. The space between the two
black horizontal lines shows the layer of the solar atmosphere observed in EUV. The two sets
of parallel vectors indicate the fields of view and lines-of-sight of EUVI A and B, respectively.
The orange lines mark the region along the LOS where the column depth is thicker. The
circles in the middle row show how observations can be influenced by projection effects. The
regions of increased optical depth are indicated in orange. The bottom row displays the
corresponding observational results.