Embed Size (px)
Citation preview

pwc.co.nz
A newparadigm forNZ interestrates?
Where have wecome from….where are we now…and where are wegoing to?
A discussion paper from PwC Treasury Advisory
A new paradigm for NZ
interest rates?
3 June 2016

Executive summary
New Zealand and global interest rates have been “lower for longer” for more than six
years now. Whether these record low interest rates continue for many more years to
come, or whether economic conditions change to force interest rates higher or lower
from current levels are addressed by this discussion paper. We do not have definitive
answers for readers, however our analysis and insights will hopefully clarify the debate.
Current interest rate drivers Current New Zealand short-term interest rates are below the level deemed by the
RBNZ to be ‘neutral’ of 4.50%. A neutral short-term interest rate level is consistent with
the economy running neither too hot nor too cold in terms of economic activity and related
consumer price inflation pressures. Furthermore, the neutral level has already been markedly
lower for the post Global Financial Crisis (“GFC”) period relative to the pre GFC period. A
movement back up to (or above) the neutral level will require either stronger demand than
supply (i.e. emergence of a ‘positive’ output gap) and/or stronger oil/domestic petrol prices
pushing up headline inflation rates and inflation expectations. There is also the potential the
RBNZ need to revise their judgment of the neutral short-term interest rate lower from the
current 4.50% estimate.
There is a long close correlation between US and New Zealand government bond yields
because of the high level of foreign ownership of our government bonds (66.5%) and very
integrated global financial/capital markets (i.e. the impact and activity of international
investors).
New Zealand 10-Year Government Bond Yields are approximately 100 basis points (1.00%)
above those in the US (60% higher). The basis point premium is currently lower relative to
history although interestingly the differential has been higher post GFC (1.85% average spread
between New Zealand and US Government bond yields) rather than pre GFC (1.45% average).
There may be scope for short-term (90-day) interest rate differentials to narrow based on the
assessment of ‘neutral’ policy rates by the New Zealand and US central banks, however there
may be considerably less propensity for the 10 year government bond yield differential to do
so. In percentage terms, there appears only limited scope for the premium of New
Zealand 10-Year Government Bond Yields relative to those in the US to reduce.
Whilst the absolute level of 90 day bank bill rates and 10 year swap rates have reduced post
GFC, the New Zealand 10-year swap spread (10 year swap rate less 10 year government bond
yield) has not reduced by the same proportionate amount, recognising the relatively small size
of the New Zealand swap market. The increased regulatory environment, higher capital
requirement and less credit risk associated with central clearing houses are reasons why swap
spreads could narrow. A 10 year swap spread in the range of 0.25% and up to 0.75%
still appears relevant, even in an environment of the wholesale market swap
yield curve (90 day bank bill to 10 year swap rates) being between 3.00% and
5.00%.
US long-term interest rates remain well below a level indicated by (higher)
inflation pressures and other more upbeat US economic data; inflation pressures

2
also appear set to increase. US long-term interest rates are being held at current low levels
impacted by the massive bond holdings of the US Federal Reserve, with these only to be very
slowly allowed to unwind/reduce. Asian investor buying and holdings of US Treasury bonds is
also currently holding yields down, however these investors may become sellers, sending
yields higher.
Global economic growth and the stage of the commodity price cycle does not
auger for rapid movements higher in US interest rates. So too the US Federal Reserve
is very mindful of disrupting US and emerging market equity markets and valuations, hence
the cautious approach from Janet Yellen to increase short-term interest rates. Success of
European monetary policy Quantitative Easing policies to eventually re-stimulate investment
markets and consumer spending would likely support higher interest rates globally relative to
existing levels.
Global demographics of ageing populations and greater savings rates are a
significant contributing factor to driving global long-term interest rates lower.
The limited universe of assets/securities in which to invest to earn a reasonable return and
match long-term liabilities/commitments within pension funds and life insurers also
continues to place downward pressure on US long-term interest rates. If the US economy is
sufficiently strong (inflation/activity) and the US Federal Reserve tightens monetary policy by
more than is currently expected by benign interest rate market pricing, US long-term bond
yields would be expected to rise – and New Zealand follow. That action could create renewed
divergence (not further convergence) with European/Japanese rates which are presently
providing downward pressure on US / global interest rates. Global bond yields have been
converging amidst negative central bank monetary policy rates in many countries and
quantitative easing programs of purchasing government bonds driving longer-term bond
yields very low and often negative. US inflation expectations/real rates and term premium
over “neutral rates” are also at play; the ‘ratcheting lower’ of interest rates may already have
occurred.
No amount of super-loose monetary policy may be sufficient to stimulate
economic outcomes (even if measured correctly) should wider societal
undercurrents (ageing population, underemployment, technological
improvement, job obsolescence, income inequality) be at play with these
arresting monetary policy as irrelevant. The implication is no pressure for interest rates
to increase but equally no point of lower interest rates. Big question; can the European Central
Bank President Mario Draghi’s sleight of hand with non-traditional monetary policy measures
match that of Ben Bernanke now that German opposition has been overcome???
Specific credit market drivers would argue for further widening in credit spreads
over coming years. Whilst this would normally be associated with lower wholesale market
swap rates, such may not be as clear cut this time impacted by the already very low level of
wholesale market swap rates and all-up yields / bond coupons. At the very least, widening
credit spreads would contain the extent of rising wholesale market rates. An outlook for wider
credit spreads and lower swap rates cannot be dismissed.
Implications of current interest rate driversThere is reasonably strong evidence to suggest interest rates have fallen to their lowest levels and will
remain low relative to the pre-GFC period due to the following factors:-
The output gap in New Zealand (which measures the extent the economy is growing at
versus the ‘potential’ growth rate that does not cause excess inflation pressures) has
remained negative, reflecting increases in supply in excess of demand. Headline

3
consumer inflation in New Zealand and the US has also fallen sharply impacted by the sharp
weakening in oil prices, in turn lowering inflation expectations. Latest movements in oil prices
and (US market implied inflation expectations) indicate scope for this to be partially reversed.
In October 2013 and confirmed as recently as September 2015 the RBNZ have estimated the
neutral 90 day interest rate as 4.50%. US Federal Reserve committee members’
estimates of the ‘long-run’ US 3 month LIBOR rate is 3.25% (although it is not crystal
clear whether this can be directly compared to a neutral rate or reflects a rate closer to the top
of the interest rate cycle). It would be expected it will take the US Federal Reserve some years
to get to this ‘long-run’ rate. The 1.25% average (‘neutral’) differential between New Zealand
and US 90 day interest rates is consistent with an approximately average 1.00% risk premium
between New Zealand and US 10 year government bond yields. The bond market places a
more conservative allowance for the very small size of the New Zealand market that does
makes it harder to get into and out of therefore can be an inhibitor to capital and financial
flows. A further factor is the relatively narrow, small-based economy (with an agricultural
focus) does also create an economic risk for New Zealand. The implication of these two factors
is a higher compensation for risk (i.e. wider risk premium on government bonds) represented
in the 1.00% risk premium.
US long-term interest rates remain well below a level indicated by (higher) inflation pressures,
reflecting the largely successful implementation of the US Federal Reserve in their
Quantitative Easing bond purchase programme driving US long-term bond yields lower.
Global ‘convergence’ of low long-term interest rates with Japanese and now
European quantitative easing programmes (and now negative central bank policy
rates and Government bond yields) has also driven US and New Zealand long-
term interest rates lower.
What is the final unwritten chapter of previous US Federal Reserve Chairman
Ben Bernanke’s Quantitative Easing (“QE”) playbook to pull the US economy out
of recession? The massive QE buying of bonds to put cash into the US economy a few years
back has succeeded, however Ben did not provide the answers/guidance on how to unwind the
QE stimulus (‘yours Janet’!). Ultimately the US Federal Reserve need to sell all the Treasury
Bonds they purchased. It may take 20 years to do so, however bond yields can only go up when
they start. Alternatively the Federal Reserve will hold the bonds until they mature (and
ultimately not replace these).
Another consideration is if, when and how do the Chinese investors currently
holding US Treasury Bonds reduce their holdings to generate the cash which may
be necessary to shore up economic growth back in China? The Chinese built up large
Foreign Exchange Reserves through trade surpluses from 2002 to 2014 that were invested in
US treasury bonds to an amount equivalent to approximately half of the holdings of the US
Federal Reserve. Japanese investors hold a similar amount of US Federal Government Debt as
the Chinese. Combined, the Federal Reserve, Chinese and Japanese investors hold more than
one third of all US Federal Government debt.
Implications from QE and negative monetary policy rates shows it is the central bankers
largely running bonds yields at present, posing the question of whether existing western
economies can survive the current low yields across all maturity terms. So far it has been
everyone chasing one another down to lower yields. At some point the central banks must try
to correct the existing positions, i.e. Germany and Japan no longer have any material
difference between yields of any terms, with most of these also negative. It is difficult to
fathom how traditional economics can actually function (borrow at lower short-
term rates, lend/invest in higher long-term rates) unless we see a massive
correction upwards in credit spreads to compensate the fact that these

4
economies do not have any risk free rate of return. In the current state it is difficult to
see much scope for the global long-term interest rates of the big central banks doing anything
resembling upward movement unless they regulate it with controls.
Even if central banks can carefully manipulate and reconstruct their long-term
interest rates to address this structural imbalance it will have to be by small
regular incremental increases to short-term interest rates with an emphasis on
ratcheting long-term interest rates higher. How will the pension funds and insurance
companies survive the massive valuation erosion on their bond portfolios - what is the impact
on a 10 year Treasury bond purchased today at 1.75% yield when the yield goes to 2.75%?
If the above re-alignment of higher bond yields / lower bond prices does not occur are we
going to see a massive shift in pension fund/ insurance company asset allocation policies away
from bonds? Are we going to see some of these entities fail as they effectively lock in negative
cashflows in terms of managing their long term liabilities (expected payouts to retirees etc.)?
Until the investment monies at very cheap cost dry up (as all the money has been invested) the
situation is unlikely to change. No-one knows when that will happen. Borrowers have
never had it so cheap and thus corporate bond issuance and residential mortgage
borrowing has increased. However, to date the volume of debt issued has not matched the
amount of liquidity sloshing around the world looking for a home. US Corporate Bond
issuance has averaged USD1.5 trillion per annum for each of the last four years and is being
easily absorbed by the market.
An aspect of the very low level of inflation and interest rates in Japan and
Germany is due to consumer deleveraging in the aftermath of the GFC. Rather than
spend money, people didn’t have, Finance Ministers and Governments told people to
save…which they may have done perhaps too successfully. The burden of (longer) retirements
under changing demographics is also occurring where government finances may be struggling
to fund these, and there are limited returns on (low risk) fixed income investments meaning
people may be staying in work for longer.
Are we in a new Paradigm, and if so, what does it looklike?
The following section directly addresses the question of whether there has been a shift to a new
paradigm for interest rates, and if so what does it look like? We also summarise and address what the
likely future drivers of interest rates (US 10 year government bond yields and New Zealand 10 year
swap rates) will be.
The following table shows the average New Zealand 90 day bank bill rate, US 10 year government bond
yield and New Zealand 10 year swap rate over the two distinct periods (pre and post GFC), as well as
the current market rates.
New Zealand 90 day
bank bill rate
US 10 Year
Government Bond
Yield
NZ 10 Year Swap
Rate
1999 – 2008 6.25% 4.70% 6.20%
2009 – 2016 2.95% 2.50% 4.40%
Current (May 2016) 2.40% 1.85% 2.95%

5
The background presented in our more in depth analysis (summarised above) indicates clear evidence
of a paradigm shift in interest rates either side of the GFC. The question is whether the shift is moving
further away? Domestically the shift is reflected in the RBNZ estimate of the neutral 90 day bank bill
rate of 4.50%, whereas prior to the GFC it was 6.50%. However, there remain questions over the shape
and form of the new paradigm in relation to what level for US 10 year government bond yields this
implies, and also whether the neutral short term interest rate in New Zealand is actually lower again.
Furthermore, what do some of the New Zealand specific drivers of bond spreads relative to the US (i.e.
risk premium) and also New Zealand swap rates relative to New Zealand Government bond yields (the
‘swap spread’) indicate for New Zealand 10 year swap rates?
We highlight some of the alternatives below as to the shape and form of the new paradigm along with
key drivers, probability weightings and our preferred outlook. Note that some of the components in
practice would be overlapping. Note also for ease of presentation we have given a point estimate for
each interest rate level rather than a narrow range.:-
US 10 Year
Govt Bond
Yield
Justification Probability
Weighting
1.50%
= NZ 10
year swap
rate 2.50%
Quantitative Easing Programmes in Europe and Japan remain inplace indefinitely (and are not successful). Therefore, furtherpressure lower on long-term bond yields in those sovereigns, withglobal convergence (lower) of bond yields continuing, dragging US,New Zealand and Australian long-term rates further lower.
Ongoing negative monetary policy rates in those countries also andin the likes of Sweden, Switzerland…
Strong business competition / strong supply means underlyingservices and good price inflation very low (or falling)
Perennially low inflation driven by technological advancements,job obsolescence, underemployment…
Ageing, income inequality, geopolitical unrest, risingprotectionism, the environment – rising and ongoing fear factorwithin society and consumers means spending very contained
These above factors imply monetary policy irrelevance when itcomes to impacting inflation and growth – interest rates are acentral bank manipulation but are all but ineffective at moving thereal economy
Regulatory environment with higher capital requirements forbanks, reduced dealer balance sheet capacity and bank credit riskreduction amidst central clearing houses lowers credit risk / swapspreads.
Implication for New Zealand Interest Rates: US 10 yeargovernment bond yield of 1.50% + 75 basis point governmentbond spread / risk premium for New Zealand + 25 basispoint swap spread = 2.50% New Zealand 10 year swap rate.Also 2.50% New Zealand 90 day rate = ‘flat’ differencebetween short-term interest rates and long-term interestrates.
15%
6
2.00%
= NZ 10
year swap
rate 3.50%
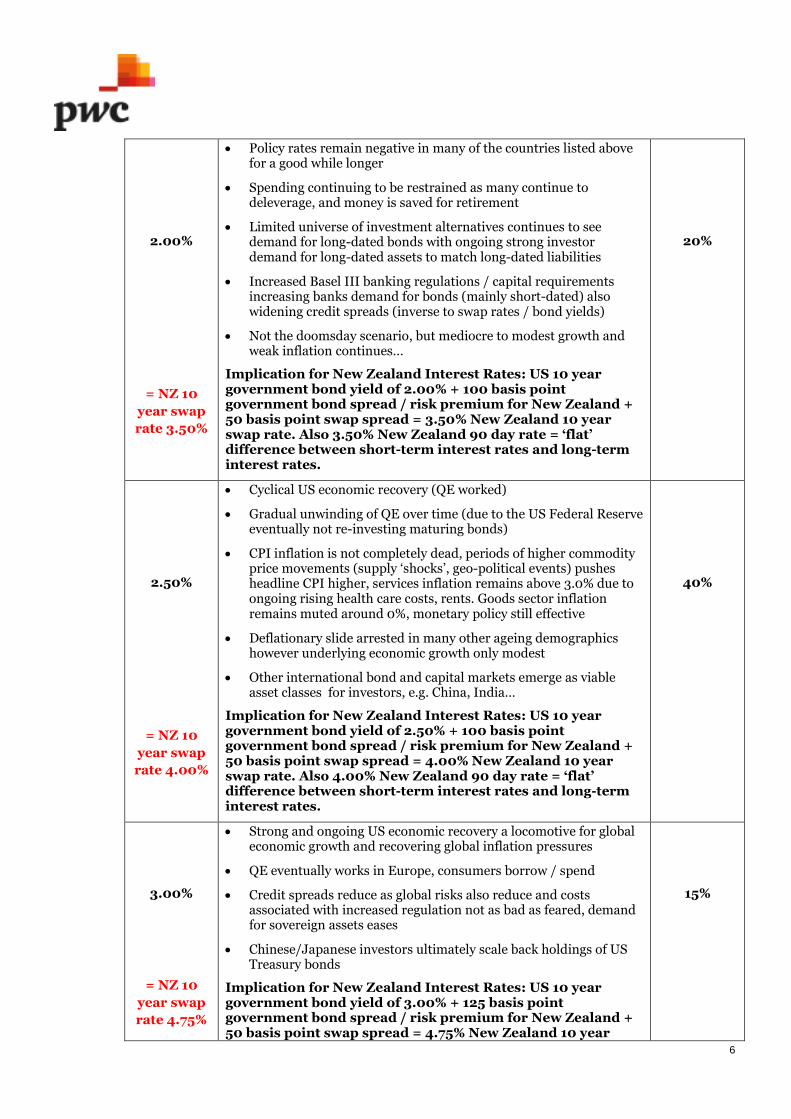
Policy rates remain negative in many of the countries listed abovefor a good while longer
Spending continuing to be restrained as many continue todeleverage, and money is saved for retirement
Limited universe of investment alternatives continues to seedemand for long-dated bonds with ongoing strong investordemand for long-dated assets to match long-dated liabilities
Increased Basel III banking regulations / capital requirementsincreasing banks demand for bonds (mainly short-dated) alsowidening credit spreads (inverse to swap rates / bond yields)
Not the doomsday scenario, but mediocre to modest growth andweak inflation continues…
Implication for New Zealand Interest Rates: US 10 yeargovernment bond yield of 2.00% + 100 basis pointgovernment bond spread / risk premium for New Zealand +50 basis point swap spread = 3.50% New Zealand 10 yearswap rate. Also 3.50% New Zealand 90 day rate = ‘flat’difference between short-term interest rates and long-terminterest rates.
20%
2.50%
= NZ 10
year swap
rate 4.00%
Cyclical US economic recovery (QE worked)
Gradual unwinding of QE over time (due to the US Federal Reserveeventually not re-investing maturing bonds)
CPI inflation is not completely dead, periods of higher commodityprice movements (supply ‘shocks’, geo-political events) pushesheadline CPI higher, services inflation remains above 3.0% due toongoing rising health care costs, rents. Goods sector inflationremains muted around 0%, monetary policy still effective
Deflationary slide arrested in many other ageing demographicshowever underlying economic growth only modest
Other international bond and capital markets emerge as viableasset classes for investors, e.g. China, India…
Implication for New Zealand Interest Rates: US 10 yeargovernment bond yield of 2.50% + 100 basis pointgovernment bond spread / risk premium for New Zealand +50 basis point swap spread = 4.00% New Zealand 10 yearswap rate. Also 4.00% New Zealand 90 day rate = ‘flat’difference between short-term interest rates and long-terminterest rates.
40%
3.00%
= NZ 10
year swap
rate 4.75%
Strong and ongoing US economic recovery a locomotive for globaleconomic growth and recovering global inflation pressures
QE eventually works in Europe, consumers borrow / spend
Credit spreads reduce as global risks also reduce and costsassociated with increased regulation not as bad as feared, demandfor sovereign assets eases
Chinese/Japanese investors ultimately scale back holdings of USTreasury bonds
Implication for New Zealand Interest Rates: US 10 yeargovernment bond yield of 3.00% + 125 basis pointgovernment bond spread / risk premium for New Zealand +50 basis point swap spread = 4.75% New Zealand 10 year
15%
7
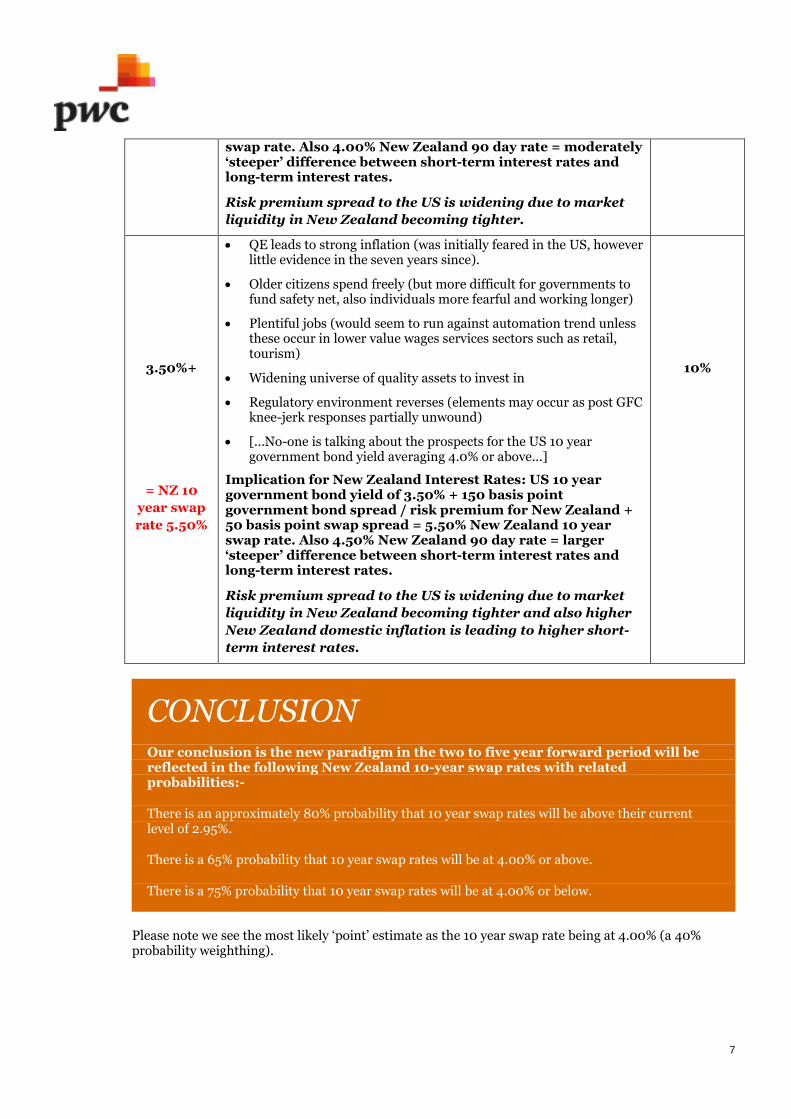
swap rate. Also 4.00% New Zealand 90 day rate = moderately‘steeper’ difference between short-term interest rates andlong-term interest rates.
Risk premium spread to the US is widening due to market
liquidity in New Zealand becoming tighter.
3.50%+
= NZ 10
year swap
rate 5.50%
QE leads to strong inflation (was initially feared in the US, howeverlittle evidence in the seven years since).
Older citizens spend freely (but more difficult for governments tofund safety net, also individuals more fearful and working longer)
Plentiful jobs (would seem to run against automation trend unlessthese occur in lower value wages services sectors such as retail,tourism)
Widening universe of quality assets to invest in
Regulatory environment reverses (elements may occur as post GFCknee-jerk responses partially unwound)
[...No-one is talking about the prospects for the US 10 yeargovernment bond yield averaging 4.0% or above...]
Implication for New Zealand Interest Rates: US 10 yeargovernment bond yield of 3.50% + 150 basis pointgovernment bond spread / risk premium for New Zealand +50 basis point swap spread = 5.50% New Zealand 10 yearswap rate. Also 4.50% New Zealand 90 day rate = larger‘steeper’ difference between short-term interest rates andlong-term interest rates.
Risk premium spread to the US is widening due to market
liquidity in New Zealand becoming tighter and also higher
New Zealand domestic inflation is leading to higher short-
term interest rates.
10%
CONCLUSIONOur conclusion is the new paradigm in the two to five year forward period will bereflected in the following New Zealand 10-year swap rates with relatedprobabilities:-
There is an approximately 80% probability that 10 year swap rates will be above their currentlevel of 2.95%.
There is a 65% probability that 10 year swap rates will be at 4.00% or above.
There is a 75% probability that 10 year swap rates will be at 4.00% or below.
Please note we see the most likely ‘point’ estimate as the 10 year swap rate being at 4.00% (a 40%probability weighthing).
8
ContentsIntroduction 9
1. NZ short-term interest rates and their traditional drivers 12
2. The risk premium of NZ long-term rates to US long-term rates 20
3. Historical New Zealand swap spreads 23
4. Traditional US long-term interest rate drivers 26
5. Additional US drivers of US 10-year government bond yields 39
6. Global economic growth, asset bubbles and risk implications for US long-term rates 43
7. Global government bond yields and drivers 51
8. Emerging non-traditional drivers of US long-term interest rates 58
9. Regulation, credit spreads and their implications for base rates 60
Summary of conclusions 68

9
Introduction
In this paper we consider the factors that have driven the New Zealand and global long-term interest
rates, pre and post 2008 Global Financial Crisis (“GFC”), and assess why current short-term and long-
term interest rate settings are now where they are at record lows. We consider the factors that are
expected to continue to drive long-term interest rates, and what new factors may be emerging as
drivers of long-term interest rates.
The paper considers aspects such as:
Historical drivers of New Zealand short-term interest rates and inflation and what the ‘neutral’
short-term interest rate is
The risk premium of New Zealand long-term interest rates relative to those in the US, and
whether this has changed over recent years
Historical spreads between New Zealand long-term swap rates and New Zealand long-term
government bond yields
Traditional US drivers of US long-term interest rates and whether these still hold as accurate
lead indicators
What are the other US and global influences that have emerged as drivers of US long-term
interest rates
What is the impact of other global long-term interest rates on those in the US and NZ
What is the outlook for the regulatory environment and credit spreads and what are their
implications for ‘base’ rates
What are some non-traditional factors and trends that may be emerging as drivers of long-
term interest rates
Are we in a new interest rate paradigm and if so what is it?

10
Background and context
Inflation, and hence interest rates, have been on a downward trend since the 1980s owing to a
combination of factors including:-
The focus of Central Banks around the world to target inflation within their monetary policy
mandates
The impact of globalisation with easy transferability of goods and services across borders
effectively creating additional supply and competition driving down prices
The impact of technology; more efficient, cheaper, quicker ways of doing things at a lower
unit cost equals lower inflation (in some cases deflation)
The integration of low cost Chinese manufacturing into the global economy thereby
‘exporting’ low inflation / deflation to other countries
The factors above have helped to instil greater competition on a global basis and have been in motion
since well before the Global Financial Crisis (“GFC”), driving inflation and interest rate trends lows.
Since the GFC inflation rates have fallen further, also impacted by:-
Overcapacity as demand has not matched supply and resources remain unutilised, therefore
low goods costs and prices
High indebtedness (a contributing cause to the GFC) that is constraining future borrowing
activity hence economic activity, and also containing price increases (despite low interest
rates)
Excess savings being created amidst deleveraging and the shoring up of personal balance
sheets, but with constrained consumer spending leading insufficient demand and price
pressures
More recently, lower oil and commodity prices have also been a factor in driving headline
inflation rates lower (but core inflation rates that excludes these are also low)
Possible implications of the current situation of low inflation and low interest rates include the
following:-
The creation of better conditions for servicing/repayment of debt by highly indebted
individuals, businesses, corporates and governments
However, a poor environment for savers particularly in the context of ageing population
demographics and the need to fund retirement
Further, pension funds and life insurance providers have long-term liabilities/commitments to
be met, and need to match these with long-term assets achieving an appropriate return. How
do they do this? This necessity also potentially means there is a limit to how negative interest
rates could go as a return must be earned to meet future commitments
But what happens if the Central Banks are unable to meet their inflation targets/mandates
indefinitely?
In that instance another form of monetary policy would be required, these may already be
being considered although this should not yet be seen as a fait accompli
The inflation fighting targeting mainly through short-term policy interest rates has been very
successful over the last 30 or so years in driving inflation rates down substantially
Previous eras have also brought different policy frameworks, e.g. the Bretton Woods fixed
foreign exchange rates regime that was in place until 1971 but was curtailed at that time amidst
rising inflation in some countries and growing imbalances

11
Even now countries like Singapore use Foreign Exchange Rates to set monetary policy, the US
has a dual mandate to manage inflation and also full employment, and until 1999 New Zealand
set monetary policy based on a combination of interest rates and the exchange rate (the
Monetary Conditions Index)
It still appears too soon to discard inflation targeting achieved through short-term interest rates,
however if the objective are not satisfied over the next say 5 to 7 years then alternative frameworks
would be developed and implemented by Central Banks.

12
1. NZ short-term interest rates andtheir traditional drivers
Since March 1999 the Reserve Bank of New Zealand (“RBNZ”) has set the level of short-term interest
rates using the Official Cash Rate (the “OCR”) to manage consumer price inflation over the medium
term (current ‘target’ 2.00%). Historically there have been a range of economic indicators that have
acted as important and accurate ‘leads’ for future inflation pressures and by implication domestic
monetary policy / interest rate settings.
Neutral nominal short-term interest rate of 6.50% pre Global Financial Crisis
Between 1999 and 2008, i.e. before the onset of the Global Financial Crisis (“GFC”), the 90 day bank
bill rate (closely aligned to the OCR) averaged 6.25%. This average rate broadly aligned with a ‘neutral’
OCR setting in the range of 6.00% to 6.50%1. A neutral short-term interest rate level is consistent with
the economy running neither too hot nor too cold in terms of economic activity and related consumer
price inflation pressures.
1 Reserve Bank of New Zealand “Neutral interest rates in the post-crisis period” published November 2013 indicates a widerange for the neutral ‘real’ short-term interest rate of 3.00% to 6.00% for the period from the early 2000s until just prior tothe GFC. Taking this midpoint being 4.50% and the midpoint of the 1.00% to 3.00% CPI inflation target range over themedium-term (i.e. 2.00%) gives a point estimate for the (nominal) neutral rate of 6.50% prior to the GFC.
0.00%
5.00%
10.00%
15.00%
20.00%
25.00%
30.00%
35.00%
40.00%
45.00%
50.00%
2.2
0%
2.4
0%
2.6
0%
2.8
0%
3.0
0%
3.2
0%
3.4
0%
3.6
0%
3.8
0%
4.0
0%
4.2
0%
4.4
0%
4.6
0%
4.8
0%
5.0
0%
5.2
0%
5.4
0%
5.6
0%
5.8
0%
6.0
0%
6.2
0%
6.4
0%
6.6
0%
6.8
0%
7.0
0%
7.2
0%
7.4
0%
7.6
0%
7.8
0%
8.0
0%
8.2
0%
8.4
0%
8.6
0%
8.8
0%
9.0
0%
9.2
0%
9.4
0%
Fre
qu
ency
(%)
NZ 90 Day Bank Bills Frequency Distribution 1999-2008
Average: 6.24%High: 9.13%Low: 4.28%

13
Neutral nominal short-term interest rate of 4.50% post Global Financial Crisis
From 2009 the 90 day bank bill rate has averaged just under 3.00%, and has reflected a very “left-
hand side skew” frequency distribution observed relative to the prior (pre-GFC) period. Note the
RBNZ deems the ‘neutral’ 90 day bank bill rate to now be in the order of 4.50% (+/-0.50%)2 and not
necessarily as low as 3.00% (or the current actual lower level of 2.40%).
2 In a speech by RBNZ Deputy Governor McDermott on 02 October 2013 “Shifting gear: why have neutral interest rates fallen?”In September 2015 an RBNZ Analytical Note “Estimating New Zealand’s neutral interest rate” by Richardson and Williamsnoted ‘…these estimates suggest the nominal neutral 90-day interest rate sits between 3.8 and 4.9 percent currently. Themean of these indicators is 4.3 percent. The Bank currently judges that the nominal neutral 90-day interest rate sits at 4.5percent - within the range of estimates and close to the mean of these estimates”.
0.00%
5.00%
10.00%
15.00%
20.00%
25.00%
30.00%
35.00%
40.00%
45.00%
50.00%
2.2
0%
2.4
0%
2.6
0%
2.8
0%
3.0
0%
3.2
0%
3.4
0%
3.6
0%
3.8
0%
4.0
0%
4.2
0%
4.4
0%
4.6
0%
4.8
0%
5.0
0%
5.2
0%
5.4
0%
5.6
0%
5.8
0%
6.0
0%
6.2
0%
6.4
0%
6.6
0%
6.8
0%
7.0
0%
7.2
0%
7.4
0%
7.6
0%
7.8
0%
8.0
0%
8.2
0%
8.4
0%
8.6
0%
8.8
0%
9.0
0%
9.2
0%
9.4
0%
Fre
qu
ency
(%)
NZ 90 Day Bank Bills Frequency Distribution 2009-2016
Average: 2.93%High: 3.73%Low: 2.31%

14
CPI a less useful indicator of domestic interest rates post GFC
In the ‘pre-GFC’ period there was a reasonable correlation between the Consumer Price Index (“CPI”)
and 90 day bank bill rates. Since the GFC the relationship has been weak, and also CPI inflation has
been low and falling from 2012 onwards (right hand axis on chart).
Note: 2008 spike oil/petrol price related and 2011 spike due to an increase in the rate of GST
0.00%
0.50%
1.00%
1.50%
2.00%
2.50%
3.00%
3.50%
4.00%
4.50%
5.00%
5.50%
6.00%
0.00%
1.00%
2.00%
3.00%
4.00%
5.00%
6.00%
7.00%
8.00%
9.00%
10.00%
CP
IY
oY
NZ
90
Da
yB
ank
Bill
Qu
art
erl
yave
rage
NZ 90 Day Bank Bill and CPI
NZ 90 Day Bank Bill CPI
Correl: 49%Pre GFC: 46%Post GFC: -15%
15
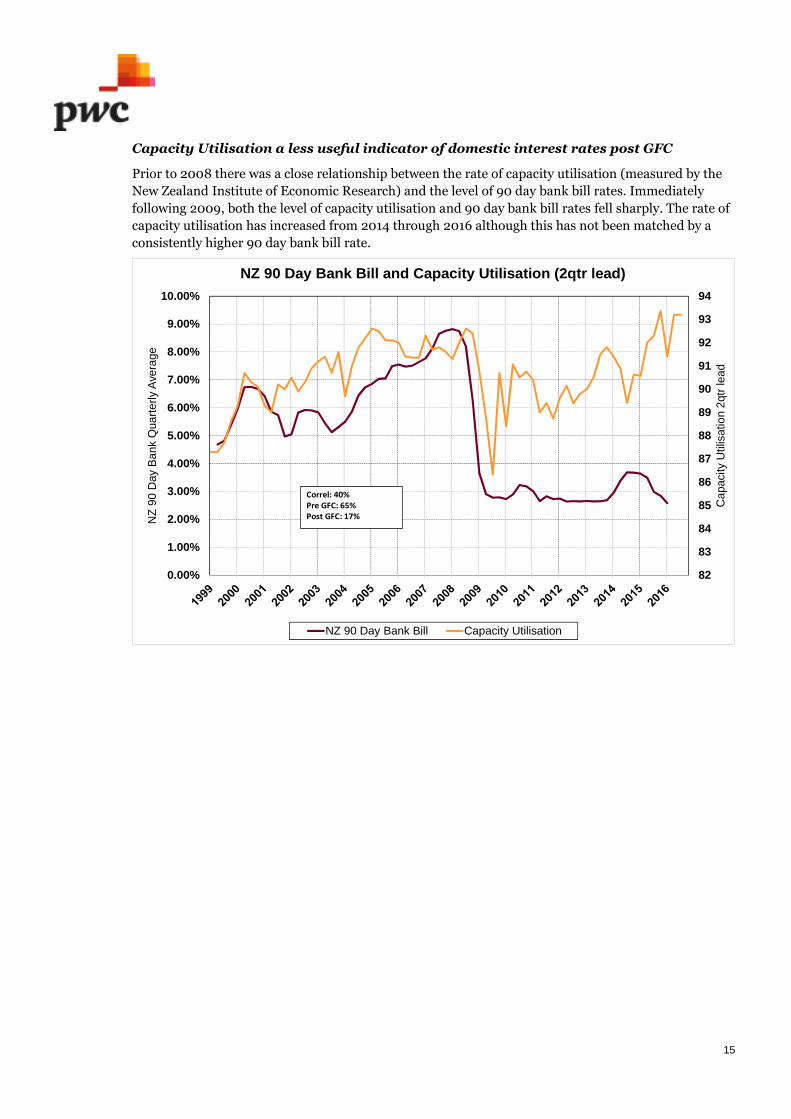
Capacity Utilisation a less useful indicator of domestic interest rates post GFC
Prior to 2008 there was a close relationship between the rate of capacity utilisation (measured by the
New Zealand Institute of Economic Research) and the level of 90 day bank bill rates. Immediately
following 2009, both the level of capacity utilisation and 90 day bank bill rates fell sharply. The rate of
capacity utilisation has increased from 2014 through 2016 although this has not been matched by a
consistently higher 90 day bank bill rate.
82
83
84
85
86
87
88
89
90
91
92
93
94
0.00%
1.00%
2.00%
3.00%
4.00%
5.00%
6.00%
7.00%
8.00%
9.00%
10.00%
Ca
paci
tyU
tilis
atio
n2
qtr
lea
d
NZ
90
Day
Ba
nk
Qua
rte
rly
Ave
rage
NZ 90 Day Bank Bill and Capacity Utilisation (2qtr lead)
NZ 90 Day Bank Bill Capacity Utilisation
Correl: 40%Pre GFC: 65%Post GFC: 17%

16
Relationship between output gap and domestic interest rates remains; supply is
meeting demand
The output gap (calculated by the RBNZ) measures the degree to which real Gross Domestic Product
(“GDP”) growth within the economy is performing either above or below the ‘potential’ growth rate.
Potential growth reflects the extent and speed the economy can grow without creating excess inflation
pressures. Consideration of the output gap (actual growth less potential growth) shows the
relationship between the 90 day bank bill rate and the output gap has been reasonably consistent both
pre and post GFC.
The calculated output gap since the GFC has not been ‘positive’ therefore the New
Zealand economy has not created excess inflation pressures. In the years immediately
following the GFC the ‘negative’ output gap was likely caused by weak demand. In the last few years
stronger growth in supply (including labour supply) has likely also assisted in boosting the potential
growth rate of the economy despite reasonably strong actual economic growth [the output gap
essentially balances the two]. It can be observed the 90 day bank bill rates setting has been
broadly appropriate for the level of the output gap post GFC.
-3.75%
-3.00%
-2.25%
-1.50%
-0.75%
0.00%
0.75%
1.50%
2.25%
3.00%
3.75%
0.00%
1.00%
2.00%
3.00%
4.00%
5.00%
6.00%
7.00%
8.00%
9.00%
10.00%
Outp
utG
ap
NZ
90
Da
yB
ank
Qua
rte
rly
Ave
rag
e
NZ 90 Day Bank Bill and Output Gap
NZ 90 Day Bank Bill Output Gap
Correl: 77%Pre GFC: 64%Post GFC: 39%

17
Lower transport CPI (petrol prices) offsetting higher housing and utilities inflation
The current New Zealand CPI inflation breakdown for the year to March 2016 is as follows:-
New Zealand inflation expectations (for two years forward) are currently very low,
dragged down by the low current actual headline inflation rate
-0.80% -0.60% -0.40% -0.20% 0.00% 0.20% 0.40% 0.60% 0.80%
Food
Alcoholic beverages and tobacco
Clothing and footwear
Housing and household utilities
Household contents and services
Health
Transport
Communication
Recreation and culture
Education
Miscellaneous goods and services
Percentage points contribution
Q1 2016 Percentage points contribution to Annual CPI (of +0.4%yoy)
-1.00
0.00
1.00
2.00
3.00
4.00
5.00
6.00
Mar 1992 Mar 1996 Mar 2000 Mar 2004 Mar 2008 Mar 2012 Mar 2016
Infla
tion
Rate
(y/y
%)
RBNZ Survey of Expectations - annual CPI 2 years out vs actual
Expectations Survey Of Annual CPI 2 Years Out Actual Annual CPI
Correlation: 81%

18
Falling petrol prices have also helped drag New Zealand inflation expectations lower…
…as global oil prices have also fallen sharply (although are now moving higher).
05/04 05/05 05/06 05/07 05/08 05/09 05/10 05/11 05/12 05/13 05/14 05/15 05/16
100.0
120.0
140.0
160.0
180.0
200.0
220.0
240.0
1.00
1.50
2.00
2.50
3.00
3.50
4.00
Mar 2004 Mar 2006 Mar 2008 Mar 2010 Mar 2012 Mar 2014 Mar 2016
NZ
Petr
olP
rice
s(c
ents
/litr
e)
Infla
tion
Rate
(y/y
%)
RBNZ Survey of Expectations - annual CPI 2 years out vs Petrolprices
Expectations Survey Of Annual CPI 2 Years Out Petrol Price
05/04 05/05 05/06 05/07 05/08 05/09 05/10 05/11 05/12 05/13 05/14 05/15 05/16
20
40
60
80
100
120
140
160
1.00
1.50
2.00
2.50
3.00
3.50
4.00
Mar 2004 Mar 2006 Mar 2008 Mar 2010 Mar 2012 Mar 2014 Mar 2016
WT
IC
rud
eO
il(U
S$
/bbl)
Infla
tion
Rate
(y/y
%)
RBNZ Survey of Expectations - annual CPI 2 years out vs WTICrude Oil
Expectations Survey Of Annual CPI 2 Years Out WTI Crude Oil

19
SUMMARY – New Zealand Short-TermInterest RatesThe following summarises the main points of the New Zealand short-term interestrates analysis:-
The RBNZ estimates the neutral level of the New Zealand 90 day bank bill rate as being 4.50%,lower than the 6.50% estimated for prior to the Global Financial Crisis.
Historical measures such as CPI and the rate of Capacity Utilisation have been less useful guidesfor the level of 90 day bank bill rates since the GFC, however 90 day bank bill rates have broadlybeen at levels consistent with the output gap balancing economy-wide supply with demand.
Inflation expectations have moved lower consistent with lower current headline inflation, drivenat least in part by lower petrol / oil prices, albeit these appear to now be reversing higher.
CONCLUSION: Currently New Zealand short-term interest rates are below the leveldeemed by the RBNZ to be ‘neutral’. Furthermore, the neutral level has alreadybeen markedly lower for the post GFC period relative to the pre GFC period. Amovement back up to (or above) the neutral level will require either strongerdemand than supply (i.e. emergence of a ‘positive’ output gap) and/or strongeroil/domestic petrol prices pushing up headline inflation rates and inflationexpectations. There is also the potential the RBNZ need to revise their judgment ofthe neutral short-term interest rate lower from the current 4.50% estimate.

20
2. The risk premium of NZ long-termrates to US long-term rates
New Zealand risk premium
Whilst domestic New Zealand monetary policy drives the movements in the Official Cash Rate and
interest rates out to two or three years, New Zealand interest rates beyond approximately three years
(i.e. to 10 years and potentially longer) are primarily driven by US (and global) long–term interest rate
markets. There is a long close correlation between US and New Zealand government bond yields
because of the high level of foreign ownership of our government bonds (66.5%) and very integrated
global financial/capital markets (i.e. the impact and activity of international investors). However, there
is also a risk premium between New Zealand and US long-term government bond yields. The risk
premium reflects the reliance on foreign investment to fund our current account deficit (that is
structural in nature). Furthermore, New Zealand will always have a positive risk premium owing to our
relatively small and narrowly focussed economy that does still retain an agricultural focus, i.e.
economy-wide risks are apparent. These factors and the relatively small size of our government bond
market results in the risk premium that can also be seen as assisting liquidity.
New Zealand long-term risk premium has reduced from 1.60% (pre GFC) to
approximately 1.00% (currently)
The chart shows how this risk premium – the ‘spread or differential’ between New Zealand and US 10
year government bond yields - has varied over the last 20 years averaging 1.60% and ranging between
0.50% and 2.90%. There is a reasonable (63%) correlation between the 10 year government bond
‘spread or differential’ and the differential between 90 day interest rates (New Zealand 90 day bank
bills less US 3 month LIBOR).
-0.50
0.00
0.50
1.00
1.50
2.00
2.50
3.00
3.50
-2.00
-1.00
0.00
1.00
2.00
3.00
4.00
5.00
6.00
7.00
1995
1996
1997
1998
1998
1999
2000
2001
2001
2002
2003
2004
2004
2005
2006
2007
2007
2008
2009
2010
2010
2011
2012
2013
2013
2014
2015
2016
90
-Da
yS
pre
ad
(%)
10
-Ye
ar
Bon
dS
pre
ad
(%)
NZ 10-yr Bond and US 10-yr Bond Spread vs NZ 90d Bank Bill andUS 3m Libor Spread (monthly averages)
90 Day Spread Bond Spread
Correlation: 63%
21
This 90 day differential has ranged between +6.10% and -1.10% over the last 20 years, and averaged
2.70%. Interestingly the differential between the NZ/US 10 year government bond yield has actually
had a higher average post GFC (1.90%) than pre GFC (1.45%). The New Zealand / US 90 day interest
rate differential has had a similar average post GFC (2.55%) as pre GFC (2.75%).
The 90 day interest rate differential is currently 1.70% coinciding with a 10-year government bond
differential of 1.05%.
New Zealand long-term risk premium unlikely to narrow further
New Zealand has had long-term interest rates effectively propped up by an average risk premium of
160 basis points over US long-term interest rates over the past 20 years (comparing US 10 year
Treasury bond yields to New Zealand 10 year Government bond yields). It can be argued that New
Zealand will always need to have a positive differential / risk premium for as long as we rely on
overseas capital and have the economic risks associated with a small, open economy. However 160
basis points now appears to be too high in light of the absolute lower level of (short-term) interest
rates, and the propensity to take on additional risk to earn a relatively better return at absolute low
interest rate levels.
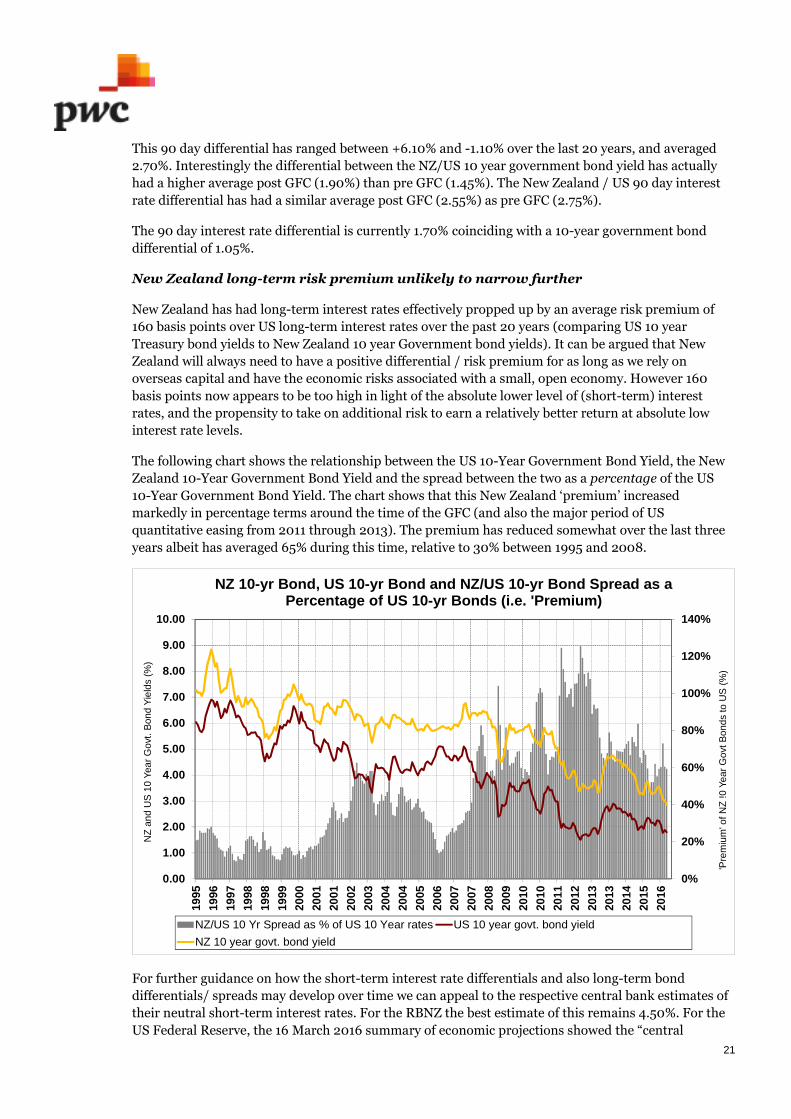
The following chart shows the relationship between the US 10-Year Government Bond Yield, the New
Zealand 10-Year Government Bond Yield and the spread between the two as a percentage of the US
10-Year Government Bond Yield. The chart shows that this New Zealand ‘premium’ increased
markedly in percentage terms around the time of the GFC (and also the major period of US
quantitative easing from 2011 through 2013). The premium has reduced somewhat over the last three
years albeit has averaged 65% during this time, relative to 30% between 1995 and 2008.
For further guidance on how the short-term interest rate differentials and also long-term bond
differentials/ spreads may develop over time we can appeal to the respective central bank estimates of
their neutral short-term interest rates. For the RBNZ the best estimate of this remains 4.50%. For the
US Federal Reserve, the 16 March 2016 summary of economic projections showed the “central
0%
20%
40%
60%
80%
100%
120%
140%
0.00
1.00
2.00
3.00
4.00
5.00
6.00
7.00
8.00
9.00
10.00
19
95
19
96
19
97
19
98
19
98
19
99
20
00
20
01
20
01
20
02
20
03
20
04
20
04
20
05
20
06
20
07
20
07
20
08
20
09
20
10
20
10
20
11
20
12
20
13
20
13
20
14
20
15
20
16
NZ
an
dU
S1
0Y
ea
rG
ovt
.B
on
dY
ield
s(%
)
'Pre
miu
m'o
fN
Z!0
Ye
ar
Go
vtB
on
ds
toU
S(%
)
NZ 10-yr Bond, US 10-yr Bond and NZ/US 10-yr Bond Spread as aPercentage of US 10-yr Bonds (i.e. 'Premium)
NZ/US 10 Yr Spread as % of US 10 Year rates US 10 year govt. bond yield
NZ 10 year govt. bond yield
22
tendency” within US Federal Reserve (Open Market Committee) members as estimating the ‘long-run’
Federal Funds Rate at 3.00% to 3.50% (i.e. 3.25% ‘midpoint’); this gives a US 3 month LIBOR rate of
approximately 3.50%. It is not crystal clear whether this long-run rate refers to a ‘neutral’ level, or
perhaps more where interest rates would be getting close to being at the top of the interest rate cycle.
As such, it could be argued the ‘neutral’ US 3 month LIBOR rate may be lower than 3.50%
Another factor that needs to be assessed when determining the size of the New Zealand risk premium
is to conceptualise the size of the New Zealand market; in a global context this is essentially just the
size of a city and a somewhat insignificant presence from a global perspective. The very small size of
the New Zealand market does makes it harder to get into and out of and therefore can be an inhibitor
to capital and financial flows. A further factor is the relatively narrow, small-based economy (with an
agricultural focus) does also create an economic risk for New Zealand. The implication is a higher
compensation for risk (i.e. wider risk premium on government bonds).
Following from the rationale above we provide an estimate for the ‘neutral’ short-term
interest rate ‘spread’ between New Zealand and the US in the order of 1.25% and for the
10 year government bond spread of approximately 1.00% using the (still relevant)
historical relationship between short-term and long-term differentials/spreads. The
recognition of the slightly wider risk premium for the small market and the economic
risks of a small narrow based econonmy requires compensation.
In percentage terms, there appears only limited scope for the premium of New Zealand 10-Year
Government Bond Yields relative to those in the US to reduce.
SUMMARY – New Zealand RiskPremiumThe following summarises the main points of the New Zealand Risk Premiumanalysis:-
The RBNZ have estimated the neutral 90 day interest rate as 4.50%. US Federal Reservecommittee members’ estimates of the ‘long-run’ US 3 month LIBOR rate is 3.25%. The 1.25%differential between New Zealand and US 90 day interest rates is consistent with anapproximately 1.00% (100 basis point) risk premium between New Zealand and US 10 yeargovernment bond yields.
The premium/percentage of New Zealand 10-Year Government Bond Yields being above those inthe US has been 60%+ over the last three years. This is below the levels of over 100% during theheight of Quantitative Easing in the US, but above the 30% premium prior to the GFC.
CONCLUSION: New Zealand 10-Year Government Bond Yields are approximately100 basis points above those in the US (60%). There may be scope for short-term(90-day) interest rate differentials to narrow based on the assessment of ‘neutral’policy rates by the New Zealand and US central banks, however there may beconsiderably less propensity for the 10 year government bond yield differential todo so. In percentage terms, there appears only limited scope for the premium ofNew Zealand 10-Year Government Bond Yields relative to those in the US to reduce.

23
3. Historical New Zealand swapspreads
New Zealand 10 year swap spread
The following chart shows the spread between the New Zealand 10 year swap rate and the New
Zealand 10 year government bond yield (the “10 year swap spread”) against the level of the 90 day
bank bill rate. For the 1996 to 2008 period pre GFC, the New Zealand 10 year swap spread averaged 75
basis points and the 90 day bank bill rate averaged 7.00% with a correlation between 1999 and 2008 of
+75%. Since 2009 the 10 year swap spread has averaged 25 basis points and the 90 day bank bill rate
has averaged 3.00%.
-0.80
-0.40
0.00
0.40
0.80
1.20
1.60
0.00
2.00
4.00
6.00
8.00
10.00
12.00
Sw
ap
Sp
read
(%)
NZ
90
Da
yB
ank
Bill
Mon
thly
Ave
rage
(%)
NZ 10yr Swap Spread vs NZ 90-Day Bank Bill (Monthly Averages)
NZ 90-Day Bank Bill Swap Spread

24
Limit to how low the New Zealand 10 year swap spread can go owing to limited size ofthe New Zealand market
The following chart more closely focuses on the period since the GFC and more specifically since 2011.
Since 2011 there has been a 53% correlation between the New Zealand 10 year swap spread and the 90
day bank bill rate. Since 2011 the New Zealand 10 year swap spread has averaged 30 basis points with
the 90 day bank bill rate averaging 3.00%.
The swap spread can also be thought of as reflecting the size of the New Zealand wholesale interest
rate markets. There is a relatively small size for the New Zealand swap market (market estimates tend
to indicate a volume of between $200 million and $500 million 5-year swap equivalent absorbed
under normal circumstances on any given day) hence we would assess the lower end of this range at
$200 million as reflecting ‘normal’ market volume that can be absorbed for 10-year swap equivalent.
The New Zealand swap market can be very susceptible to one-sided fixed-rate “payer” flows, pushing
swap rates up (relative to bond yields) therefore widening the swap spread.
A contrary viewpoint that would place pressure on swap spreads to narrow concerns the regulatory
environment. Swap rates usually trade above the equivalent maturity bond yields as swap transactions
involve credit risk around counterparties, whereas sovereign bonds are typically perceived to be risk-
free. Recently in the US, swap spreads have turned negative with tighter macro prudential regulation,
higher capital requirements for banks and reduced dealer balance sheet capacity all mooted as reasons
for this. Furthermore, bank credit risk is also considered to have reduced on the back of central
clearing houses (rather than bi-lateral exposures) that has lowered swap credit risk. The prospect that
not all government bonds may be included as risk free on banks’ balance sheets (e.g. Greek sovereign
debt) is another reason seen as driving the potential shift in swap spreads (to negative – i.e. swaps
trading below government bond yields) or at least with a narrower spread.
-0.40
0.00
0.40
0.80
1.20
1.60
2.00
2.50
3.00
3.50
4.00
4.50
5.00
Sw
ap
Spre
ad
(%)
NZ
90
Da
yB
ank
Bill
Mon
thly
Ave
rage
(%)
NZ 10yr Swap Spread vs NZ 90-Day Bank Bill (Monthly Averages)
NZ 90-Day Bank Bill Swap Spread

25
SUMMARY – New Zealand SwapSpreadThe following summarises the main points of the New Zealand Swap SpreadPremium analysis:-
The New Zealand 10 year swap spread (10 year swap rate less 10 year government bond yield) canbe seen as relative to the size of the underlying wholesale interest rate market (i.e. small in theinstance of New Zealand) hence subject to one-sided fixed-rate “payer” flows pushing the swaprates higher and swap spread wider.
A contrary viewpoint that would lead to lower/narrower swap spreads involves the regulatoryenvironment with higher capital requirements for banks and reduced dealer balance sheetcapacity mooted as reasons for negative swap spreads in the US (swap rates below bond yields).Bank credit risk is also considered to have reduced on the back of central clearing houses (ratherthan bi-lateral exposures) that has lowered swap credit risk.
CONCLUSION: Whilst the absolute level of 90 day bank bill rates and 10 year swaprates have reduced post GFC, the New Zealand 10-year swap spread (10 year swaprate less 10 year government bond yield) has not reduced by the sameproportionate amount, recognising the relatively small size of the New Zealandswap market. The increased regulatory environment, higher capital requirementand less credit risk associated with central clearing houses are reasons why swapspreads could narrow. A New Zealand 10 year swap spread in the range of 25 and upto 75 basis points appears relevant, even in an environment of the wholesale marketswap yield curve (90 day bank bill to 10 year swap rates) being between 3.00% and5.00%.

26
4. Traditional US long-term interestrate drivers
US economic drivers
A key, but not the only, driver of US long-term interest rates is cyclical economic data with these
creating expectations for movements in the US Federal Funds Rate, anticipated by the bond market.
Employment growth a driver of bond yields pre-GFC, not post GFC
The US Federal Reserve has a ‘dual’ mandate to maximise employment growth and also to manage
inflation at 2.0%. There was a +61% correlation between 1993 and 2008 between US 10 year
government bond yields and US non-farm payrolls employment growth (3 month average). Post the
GFC there has not been an intuitive relationship between US employment growth and US 10-year
government bond yield (-56%).
1.00
2.00
3.00
4.00
5.00
6.00
7.00
8.00
9.00
-800
-600
-400
-200
0
200
400
600
199
3
199
4
199
5
199
6
199
7
199
8
199
9
200
0
200
1
200
2
200
3
200
4
200
5
200
6
200
7
200
8
200
9
201
0
201
1
201
2
201
3
201
4
201
5
201
6
US
10
Year
Tre
asu
ryM
on
thly
Ave
rage
(%)
US
Non
Farm
Payr
olls
3m
onth
lyave
rage
gro
wth
US 10-Year Treasury Bond Yields and US Non-Farm Payrolls
Non-Farm Payrolls US 10-Year Treasury Yields
Correl: 25%Pre GFC: 61%Post GFC: -56%

27
US 10-year government bond yields below a level indicated by US Headline CPI…
There has been a reasonable relationship overall between the US (Headline) Consumer Price Index
and the US 10-year government bond yield over the last 25 years in total, however this relationship has
not held since the GFC with bond yields generally lower than a level implied by headline CPI.
0.00
1.00
2.00
3.00
4.00
5.00
6.00
7.00
8.00
9.00
10.00
-3.00
-2.00
-1.00
0.00
1.00
2.00
3.00
4.00
5.00
6.00
7.00
19
90
19
91
19
92
19
93
19
94
19
95
19
96
19
97
19
98
19
99
20
00
20
01
20
02
20
03
20
04
20
05
20
06
20
07
20
08
20
09
20
10
20
11
20
12
20
13
20
14
20
15
20
16
US
10
Ye
ar
Tre
asu
ryM
onth
lyA
vera
ge
(%)
US
Hea
dlin
eC
PIY
oY
(%)
US 10-Year Treasury Bond Yields and US Headline CPI
US Headline CPI US 10-Year Treasury Yield
Correl: 57%Pre GFC: 53%Post GFC: -5%
28
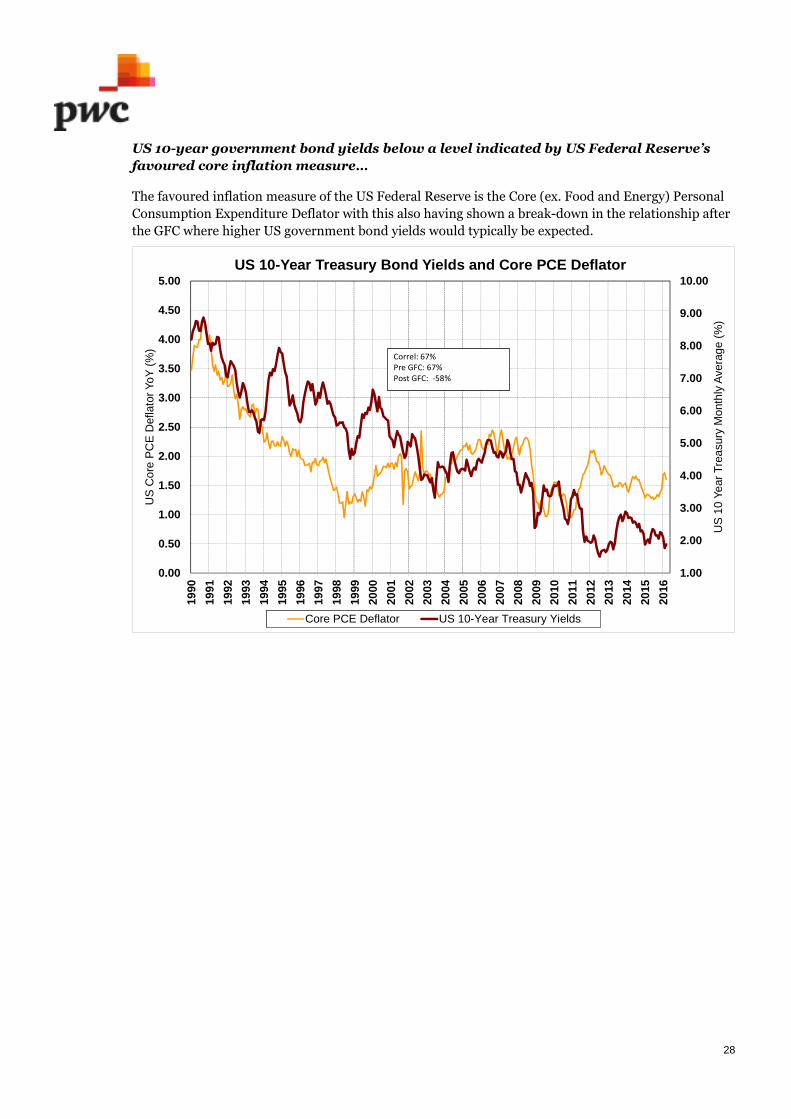
US 10-year government bond yields below a level indicated by US Federal Reserve’s
favoured core inflation measure…
The favoured inflation measure of the US Federal Reserve is the Core (ex. Food and Energy) Personal
Consumption Expenditure Deflator with this also having shown a break-down in the relationship after
the GFC where higher US government bond yields would typically be expected.
1.00
2.00
3.00
4.00
5.00
6.00
7.00
8.00
9.00
10.00
0.00
0.50
1.00
1.50
2.00
2.50
3.00
3.50
4.00
4.50
5.00
19
90
19
91
19
92
19
93
19
94
19
95
19
96
19
97
19
98
19
99
20
00
20
01
20
02
20
03
20
04
20
05
20
06
20
07
20
08
20
09
20
10
20
11
20
12
20
13
20
14
20
15
20
16
US
10
Ye
ar
Tre
asu
ryM
onth
lyA
vera
ge
(%)
US
Co
reP
CE
Defla
tor
Yo
Y(%
)
US 10-Year Treasury Bond Yields and Core PCE Deflator
Core PCE Deflator US 10-Year Treasury Yields
Correl: 67%Pre GFC: 67%Post GFC: -58%
29
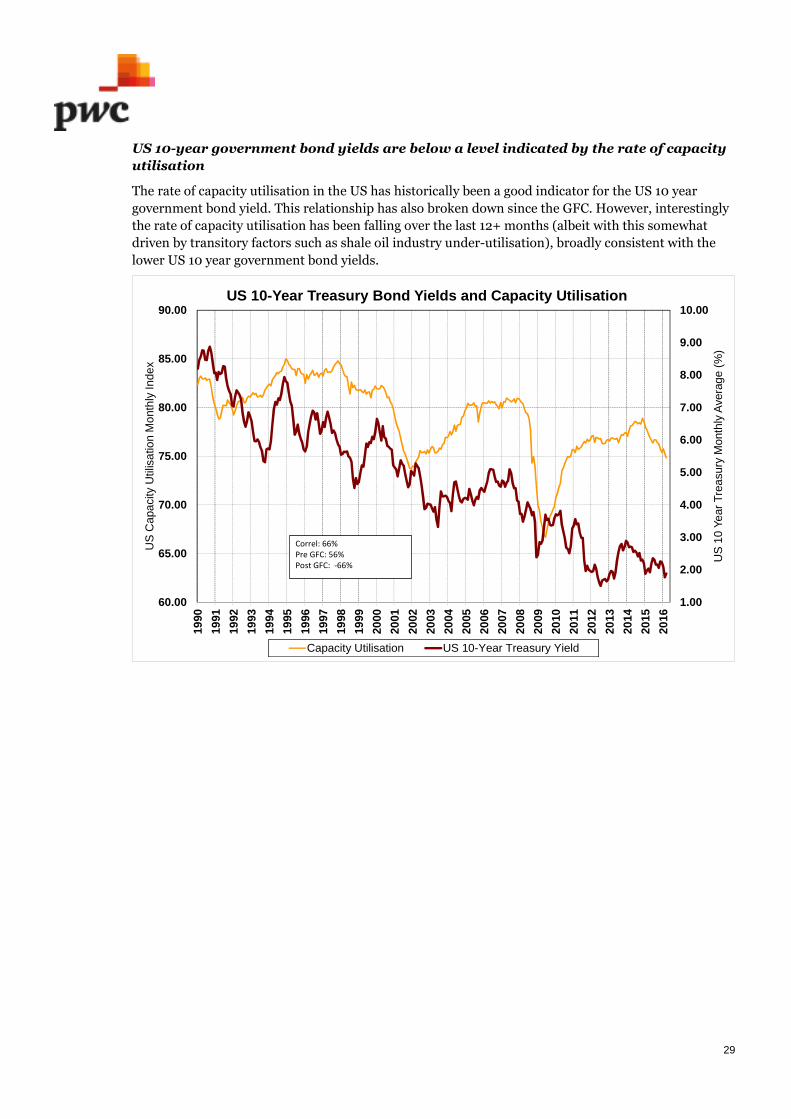
US 10-year government bond yields are below a level indicated by the rate of capacity
utilisation
The rate of capacity utilisation in the US has historically been a good indicator for the US 10 year
government bond yield. This relationship has also broken down since the GFC. However, interestingly
the rate of capacity utilisation has been falling over the last 12+ months (albeit with this somewhat
driven by transitory factors such as shale oil industry under-utilisation), broadly consistent with the
lower US 10 year government bond yields.
1.00
2.00
3.00
4.00
5.00
6.00
7.00
8.00
9.00
10.00
60.00
65.00
70.00
75.00
80.00
85.00
90.00
19
90
19
91
19
92
19
93
19
94
19
95
19
96
19
97
19
98
19
99
20
00
20
01
20
02
20
03
20
04
20
05
20
06
20
07
20
08
20
09
20
10
20
11
20
12
20
13
20
14
20
15
20
16
US
10
Ye
ar
Tre
asu
ryM
onth
lyA
vera
ge
(%)
US
Ca
pa
city
Util
isa
tion
Mo
nth
lyIn
de
x
US 10-Year Treasury Bond Yields and Capacity Utilisation
Capacity Utilisation US 10-Year Treasury Yield
Correl: 66%Pre GFC: 56%Post GFC: -66%

30
The influence of falling oil prices has also been an important factor driving US
headline CPI inflation lower
There has been a good correlation between the annual rate of percentage change of oil prices and
headline US CPI also in annual percentage change terms. The relationship has been similar both pre
and post GFC.
-3.00
-2.00
-1.00
0.00
1.00
2.00
3.00
4.00
5.00
6.00
7.00
8.00
-90%
-75%
-60%
-45%
-30%
-15%
0%
15%
30%
45%
60%
75%
90%
105%
120%
US
Head
line
CP
I(y
oy%
)
West
Texa
sIn
term
edia
teA
nna
ul%
cha
ng
e
US Headline CPI and Annual % change in West Texas IntermediateOil Prices
West Texas Intermediate Annual % change US Headline CPI
Correl: 70%Pre GFC: 64%Post GFC: 73%
31
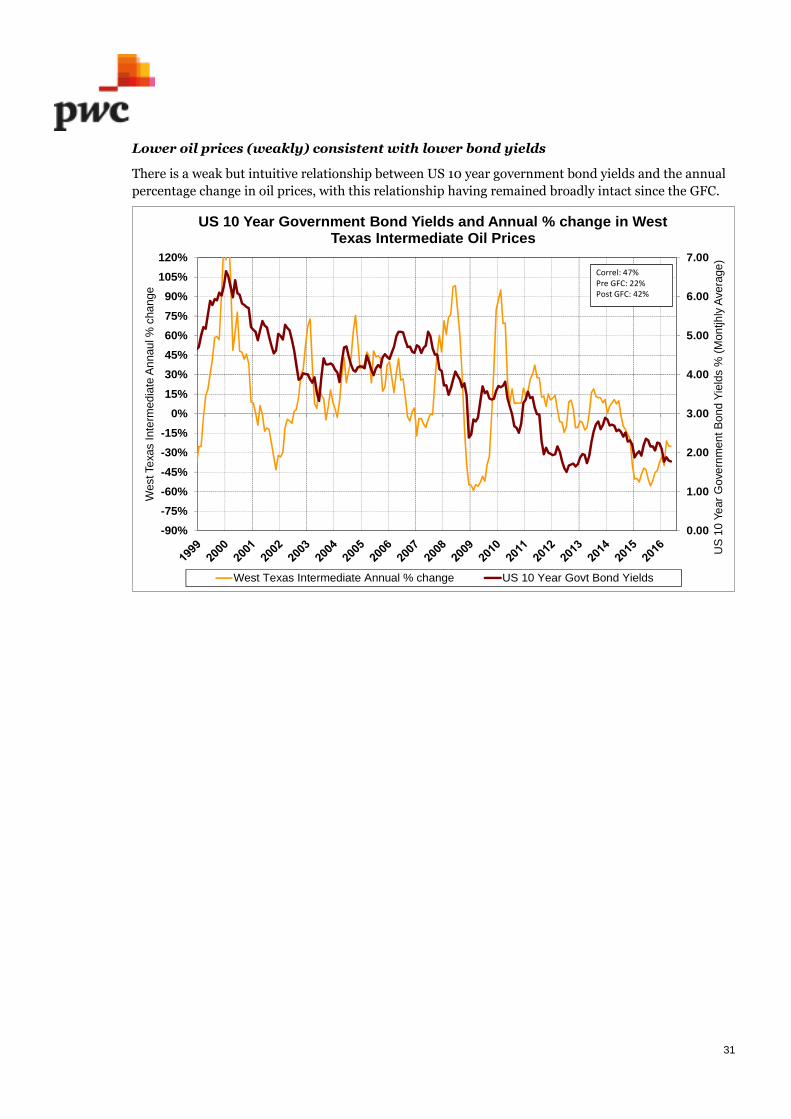
Lower oil prices (weakly) consistent with lower bond yields
There is a weak but intuitive relationship between US 10 year government bond yields and the annual
percentage change in oil prices, with this relationship having remained broadly intact since the GFC.
0.00
1.00
2.00
3.00
4.00
5.00
6.00
7.00
-90%
-75%
-60%
-45%
-30%
-15%
0%
15%
30%
45%
60%
75%
90%
105%
120%
US
10
Ye
ar
Gove
rnm
en
tB
ond
Yie
lds
%(M
on
tjhly
Ave
rage
)
West
Texa
sIn
term
edia
teA
nnau
l%ch
ange
US 10 Year Government Bond Yields and Annual % change in WestTexas Intermediate Oil Prices
West Texas Intermediate Annual % change US 10 Year Govt Bond Yields
Correl: 47%Pre GFC: 22%Post GFC: 42%

32
Lower broader commodity price measures also driving headline CPI lower
The influence of falling commodity prices more broadly (as captured in the Commodity Research
Bureau (“CRB”) Index) has also been an important factor driving US headline CPI inflation lower.
There has been a strong correlation both pre and post GFC between annual percentage changes in the
CRB Index and US Headline CPI also in annual percentage change terms.
-3.00
-2.00
-1.00
0.00
1.00
2.00
3.00
4.00
5.00
6.00
7.00
8.00
-60.00%
-50.00%
-40.00%
-30.00%
-20.00%
-10.00%
0.00%
10.00%
20.00%
30.00%
40.00%
50.00%
199
2
199
3
199
4
199
5
199
6
199
7
199
8
199
9
200
0
200
1
200
2
200
3
200
4
200
5
200
6
200
7
200
8
200
9
201
0
201
1
201
2
201
3
201
4
201
5
201
6
US
Hea
dlin
eC
PI
(yoy%
)
CR
BIn
dex
Ann
ua
l%C
hang
e
US Headline CPI and Annual % change in CRB Index
CRB Index Annual % change US Headline CPI
Correl: 73%Pre GFC: 50%Post GFC 77%

33
Lower commodity prices are (weakly) consistent with lower bond yields.
The correlation has increased notably from pre GFC to post GFC (-23% to 45%). Sentiment in the
commodities market appears to have become an influence behind monetary policy settings.
0.00
1.00
2.00
3.00
4.00
5.00
6.00
7.00
8.00
9.00
-60%
-50%
-40%
-30%
-20%
-10%
0%
10%
20%
30%
40%
50%
199
2
199
3
199
4
199
5
199
6
199
7
199
8
199
9
200
0
200
1
200
2
200
3
200
4
200
5
200
6
200
7
200
8
200
9
201
0
201
1
201
2
201
3
201
4
201
5
201
6
US
10
Yea
rG
ove
rnm
en
tB
ond
Yie
lds
%(M
ontjh
lyA
vera
ge
)
CR
BIn
dex
Ann
aul%
cha
ng
e
US 10 Year Government Bond Yields and Annual % change in CRBIndex
CRB Index Annual % change US 10 Year Govt Bond Yields
Correl: 18%Pre GFC: -23%Post GFC: 45%

34
Market implied measures of US inflation expectations have fallen from 2013 onwards
US market implied inflation expectations are defined as the difference between the US 10 year nominal
bond yield and the equivalent 10 year real (or Treasury Inflation Protection Securities yield) also
known as “TIPS”. Among other factors, the following chart shows the ongoing fall in the ‘real’ yield
through 2011 and 2012 amidst the Quantitative Easing programme of the US Federal Reserve, and also
the ‘taper’ tantrum of higher nominal yields from May to August 2013.
The chart also shows the general slide in market based measures of inflation expectations from 2013
onwards (black line).
-2.00
-1.00
0.00
1.00
2.00
3.00
4.00
5.00
6.00
7.00
8.00
-0.50
0.00
0.50
1.00
1.50
2.00
2.50
3.00
3.50
4.00
US
10
yea
rT
rea
sury
Bo
nd
Yie
lds
-n
om
ina
lan
dre
al(
infla
tion
pro
tect
ed
)
Infla
tion
exp
ect
atio
ns
(im
plie
d)
US 10-Year Treasury Bond Yield and Inflation Expectations
US implied inflation expectations US 10y govt. nominal bond yields
US 10y govt. real bond yields

35
Sharply lower oil prices a key factor in pushing inflation expectations lower, trend in
oil prices has surprised in the extent it has reversed, and driving market implied
inflation expectations higher
The following chart shows the relationship between West Texas Intermediate Oil prices and US
implied inflation expectations and shows the close correlation between the two. The chart shows the
recent pick-up in both West Texas oil prices and market implied inflation expectations.
0.00
20.00
40.00
60.00
80.00
100.00
120.00
140.00
160.00
-0.50
0.00
0.50
1.00
1.50
2.00
2.50
3.00
3.50
4.00
We
stTe
xas
Inte
rmed
iate
US
$/b
bl
US
imp
lied
infla
tion
exp
ect
atio
ns
(%)
US implied inflation expectations and West Texas Intermediate
Implied Inflation Expectations West Texas Intermediate Oil Prices
2 year correl: 34%5 year correl: 95%10 year correl: 86%
36
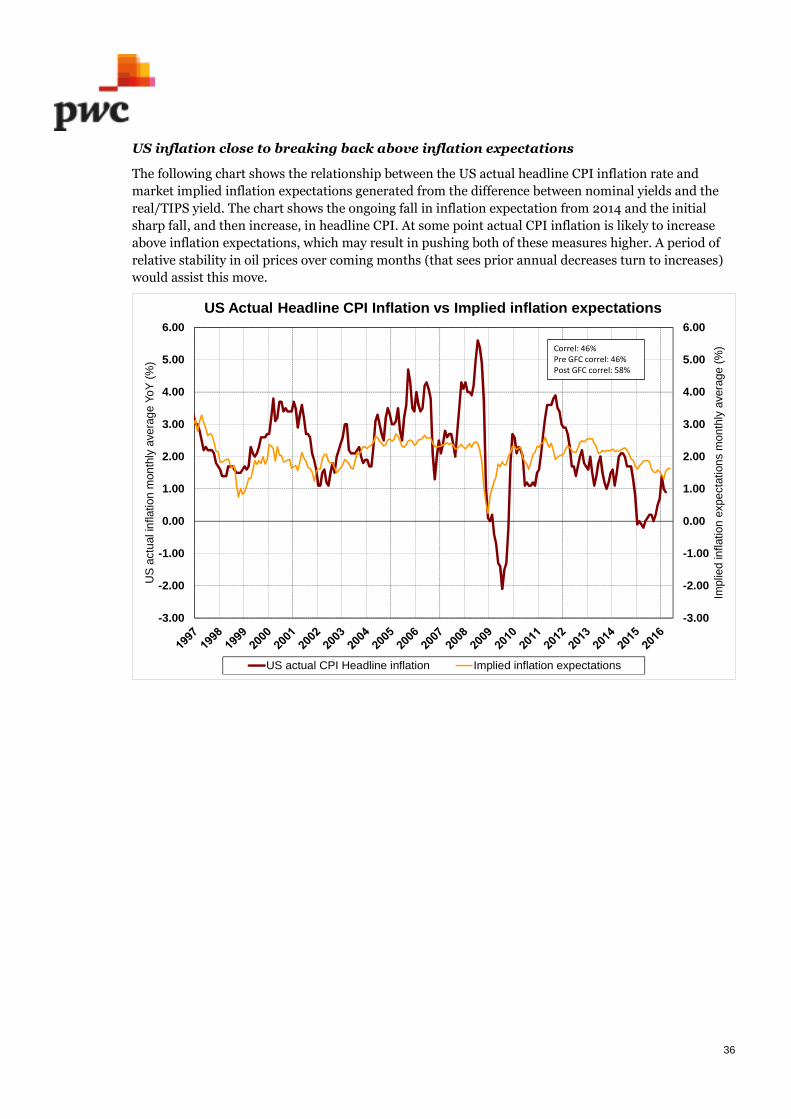
US inflation close to breaking back above inflation expectations
The following chart shows the relationship between the US actual headline CPI inflation rate and
market implied inflation expectations generated from the difference between nominal yields and the
real/TIPS yield. The chart shows the ongoing fall in inflation expectation from 2014 and the initial
sharp fall, and then increase, in headline CPI. At some point actual CPI inflation is likely to increase
above inflation expectations, which may result in pushing both of these measures higher. A period of
relative stability in oil prices over coming months (that sees prior annual decreases turn to increases)
would assist this move.
-3.00
-2.00
-1.00
0.00
1.00
2.00
3.00
4.00
5.00
6.00
-3.00
-2.00
-1.00
0.00
1.00
2.00
3.00
4.00
5.00
6.00
Implie
din
flatio
nexp
ect
atio
ns
mon
thly
ave
rag
e(%
)
US
act
uali
nfla
tion
mon
thly
ave
rag
eY
oY
(%)
US Actual Headline CPI Inflation vs Implied inflation expectations
US actual CPI Headline inflation Implied inflation expectations
Correl: 46%Pre GFC correl: 46%Post GFC correl: 58%
37
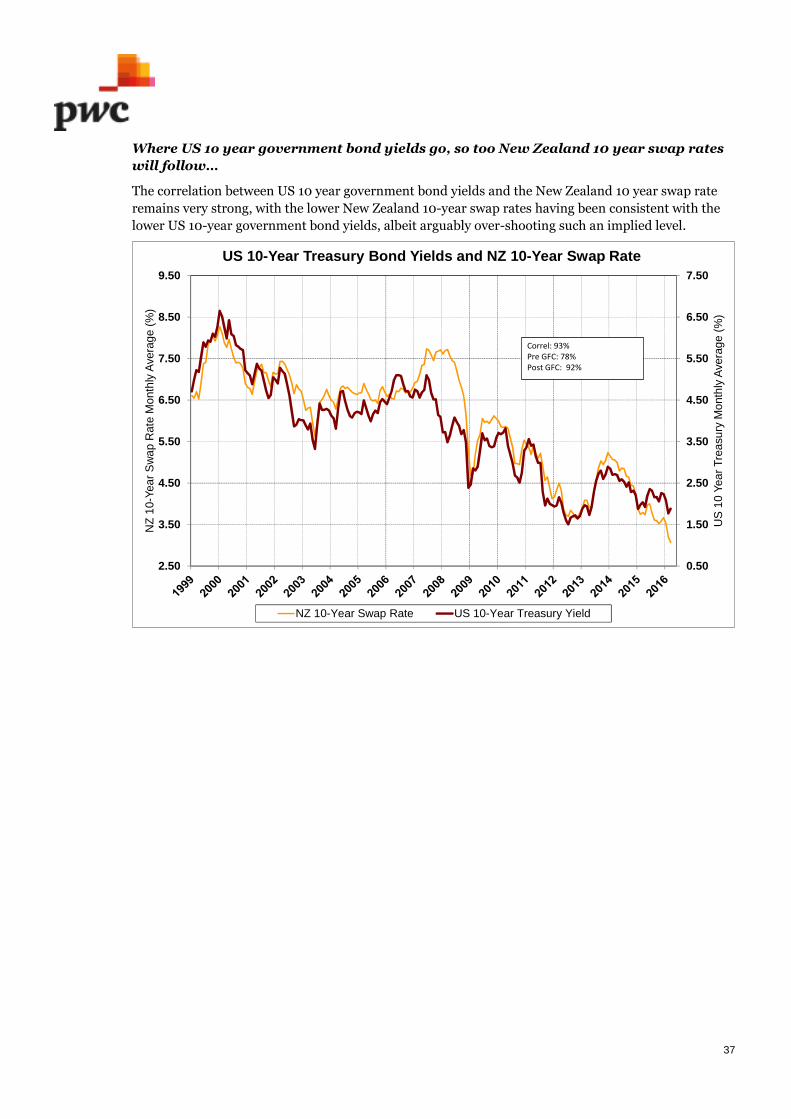
Where US 1o year government bond yields go, so too New Zealand 10 year swap rates
will follow…
The correlation between US 10 year government bond yields and the New Zealand 10 year swap rate
remains very strong, with the lower New Zealand 10-year swap rates having been consistent with the
lower US 10-year government bond yields, albeit arguably over-shooting such an implied level.
0.50
1.50
2.50
3.50
4.50
5.50
6.50
7.50
2.50
3.50
4.50
5.50
6.50
7.50
8.50
9.50
US
10
Yea
rT
rea
sury
Mo
nth
lyA
vera
ge
(%)
NZ
10-Y
ea
rS
wa
pR
ate
Mo
nth
lyA
vera
ge
(%)
US 10-Year Treasury Bond Yields and NZ 10-Year Swap Rate
NZ 10-Year Swap Rate US 10-Year Treasury Yield
Correl: 93%Pre GFC: 78%Post GFC: 92%

38
SUMMARY – US economic drivers ofUS long-term interest ratesThe following summarises the main points of the US economic drivers of US long-term interest rate section:-
Since the GFC, US employment growth, the core PCE deflator and the rate of capacity utilisationhave not been intuitive indicators of the US 10 year government bond yield. US 10 yeargovernment bond yields have also been below a level consistent with headline CPI.
Falls in West Texas Intermediate Oil prices and broader measures of commodity prices such asthe Commodity Research Bureau Index have been consistent with lower headline CPI, lowerinflation expectations and lower US 10 year government bond yields. Latest movements higher inoil prices (for now) – and at least stabilisation in broader commodity price measures - is seeing areversal higher in headline CPI and inflation expectations and (to a modest extent) US 10 yeargovernment bond yields.
The perceived sustainability of oil as an energy source, or alternatively use of other energysources, and lower demand and prices for oil will be a determinant of headline inflation and bondyields, albeit alternative energy sources may have higher prices associated with them.
CONCLUSION: US long-term interest rates remain well below a level indicated by(higher) inflation pressures and other more upbeat US economic data; inflationpressures also appear set to increase.

39
5. Additional US drivers of US 10-yeargovernment bond yields
The massive US Quantitative Easing programme of the US Federal Reserve to purchase
US government bonds to push down yields and support equity and housing markets
and consumer spending has worked…what next?
The US Quantitative Easing (“QE”) Programme of purchasing predominantly US government bonds
initially implemented in November 2008 (USD1.725 trillion), extended in November 2010 (an
additional USD600 billion) and further added to from November 2012 has seen the size of the US
Federal Reserve’s ‘Balance Sheet’ grow from approximately USD1 trillion in late 2008 to USD4.5
trillion by the end of 2014 where it has since remained broadly stable. The purchase of US government
bonds has driven US bond yields lower (inverted axis on chart) motivated to also cheapen the cost of
borrowing in the US and support the housing market, equity market and consumer spending. The
impact of the QE programme must be assessed as largely successful to date in meeting its goals.
What is the final unwritten chapter of Ben Bernanke’s QE playbook to pull the US economy out of
recession? The massive QE buying of bonds to put cash into the US economy a few years back has
succeeded, however Ben did not provide the answers/guidance on how to unwind the QE stimulus
(‘yours Janet’!). Ultimately the Federal Reserve need to sell all the Treasury Bonds they purchased. It
may take 20 years to do so, however bond yields can only go up when they start. Alternatively the
Federal Reserve will hold the bonds until they mature (and ultimately not replace these).
The following chart shows the maturity profile of the US Treasury Bonds owned by the US Federal
Reserve. The Portfolio has USD1.0 trillion of the USD2.4 trillion Treasury debt maturing through 2019
and USD1.6 trillion maturing by 2022. The US Federal Reserve do not intend to increase their USD2.4
trillion holding and anticipate slowly unwinding their positions as inflation returns to the target level
of 2%. The current reinvestment plan is to continue reinvesting coupons and rolling over existing
0.00%
1.00%
2.00%
3.00%
4.00%
5.00%
6.00%
7.00%
8.00%-
0.50
1.00
1.50
2.00
2.50
3.00
3.50
4.00
4.50
5.00
19
95
19
96
19
97
19
98
19
99
20
00
20
01
20
02
20
03
20
04
20
05
20
06
20
07
20
08
20
09
20
10
20
11
20
12
20
13
20
14
20
15
20
16
US
10
-Yea
rT
reasu
ryY
ield
sM
on
thly
Ave
rag
e
Fe
de
ralR
ese
rve
Bala
nce
Sh
ee
t(U
SD
Tri
llio
n)
US 10-year Treasury Yields and Federal Reserve Balance SheetGrowth
Balance Sheet Growth US 10-Year Treasury Yields
*axisinterverted

40
bonds maturing. Over time the US Federal Reserve is expected to decrease the amount being
reinvested in relation to those bonds maturing. Thus the current expectation is the US Federal
Reserve will not be selling any bonds outright but will be gradually reducing the amount
being re-invested to slowly unwind the size of the portfolio.
0
250
500
750
1,000
1,250
1,500
1,750
2,000
2,250
2,500
0.00
50.00
100.00
150.00
200.00
250.00
300.00
350.00
400.00
450.00
500.00
20
16
20
17
20
18
20
19
20
20
20
21
20
22
20
23
20
24
20
25
20
26
20
27
20
28
20
29
20
30
20
31
20
32
20
36
20
37
20
38
20
39
20
40
20
41
20
42
20
43
20
44
20
45
20
46
Cum
ula
tive
am
oun
tm
atu
rin
g(B
illio
n))
Am
ou
ntO
uts
tan
din
g(B
illio
n)
Federal Reserve Sovereign Debt Ownership Maturity Distribution
Bonds Maturing Cumulative Amount
Weighted averageterm to maturity: 8.47years

41
Massive Chinese buying of US government bonds with FX Reserves (trade surpluses)
also constraining yields
Another consideration is if, when and how do the Chinese investors currently holding US Treasury
Bonds reduce their holdings to generate the cash which may be necessary to shore up economic growth
back in China? As the Chinese built up large FX Reserves through trade surpluses these have from
2002 through 2014 significantly been invested in US treasury bonds to an amount equivalent to
approximately half of the holdings of the US Federal Reserve. Japanese investors hold a similar
amount of US Federal Government Debt as the Chinese, while German investor holdings are modest.
The third and fourth largest holders of US Government Debt (being the UK and Hong Kong) are also
markedly smaller than mainland China and Japan.
Combined, the Federal Reserve, Chinese and Japanese investors hold more than one third of all US
Federal Government debt. As at the end of 2015 there was USD13.2 trillion outstanding US Federal
Debt with a further USD2.0 trillion in “Agency” debt.
0
200
400
600
800
1000
1200
1400
2001 2002 2003 2004 2005 2006 2007 2008 2009 2010 2011 2012 2013 2014 2015 2016
Ne
tho
ldin
gs
ofU
ST
rea
surie
s(U
S$
Bill
ions)
Net holdings of US Treasuries
China Japan United Kingdom Germany Hong Kong

42
SUMMARY – Additional US drivers ofUS long-term interest ratesThe following summarises the main points of the Additional US drivers of US long-term interest rates section:-
The massive purchase of US Government Bonds by the US Federal Reserve under QuantitativeEasing has been a significant factor since 2008 in maintaining low bond yields.
The US Federal Reserve is currently re-investing coupons and also importantly re-investingmaturing bonds. Once short-term interest rates are normalised with inflation stabilising at 2.0%the US Federal Reserve will reduce the size of their holdings of US government debt by not re-investing all of maturing bonds that they hold.
Chinese and Japanese investors combined hold a similar amount of US Government debt as dothe US Federal Reserve. There is the potential for Chinese investors to reduce their holdings togenerate the cash to shore up economic growth back in China.
CONCLUSION: US long-term interest rates are being held at current low levelsimpacted by the massive bond holdings of the US Federal Reserve, with these onlyto be very slowly allowed to unwind/reduce. Asian investor buying and holdings ofUS Treasury bonds is also currently holding yields down, however these investorsmay become sellers, sending yields higher.
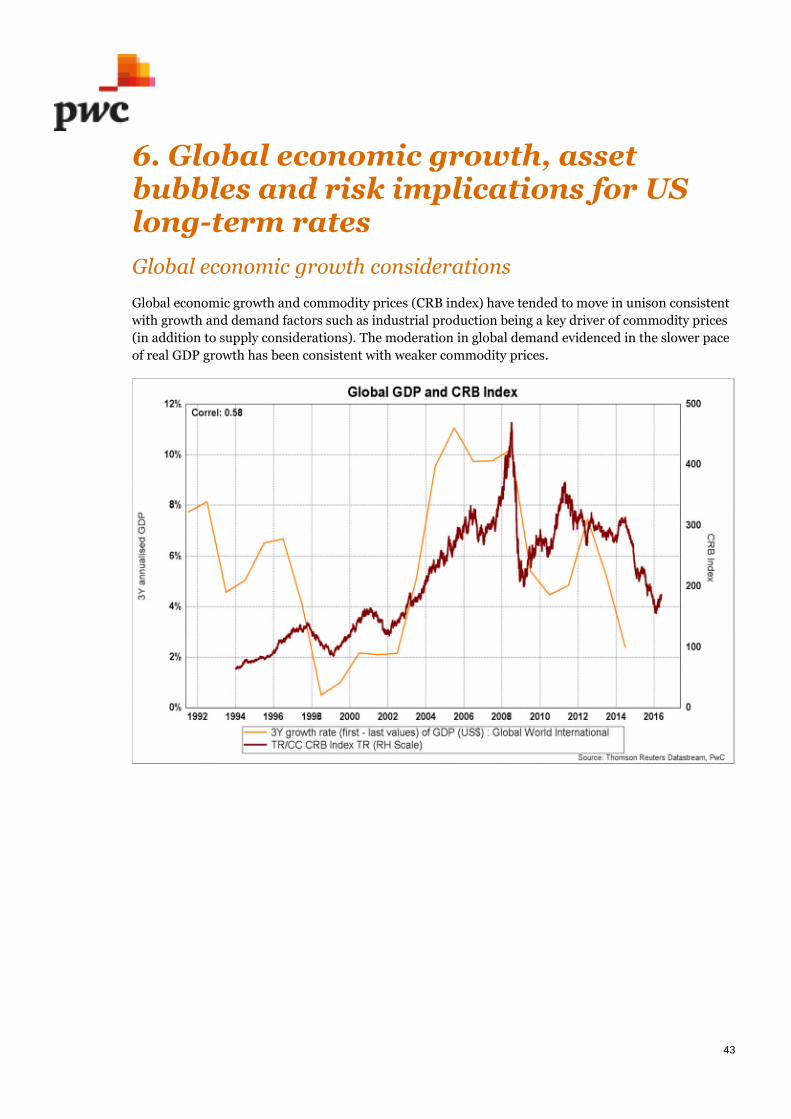
43
6. Global economic growth, assetbubbles and risk implications for USlong-term rates
Global economic growth considerations
Global economic growth and commodity prices (CRB index) have tended to move in unison consistent
with growth and demand factors such as industrial production being a key driver of commodity prices
(in addition to supply considerations). The moderation in global demand evidenced in the slower pace
of real GDP growth has been consistent with weaker commodity prices.

44
From a supply perspective the previous period of rising US oil production amidst the shale oil
revolution has been an important factor behind lower oil prices.
Rising production is also being met with rising stocks. Based on current inventory and supply levels, it
is difficult to see a material sustained recovery in oil prices at this time back towards previous
‘equilibrium’ levels in the order of USD100/barrel.
0
2,000
4,000
6,000
8,000
10,000
12,000
Jan-86 Jan-91 Jan-96 Jan-01 Jan-06 Jan-11 Jan-16
Ba
rre
ls(0
00
s)
Weekly U.S. Field Production of Crude Oil (Thousand Barrels perDay)
0
50,000
100,000
150,000
200,000
250,000
300,000
350,000
400,000
450,000
500,000
550,000
600,000
May-86 May-91 May-96 May-01 May-06 May-11 May-16
Bar
rels
(000
s)
Weekly U.S. Ending Stocks excluding SPR of Crude Oil (ThousandBarrels)

45
We need to be cognisant that US oil production accounts for less than 10% of that globally, although is
considerably assisting the US becoming much more self-sufficient on internal oil production (i.e.
rather than reliant on imports).
It is also the case that dynamics in the oil (and other commodities) markets have always been very
sensitive to marginal production impacting disproportionately on prices, such that relatively small
shifts in supply and demand (causing disequilibrium or ‘imbalances’) can have a relatively large impact
on prices.
Since 1980 global economic growth rates and US interest rates (10 year government bond yield and
Federal Funds Rate) have trended lower. Global economic growth has an approximately 3 year lead on
US interest rate movements. The immediate implication based on this relationship is that for higher
sustained US interest rates global economic growth needs to recover.

46
US Asset Bubbles?
There is a positive correlation between the current rate of house price inflation in the US and future
levels of the Federal Funds Rate (i.e. in two and a half years’ time). The link is that rising house prices
will ultimately be met with higher interest rates to combat these and also general inflation and
potentially financial stability concerns. Furthermore, in the intervening two and a half year period
(that the lead encompasses), lower interest rates will likely assist the progression higher in house
prices.
At existing house price appreciation rates, the recovering US housing market does not appear to be a
bubble and indicates being able to withstand an outlook for rising US interest rates.

47
There is a strong inverse correlation over long time periods between interest rates and equity markets.
Specifically periods of low interest rates have driven higher equity markets over the last six years. The
period of sharp movement higher in equity markets also co-incides with Quantitative Easing designed
to boost equity markets. Lower discount factors/rates for equity earnings/valuations based on the very
low level of base interest rates has also been a contributing factor to high equity valuations/prices.
The lofty level of equity valuations and the potential for a severe correction in the event the monetary
policy ‘candy’ as supplied by the US FOMC is taken away is expected to limit the pace of US Federal
Funds interest rate increases. Expectations earlier this year for higher US interest rates contributed to
lower equity markets at the time, more recent expectations for higher US interest rates appear to have
been taken in the stride of equity markets.

48
The chart below shows the 10 year annualised percentage change in the S&P 500 Index versus the US
Federal Funds rate. The purpose of annualising the 10 year percentage change is to smooth out the
changes in the S&P500 as there has been a clear trend higher in the Index (as shown below). The 10
year annualised growth rate is calculated using the logarithmic change between the S&P Index price
today and S&P Index price 10 years ago and annualising this figure. The chart shows that in periods of
monetary policy easing – when the Federal Funds rate is lowered – US equities will generally rally as
borrowing costs become lower and net present values increase, making more projects profitable, and
also making leveraged positions into the equity markets cheaper to fund, and equity investments much
more appealing than “cash”.
With the large amounts of QE since 2009 in the US, equity markets have swollen to a point whereby
they will be an influence on future monetary policy. Tightening monetary conditions will be expected
to be conducted very slowly (as signalled by Janet Yellen and the Federal Reserve) to allow US equity
markets to adjust appropriately rather than risk a severe correction lower.

49
Emerging marketsFrom a BRIC/emerging market perspective, the period between 1995 and 2009 broadly exhibited a
positive correlation between BRIC equity markets and US interest rates (Federal Funds Rate). The
connection between these being that periods of stronger US economic growth and inflation (associated
with times of higher US interest rates) was also positive for these emerging markets equity bourses. In
the aftermath of the GFC much of these prior gains in emerging market equities have since unwound.
Whilst historical patterns may suggest otherwise it would be difficult to envisage Emerging equity
markets doing well in a period of higher US interest rates. Indeed, expectations for higher US interest
rates has been a material factor behind the movements lower in emerging market equities. In the lead
up to the first Federal Funds rate increase late 2015, BRIC equity markets moved markedly lower.
However, when the US Federal Reserve presented a more dovish than expected policy statement
delaying future forecast hikes in early 2016, BRIC equities bounced back.

50
SUMMARY – Global economic growthand asset bubblesThe following summarises the main points around global economic growth andasset bubbles:-
Current relationships between global economic growth, commodity prices and US interest ratesdo not signal strong upward pressure on US interest rates. The question/debate may be thatwhilst the US economy is strong enough to look after itself it may not be able to lead the globaleconomy. Based on this relationship, global economic growth needs to recover for US rates tonormalise with any great pace.
There is also debate whether the outlook for term interest rates will be fundamentally dependenton global growth in particular emerging economies. If it is no longer China, as it goes through itstransitional growth realignment, who is it? India. Where is the industrial production growthcoming from to fundamentally support commodity prices…which will ultimately lead to higherheadline inflation and assist higher term rates?
There is no evidence to suggest that the US housing market is approaching bubble territory orseverely at risk of rising interest rates. Evidence around US equity markets do indicate the risk ofmovements sharply lower in these in the instance of more aggressive movements higher ininterest rates – something US Federal Reserve Chair Yellen is very mindful of contributing to thevery cautious monetary policy tightening approach.
Evidence of emerging market equity market valuations and US interest rates is mixed. Wherehigher US interest rates have reflected stronger US economic growth and inflation this has beenfavourable for emerging market equities. The current situation is one where emerging marketequity valuations appear at least in part reliant on loose US monetary policy, therefore risk ofreversal. Market jitters and US Federal Reserve awareness of such is already apparent.
CONCLUSION: Global economic growth and the stage of the commodity price cycledoes not auger for rapid movements higher in US interest rates. So too the FederalReserve is very mindful of disrupting US and emerging market equity markets andvaluations, hence the cautious approach from Janet Yellen to increase short-terminterest rates. Success of European monetary policy Quantitative Easing policies toeventually re-stimulate investment markets and consumer spending would likelysupport higher interest rates globally from existing levels.

51
7. Global government bond yields anddrivers
‘Convergence’ of global long-term interest rates with Japanese and European QE and
negative policy rates
Quantitative easing in Japan and Europe over recent years and the implementation of negative short-
term interest rates in those (and other) countries has produced a global wave of investment cash
looking for a yield return as the money has not been on-lent by the banks to households and
companies. That weight of money keeps bond yields very low around the world further accentuating
the lower yields in the US and dragging down the (comparatively higher) yields in New Zealand and
Australia also.
It is estimated by Citibank that at present there is the equivalent of USD39 trillion of outstanding G10
sovereign debt. G10 debt with a negative yield has increased to USD13.7 trillion being 35% of all G10
debt. Within this the proportion of short-term debt (defined as less than 12 months) is approximately
USD2.6 trillion and rising.
Japan accounts for almost 58% of all negative yielding G10 sovereign debt followed by France at 11%
and Germany at 10.50%.
The US accounts for almost 60% of all positive yielding debt and 89% of the positive yielding G10
sovereign debt which has a tenor less than 12 months. Also, US debt accounts for 74% of the positive
yielding G10 sovereign debt in the 1 to 5 year sector.
The conclusion of Citibank is: Thus, given that USD denominated debt is still extremely attractive
versus most high grade sovereign debt, we expect a structural increase in demand from foreign
investors that are seeking refuge from a negative rate environment. And, given that USD debt
-1.00
0.00
1.00
2.00
3.00
4.00
5.00
6.00
7.00
8.00
-1.00
0.00
1.00
2.00
3.00
4.00
5.00
6.00
7.00
8.00
10-Y
ear
Govt
Bon
dY
ield
(%)
10-Y
ear
Govt
Bon
dY
ield
(%)
NZ, Germany, Japan, Australia and US 10-Year Govt Bond Yields
United States Australia Japan Germany New Zealand

52
accounts for most of shorter maturity positive yielding debt, the front end is likely to stay well
supported and could richen further (i.e. higher prices / lower yield).
An alternative viewpoint is whether there is a re-divergence of global bond yields as the Federal
Reserve continues to tighten monetary policy at a pace quicker than the very benign pace expected by
the interest rate markets as the US inflation and economic activity data print more strongly than
expected.
In May 2006, nearing the completion of the US Federal Reserve’s previous monetary policy tightening
cycle, the US Government Bond Yield curve was flat with the Australia yield curve flat at high levels,
New Zealand downward sloping (inverted) in the short-term rates at high absolute levels, and Japan
and Germany traditionally ‘normally’ upward sloping with relatively lower short-term rates but higher
long-term rates.
90d 2 Yr 5 Yr 7 Yr 10 Yr
Australia 5.68% 5.73% 5.78% 5.80% 5.82%
Japan 0.20% 0.77% 1.42% 1.79% 1.94%
United States 4.82% 4.91% 4.94% 5.07% 5.06%
Germany 2.78% 3.31% 3.70% 3.88% 4.03%
New Zealand 7.49% 6.33% 5.98% 5.96% 5.87%
-1.00%
0.00%
1.00%
2.00%
3.00%
4.00%
5.00%
6.00%
7.00%
8.00%
-1.00%
0.00%
1.00%
2.00%
3.00%
4.00%
5.00%
6.00%
7.00%
8.00%
Go
vern
men
tB
ond
Yie
ld(%
)
Go
vern
men
tB
ond
Yie
ld(%
)
Global Government Bond Yield Curve 2006

53
Fast forward to the situation in May 2016 which is markedly different (same scale on chart), with the
US gradually upward sloping at very low rates, New Zealand and Australia slightly inverted in the
short-term rates and slightly up-ward sloping in the long-term rates (at very low levels) and Japan and
Germany essentially flat at slightly negative interest rates across the yield curve out to 10 years and 7
years respectively.
The charts above and implications from QE and negative monetary policy rates shows it is the central
bankers largely running bonds yields at present, posing the question of whether existing western
economies can survive the current low yields across all maturity terms. So far it has been everyone
chasing one another down to lower yields. At some point the central banks must try to correct the
existing positions, i.e. Germany and Japan no longer have any material difference between yields of
any terms, with most of these also negative. It is difficult to fathom how traditional economics can
actually function (borrow at lower short-term rates, lend/invest in higher long-term rates) unless we
see a massive correction upwards in credit spreads to compensate the fact that these economies do not
have any risk free rate of return.
Even if central banks can carefully manipulate and reconstruct their long-term interest rates to
address this structural imbalance it will have to be by small regular incremental increases to short-
term interest rates with an emphasis on ratcheting long-term interest rates higher. How will the
pension funds and insurance companies survive the massive valuation erosion on their bond portfolios
- what is the impact on a 10 year Treasury bond purchased today at 1.75% yield when the yield goes to
2.75%?
If the above re-alignment of higher bond yields / lower bond prices does not occur are we going to see
a massive shift in pension fund/ insurance company asset allocation policies away from bonds? Are we
going to see some of these entities fail as they effectively lock in negative cashflows in terms of
managing their long term liabilities (expected payouts to retirees etc.)? In recent years equity prices
and bond prices (yields lower) have done very well providing outsized returns for funds and
assumingly some ability to withstand some period of flat (or modestly negative) returns.
90d 2 Yr 5 Yr 7 Yr 10 Yr
Australia 1.94% 1.58% 1.79% 2.04% 2.28%
Japan -0.29% -0.25% -0.23% -0.23% -0.11%
United States 0.25% 0.73% 1.20% 1.50% 1.72%
Germany -0.59% -0.52% -0.39% -0.25% 0.13%
New Zealand 2.36% 2.00% 2.10% 2.22% 2.60%
-1.00%
0.00%
1.00%
2.00%
3.00%
4.00%
5.00%
6.00%
7.00%
8.00%
-1.00%
0.00%
1.00%
2.00%
3.00%
4.00%
5.00%
6.00%
7.00%
8.00%
Go
vern
men
tB
ond
Yie
ld(%
)
Go
vern
men
tB
ond
Yie
ld(%
)
Global Government Bond Yield Curve 2016
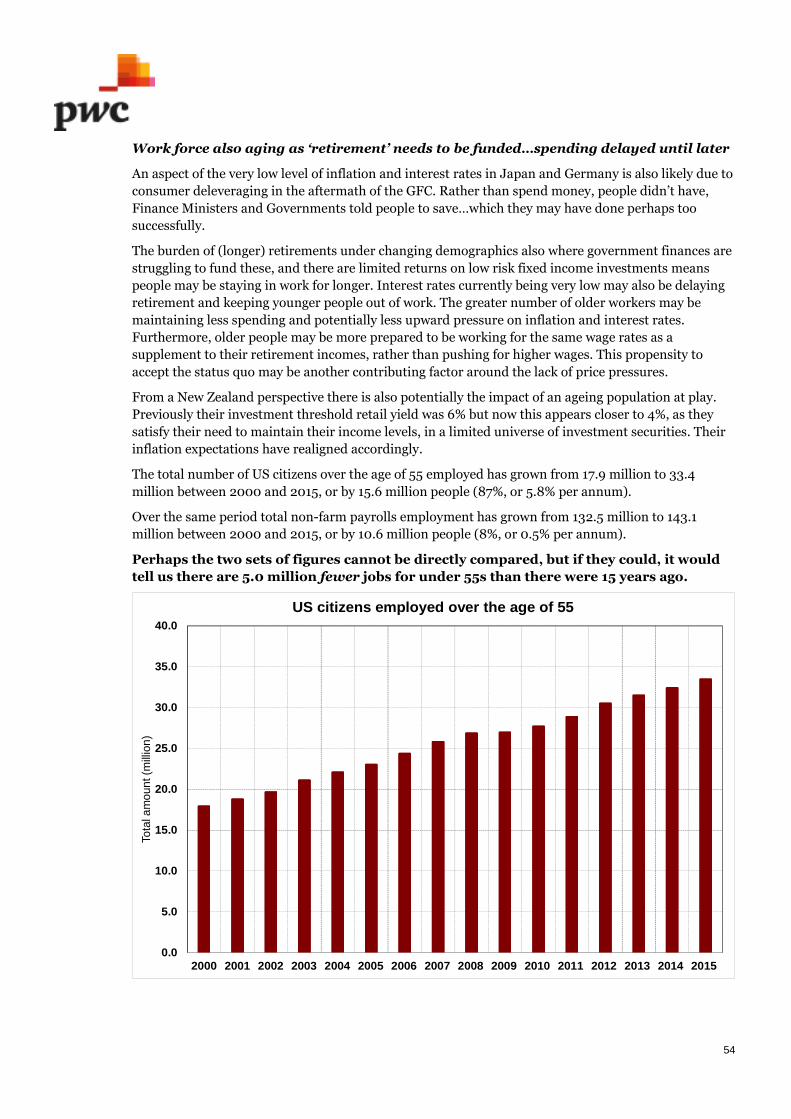
54
Work force also aging as ‘retirement’ needs to be funded…spending delayed until later
An aspect of the very low level of inflation and interest rates in Japan and Germany is also likely due to
consumer deleveraging in the aftermath of the GFC. Rather than spend money, people didn’t have,
Finance Ministers and Governments told people to save…which they may have done perhaps too
successfully.
The burden of (longer) retirements under changing demographics also where government finances are
struggling to fund these, and there are limited returns on low risk fixed income investments means
people may be staying in work for longer. Interest rates currently being very low may also be delaying
retirement and keeping younger people out of work. The greater number of older workers may be
maintaining less spending and potentially less upward pressure on inflation and interest rates.
Furthermore, older people may be more prepared to be working for the same wage rates as a
supplement to their retirement incomes, rather than pushing for higher wages. This propensity to
accept the status quo may be another contributing factor around the lack of price pressures.
From a New Zealand perspective there is also potentially the impact of an ageing population at play.
Previously their investment threshold retail yield was 6% but now this appears closer to 4%, as they
satisfy their need to maintain their income levels, in a limited universe of investment securities. Their
inflation expectations have realigned accordingly.
The total number of US citizens over the age of 55 employed has grown from 17.9 million to 33.4
million between 2000 and 2015, or by 15.6 million people (87%, or 5.8% per annum).
Over the same period total non-farm payrolls employment has grown from 132.5 million to 143.1
million between 2000 and 2015, or by 10.6 million people (8%, or 0.5% per annum).
Perhaps the two sets of figures cannot be directly compared, but if they could, it would
tell us there are 5.0 million fewer jobs for under 55s than there were 15 years ago.
0.0
5.0
10.0
15.0
20.0
25.0
30.0
35.0
40.0
2000 2001 2002 2003 2004 2005 2006 2007 2008 2009 2010 2011 2012 2013 2014 2015
Tota
lam
oun
t(m
illio
n)
US citizens employed over the age of 55
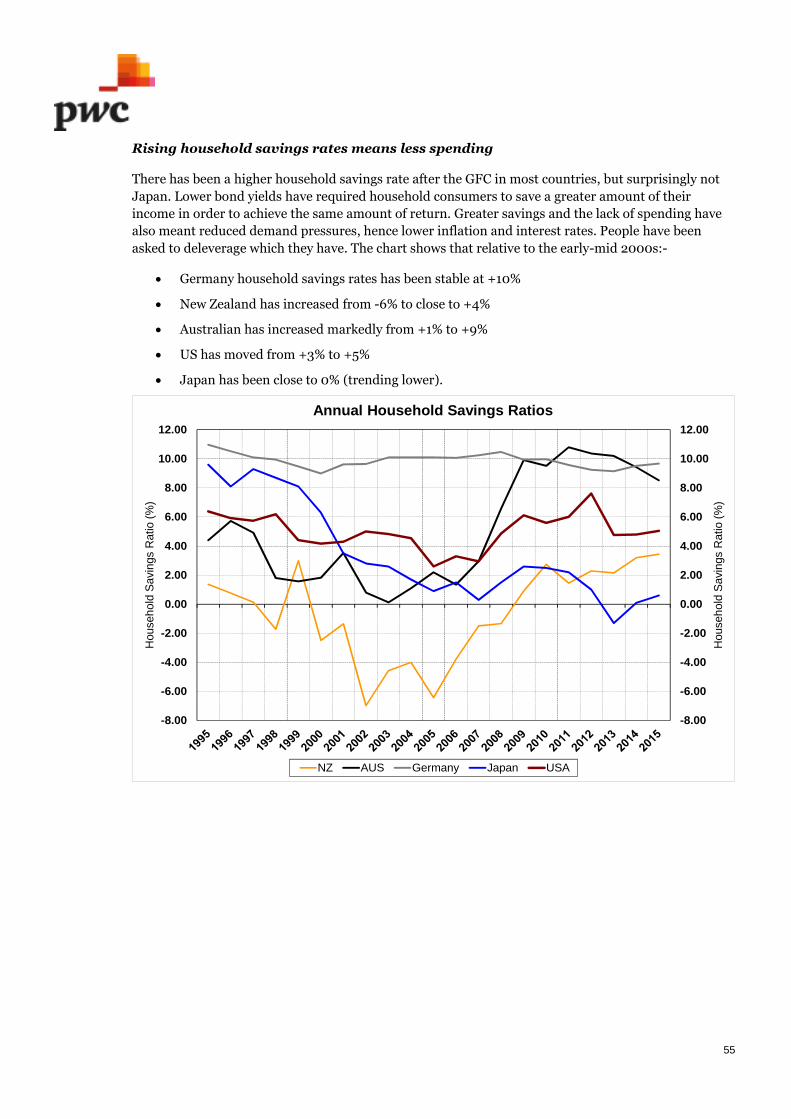
55
Rising household savings rates means less spending
There has been a higher household savings rate after the GFC in most countries, but surprisingly not
Japan. Lower bond yields have required household consumers to save a greater amount of their
income in order to achieve the same amount of return. Greater savings and the lack of spending have
also meant reduced demand pressures, hence lower inflation and interest rates. People have been
asked to deleverage which they have. The chart shows that relative to the early-mid 2000s:-
Germany household savings rates has been stable at +10%
New Zealand has increased from -6% to close to +4%
Australian has increased markedly from +1% to +9%
US has moved from +3% to +5%
Japan has been close to 0% (trending lower).
-8.00
-6.00
-4.00
-2.00
0.00
2.00
4.00
6.00
8.00
10.00
12.00
-8.00
-6.00
-4.00
-2.00
0.00
2.00
4.00
6.00
8.00
10.00
12.00
House
hold
Savi
ngs
Ratio
(%)
House
hold
Savi
ngs
Ratio
(%)
Annual Household Savings Ratios
NZ AUS Germany Japan USA

56
US Corporate Bond issuance approximately USD1.5 trillion per annum for each of the
last four years…being absorbed by the market
Until the investment monies at very cheap cost dry up (as all the money has been invested) the current
situation is unlikely to change. No-one knows when that will happen. Borrowers have never had it so
cheap and thus corporate bond issuance and residential mortgage borrowing has increased. However,
to date the volume of debt issued has not matched the amount of liquidity sloshing around the world
looking for a home.
0.0
200.0
400.0
600.0
800.0
1,000.0
1,200.0
1,400.0
1,600.0
2000 2001 2002 2003 2004 2005 2006 2007 2008 2009 2010 2011 2012 2013 2014 2015
US
DB
illio
n
US Corporate Bond Issuance

57
SUMMARY – Global government bondyields and driversThe following summarises the main points of Global government bond yield anddrivers:-
Negative interest rates in Japan, Germany/Europe (and other) is helping drive down/convergeglobal bond yields
The absolute level of interest rates does not need to go as high as pre-GFC, given negative interestrates and super-loose monetary policy settings maintain the interest rate differential betweendifferent economies.
Demographics are also at play – older populations need to keep working for longer, replacing jobsotherwise of younger people, but also with interest rates low need to earn more for retirement(self-reinforcing cycle?). Older workers may also be doing work for cheaper, as do not need thewage growth, just need to supplement incomes at existing wage rates.
Savings rates have increased as consumers have deleveraged as instructed.
Global investment funds have done very well in recent years therefore able to absorb a period offalling bond prices (higher yields) – sharp fall in equity prices could be more of a concern – keyrisk for Yellen.
But what of the potential of China (and other) bond markets to emerge as new supply withgreater integration into global capital and financial markets over future years?
CONCLUSION: Global demographics of ageing populations and greater savingsrates are a significant contributing factor to driving global long-term interest rateslower. The limited universe of assets/securities in which to invest to earn areasonable return and match long-term liabilities/commitments within pensionfunds and life insurers also continues to place downward pressure on US long-terminterest rates. If the US economy is sufficiently strong (inflation/activity) and theUS Federal Reserve tightens monetary policy by more than is currently expected bybenign interest rate market pricing, US long-term bond yields would be expected torise – and New Zealand follow. That action could create renewed divergence (notfurther convergence) with European/Japanese rates which are presently providingdownward pressure on US / global interest rates. Global bond yields have beenconverging amidst negative central bank monetary policy rates in many countriesand quantitative easing programmes of purchasing government bonds drivinglonger-term bond yields very low and often negative. US inflation expectations/realrates and term premium over “neutral rates” are also at play; the ‘ratcheting lower’of interest rates may already have occurred.

58
8. Emerging non-traditional drivers ofUS long-term interest rates
There are broader societal shifts at play that potentially may also be containing the level of interest
rates in the US and globally and supressing traditional indicators of US bond yields (such as robust
employment growth) from exhibiting their more traditional relationships. The impact of these factors
are difficult to quantify, and as always will be only ‘proved’ in retrospect, but include aspects such as
the following:-
Whether measures such as GDP growth and CPI are actually relevant variables used to steer
an economy or whether there are more relevant and appropriate alternatives - such as
measures of job security, the environment, health of the elderly…
Global Income inequality - is income skew distorting traditional measurements (consumption,
disposable income , GDP etc.); whilst aggregates may look fine, the level of detail behind these
may indicate very disproportionate distributions.
Employment data containing estimation bias given the large levels of underemployment. A
larger numbers of people are working less than they want yet are not accurately captured by
this classification in headline employment measures. This may include people working in
industries with declining wages not to mention those that have given up entirely on work, and
are not captured by the headline figures. Underemployment figures may be staggeringly high
and also set to jump sharply higher over the next 10 years with robotic breakthroughs.
Are people not spending because of a real lack of certainty around what may be around the
corner? We are lacking good lead indicators of fear driving savings and consumption patterns.
Declining incomes for some who cannot work as much as they want, actual living costs that go
up by far more than ‘official’ CPI figures, and fear of labour market obsolescence, ageing,
income inequality, geopolitical unrest, rising protectionism, the environment - these are all
paramount in people's minds. The fear not of today (i.e. current economic indicators or old
correlations) but of the future and it looks grim for the majority of the middle/lower class who
are not going to share in future wealth accumulation (“Trumpism”!).
What is the impact of the crippling debt overhang the globe is dealing with? Unfortunately
there is no longer any fiscal bullets to help out. Endogenous consumption is only way out of
this debt / deflation trap and that doesn't look likely anytime soon for many parts of the world.
Will the (very belated) European Quantitative Easing Programme work as it has
done in the US??
Perennially low inflation driven by technological advancements, job obsolescence, and
underemployment… rising and ongoing fear factor within society and consumers means
spending is very contained.
Has monetary policy now done its job, as its influence on market (retail) interest rates/credit
growth/real economy is less effective? It would mean loose monetary policy stays with us
longer, as it offsets higher banks costs from increased credit spreads and regulatory costs. We
should not underestimate the regulatory cost burden that the regulators will inflict on banks.
Fiscal policy changes will need to step up and provide the growth momentum across the real
economy. Is there confidence that the politicians can deliver what it takes?
These above factors could imply monetary policy irrelevance when it comes to impacting inflation and
growth – interest rates are a central bank manipulation but are all but ineffective at moving the real
economy.

59
SUMMARY – Emerging non-traditional drivers of US long-terminterest ratesThe following summarises the main points of Emerging non-traditional drivers ofUS long-term interest rates:-
CONCLUSION: No amount of super-loose monetary policy may be sufficient to stimulateeconomic outcomes (even if measured correctly) should wider societal undercurrents (ageingpopulation, underemployment, technological improvement, job obsolescence, income inequality)be at play with these arresting monetary policy as irrelevant. The implication is no pressure forinterest rates to increase but equally no point of lower interest rates. Big question; can theEuropean Central Bank President Mario Draghi’s sleight of hand with non-traditional monetarypolicy measures match that of Ben Bernanke now that German opposition has been overcome???

60
9. Regulation, credit spreads and theirimplications for base rates
Credit spreads typically move with an inverse relationship to wholesale market swap (interest) rates,
or underlying sovereign government bond yields. Furthermore, it is often the case that investors may
require a ‘minimum’ yield per category of risk, therefore when wholesale market swap rates fall, credit
spreads may rise as an offset to ensure a minimum investor all-up return of the credit spread plus
swap rate.
Regulatory environment; additional regulation expected to lead to wider credit
spreads
Credit spreads appear set to slowly grind higher in coming years with a contributing factor additional
regulation that increases bank costs of funds. The costs associated with reforms are expected to lead to
a similar structural shift in credit spreads to that observed following the increase in Basel III mandated
capital requirements in January 2015. These requirements (which meant banks had to hold 6% tier 1
capital3) led to an upward shift in credit spreads as lenders looked to maintain traditional margins,
whilst facing tighter lending restrictions. Future reforms are likely to increase these requirements
further, as regulators focus on strengthening balance sheets and reducing sensitivity to sector shocks,
which suggests credit spreads will likely rise over time.
The chart below displays New Zealand bank issuance spreads since August 2013. Prior to the
implementation of the Basel III capital requirements, spreads can be seen tracking lower however
these rose sharply in early 2015, upon the implementation of greater capital requirements.
3 Defined as shareholders equity plus retained earnings.
40
50
60
70
80
90
100
110
120
130
140
40
50
60
70
80
90
100
110
120
130
140
Aug-13 Nov-13 Feb-14 May-14 Aug-14 Nov-14 Feb-15 May-15 Aug-15 Nov-15 Feb-16 May-16
Spre
ad
tosw
ap
(bps)
Spre
ad
tosw
ap
(bps)
Bank senior bond issuance since August 2013
3 year bank senior bonds 5 year bank senior bondsSource: Reuters
0.5% ANZ $325m 3yr
0.55% ASB $130m 3yr
0.65% ASB $320m 3yr
0.65% ASB $350m 3yr
0.9% BNZ $300m 5yr
0.85% BNZ $575m 5yr
0.8% ANZ $325m 5yr
0.9% ANZ $400m 5yr
0.85% WBC $325m 5yr
0.9% ANZ $225m 5yr
1.10% ASB $35m 4.25yr
1.03% WBC $800m 5yr
0.75% ASB $200m 5yr
1% ASB $475m 3yr
1% ANZ $300m 3yr
1.30% WBC $700m 5yr
1.27% ASB $300m 5yr
0.5% WBC $500m 3yr
0.5% ASB $300m 3yr

61
A similar occurrence can be observed in overseas credit markets as a result of the capital requirements.
The following chart displays EUR and US credit spreads on an index of AA rated entities. With these
indices dominated by banks domiciled in these regions, the chart can be used as a proxy for bank costs
of funds in the regions. Although credit spreads in both regions have tightened in recent months, they
have not returned to levels seen prior to the Basel III capital requirements, exhibiting a similar trend
overall to that observed in the New Zealand market.
0
20
40
60
80
100
120
140
160
May 11 Nov 11 May 12 Nov 12 May 13 Nov 13 May 14 Nov 14 May 15 Nov 15 May 16
Spre
ad
ove
rsw
ap
(bps)
US & EUR 5 Year AA Corporate Credit Spreads
US 5yr AA EUR 5yr AA

62
The flow through effect of these reforms can be observed in the BBB corporate credit spread market.
With banks passing on the increase in cost, BBB spreads rose sharply and remain at elevated levels
relative to the history of mid 2013 through mid-2015, despite some tightening in recent
weeks/months.
50
100
150
200
250
300
May 11 May 12 May 13 May 14 May 15 May 16
Spre
ad
ove
rsw
ap
(bps)
5 Year BBB Credit Spreads
NZ BBB 5yr AU BBB 5yr US BBB 5yr EUR BBB 5yr

63
From a domestic perspective the regulatory cause and effect relationship has been very evident since
the GFC. Prior to the GFC the environment was such that retail term deposit rates were typically
below wholesale market rates, by up to 100 basis points during the 2004 to 2008 period. The GFC
saw a rapid change in this environment with regulatory change including measures such as the core
funding ratio introduced where domestic banks were forced to fund more from the domestic market
and/or longer maturity terms to place less reliance on short-term foreign capital, but at an additional
cost. The chart shows at times funding in the retail term deposit market has been up to +200 basis
points above the wholesale rate but has since moved down to +100 basis points, i.e. still representing a
shift in margins of close to 200 basis points relative to prior to the GFC.
-1.0
0.0
1.0
2.0
3.0
4.0
5.0
6.0
7.0
8.0
9.0
10.0
-1.0
0.0
1.0
2.0
3.0
4.0
5.0
6.0
7.0
8.0
9.0
10.0
Apr-04 Apr-06 Apr-08 Apr-10 Apr-12 Apr-14 Apr-16
6M
on
thD
ep
osit
Ra
tes
(%)
an
dsp
rea
d
18
0D
ay
BB
Ra
tes
(%)
New Zealand short-term retail deposits and 180 day bank bill rates
Spread 180 day bank bill rate 6 month retail deposit rate ($10k min)

64
Event Risk impact on Credit Spreads
Unforeseen events that drive material financial market volatility also have a substantial impact on
credit spreads. Occurrences such as an emerging market default or geo-political factors, cannot be
foreseen but greatly reduce market liquidity. The following chart illustrates the strong relationship
between New Zealand bank credit spreads (which are passed on to corporate borrowers) and global
liquidity. The Global Liquidity Tracker developed by BofA Merril Lynch is a composite indicator of
liquidity conditions in emerging and developed economies. The measure encompasses market spreads,
asset prices and monetary and credit data across the US, Europe, Japan and Emerging Markets. The
tracker reflects a standard deviation of +/-3 in the chart below. A larger negative reading under the
tracker is associated with tighter liquidity conditions (i.e. increased costs and difficulties in raising
funds). Such an environment also typically entails rising market volatility resulting in higher bank and
corporate borrowing costs, i.e. when liquidity is reduced (becomes more negative), credit spreads rise.
0
50
100
150
200
250
300-14
-12
-10
-8
-6
-4
-2
0
2
4May 07 May 08 May 09 May 10 May 11 May 12 May 13 May 14 May 15 May 16
Spre
ad
ove
rsw
ap
(bps)
Glo
ba
lLiq
udity
Tra
cke
rM
idP
rice
(in
vert
ed
)
Merrill Lynch Global Liquidity Tracker vs NZ Bank Spreads
Global Liquidity Tracker 3 Year Bank Snr Bonds (RHS) 5 Year Bank Snr Bonds (RHS)
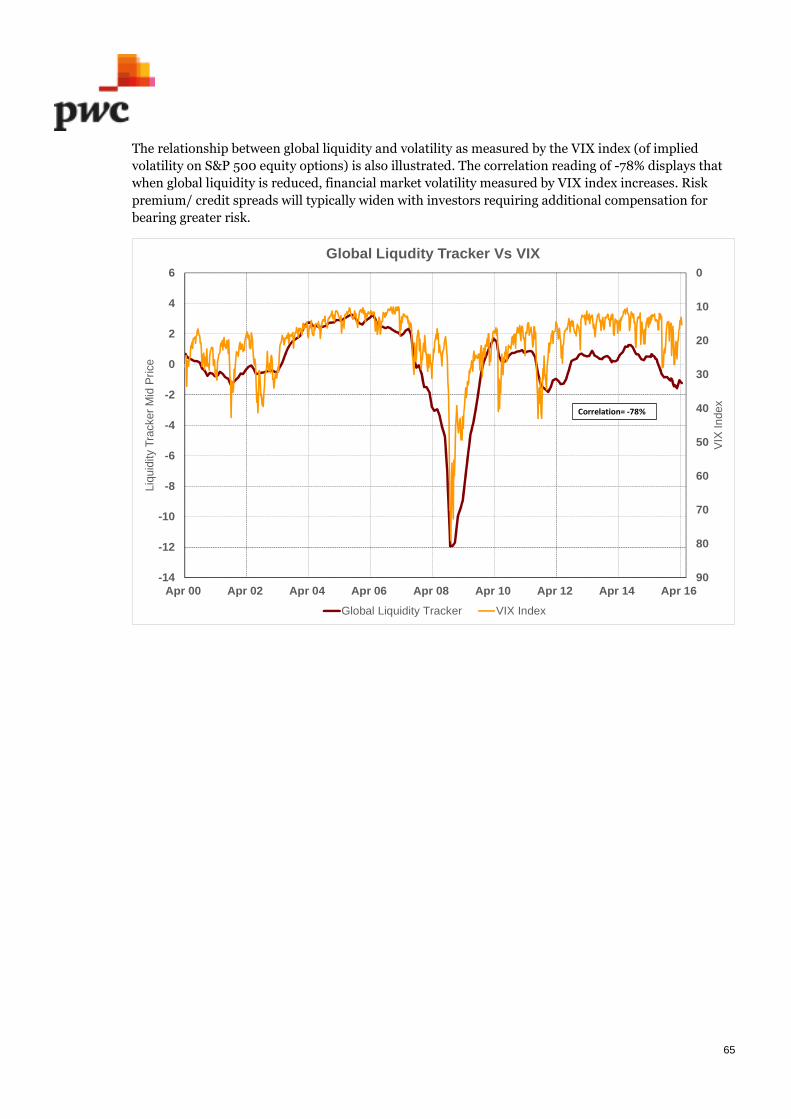
65
The relationship between global liquidity and volatility as measured by the VIX index (of implied
volatility on S&P 500 equity options) is also illustrated. The correlation reading of -78% displays that
when global liquidity is reduced, financial market volatility measured by VIX index increases. Risk
premium/ credit spreads will typically widen with investors requiring additional compensation for
bearing greater risk.
0
10
20
30
40
50
60
70
80
90-14
-12
-10
-8
-6
-4
-2
0
2
4
6
Apr 00 Apr 02 Apr 04 Apr 06 Apr 08 Apr 10 Apr 12 Apr 14 Apr 16
VIX
Index
Liq
uid
ityT
rack
er
Mid
Pri
ce
Global Liqudity Tracker Vs VIX
Global Liquidity Tracker VIX Index
Correlation= -78%

66
The association between measures of risk and volatility can also be observed from the chart presented
below which displays the VIX index and the S&P ISDA 100 which tracks CDS (Credit Default Swap)
spreads of entities on the S&P 100. In situations where volatility increases, spreads on the S&P/ISDA
100 CDS Index also rise, displaying a heightening in probabilities of default due to the increased risk.
Investor return requirements
As wholesale market interest rates fall, investor yield requirements will typically lead to an increase in
credit spreads. The chart below displays the 5 year New Zealand swap rate and 5 year credit spreads
for New Zealand BBB rated issuers. Through combining these two rates, an ‘all up’ cost of borrowing
can be derived. From examining the chart, this rate for a BBB rated entity has historically been around
5% (i.e. 500 basis points) since the GFC with credit spreads rising when swap rates fall. In recent
years, the all up cost of borrowing can be seen moving lower as it tracks the general movements made
by the swap rate. Given the downward trend in swap rates, credit spreads appear likely to increase to
make up for this movement.
0
5
10
15
20
25
30
35
40
45
50
20
30
40
50
60
70
80
90
100
110
120
May 11 Nov 11 May 12 Nov 12 May 13 Nov 13 May 14 Nov 14 May 15 Nov 15 May 16
VIX
Index
CD
SS
pre
ad
VIX Index Vs S&P/ISDA 100 CDS Index
S&P/ISDA 100 CDS Index VIX Index (RHS)
Correlation = 69%

67
The chart below displays a negative correlation of -5% between the 5 year swap rate and 5 year BBB
swap spreads. Although this does not suggest that the relationship is significant in itself, it is important
to remember that credit spreads can be affected by numerous other risk factors. As a result, the
relationship between the two may break down over time periods. Given the reduction in commodity
and equity market volatility of late this appears to have been the case.
SUMMARY – Credit Spreads and theirImplications for base ratesThe following summarises the main points around credit spreads:-
There is typically an inverse relationship between credit spreads and wholesale market swap ratesin light of investors’ all up-return expectations and requirements.
The prospect of increased regulation, and at least periods of deterioration in liquidity conditionsand/or financial market risk sentiment, would typically be associated with rising credit spreads.
CONCLUSION: Specific credit market drivers would argue for further widening incredit spreads over coming years. Whilst this would normally be associated withlower wholesale market swap rates, such may not be as clear cut this time impactedby the already very low level of wholesale market swap rates and all-up yields /bond coupons. At the very least, widening credit spreads would contain the extentof rising wholesale market rates. An outlook for wider credit spreads and lowerswap rates cannot be dismissed.
50
100
150
200
250
300
200
300
400
500
600
700
800
900
May 08 May 09 May 10 May 11 May 12 May 13 May 14 May 15 May 16
Spre
ad
toS
wap
(bps)
Basis
Poin
ts
NZ 5 Year Swap Rate, BBB Corporate Credit Spread and 'All In'Cost of Funds
5yr Swap Rate All In Cost of Funds 5yr BBB (RHS)
Correlation = (5%)

68
Summary of conclusions
Current New Zealand short-term interest rates are below the level deemed by the
RBNZ to be ‘neutral’ of 4.50%. A neutral short-term interest rate level is consistent with
the economy running neither too hot nor too cold in terms of economic activity and related
consumer price inflation pressures. Furthermore, the neutral level has already been markedly
lower for the post Global Financial Crisis (“GFC”) period relative to the pre GFC period. A
movement back up to (or above) the neutral level will require either stronger demand than
supply (i.e. emergence of a ‘positive’ output gap) and/or stronger oil/domestic petrol prices
pushing up headline inflation rates and inflation expectations. There is also the potential the
RBNZ need to revise their judgment of the neutral short-term interest rate lower from the
current 4.50% estimate.
There is a long close correlation between US and New Zealand government bond yields
because of the high level of foreign ownership of our government bonds (66.5%) and very
integrated global financial/capital markets (i.e. the impact and activity of international
investors).
New Zealand 10-Year Government Bond Yields are approximately 100 basis points (1.00%)
above those in the US (60% higher). The basis point premium is currently lower relative to
history although interestingly the differential has been higher post GFC (1.85% average spread
between New Zealand and US Government bond yields) rather than pre GFC (1.45% average).
There may be scope for short-term (90-day) interest rate differentials to narrow based on the
assessment of ‘neutral’ policy rates by the New Zealand and US central banks, however there
may be considerably less propensity for the 10 year government bond yield differential to do
so. In percentage terms, there appears only limited scope for the premium of New
Zealand 10-Year Government Bond Yields relative to those in the US to reduce.
Whilst the absolute level of 90 day bank bill rates and 10 year swap rates have reduced post
GFC, the New Zealand 10-year swap spread (10 year swap rate less 10 year government bond
yield) has not reduced by the same proportionate amount, recognising the relatively small size
of the New Zealand swap market. The increased regulatory environment, higher capital
requirement and less credit risk associated with central clearing houses are reasons why swap
spreads could narrow. A 10 year swap spread in the range of 0.25% and up to 0.75%
still appears relevant, even in an environment of the wholesale market swap
yield curve (90 day bank bill to 10 year swap rates) being between 3.00% and
5.00%.
US long-term interest rates remain well below a level indicated by (higher)
inflation pressures and other more upbeat US economic data; inflation pressures
also appear set to increase. US long-term interest rates are being held at current low levels
impacted by the massive bond holdings of the US Federal Reserve, with these only to be very
slowly allowed to unwind/reduce. Asian investor buying and holdings of US Treasury bonds is
also currently holding yields down, however these investors may become sellers, sending
yields higher.
Global economic growth and the stage of the commodity price cycle does not
auger for rapid movements higher in US interest rates. So too the US Federal Reserve
is very mindful of disrupting US and emerging market equity markets and valuations, hence
the cautious approach from Janet Yellen to increase short-term interest rates. Success of
European monetary policy Quantitative Easing policies to eventually re-stimulate investment
69
markets and consumer spending would likely support higher interest rates globally relative to
existing levels.
Global demographics of ageing populations and greater savings rates are a
significant contributing factor to driving global long-term interest rates lower.
The limited universe of assets/securities in which to invest to earn a reasonable return and
match long-term liabilities/commitments within pension funds and life insurers also
continues to place downward pressure on US long-term interest rates. If the US economy is
sufficiently strong (inflation/activity) and the US Federal Reserve tightens monetary policy by
more than is currently expected by benign interest rate market pricing, US long-term bond
yields would be expected to rise – and New Zealand follow. That action could create renewed
divergence (not further convergence) with European/Japanese rates which are presently
providing downward pressure on US / global interest rates. Global bond yields have been
converging amidst negative central bank monetary policy rates in many countries and
quantitative easing programs of purchasing government bonds driving longer-term bond
yields very low and often negative. US inflation expectations/real rates and term premium
over “neutral rates” are also at play; the ‘ratcheting lower’ of interest rates may already have
occurred.
No amount of super-loose monetary policy may be sufficient to stimulate
economic outcomes (even if measured correctly) should wider societal
undercurrents (ageing population, underemployment, technological
improvement, job obsolescence, income inequality) be at play with these
arresting monetary policy as irrelevant. The implication is no pressure for interest rates
to increase but equally no point of lower interest rates. Big question; can the European Central
Bank President Mario Draghi’s sleight of hand with non-traditional monetary policy measures
match that of Ben Bernanke now that German opposition has been overcome???
Specific credit market drivers would argue for further widening in credit spreads
over coming years. Whilst this would normally be associated with lower wholesale market
swap rates, such may not be as clear cut this time impacted by the already very low level of
wholesale market swap rates and all-up yields / bond coupons. At the very least, widening
credit spreads would contain the extent of rising wholesale market rates. An outlook for wider
credit spreads and lower swap rates cannot be dismissed.
Are we in a new Paradigm, and if so, what does it looklike?
The following section directly addresses the question of whether there has been a shift to a new
paradigm for interest rates, and if so what does it look like? We also summarise and address what the
likely future drivers of interest rates (US 10 year government bond yields and New Zealand 10 year
swap rates) will be.
The table over page shows the average New Zealand 90 day bank bill rate, US 10 year government
bond yield and New Zealand 10 year swap rate over the two distinct periods (pre and post GFC), as
well as the current market rates.

70
New Zealand 90 day
bank bill rate
US 10 Year
Government Bond
Yield
NZ 10 Year Swap
Rate
1999 – 2008 6.25% 4.70% 6.20%
2009 – 2016 2.95% 2.50% 4.40%
Current (May 2016) 2.40% 1.85% 2.95%
The background presented indicates clear evidence of a paradigm shift in interest rates either side of
the GFC. The question is whether the shift is moving further away? Domestically the shift is reflected
in the RBNZ estimate of the neutral 90 day bank bill rate of 4.50%, whereas prior to the GFC it was
6.50%. However, there remain questions over the shape and form of the new paradigm in relation to
what level for US 10 year government bond yields this implies, and also whether the neutral short term
interest rate in New Zealand is actually lower again. Furthermore, what do some of the New Zealand
specific drivers of bond spreads relative to the US (i.e. risk premium) and also New Zealand swap rates
relative to New Zealand Government bond yields (the ‘swap spread’) indicate for New Zealand 10 year
swap rates. We highlight some of the alternatives below as to the shape and form of the new paradigm
along with key drivers, probability weightings and our preferred outlook. Note that some of the
components in practice would be overlapping. Note also for ease of presentation we have given a point
estimate for each interest rate level rather than a narrow range.:-
US 10 Year
Govt Bond
Yield
Justification Probability
Weighting
1.50%
= NZ 10
year swap
rate 2.50%
Quantitative Easing Programmes in Europe and Japan remain inplace indefinitely (and are not successful). Therefore, furtherpressure lower on long-term bond yields in those sovereigns, withglobal convergence (lower) of bond yields continuing, dragging US,New Zealand and Australian long-term rates further lower.
Ongoing negative monetary policy rates in those countries also andin the likes of Sweden, Switzerland…
Strong business competition / strong supply means underlyingservices and good price inflation very low (or falling)
Perennially low inflation driven by technological advancements,job obsolescence, underemployment…
Ageing, income inequality, geopolitical unrest, risingprotectionism, the environment – rising and ongoing fear factorwithin society and consumers means spending very contained
Monetary policy irrelevance when it comes to impacting inflationand growth – interest rates are a central bank manipulation butare all but ineffective at moving the real economy
Regulatory environment with higher capital requirements forbanks, reduced dealer balance sheet capacity and bank credit riskreduction amidst central clearing houses lowers swap spreads.
Implication for New Zealand Interest Rates: US 10 yeargovernment bond yield of 1.50% + 75 basis point governmentbond spread / risk premium for New Zealand + 25 basispoint swap spread = 2.50% New Zealand 10 year swap rate.Also 2.50% New Zealand 90 day rate = ‘flat’ differencebetween short-term interest and long-term interest rates.
15%

71
2.00%
= NZ 10
year swap
rate 3.50%
Policy rates remain negative in many of the countries listed abovefor a good while longer
Spending continuing to be restrained as many continue todeleverage, and money is saved for retirement
Limited universe of investment alternatives continues to seedemand for long-dated bonds with ongoing strong investordemand for long-dated assets to match long-dated liabilities
Increased Basel III banking regulations / capital requirementsincreasing banks demand for bonds (mainly short-dated) alsowidening credit spreads (inverse to swap rates / bond yields)
Not the doomsday scenario, but mediocre to modest growth andweak inflation continues…
Implication for New Zealand Interest Rates: US 10 yeargovernment bond yield of 2.00% + 100 basis pointgovernment bond spread / risk premium for New Zealand +50 basis point swap spread = 3.50% New Zealand 10 yearswap rate. Also 3.50% New Zealand 90 day rate = ‘flat’difference between short-term interest rates and long-terminterest rates.
20%
2.50%
= NZ 10
year swap
rate 4.00%
Cyclical US economic recovery (QE worked)
Gradual unwinding of QE over time (due to the US Federal Reserveeventually not re-investing maturing bonds)
CPI inflation is not completely dead, periods of higher commodityprice movements (supply ‘shocks’, geo-political events) pushesheadline CPI higher, services inflation remains above 3.0% due toongoing rising health care costs, rents. Goods sector inflationremains muted around 0%, monetary policy still effective
Deflationary slide arrested in many other ageing demographicshowever underlying economic growth only modest
Other international bond and capital markets emerge as viableasset classes for investors, e.g. China, India…
Implication for New Zealand Interest Rates: US 10 yeargovernment bond yield of 2.50% + 100 basis pointgovernment bond spread / risk premium for New Zealand +50 basis point swap spread = 4.00% New Zealand 10 yearswap rate. Also 4.00% New Zealand 90 day rate = ‘flat’difference between short-term interest rates and long-terminterest rates.
40%
3.00%
= NZ 10
year swap
rate 4.75%
Strong and ongoing US economic recovery a locomotive for globaleconomic growth and recovering global inflation pressures
QE eventually works in Europe consumers borrow / spend
Credit spreads reduce as global risks also reduce and costsassociated with increased regulation not as bad as feared, demandfor sovereign assets eases
Chinese/Japanese investors ultimately scale back holdings of USTreasury bonds
Implication for New Zealand Interest Rates: US 10 yeargovernment bond yield of 3.00% + 125 basis pointgovernment bond spread / risk premium for New Zealand +50 basis point swap spread = 4.75% New Zealand 10 year
15%
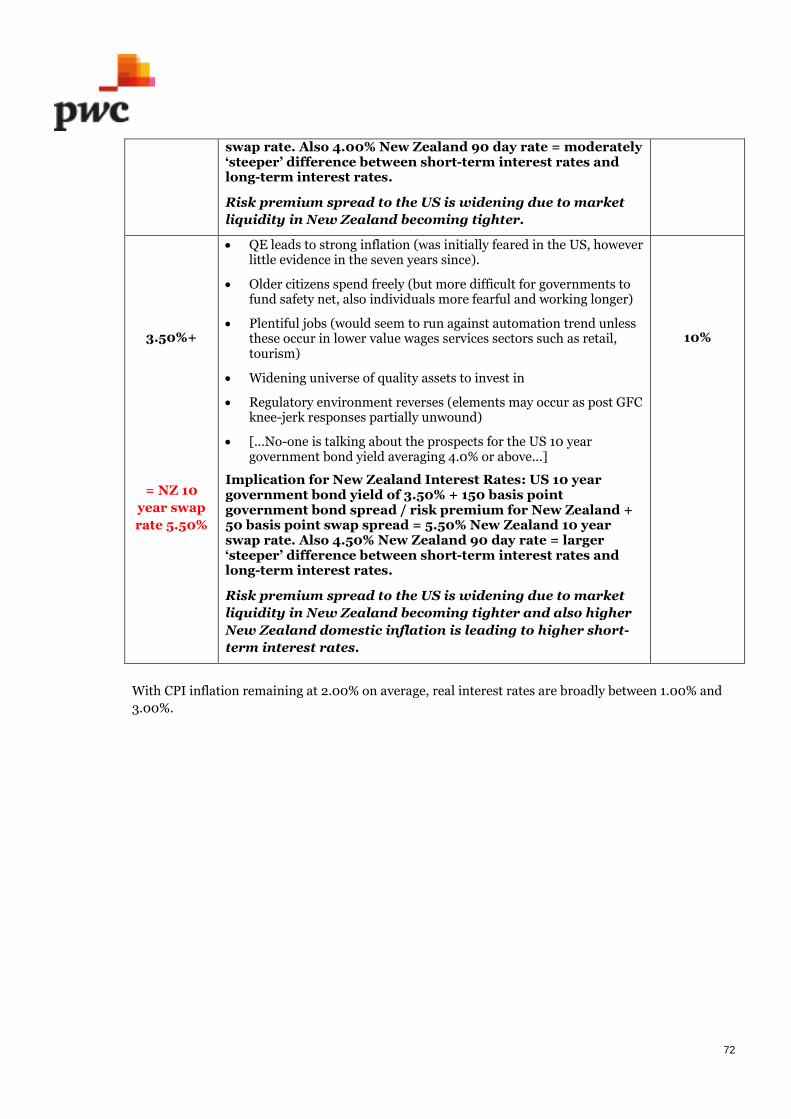
72
swap rate. Also 4.00% New Zealand 90 day rate = moderately‘steeper’ difference between short-term interest rates andlong-term interest rates.
Risk premium spread to the US is widening due to market
liquidity in New Zealand becoming tighter.
3.50%+
= NZ 10
year swap
rate 5.50%
QE leads to strong inflation (was initially feared in the US, howeverlittle evidence in the seven years since).
Older citizens spend freely (but more difficult for governments tofund safety net, also individuals more fearful and working longer)
Plentiful jobs (would seem to run against automation trend unlessthese occur in lower value wages services sectors such as retail,tourism)
Widening universe of quality assets to invest in
Regulatory environment reverses (elements may occur as post GFCknee-jerk responses partially unwound)
[...No-one is talking about the prospects for the US 10 yeargovernment bond yield averaging 4.0% or above...]
Implication for New Zealand Interest Rates: US 10 yeargovernment bond yield of 3.50% + 150 basis pointgovernment bond spread / risk premium for New Zealand +50 basis point swap spread = 5.50% New Zealand 10 yearswap rate. Also 4.50% New Zealand 90 day rate = larger‘steeper’ difference between short-term interest rates andlong-term interest rates.
Risk premium spread to the US is widening due to market
liquidity in New Zealand becoming tighter and also higher
New Zealand domestic inflation is leading to higher short-
term interest rates.
10%
With CPI inflation remaining at 2.00% on average, real interest rates are broadly between 1.00% and
3.00%.

73
Disclaimer
This publication is subject to the following restrictions.
This publication should not be reproduced or supplied to any other party without first obtaining our
(PwC New Zealand) written consent. We accept no responsibility for any reliance that may be placed
on its content should it be used for any purpose other than that set out below and in any event we will
accept no liability to any party other than you in respect of its contents.
The purpose of the publication is to provide our current financial market views and opinions. The
statements and opinions contained in this report are based on data obtained from the financial
markets and are so contained in good faith and in the belief that such statements, opinions and data
are not false or misleading. In preparing this publication, we have relied upon information which we
believe to be reliable and accurate.
We reserve the right (but will be under no obligation) to review our assessment and if we consider it
necessary, to revise our opinion in the light of any information existing at the date of this publication
which becomes known to us after that date.

Get in touch
Stuart Henderson
Partner
T: +64 9 425 0158
M:+64 21 343 423
Roger Kerr
Partner
T: +64 9 355 8181
M:+64 21 935 288
Brett Johanson
Partner
T: +64 4 462 7234
M:+64 21 771 574
Chris Hedley
Director
T: +64 9 355 8183
M:+64 21 479 680
James McHardy
Director
T: +64 9 355 8342
M:+64 21 263 4282
Jason Bligh
Associate Director
T: +64 4 462 7265
M:+64 21 386 863
Alex Wondergem
Associate Director
T: +64 9 355 8252
M: +64 21 041 2127
Mahesh Chhagan
Treasury Advisor
T: +64 9 355 8301
Dylan Queen
Treasury Analyst
T: + 64 4 462 7209
James Butler
Treasury Analyst
T: +64 9 355 8265
Tom North
Treasury Analyst
T: +64 9 355 8497
pwc.co.nz /corporate-treasury-advisory-services/


![[CHECK JAN: new paradigm]](https://img.dokumen.tips/doc/110x75/623e328588cf693c0a3dd993/check-jan-new-paradigm.jpg)