Embed Size (px)
Citation preview

YOHANNES HAGOS SUBAGADIS
A NEW INTEGRATED MODELING APPROACH
TO SUPPORT MANAGEMENT DECISIONS OF
WATER RESOURCES SYSTEMS UNDER
MULTIPLE UNCERTAINTIES
Dresden, September 2015
Faculty of Environmental Sciences
A New Integrated Modeling Approach to
Support Management Decisions of Water
Resources Systems under Multiple
Uncertainties
DISSERTATION
In partial fulfillment of the requirements for the degree of Doktor der Ingenieurwissenschaften (Dr.-Ing)
Submitted to the Faculty of Environmental Sciences
Technische Universität Dresden February 12th, 2015
Examination location and date: Dresden, September 15th, 2015
by
Yohannes Hagos Subagadis (MSc.) born in Irob, Ethiopia
Reviewers:
Prof. Dr. Niels Schütze, TU Dresden Prof. Dr. Jochen Schanze, TU Dresden
Dr. Semu Moges, Addis Ababa University


“You cannot have people making decisions about the future of the world who are scientifically illiterate. That is a recipe for disaster.”
(Dr. Neil deGrasse Tyson)
“Ever-newer waters flow on those who step into the same rivers."
( Heraclitus of Ephesus, quoted in Plato's Cratylus 401d)

Preface
This thesis essentially comprises three peer-reviewed research papers on integrated modeling to support management decisions of water resources management under multiple uncertainties. These papers were, or are going to be, published.1 For this reason, a vast portion of the text and a number of figures and tables were adopted from the above mentioned publications some times without any or with only minor modifications. The aim of this thesis is to present the concepts raised in the three papers in a concise and consistent manner. I would like to express my sincere gratitude to my supervisors, Prof. Dr. Niels Schütze and em. Prof. Dr.-ing Gerd H. Schmitz, for the opportunity to conduct this research and for all their support, guidance and compassion over the last three-and-a-half years it took to complete this study. It has been my privilege to work closely with Dr. Jens Grundmann for co-authoring the publications and Sebastian Kloß for going through the manuscript. I am grateful to the Graduate Academy of TU Dresden and the KAAD for their financial support towards my PhD research. My sincere gratitude is extended to all members of the Institute of Hydrology and Meteorology, TU Dresden, who helped me one way or the other, in carrying out my research through remarkable cooperation. I am indebted to all my friends and family for their social backing and encouragement. A most fond thank you goes to my parents Hagos Subagadis and Hagosa Abreha who supported me in all my pursuits, in albeit, unconventional circumstances.
1 Subagadis et al. (2014a), Subagadis et al. (2014b), and Subagadis et al. (in review).

Abstract
The planning and implementation of effective water resources management strategies need an assessment of multiple (physical, environmental, and socio-economic) issues, and often requires new research in which knowledge of diverse disciplines are combined in a unified methodological and operational framework. Such integrative research to link different knowledge domains faces several practical challenges. The complexities are further compounded by multiple actors frequently with conflicting interests and multiple uncertainties about the consequences of potential management decisions. This thesis aims to overcome some of these challenges, and to demonstrate how new modeling approaches can provide successful integrative water resources research. It focuses on the development of new integrated modeling approaches which allow integration of not only physical processes but also socio-economic and environmental issues and uncertainties inherent in water resources systems. To achieve this goal, two new approaches are developed in this thesis. At first, a Bayesian network (BN)-based decision support tool is developed to conceptualize hydrological and socio-economic interaction for supporting management decisions of coupled groundwater-agricultural systems. The method demonstrates the value of combining different commonly used integrated modeling approaches. Coupled component models are applied to simulate the nonlinearity and feedbacks of strongly interacting groundwater-agricultural hydrosystems. Afterwards, a BN is used to integrate the coupled component model results with empirical knowledge and stakeholder inputs. In the second part of this thesis, a fuzzy-stochastic multiple criteria decision analysis tool is developed to systematically quantify both probabilistic and fuzzy uncertainties associated with complex hydrosystems management. It integrates physical process-based models, fuzzy logic, expert involvement and stochastic simulation within a general framework. Subsequently, the proposed new approaches are applied to a water-scarce coastal arid region water management problem in northern Oman, where saltwater intrusion into a coastal aquifer due to excessive groundwater extraction for irrigated agriculture has affected the aquifer sustainability, endangering associated socio-economic conditions as well as traditional social structures. The results show the effectiveness of the proposed methods. The first method can aid in the impact assessment of alternative management interventions on sustainability of aquifer systems while accounting for economic (agriculture) and societal interests (employment in agricultural sector) in the study area. Results from the second method have provided key decision alternatives which can serve as a platform for negotiation and further exploration. In addition, this approach suits to systematically quantify both probabilistic and fuzzy uncertainties associated with the decision problem. The new approaches can be applied to address the complexities and uncertainties inherent in water resource systems to support management decisions, while serving as a platform for stakeholder participation.

vii
Contents
Preface v
Abstract vi
List of Figures x
List of Tables xiii
List of Symbols and Acronyms xiv
1 Introduction 17
1.1 Motivation ............................................................................................................... 17
1.2 Understanding Human-Water System Interaction .................................................. 19
1.3 Sphere of Decision-Making about Water Resources Systems under Uncertainiy .. 21
1.3.1 Decision-Making Process ................................................................................. 22
1.3.2 Understanding Uncertainty Inherent in Water Resources Decision-Making .... 25
1.4 Research Problem Statement ................................................................................. 26
1.5 Research Aim and Objectives ................................................................................. 28
1.6 Novelty of the Research .......................................................................................... 29
2 Literature Review 31
2.1 Common Modeling Approaches to Support Management
Decisions of Water Resources Systems Uncertainty ............................................. 31
2.1.1 The Integrated Water Resources Management Concept ................................ 31
2.1.2 Issues to be Considered for Model Choice ...................................................... 33
2.2 Common Approaches to Modeling Complex Water Resources Systems .............. 34
2.2.1 Coupled Component Models ........................................................................... 34
2.2.2 Bayesian Networks .......................................................................................... 35
2.2.3 Multiple Criteria Decision Analysis ................................................................... 36
2.2.4 System Dynamics ............................................................................................ 37
2.2.5 Agent-Based Models ........................................................................................ 37
2.2.6 Knowledge-Based Models ............................................................................... 38
2.3 Summary ................................................................................................................. 38

Contents
viii
3 Proposed New Integrated Modeling Approaches 40
3.1 Bayesian Network-Based Decision Support Tool .................................................... 42
3.2 Fuzzy-Stochastic Multiple Criteria Decision Analysis Tool ....................................... 45
4 Principles for Modeling the New Integrated Approaches 48
4.1 Principles of Modeling Bayesian Network-Based Decsion Support Tool ................ 48
4.1.1 Bayesian Networks .......................................................................................... 48
4.1.2 Multi-Objective Optimization ............................................................................ 51
4.1.3 Pareto-front Clustering ..................................................................................... 52
4.1.4 Uncertainty and Performance Evaluation of BN ............................................... 55
4.1.5 Sensitivity Analysis ........................................................................................... 56
4.1.6 Influence Analysis ............................................................................................ 57
4.1.7 Posterior Probability Certainty Assessment ..................................................... 58
4.2 Principles of Modeling Fuzzy-Stochastic Multiple Criteria Decision Analysis Tool .. 59
4.2.1 Fuzzy vs. Stochastic Manifestation of Uncertainties in
Water Resources Management ....................................................................... 59
4.2.2 Basics of Fuzzy Sets and its Operation ............................................................ 61
4.2.3 Ranking Management alternatives ................................................................... 67
4.2.4 Sensitivity Analysis of Ranking of Alternatives ................................................ 68
5 Solution Procedures for BN-Based Decision Support Tool 70
5.1 Construction of BN-Based Decision Support Tool ................................................... 70
5.2 Data and Knowledge Acquisitions ........................................................................... 72
5.2.1 Simulation-Optimization of Integrated Water Management Model ................. 73
5.2.2 Empirical Knowledge and Expert Opinion ........................................................ 80
5.3 Uncertainty and Performance Evaluation of BN-Based Decision Support Tool ....... 82
6 Solution Procedures for Fuzzy-Stochastic Multiple Criteria
Decision Analysis Tool 83
6.1 Fuzzy Approach ....................................................................................................... 84
6.2 Stochastic Approach ................................................................................................ 84
6.3 Fuzzy-Stochastic Approach ...................................................................................... 85

Contents
ix
6.4 Sensitivity Analysis .................................................................................................. 90
7 Application: Integrated Modeling Approach for Supporting Management
Decisions of Coupled Groundwater-Agricultural Systems (Oman) 92
7.1 Study Site and Decision Problem ............................................................................ 92
7.2 BN-Based Decision Support Tool Application .......................................................... 95
7.2.1 Setup of the BN Application ............................................................................. 96
7.2.2 Setup of the Simulation-Optimization Water Management Model for Coupled
Groundwater-Agriculture Hydrosystems ........................................................................ 97
7.2.3 Impact Analysis of Alternative Management Policies ...................................... 98
7.2.4 Results and Discussion .................................................................................... 99
7.2.5 Summary of the Discussion ........................................................................... 108
7.3 Fuzzy-Stochastic Multiple Criteria Decision Analysis Tool ..................................... 110
7.3.1 Criterion and Alternative Identification ........................................................... 110
7.3.2 Results and Discussion .................................................................................. 112
7.3.3 Summary of the Discussion ........................................................................... 123
8 Summary and Conclusion 126
References 130
Appendix 144
A.1 Summary of different measures ............................................................................... 145
A. 2 Exemplary sensitivity analysis conducted on the BN model .................................... 146
A. 3 Superimposed cumulative distribution functions generated using OWA operator .. 147
A. 4 Probability of ranking change .................................................................................... 148
Selected Publications of the Author 149
B.1 An integrated approach to conceptualise hydrological and
socio-economic interaction. ....................................................................................... 150
B. 2 Multi-criteria multi-stakeholder decision analysis using
a fuzzy-stochastic approach. ..................................................................................... 169

x
List of Figures
1 Changing paradigms for water management (UN Water, 2012) ................................... 18
2 Schematic of human adjustment to saltwater intrusion into an agricultural coastal plain:
(left) irrigated agricultural practices in a coastal plain before saltwater intrusion, and
(right) the agricultural practices being pushed upstream due to increasing saltwater
intrusion and subsequent salinity caused by excessive groundwater extraction for
irrigated agriculture. The diagrams also show different processes involved in the
interaction. ..................................................................................................................... 20
3 Conceptualized loop diagram showing how economy, hydrology, technology, politics
and societal processes are all interlinked and gradually (dashed arrows) co-evolve, while
being (thick arrows) alerted by saltwater intrusion into an agricultural coastal plain. .... 21
4 Schematic diagram showing decision-making process cycle, with its main steps and the
area of influence of participatory planning, simulation modeling and decision analysis
(modified after Giupponi and Sgobbi, 2013). ................................................................. 23
5 Modeling components considered in the integrated modeling approaches to
conceptualize hydrological and socio-economic interaction .......................................... 41
6 An example of a simple Bayesian network formed by three variables with associated
conditional probability tables. ......................................................................................... 50
7 Illustration showing a Pareto-optimal solution, where smaller y-axis (SI) and
larger x-axis (profit) values are preferred to larger y-axis and smaller x-axis values,
respectively. .................................................................................................................. 53
8 Comparison of stochastic (probabilistic) and fuzzy uncertainties (a) probability
density function and (b) fuzzy membership distribution function. ................................ 60
9 Triangular and trapezoidal membership functions ........................................................ 63
10 Linguistic variable “rainfall intensity” ........................................................................... 64
11 General solution procedures for developing Bayesian network (BN)-based
decision support tool .................................................................................................... 71
12 Integrated modeling framework used in the development of BN-based decision tool 72
13 Procedure for deriving surrogate model for describing the aquifer behavior
(ANN-OGS) (Grundmann et al., 2012) ........................................................................... 74
14 Procedures for the 2D-crop-water-production function (2D-CWPF)
(Schütze and Schmitz, 2010) ........................................................................................ 76

List of Figures
xi
15 Simulation-optimization integrated water management model for coupled
groundwater-agriculture systems consisting of water resources module,
agricultural module and optimization module (for details see also
Grundmann et al., 2013) ............................................................................................... 78
16 Flow chart of the proposed fuzzy-stochastic multiple criteria decision analysis ........... 87
17 Membership spread of linguistic scales (a) for evaluation of subjective criteria with
respect to alternatives (b) for evaluation of optimism degree of DMs. ........................ 90
18 Study catchment of Al-Batinah region in the Northern Oman ...................................... 93
19 (a) Pareto solutions for the objective functions ‘Sustainability index’ and
‘profit [$/year]’, points in blue representing Pareto-optimal solutions,
(b) Cluster (A1, A2 and A3) of the Pareto set. ................................................................ 99
20 Structure of the Bayesian network (BN)-based decision support tool
for supporting management decisions of a coupled groundwater-agriculture
hydrosystem at farm scale. ......................................................................................... 100
21 Prior probability distributions of different management scenarios (A1, A2 and A3) for
selected variables of the task-specific BN like (a) groundwater extraction rates
(Mm3/year), (b) hydrosystem sustainability (SI), and (c) groundwater quality (dS/m)
(d) net profit ($/ha year), (e) artificial recharge (percentage of additional annual aquifer
recharge from artificial recharge scheme) and (f) water quotas (percentage of water
use reduction through implementing water quota system). ........................................ 102
22 The posterior probability certainty index as function of the posterior probability
of (a) hydrosystem sustainability index is in state of medium or unsafe,
(b) maximum net profit, and (c) medium to high direct agricultural employment,
in each of the three alternative scenarios (A1, A2 and A3). ........................................ 106
23 Impact analysis of alternative management policies on different
management scenarios (A1, A2 and A3) evaluated by the probabilities of:
(a) hydrosystem sustainability index becoming medium or unsafe,
(b) agricultural profit to obtain maximum net profit, and (c) medium to high direct
agricultural employment. ............................................................................................ 108
24 (a) Pareto solutions for the objective functions ‘sustainability index (SI)’ and ‘profit
($/year)’ points in blue representing Pareto-optimal solution (b) cluster (A1,
A2 and A3) of Pareto set (c) evaluations of criteria with respect to the
management alternatives. .......................................................................................... 113
25 The decision matrix values – Monte Carlo simulated histograms and fitted
probability distributions for alternative versus criteria matrix. ..................................... 115

List of Figures
xii
26 Histogram of the optimism degree (θ) and the fitted probability distribution ........... 116
27 Superimposed cumulative distribution functions generated using OWA
operator for the optimism degree of 0.5 (Fig. 27a) and 0.2 (Fig. 27b),
for the three alternatives. ......................................................................................... 117
28 Morris results on the input criteria and optimism degree ......................................... 119
29 Sensitivity analysis for variation in optimism degree on total performance
value of the alternatives ............................................................................................. 120
30 Sensitivity of ranking under different optimism degrees ........................................... 121
31 Cumulative distributions of total performance values under risk
taking decision-making process ................................................................................. 121
32 Probability of ranking change, for the risk taking decision-making process,
indicated by projection ............................................................................................... 122
xiii
List of Tables
1 Summary of common approaches to modeling complex water and natural
resources systems ........................................................................................................ 39
2 Participatory process and expert knowledge acquisition in the development of BN-
based decision support tool ........................................................................................... 81
3 Variables used in the Bayesian Network (BN) model development
and their definitions ....................................................................................................... 97
4 Variables used in the BN model development with their states and value ranges ...... 101
5 Sensitivity analysis conducted on the BN model, considering sustainability of
hydrosystem and net profit as target node under three different alternative
scenarios (A1, A2, and A3). .......................................................................................... 104
6 Alternative management policy and corresponding variable states (For the
values of the states refer to Table 4) ........................................................................... 107
7 Summary of criteria included in the decision problem analysis ................................... 111
8 Expert assessment for evaluation of alternatives with respect to
subjective criteria using linguistic variables ................................................................. 114
9 Evaluation of optimism degree (θ) using linguistic variables ....................................... 114
10 Probability of ranking of three alternatives based on simulations with ± 10
uncertainties in total performance values for optimism degree of 0.5 based
on ranking correlation ................................................................................................... 117
11 Probability of ranking of three alternatives based on simulations with ± 10
uncertainties in total performance values for optimism degree of 0.2 based
on ranking correlation .................................................................................................. 118
12 Sensitivity results of input criteria and optimism degree according to Morris method 119
13 Mean difference of total performance values (upper right), probability of
ranking change (lower left) and risk of ranking change between alternatives (in
parenthesis) – for the risk taking decision-making process ......................................... 123

xiv
List of Symbols and Acronyms
Symbols
A A collection of elements (universe) [-] Aj Cropping pattern [-] Ai Alternatives [-] B A variable in a BN [-] Ci Cluster center [-] Cj Criteria [-] CP Variable costs [$] CIj Fixed costs [$] D Distance from the sea to an agricultural field [m] E Economic profit from agriculture [$/ha year] F Total performance measure [-] G A variable [-] H Variation of water table level [m] I Entropy reduction [-] Id Importance of DMs [-] L Acreage [ha] Lj Cultivated acreage [ha] M Awareness on risk of aquifer overexploitation [-] Pj Current irrigation costs [$] PPCI Posterior Probability certainty index [-] Q Groundwater abstraction rates [Mm3/year] Qj Water demand [Mm3/year] R Aquifer recharges [Mm3/year] S Saltwater intrusion/ Salinity/ Groundwater quality [dS/m] SI Sustainability index [-] T Technology countermeasures [-] Ui Potential cluster center [-] VR Variance redaction [-] X A collection of elements (universe) [-] Yj Yields [$/ha year] Fuzzy membership degree [-] a1 a2 set of evaluation of a criterion [-] aij1 The minimum triangle fuzzy number value [-] aij2 The most likely triangle fuzzy number value [-] aij3 The maximum triangle fuzzy number value [-] b States [-] bj Bounds on decision vector [-] F Vector function in solution space [-] f Vector of decision variable [-] of1 of2 Objective functions [-] g States [-] gi Constraints [-] h Groundwater level [L] h1 h2 States [-] Optimism degree [-]

List of Symbols and Acronyms
xv
21, Fuzzy numbers [-] i Counter [-] j Counter [-] k Counter [-] MDij Mean differences [-] n Input parameter in OWA [-] Pi Probability values [-] Prij Probability of ranking change [-] ra Neighborhood radius [m] r1 r2 States [-] Rij Risk of obtaining an unacceptable ranking [-] s1 s2 States [-] µ Fuzzy membership function [-] µA Subset in A [-] µi Arithmetic mean [-]
2
i Arithmetic variances [-]
Correlation coefficient Predetermined integer representing variations of inputs t time [year] ti Abstraction time [year] x1 x2 Elements in universe A [-] w1 w2 Weighting vectors [-] X Elementary effect for the ith input [-] xk Observation points [-] x1ij Performance rating of alternative Ai [-] yi Vector in feature space [-] || || Euclidian distance [m] Acronyms
AHP Analytical Hierarchy Process ANN Artificial Neural Networks APSIM Agricultural Production Systems Simulator BN Bayesian Networks CDF Cumulative Distribution Function CPT Conditional Probability Table CWPF Crop Water Production Function DM Decision Maker DSS Decision Support System EE Elementary Effect EU European Union FAO Food and Agricultural Organization GPW Global Water Partnership IAHS International Association of Hydrological Sciences ICSU International Council of Scientific Unions IWRM Integrated Water Resources Management MADM Multi-Attribute Decision-Making MATLAB Matrix Laboratory; a programming language MCDA Multiple Criteria Decision Analysis MCs Monte Carlo simulation

List of Symbols and Acronyms
xvi
MODS Multi-Criteria Decision Analysis MRMEWR Ministry of Regional Municipalities, Environment and Water Resources OGS OpenGeoSys OWA Ordered Weighted Averaging PDF Probability Density Function PROMETHEE Preference Ranking Organization Method for Enrichment of Environment RIM Regular Increasing Monotonic SC Subtractive clustering SVAT Soil Vegetation Atmosphere Transfer SCWPF Stochastic Crop Water Production Function TOPSIS Technique for Order of Performance by Similarity to Ideal Solution UN United Nations UNEP United Nations Environmental program

17
1 Introduction
1.1 Motivation
Water is perhaps the world’s most critical resource facing difficult sustainability challenges.
Relation between human beings and water is intrinsic, adequate water supplies deriving –
the location of communities, the extent of agriculture, and the shape of industry and
transportation. Given the fact that freshwater resources are unevenly distributed and only
approximately 0.01% of all water on Earth is freshwater available for use, there is increasing
competition for water. In addition, wide varieties of human activities have changed flow,
quality and storage of water on the Earth. As a consequence, there are increasing
indications – from decreasing groundwater and lake levels to disappearing wetlands – that
manifest that the current use of water system is not sustainable (UN Water, 2012).
Population pressures and increasing urbanization along with uncertainties posed by climate
change and the rapidly changing human system can all undermine the sustainable use of
water resources. For instance, it is estimated that two out of every three people would live
in water-stressed areas by the year 2025 (UNEP/GRID-Arendal, 2008).
Understanding and managing water resources with respect to availability and quality are
therefore fundamental to human well-being. The fact that water resources systems are not
there only to fulfill human needs but also to sustain ecosystems (environment) is the
concept being recognized recently (Falkenmark and Rockström, 2004). History shows that
pressure on water resources decreased environmental resilience as it was assumed that
water use for humans was more important than for the environment (UN Water, 2012). The
result is an incomplete understanding of human-water interactions and feedbacks, thereby,
balancing economic, environmental and social goals for water resources management have
become complex.
A new paradigm is required and already emerging, which shifts the environmental and social
issues, from unfortunate costs of development to an integral part of holistic and participatory
decision-making process (Fig. 1). Likewise, there are different global initiatives dedicated to
reach an improved understanding on change in hydrology and human system: (1) Panta Rhei,
the new scientific initiative of the International Association of Hydrological Sciences (IAHS)
for the decade 2013-2022 (Montanari et al., 2013); and (2)

1 Introduction
18
Future Earth by the International Council of Scientific Unions (ICSU)
(http://www.icsu.org/futur-earth)2. In order to properly understand the evolving human-water
relations and to be able to address real-world systems across gradients of climate,
environmental degradation, socio-economic status and human management, strengthened
support from scientifically robust methods and tools are required.
The aim of this thesis is therefore to contribute on the aforementioned regard through
developing methodological approaches that can support management decisions of complex
hydrosystems under multiple uncertainties. Especially in arid environment where the
agricultural sector uses more than 90% (UN Water, 2012) of the available water resources
with repercussion on local society and economy, there is an urgent need to improve the
overall water use efficiency with a strong focus on sustainability. This has implications from
the farm level to the operation of reservoirs, groundwater extraction etc. and cuts across
technical, societal, economic and organizational issues.
Figure 1: Changing paradigms for water management (UN Water, 2012)
2 Future Earth is an international research initiative by International Council of Scientific Unions (ICSU) for sustainability, linking environmental change and development challenges to satisfy human needs for food, water, energy, etc. Future Earth has on-line presence at: http://www.icsu.org/futur-earth/

1 Introduction
19
1.2 Understanding Human-Water System Interaction
Quality of human well-being is dependent, in part, upon the health and sustainability of
water resources (UN Water, 2012). As human demands like food, energy and living space
continue to grow, so do the demands on the available water resources. The impacts on the
water resources from cumulative human activities also increase. During this process, water
resources conditions can pose important constraint on human activities and in return, human
activities can impact water resources sustainability significantly as well. Improper or
excessive utilization of water resources and subsequent water related problems (e.g,
salinization, flooding, pollution, water scarcity etc.) have huge potentials to hamper the
sustainable development of human societies.
Sustainable water resources management has become an issue of major concern over the
past decade. However, conventional approaches being used to study water resources
management lack to reflect the mutual relationship between water resources and societies
(Montanari et al., 2013). Given the interwoven nature of water resources and activities of
human beings, modeling approaches to understand and mange human-water system should
depart from sequential practice, and establish dynamic links that allow two way interaction
and feedbacks. Recently, it is becoming increasingly clear that pressing problems in this field
have to be tackled from an integrated perspective taking into account different components
that interact with water resources systems such as: environmental, technological, economic,
institutional and social issues. Inadequate considerations of these processes eventually lead
to social dilemma (common-pool resources dilemma) – pursue individual profit and
immediate satisfaction rather than behave in larger societal best, long-term interests – with
regard to water resources management strategies.
As an example, a typical human-water system interaction and human adjustment to coastal
saltwater intrusion (Grundmann et al., 2012), a coupled human-water system (Fig. 2) of a
coastal hydrosystem affected by saltwater intrusion due to excessive groundwater
extraction for irrigated agriculture is a typical example of disturbances caused by societal
practices with free access and unrestricted use of a limited groundwater reserve through
massive uncontrolled groundwater abstraction after the 1970’s in Al-Batinah region, Oman.
The abstraction exceeded the rate of available groundwater recharge leading to an alarming
decline of groundwater levels accompanied by saltwater intrusion into the coastal aquifer.
Consequently, the water for irrigation became saline and now threatens the economic basis

1 Introduction
20
of farmers, resulting in lots of abandoned farms along the coastline and repercussions on
local society and economy.
Figure 2: Schematic of human adjustment to saltwater intrusion into an agricultural coastal
plain: (left) irrigated agricultural practices in a coastal plain before saltwater intrusion, and
(right) the agricultural practices being pushed inland due to increasing saltwater intrusion and
subsequent salinity caused by excessive groundwater extraction for irrigated agriculture. The
diagrams also show different processes involved in the interaction.
Hence, the following five different processes have been considered to conceptualize the
interacting physical process and societal system shown in the illustrations (Fig. 2 and 3):
hydrology (S) - extent of saltwater intrusion into the aquifer, society (M) - societal awareness,
politics (D) - distance from sea where irrigated agriculture could be practiced, economy (E) -
agricultural profit, and technology (T) - different counter measures to protect saltwater
intrusion into the aquifer system. The diagram in the left shows the interactions before the
overexploitation of a coastal aquifer system, while the diagram on the right shows the
agricultural practices (societal activities such as farming) is being pushed inland due to
increasing saltwater intrusion and subsequent salinity caused by excessive groundwater
extraction for irrigated agriculture. Correspondingly, Fig. 3 shows the interaction and
feedback mechanisms of hydrological, social, political, economical, and technological
processes. These components are all interlinked and steadily (dashed arrows) co-evolve over
time when the human-water system is subjected to (thick arrows) natural and societal
disturbances (Fig. 3). These conceptualizations are simplified representations as an effort to

1 Introduction
21
demonstrate how human-water interactions can be interlinked with different processes and
gradually co-evolves.
Figure 3: Conceptualized loop diagram showing how economy, hydrology, technology,
politics, and societal processes are all interlinked and gradually (dashed arrows) co-evolve,
while being (thick arrows) alerted by saltwater intrusion into an agricultural coastal plain.
1.3 Sphere of Decision-Making about Water Resources Systems under
Uncertainiy
In many real-world decision situations like management of natural resources, decision
makers are often faced with competing values and contradictory beliefs, increasingly
dominating decision-making discourse and making it challenging for decision makers to give
unambiguous responses. Water resource management decisions can be complex because
of inherent interactions and associated feedbacks among hydrological, economical, societal
and environmental issues (Montanari et al., 2013). It has been noted that decisions regarding
water resources management are further compounded by multiple actors, frequently with
conflicting interests and multiple uncertainties about the consequences of potential
management decisions (Simonovic and Fahmy, 1999). Consequently, water resources

1 Introduction
22
management decisions often involve large numbers of alternatives and criteria, which are
quantitative and/or qualitative, and tangible and/or intangible (Zagonari and Rossi, 2013).
Given the degree of complexity, it is difficult to expect human decision makers to solve the
problem with mere intuition alone, as they are simply ill-equipped for such complex
decisions. Therefore, a formal approach to water resources decision-making is required.
Integrated approaches that can accommodate knowledge of diverse disciplines, multiple
issues, values, consideration of associated uncertainties, and stakeholders‘ engagement are
required.
1.3.1 Decision-Making Process
A decision may be defined as the choice of one among a number of alternatives, and
decision-making refers to the whole process of making the choice. Decision-making
processes relate to all forms of information generation and presentation that assist a
decision maker to make trade-offs and the subsequent identification of an appropriate
course of action (Hajkowicz and Collins, 2007). In this sense, decision-making processes are
built on those techniques that deal with the concepts of rationality, optimality, and efficiency.
These concepts underline the basic impressions of decision theory and are a basis for
decision-making as an attempt to improve water resources decision-making (Hyde, 2006).
However, what makes “good” decisions are fairly explicit. For example, a decision that
satisfies most majorities of people with functional outcomes can be regarded as a good
decision, especially when the decision is made through a participatory process (Dietz, 2003).
Discussions of full perspective of different aspects of water resources decision-making is
beyond the scope of this thesis. Instead, this thesis presents, in this section, a general
overview of water resources decision-making processes cycle, highlighting use of model-
based decision support tools to generate as well as present optimal alternatives for complex
water resources management (see Fig. 4).

1 Introduction
23
Figure 4: Schematic diagram showing decision-making process cycle, with its main steps
and the area of influence of participatory planning, simulation modeling and decision analysis
(modified after Giupponi and Sgobbi, 2013).
The main stages of water resources decision-making processes, as defined for the purpose
of this thesis, are shown in Fig. 4. Firstly, water resources problems need to be explored,
framed and brought to decision makers. This can be initiated by different triggering factors
like political and/or normative factors. Problem identification and framing can be done by
recognizing gaps, needs, potentials, and constraints in the intended water resources
problem. Once the particular water resources problem is on the agenda, movement of
actors involvement and participatory processes are the second step. The actors consist of all
the different individuals and groups (policy makers, planners, administrators, and other

1 Introduction
24
stakeholders) associated with the planning and decision-making process. The importance
and advantage of public involvement for the successful decision-making process in water
resources management is well documented (e.g., Soncini-Sessa et al., 2007; Carmona et al.,
2013). Taking different viewpoints of actors into account, the selection of an appropriate
problem analysis has to be done. Depending on the type of problem, the problem analysis
consisting of systematic processes to explore or unpack a complex issue and organize
necessary information is identified at this stage. This helps to prepare an appropriate
knowledge base for the decision-making process. Using data and information collected in
the previous step, simulation-optimization models are employed for evaluating and
quantifying so that to help determining which subset of potential management alternative
and/or scenarios can be considered optimal. There are different types of tools which serve
the purpose, though they vary in complexity (and hence data requirements).
For instance, models can be used for prediction/forecasting to aid managers with assessing
the utility of a proposed management action or to obtain a better understanding of a
complex system. Similarly, in the course of simulation-optimization modeling and scenario
analysis, usually there are a number of computing objectives and too many solutions,
making it difficult to prioritize among the sets of modeling outcomes. In these situations, it
is customary to do further analysis like post-optimality analysis and multiple criteria decision
analysis (MCDA) techniques so that to come to identify a set of understandable alternatives.
At this point, it is expected the decision maker to identify a particular optimal management
alternative. Finally, the last stage of decision-making process is action taking and monitoring,
which includes a careful evaluation of the implemented alternatives. At this stage,
implementation plans and investment options to take action can be further refined if
necessary. The linkage shown in Fig. 4 is not restricted, numerous solutions can be
proposed for the integration of different course of actions thus to provide operational
solutions for the decision-making process in its entirety. With such an approach, water
resources decision-making processes cycle can be framed within methodological framework
that considers participatory planning, simulation-optimization modeling and decision analysis,
as it is shown in (Fig. 4).

1 Introduction
25
1.3.2 Understanding Uncertainty Inherent in Water Resources
Decision-Making
Different decision support tools are being developed and utilized extensively to aid in water
resources management decision-making processes. However, when confronted with
uncertainty, it is still challenging to help users understand how uncertainty can be managed
and how it can be reflected in decision-making processes. Water resources decision-making
is subject to many uncertainties – ranging from variability in physical characteristics to
ambiguity associated with lack of knowledge (Simonovic, 2009). Uncertainty can subsist in
all stages of decision-making processes, hence, it is important to understand types and
sources of uncertainties.
From broad perspective, Vucetic and Simonovic (2011) have classified uncertainty in water
resources management into two basic forms: (1) uncertainty caused by fundamental lack of
knowledge and (2) uncertainty caused by inherent hydrological variability. Uncertainty
pertaining to fluctuations (temporal and spatial variability) inherent in hydrological variables is
described as stochastic uncertainty. The other form of uncertainty caused due to a lack of
knowledge which would be known in principle but do not in practice, is described as
ambiguity (fuzzy) uncertainty, also known as epistemic uncertainty in some literatures.
Fuzzy uncertainty refers to the limitations of our knowledge, implying that it may be reduced
by acquiring improved understanding. The main sources of uncertainties in water resources
decision-making is attributed to: model uncertainty (parametric and structural), decision
uncertainty and linguistic uncertainty. More particular details about fuzzy as well as
stochastic uncertainty and their incorporation in water resources decision-making process is
presented in chapter 5. General descriptions about classification and incorporation of
uncertainty in decision-making can also be found in (Ascough et al., 2008).
If models and decision support tools being used to aid in water resources decision-making
processes to provide effective decision support, the uncertainties associated need to be
explicitly considered. However, as models and decision support tools become more
complex to better represent human-water interaction (integrated hydrological, societal,
economical and environmental systems), incorporating and communicating uncertainty in
the processes also become more difficult. Some of the challenges that need to be tackled
include:

1 Introduction
26
The development of integrated approaches/frameworks for comprehensively
addressing the incorporation and conveyance of uncertainty as part of water
resources decision-making process.
Development of methods that can incorporate uncertainty, especially associated with
human input, to support efficient decision-making in water resources management.
Investigating how uncertainties inherent in water resources decision-making affect
the quality of decisions rendered.
1.4 Research Problem Statement
It is recognized in the literature that the water resources system, representing the
interactions between hydrological system and society is complex. This has been recognized
as integrated water resources management (IWRM) (Koudstaal et al., 1992), in which the
water resources system and its variety of users should be studied in an integrated manner.
There is an increasing policy interest in IWRM – see for example, European Union (EU)
Commission, 2000; GPW, 2012; Montanari et al., 2013 – that aims to take into account the
inherent interactions and associated feedbacks among hydrological, economic, societal, and
environmental issues. Modeling and decision support tools are being used increasingly to
characterize the complexities inherent in management of water resources and to help in
policy/decision-making discourses, as different scientific disciplines are not always able to
give unambiguous response to the complex issues.
However, until recently, most IWRM decision support tools were restricted to single
disciplinary models that mostly focused on physical processes (Harou et al., 2009). To
improve the ability of modeling tools to support more efficient decision-making,
understanding of the system processes (hydrological, societal, economical, and
environmental systems) and their inherent interaction and feedbacks need to be integrated.
Decision support tools that integrate different system processes into a unified framework
are considered helpful to evaluate their outcomes, analyze alternatives with stakeholders
and communicate the results.
Despite the identified need for integrated modeling tools and meaning full interest in IWRM,
there is still limited experience in developing models that evaluate interaction and feedbacks
of hydrological, societal, economical and environmental systems in a single framework

1 Introduction
27
(Cai et al., 2003). Until now, the development and implementation of an effective decision
support tool on the basis of a holistic understanding of the system process is fraught with
problems (Serrat-Capdevila et al., 2011; Hering and Ingold, 2012).
Furthermore, in the endeavor to understand how a coupled human-water system does
withstand a variety of natural and societal-induced disturbances (demographic, climate, and
societal) and respond to the changes, the type of change that can be predicted with
precision is usually trivial (Koutsoyiannis, 2013). This is true, as decision-making under
certainty is mostly trivial. Therefore, it is imperative to incorporate uncertainties in all levels
of water resources decision-making processes. The current acceleration of changes, mostly
due to human-related activities, inevitably results in increased uncertainty. In turn, the
increased uncertainty makes the society anxious about the future, insecure and unwary to a
developing future-telling industry.
Given the aforementioned research gaps, the existing methods are deemed to be
inadequate for efficient water resources decision-making under multiple uncertainties. The
conclusion is based upon:
For water resources management, the special challenge involves nonlinearity and
feedbacks across multiple scales, sectors and agents. Presence of incommensurable
and conflicting objectives inherent in the interaction of the system processes
(hydrological, societal, economical and environmental) as well as competing interests
of multiple stakeholders pose some unique challenges. Moreover, a variety of
natural and socially induced disturbances pose new challenge for the decision-
making process. This implies the need for new or improved models and decision
support tools that can accommodate knowledge of diverse disciplines, contradicting
objectives and conflicting interests of stakeholders in a unified operational
framework.
There are increasing demands to predict human modified water-related management
responses to future changes, but such predictions will be inevitably uncertain.
Decision-making and policy setting in contemporary water resources management
should therefore reflect theses inherent uncertainties in understanding,
interpretation and scenario development.

1 Introduction
28
There is a need to develop methods that can incorporate uncertainty, especially
associated with human input, in water resources decision-making.
Research is therefore required to improve the decision-making process, focused on
understanding, interpretation and scenario development of varied water-related challenges in
human-modified water resources management.
1.5 Research Aim and Objectives
The overall aim of the research project is stated as:
To develop and apply new or improved decision support tools for comprehensive water
resources system analysis considering hydrological, economical, societal and environmental
process implications with known certainty in the water resources management decision
outcomes and an understanding of the sensitivity of prioritizing decision alternatives to
uncertainties in the input parameters.
To achieve the overall aim, the scope of this research is defined by three major objectives:
Development of methodological approaches that have the capability to integrate
knowledge of diverse disciplines by developing models that can accommodate
multiple issues in a unified operational framework to support decision-making
processes of finding an appropriate management intervention or policy under
uncertainty.
Development of integrated approaches for comprehensively addressing uncertainties
as part of the water resources decision-making process. More precisely, uncertainty
analysis will include:
a. quantifying the uncertainty associated with different system processes
(e.g., human input)
b. conveying uncertainties in water resources decision-making through the
use of improved techniques which can ease the burden of communicating
uncertainty to the broader stakeholders
c. identify the most sensitive and therefore most critical input parameters to
the decision outcomes

1 Introduction
29
Assess how persistently decision makers and stakeholders can be involved and their
views can be considered into the water resources decision-making process.
This thesis addresses the aforementioned crucial aspects of IWRM. It focuses on the
development of new approaches which allow not only consideration of the physical
processes but also cares for the integration of economical, social, and environmental
aspects. The proposed approaches will be tested in a water-scarce coastal arid region, which
is affected by saltwater intrusion into a coastal aquifer due to excessive groundwater
extraction for irrigated agriculture, and which in turn endanger associated socio-economic
conditions and traditional social structure.
1.6 Novelty of the Research
In broad terms, the research project will provide an integrated and holistic solution to the
problem of decision-making with hydrological, socio-economic, and environmental
interaction, and will quantify uncertainty in the decision-making process. The significance of
the proposed research comes from the innovative methods for structured integration of
methodological and operational approaches pertaining to three different disciplines:
simulation-optimization, participatory planning, and decision analysis. The outcomes of this
research may avoid the current limited use of complex integrated models by improving
methodological capabilities and availing means to communicate the results with quantified
risks associated with implementing different management strategies.
This research is also significant from a practical perspective, as it is applied to an arid region
which features unique challenges to water resources management. These challenges are
attributed to a multitude of factors, the most important of which are, the significant increase
in population, climate conditions, urbanization, environmental degradation, and cultural and
religious factors. Most importantly, in arid environment the agricultural sector uses a large
amount of the available water resources eventually leading to contradicting management
objectives such as sustainable aquifer management vs. profitable agricultural production.
Usually an effort to solve such problems in one part of a water system frequently leads to
the emergence of another problem somewhere else in the system, which in turn impacts
other stakeholders or users in many cases due to the lack of accounting for all issues that
need to be incorporated. Inadequate considerations of these processes eventually lead to a
common-pool resource dilemma, with regard to acceptable management strategies.

1 Introduction
30
The proposed research would contribute in this regard, by characterizing water resources
management issues in such a way that sustainable management depends on a thorough
understanding of the connections with other components of water resource systems, to
support informed decision-making and to inform practice as well as policy decisions.
Finally, as stated earlier, water is a vital commodity and the way decisions are made for the
future is very important to the sustainability of the resources. Implementation of the
methodological and operational frameworks developed during this research will enable
improved planning of water resources allocation and enable decision makers to assess risks
associated with decisional management strategies.

31
2 Literature Review
2.1 Common Modeling Approaches to Support Management Decisions
of Water Resources Systems Uncertainty
Water resources systems are usually characterized by multiple interdependent components
that together result in complex technical, economic, social and environmental process.
Planners and experts working to improve the performance of these complex systems must
identify and evaluate alternatives to inform decision makers.
Models that can integrate diverse knowledge across a range of processes (for instance,
hydrological, economical, social and environmental) are essential to evaluate, understand
and to make trade-offs. The importance of integrating models or tools to augment the
effectiveness of planning, and management decision-making process has been
acknowledged in literature (see for example, Cai et al., 2003; Loucks and van Beek, 2005;
Pahl-Wostl, 2007; Liu et al., 2008; Grundmann et al., 2012; Carmona et al., 2013; Zagonari
and Rossi, 2013).
Given the demand for the development and use of integrated approaches to assist with
water resources planning and management decision-making processes, this section
presents some fundamental issues constituted behind integrated model development and
common modeling approaches.
2.1.1 The Integrated Water Resources Management Concept
The concept of integrated water resources management has been developing since the past
few decades as a response to the growing pressure on our water resources system caused
by growing demographic and socio-economic changes. The Global water partnership (GWP)
has defined IWRM as:
“a process which promotes the co-ordinated development and management of
water, land and related resources, in order to maximize the resultant economic and
social welfare in an equitable manner without compromising the sustainability of vital
ecosystems” (GWP, 2000).

2 Literature Review
32
This insight led to the idea that the water resources system and its variety of users should
be studied in an integrated manner.
The primary challenge to proceed with the concept of the IWRM is lack of consensus what
is meant by integration in the context of water resources management. This necessitates
identifying different processes that need to be integrated – so that management options for
a problem in one part of a water system do not lead to the emergence of another problem
somewhere else in the system. The evolving concept of integration of processes in the
context of water resources management has the following main dimensions according to
Jakeman and Letcher (2003):
Integration of issues – this is an initial step in integration, which is intended to
combine or integrate different issues (e.g., hydrological, economic, social and
environmental issues). It is aimed at looking various parts of the system as a whole
to avoid potential negative effects of management options.
Integration with stakeholders – embedded in the IWRM concept, there is an essence
that integrated modeling specifically intended to support decision-making demand an
interdisciplinary and participatory process to allow a better understanding of complex
phenomena (Rotmans and Van Asselt, 1996; Carmona et al., 2013). Close
involvement of stakeholders is key for better decision implementation, as
participation provides the means to foster communication, integration of knowledge,
encourage social learning and improve understanding of the system by including local
knowledge (Voinov and Bousquet, 2010).
Integration of scales of consideration – water resources systems involve feedbacks
across multiple scales. Components of the system may often be considered at a
variety of spatial and temporal scales. In integrated modeling for supporting
management decisions, the selection of scales may depend on factors such as: data
availability and computational limitations, intended end users or stakeholders, model
components representing different processes and their linkage.
These types of integrations are not mutually exclusive. There are diverse mechanisms to
accommodate the specific requirements of integration – starting with identification of issues
to be treated with coupling models representing the processes, up to approaches that
incorporate knowledge from different sources into models and communication of results.

2 Literature Review
33
Stakeholder participation is an important feature of all these integration processes. See also
the decision-making process cycle with its main steps and the area of influence of
participatory planning, simulation-optimization modeling and decision analysis in section
1.3.1 above, Fig. 4.
2.1.2 Issues to be Considered for Model Choice
While choosing a modeling approach to be used in water resources management, it is
central to reflect on some fundamental issues such as: purpose of the model, availability of
data and intended end users of the model as well as requirements on the format and scale
of the model outputs.
In the context of IWRM, models are primarily developed and employed to serve one or
more of purposes like: management and decision-making under uncertainty, prediction,
forecasting and social learning. There is usually overlap among these models and their
purposes are not mutually exclusive. Management and decision-making under uncertainty is
intended to offer a framework for making decisions in a systematic and rational way.
Different models may serve this purpose; these models may be simulation-based and/or
optimization-based models. Simulation models are developed to answer ‘what if’ type of
questions, while optimization models are developed to provide the ‘best’ option under a
given objective, subject to constraints. Simulation and optimization can be coupled to
provide better insight into complex decision-making processes (see for example, Schütze
and Schmitz, 2010; Grundmann et al., 2012; Carmona et al., 2013). Decision support models
are generally employed to assist in evaluating alternatives to avoid future problems and
consider likely learning opportunities from the decisions.
Data availability is another important factor that influences model choice. In wider context,
data may be classified as qualitative or qualitative. Quantitative data refers to the
measureable characteristics or fluxes in a system, while qualitative data refers to information
obtained from expert opinion and/or stakeholder beliefs gathered in the form of interviews
and surveys. Depending on the selected type of modeling approach, qualitative and
qualitative data may be used for conceptualizing the underlying framework, or
parameterization as well as calibration of the models.
The water resources decision-making is a complex process that involves the management of
risk that may arise from various sources of uncertainties (Vucetic and Simonovic, 2011).
Uncertainty in models may be resulting from variability (probabilistic) and interpretation as

2 Literature Review
34
well as lack of knowledge (fuzzy) and consequent ambiguity related to issues of complexity.
Therefore, how at best the uncertainties are treated in the process of model choice,
development and output analysis is imperative to the effectiveness of management and
decision-making processes. In an effort to incorporate uncertainties into modeling
frameworks, it is important to pick a model that can explicitly deal with associated
uncertainties. It is also important to pay attention to what type of uncertainties – probabilistic
and/or fuzzy – a particular modeling framework can accommodate. Another important factor
in the selection of models is the intended purpose of the model. For instance, in
management and decision-support models, the end users may be more interested in
evaluating the magnitude of impacts of alternative management options (or scenarios) rather
than accurate prediction values (Reichert and Borsuk, 2005).
2.2 Common Approaches to Modeling Complex Water Resources
Systems
Depending on what should integration have to constitute and the intended purpose of
modeling, there are a variety of approaches to develop models of complex system. Purpose
of modeling, data availability, the preferred compromise between breadth and depth of
system description, preferred treatment of uncertainty and level of stakeholder engagement
in the model development process are some of the main factors which can guide for
selection of an appropriate modeling approach. This section presents common modeling
approaches applied to integrate complex water resources systems. These are, coupled
component models, Bayesian networks (BNs), multiple criteria decision analysis (MCDA),
system dynamics, agent-based models and knowledge-based models. Brief overviews of
these approaches are presented hereunder.
2.2.1 Coupled Component Models
Coupled component models are one of the most commonly used integrated modeling
approaches which involve combining models from different sectors to come up with an
integrated outcome (see for instance, Matthies et al., 2006; Schütze and Schmitz, 2010;
Drobinski et al., 2012; Grundmann et al., 2012; van Delden et al., 2011; Akbar et al., 2013).
Coupled component models essentially employed when integrating different components of
hydrological, economic, social and/or environmental processes. Coupling may be tight or
loose depending on, whether component models are developed together sharing inputs and
outputs or, outputs from models are designed to be linked externally, respectively.

2 Literature Review
35
These models are often regarded as capable of describing complex interactions (including
feedbacks) among detailed processes for prediction, forecasting, management and decision-
making (Kelly et al., 2013). However, coupled component models lack capability to capture
uncertainty information (Voinov and Cerco, 2010) and they may not facilitate decision
support in situations where stakeholder engagement is required. These types of models
allow for more in depth representation of each component which consequently make them
costly, as the complexities of underlying components lead to limitations in terms of time and
other components required to develop and run the models. Coupled component models can
be used for optimization as well as scenario-based analyses.
2.2.2 Bayesian Networks
Bayesian networks (BNs) are a class of integrated modeling approach commonly employed
for management and decision-making applications in which stakeholder participation and
uncertainty is a key consideration (see for instance, Pearl, 1991; Borsuk et al., 2004;
Ticehurst et al., 2011; Carmona et al., 2013). The fact that BNs use probabilistic rather than
deterministic relationships to portray the relations among system variables is a reason why
they are appropriate for modeling complex systems under uncertainty. Bayesian networks
are also capable to explicitly incorporate quantitative as well as qualitative data/or information
to parameterize the model. Consequently, BNs are especially important when objective data
are missing, but other forms of information like expert opinion, local knowledge from
stakeholder involvement, etc., are available (Jensen and Nielsen, 2007; Carmona et al.,
2011; Ticehurst et al., 2011; Carmona et al., 2013).
Bayesian networks are typically useful for management and decision-making purpose in a
broad range of applications where uncertainty is persistent. This is partly as their principles
rise from decision and uncertainty theory (Castelletti and Soncini-Sessa, 2007; Barton et al.,
2012; Pérez-Miñana et al., 2012; Landuyt et al., 2014). The modeling results are presented
in probabilistic terms for the output states or occurrence for different events. As BNs can
incorporate a broad range of information, the management targets can be directly associated
with model predictions, making them very accessible to non-technical stakeholders and
decision makers. The BNs use frequently discrete rather than continuous probability
distributions to represent variables in the network. In general BNs applications have been
developed and employed aiming to support management decisions under uncertainty where
stakeholder participation in the development of the model is required.

2 Literature Review
36
2.2.3 Multiple Criteria Decision Analysis
Multiple criteria decision analysis (MCDA) is a type of an integrated modeling approach for
prioritizing or scoring the overall performance of decision options against multiple
criteria/objectives, widely being applied in the field of water resources management and
other natural resources (see for instance, Hyde et al., 2004; Hajkowicz and Collins, 2007;
Afshar et al., 2010; Jing et al., 2013). The approach can be very useful in management
systems subject to conflicting policies, planning and decision-making under uncertainties.
MCDA can be provided as a methodological framework to help decision makers identify
critical issues and prioritize those issues, selecting compromise alternatives and facilitate
communicating the results. Although in literature, there are different terms used to refer to
multiple criteria decision analysis, these approaches share the same fundamental principles
(Hajkowicz and Collins, 2007). Some of the common ones include: multi-attribute decision-
making (MADM), multi-objective decision support (MODS), multi-criteria decision analysis
(MCDA). In general, multiple criteria decision analysis approaches collectively referred to in
this thesis as MCDA, share the following main conditions: (1) a set of decision options which
to be prioritized; (2) a set of criteria typically measured in different unities; and (3) a set of
performance measures for each decision option against each criterion.
There are varieties of techniques to solve MCDA problems. Hajkowicz and Collins (2007)
have summarized some of the major techniques as: outranking approaches (Figueira et al.,
2005), pairwise comparisons (Saaty, 1980; Bana e Costa et al., 2005), fuzzy set analysis
(Zadeh, 1965), distance to ideal point methods (Zeleny, 1973; Abrishamchi et al., 2005),
multiple criteria value functions and tailored method (Hyde et al., 2004). MCDA has been
applied in a range of areas primarily focusing on planning, management and decision support
of complex water resources systems. Conflict resolution is a common area where MCDA is
very helpful, due to its transparency nature of the approach. It is possible to identify areas of
agreement and disagreement, through explicitly stating preferences of parties involved,
thereby managing conflict. This may help to reach at shared solution (Cai et al., 2004).
Another important feature for adopting MCDA is its capability to accommodate multiple
stakeholder engagement and stakeholder participation.
In literature, application of conventional MCDA and techniques to solve problems are quite
abundantly available (Hajkowicz and Collins, 2007), therefore, the contemporary research
gap regarding MCDA is being shifted to still unsolved challenges. Incorporation and better
ways of handling risk and multiple uncertainties in MCDA model as well as treatment of

2 Literature Review
37
decision makers’ risk preferences in the model could improve the overall decision-making
discourse. In addition, developing operational framework that can improve decision makers’
and stakeholders’ interaction with MCDA models, for preference elicitation and knowledge
acquisition, are some of the research gaps demanding new or improved approaches.
2.2.4 System Dynamics
System dynamics is a modeling approach which has its roots in the theory of system
structure that is used to represent a complex system and analyzing its dynamics (Forester,
1961). System dynamic models are well suited to study the dynamics, feedbacks and
evolving interaction in a system over time. The approach is typically useful to provide a tool
to test the effect of various strategies and policies in a system, particularly for multi-
disciplinary systems. System dynamic has been applied for a wide range of applications (see
for instance, Rivera et al., 2007; Zhang et al., 2008; Wei et al., 2012; Akbar et al., 2013;
Hassanzadeh et al., 2014).
While system dynamic models are capable to model feedbacks, delays and nonlinear
effects, they are not suitable for incorporation and investigation of uncertainties in a
comprehensive way. In addition, these approaches focus on scenario-based analysis rather
than optimization. As a result, system dynamic models usually emphasis on exploring the
plausibility of suppositions and outcomes, rather than accurate forecasts, prediction or
decision-making. These models are frequently built to allow experts and decision makers to
experiment with the model and examine some other plausibilities (Hassanzadeh et al.,
2014).
2.2.5 Agent-Based Models
Agent-based models are simulation models partly driven by increasing demand from
decision makers to provide support for understanding the potential implications of decisions
in complex management systems. Agent-based models comprise two or more agents that
exist simultaneously, which communicate and share common resources with each other
(Pahl-Wostl, 2002; Smajgl et al., 2011). Agent-based models are capable to represent
interactions between agents’ (frequently humans’) behavior with a rule based approach.
They are helpful for building a shared system understanding and to engage stakeholders as
part of participatory modeling process, especially where there is resource competition. In
addition, agent-based models can be helpful to support group decision-making and to
support social learning in range of areas (Akhbari and Grigg, 2013; Rounsevell et al., 2014).

2 Literature Review
38
2.2.6 Knowledge-Based Models
Knowledge-based models are techniques used to model the integration of complex systems
by encoding knowledge and then inferring conclusions employing an inference engine (Chen
et al., 2008; Aulinas et al., 2011). These types of models can be used in wide range of
purposes but they are often used for management and decision-making applications (see for
example, Li et al., 2014). In general, knowledge-based models are more important to
conceptualize a particular problem to refine goals, understand the main system features, and
recognize the key variables and factors.
2.3 Summary
In the preceding sections, the attributes of different commonly used integrated modeling
approaches to model complex water resources systems have been described. The
description was aimed to help in selecting an appropriate modeling approach considering the
intended purpose of modeling as well as what a particular integration constitutes. Table 1
summarizes the application of these approaches. The table presents suitable application
areas of the modeling approaches and the way in which they deal with consideration of
uncertainty, type of data availability, preferred compromise between breadth and depth of
system description, and the anticipated output from the integrated modeling approaches.
In the earlier sections, an overview is given about common modeling approaches to support
management decisions of water resources systems under uncertainty. The main challenges
encountered illustrates that there is still limited experience in developing water resources
management models that consider physical processes, environmental, and socio-economic
issues in a single framework. This is partly because the approaches are deficient in dealing
with uncertainites originated from input variability (stochastic uncertainty) and lack of
adequate knowledge (fuzzy uncertainty) of the sysytem from multidisciplinary perspective.
As a result, existing water resources models lack a framework that integrates uncertainites
into the processes of water resources decision-making. This thesis intended to contribute
towards this research gap.

2 Literature Review
39
Table 1: Summary of common approaches to modeling complex water and natural
resources systems
Approach Typical application Type of data Treatment of uncertainty
Scenario-based or optimization
Coupled component models
Prediction, forecasting Management and decision-making System understanding
Quantitative Challenging Both
Bayesian networks (BNs)
Management and decision-making System understanding and social learning
Both qualitative and quantitative
Explicit Both
Multiple criteria decision analysis (MCDA)
Policy evaluation Strategic planning Selection of alternatives
Can contain qualitative and quantitative
Can be explicit
Both
System dynamics System understanding and social learning
Quantitative Challenging Scenario-based
Agent-based models
System understanding Social learning
Quantitative Can be explicit
Scenario-based
Knowledge-based models
Management and decision-making Prediction and forecasting
Both qualitative and quantitative
Can be explicit
Scenario-based

40
3 Proposed New Integrated Modeling Approaches
Based on the aforementioned discussions on the development of efficient decision support
tools to aid in decision-making and to achieve comprehensive analyses considering linkages
between socio-economic and physical processes, while serving as a platform for stakeholder
participation, the following research questions arise:
How is it possible to develop an operational framework that has capacity to integrate
knowledge of diverse disciplines and multiple issues in a single framework to assess the
potential impact of management alternatives on natural and socio-economic systems?
How to deal with uncertainties associated with the decision-making process or, more
precisely, how to quantify uncertainties associated with different system inputs and
explicitly convey/communicate uncertainties in water resources decision-making?
Also, is there a way to develop a decision support tool for IWRM capturing the essence of
the prevailing complex interactions between humans and the water system but not all the
details, with adequate management and communication of uncertainties, as well as with
persistent participation of stakeholders?
Two new strategies are proposed as a possible answer: (1) a Bayesian network (BN)-based
decision support tool, combining a set of coupled component models and a participatory
Bayesian network model; and (2) a fuzzy-stochastic multiple criteria decision analysis tool –
combining a simulation-optimization model, fuzzy logic, expert involvement, and stochastic
simulation – subsequently, enabling to deal with heterogeneous information (e.g., discrete,
continuous, and linguistic values) and incorporate stakeholders’ views in the decision-making
process. Each approach covers aspects of the requirements mentioned above adequately.
The modeling approaches to link interacting physical processes, environmental, and socio-
economic issues in a single integrated model is described. Both approaches – BN-based
decision support tool and fuzzy-stochastic multiple criteria decision analysis – do contribute
to the same intended goal of informed decision-making under uncertainty in water resources
management as it is illustrated in Fig. 5.
The modeling components considered are: coupled groundwater-agricultural systems,
hydrological responses, effects on aquifer sustainability, empirical knowledge and
stakeholder inputs, and impacts of changes on socio-economic issues (Fig. 5).

3 Proposed New Integrated Modeling Approaches
41
Figure 5: Modeling components considered in the integrated modeling approaches to
conceptualize hydrological and socio-economic interaction
In the subsequent sections, the studies of proposed approaches from the technical literature
have been reviewed in detail (section 3.1 and 3.2). Furthermore, conclusions have been
drawn emphasizing the need of the proposed modeling approaches.
Afterwards, detailed solution procedures of the proposed approaches are presented in
chapter 5 (BN-based decision support tool) and in chapter 6 (fuzzy-stochastic multiple criteria
decision analysis tool). Based on detailed solution procedures of the proposed approaches,
they are applied to a study area in the Al-Batinah region, Sultanate of Oman (chapter 7). The
application is performed for a coastal arid region, which is affected by saltwater intrusion into
a coastal aquifer due to excessive groundwater extraction for irrigated agriculture. To
address the issues, different management interventions, which may range between the
extremes of stopping all agricultural activities to recover the local aquifer system or
producing as much as possible as long as water and soil resource will be available/suitable
(i.e., sustainable aquifer vs. high profitable agricultural production), are investigated. In this
way, a comprehensive view upon the water resources system is provided. The focal point,
yet, lies on finding appropriate management interventions or policies. Several policy
combinations were analyzed regarding their efficiency within different management
scenarios in a probabilistic way, which enables decision makers to assess the risks

3 Proposed New Integrated Modeling Approaches
42
associated with implementing alternative management strategies. In addition, efficient
metrics for evaluating performance and uncertainties of the developed tools were performed
which underline the reliabilities of the results (section 7.3 and 7.4).
Chapter 8 summarizes the research work and draws some conclusions, in addition some
outlooks for future research work are given.
3.1 Bayesian Network-Based Decision Support Tool
As it is discussed in the previous sections, the management of complex interacting
hydrosystems are challenging if in addition to the physical processes also socio-economic
and environmental issues have to be considered. BN-based decision support tool as it is
presented in Subagadis et al. (2014a) provides a means to tackle these challenges. The
following paragraphs, present background for the BN-Based decision support tool from
technical literature.
The management of water resources in areas with high demands and scarcity of water
coupled with socio-economic and environmental issues is extremely challenging (Craswell et
al., 2007; Kalbus et al., 2012; Zhang et al., 2012). Frequently, the competition for water
causes conflicts of interests among various water actors with mostly contradicting
objectives. Furthermore, uncertainty about the consequences of potential management
interventions poses unique challenge for decision makers (Craswell et al., 2007; Jiao and Xu,
2013).
The traditional approach of considering water issue isolated from socio-economic and
environmental aspects is no longer viable (Hong et al., 2012; Marke et al., 2013). To address
these challenges, the principles and policies of IWRM was formulated (GWP, 2012). This
includes participation of stakeholders through their engagement in the decision making
process of water management (Carmona et al., 2011). However, environmental and natural
resources managers and decision makers need models which help them to understand the
effectiveness of alternative management decisions (Matthies et al., 2007). Water resources
managers currently face a challenge to find quantitative tools for evaluating the
consequences of their management interventions, if in addition to the physical processes
also socio-economic and environmental aspects are considered (Henriksen et al., 2007;
Molina et al., 2010).

3 Proposed New Integrated Modeling Approaches
43
In literature, the development of integrated Decision Support Systems (DSS) is considered
as one of the best ways to handle water resources interwoven with numerous socio-
economic activities, as well as environmental issues (Liu et al., 2008; Serrat-Capdevila et al.,
2011). Until now, the development and implementation of an effective decision support tool
on the basis of a holistic understanding of system processes (hydrological, environmental
and socio-economic) is fraught with problems (Serrat-Capdevila et al., 2011; Hering and
Ingold, 2012).
The main challenge of applying a DSS approach in real-world IWRM is the high complexity
due to nonlinearities, feedbacks and delays in decision making (Loucks and Beek, 2005).
This entails the need to develop appropriate tools for overcoming these complexities and
incorporating uncertainty to support decision-making. Modeling approaches that can
integrate different system processes into a combined framework are considered to be
useful tools to understand the complex interaction and to evaluate how these system
processes respond to various changes (Rakhmatullaev et al., 2010; Kalbacher et al., 2012;
Kragt et al., 2013; Marke et al., 2013). Commonly used approaches for integrated modeling
was reviewed in section 2.2. Those modeling approaches have important differences which
limit their applicability depending on how and what issues they can accommodate like
knowledge type, uncertainty and stakeholder engagement. For example, a Bayesian network
model is a powerful tool for handling system processes with uncertain input (or output)
characterized by probability distribution, while coupled component models are more suitable
for simulating system processes with nonlinearity and feedbacks. Until recently, many water
system modeling approaches were restricted to single disciplinary models that represent
physical systems with limited consideration of socio-economic issues and stakeholder
participation (Pérez-Miñana et al., 2012). For effective decision making, it is important to
embrace simultaneous and/or complementary use of interdisciplinary methods to overcome
traditional decision-making problems and to allow for the incorporation of a broader
knowledge. To improve the ability of integrated modelling it is important to expand an
approach that can incorporate multidisciplinary system process, analyses management
alternatives with the involvement of stakeholders and communicate results in a transparent
way.
BN is an integrated modeling approach for depicting probabilistic relations among elements
of the model, where objective data are lacking and use of expert opinion is necessary
(Barton et al., 2008; Ticehurst et al., 2011; Kelly et al., 2013). This is helpful to capture
uncertainty involved in the complexity and for quantification of societal and human inputs

3 Proposed New Integrated Modeling Approaches
44
which require soft knowledge (Bromley et al., 2005; Barton et al., 2012). Furthermore, the
use of BN presents a number of advantages over other decision support tools (Castelletti
and Soncini-Sessa, 2007; Ticehurst et al., 2007; Giordano et al., 2013), for example: (1)
stakeholder inputs, expert opinions and local knowledge can be easily incorporated; (2) a
variety of information like quantitative and qualitative data can be integrated; and (3)
uncertainty among variables can be represented simply and the model can be easily updated
if new information is available. However, BN alone is inadequate to address the complexity
of water resources management systems like: optimization of complex water systems,
dynamic feedbacks, nonlinearity and delays (Kelly et al., 2013). Therefore, combining BN
with other integrated modeling approaches can compensate for these deficiencies.
The management of water resources involving strong interactions between groundwater
and agriculture are associated with contradicting objectives (e.g., maintaining sustainable
groundwater abstraction vs. maximizing agricultural profit), as they affect each other
adversely. Multi-criteria optimization of coupled component models allows for addressing
these trade-offs (Grundmann et al., 2013). Applying multi-criteria optimization techniques
generate a large number of so called Pareto-optimal solutions, depending on the formulation
of the management problem. However, interpreting and communicating those solutions to
decision makers remain a significant challenge, because a Pareto-optimal data set consists
usually of too many solutions. Therefore, it is difficult to identify solutions which have similar
levels of goals attainment correspond to sets of decisions. This entails for post-Pareto
optimality analysis to assist decision makers to understand Pareto-optimal solutions in multi-
objective decision problems (Reddy and Kumar, 2007; Chaudhari et al., 2010).
The BN-based decision support tool is intended to demonstrate the value of combining two
different commonly used integrated modeling approaches, namely, coupled component
models and BN model. Coupled component models are applied to simulate nonlinearities
and feedbacks of strongly interacting physical process. A BN model is employed to integrate
results from coupled component models regarding physical process with empirical
knowledge and expert (stakeholders) opinions concerning management interventions. To
that end, a participatory integrated modeling framework is developed and applied to
conceptualize hydrological, socio-economic and environmental interaction of coupled
groundwater-agricultural system. This strategy is intended to address the issues of
contradicting management objectives such as sustainable aquifer management vs. profitable
agricultural production and the problem of finding appropriate management interventions or
policies. The new approach, BN-based decision support tool, fulfills the requirement to

3 Proposed New Integrated Modeling Approaches
45
integrate the different interests (hydrological, socio-economic, and environmental) being
developed with stakeholder participation, while conveying the associated uncertainties. The
solution procedure of this approach is presented in detail in chapter 5.
3.2 Fuzzy-Stochastic Multiple Criteria Decision Analysis Tool
A fuzzy-stochastic multiple criteria decision analysis tool is an approach intended to
systematically quantify both probabilistic and fuzzy uncertainties associated with complex
hydrosystems. It integrates physical process-based models, fuzzy logic, expert involvement
and stochastic simulation within a general framework (see also, Subagadis et al., 2014b).
The following paragraphs present background to the proposed fuzzy-stochastic multiple
criteria decision analysis tool from technical literature.
Water resources management decisions can be complex because of the inherent
interactions and associated feedbacks among hydrological, economic, societal and
environmental issues (e.g., Di Baldassarre et al., 2013; Montanari et al., 2013). Such
complexities are further compounded by multiple actors frequently with conflicting interests
and uncertainties about the consequences of potential management decisions (Simonovic
and Nirupama, 2005). This necessitates the water resource management decisions to be
analyzed as a multiple criteria multiple stakeholder problem subject to multiple uncertainties.
In literature, MCDA techniques have been applied to facilitate water management decision-
making (e.g., Hyde et al., 2004; Xu and Tung, 2008; Lindhe et al., 2013). Comprehensive
review of difference MCDA approaches applied to water management and other natural
resources can be found in Hajkowicz and Collins (2007).
Conventional MCDA techniques, like Analytical Hierarchy Process (AHP), Method for Order
Preference by Similarity to Ideal Situation (TOPSIS) and Preference Ranking Organization
Method for Enrichment Evaluations (PROMETHEE II), are often applied with little
consideration given to uncertainties in the input data, propagation and incorporation of those
uncertainties into the decision-making processes (Jing et al., 2013). However, it is prevalent
that decision-making processes of water management are prone to uncertainties. Helton
(1997) referred uncertainties into two broad groups namely, stochastic and fuzzy uncertainty.
Stochastic (probabilistic) uncertainty provides a synergistic way for dealing with uncertainty
caused due to natural variability and randomness in the decision-making processes. On the
other hand, fuzzy uncertainty deals with uncertainty that comes from ambiguity and

3 Proposed New Integrated Modeling Approaches
46
vagueness due to imprecise judgments or lack of knowledge, as well as assumptions being
used in decision-making processes.
The need for formal handling of uncertainty and risk in MCDA has been underlined in
literature (e.g., Stewart 2005; Jing et al., 2013; Lindhe et al., 2013). Consequently, some
efforts have been made to consider uncertainties in MCDA. Tesfamariam and Sadiq (2008)
employed aleatory and epistemic uncertainties related to input parameters for probabilistic
risk analysis. Wong et al. (2000) used a fuzzy-stochastic technique for project selection,
thereby incorporating fuzzy analysis into multi-attribute theory. More recently, Mousavi et al.
(2013) combined fuzzy and stochastic approaches for multi-attribute discrete decision-
making for project selection.
However, the methodological approaches forwarded so far have several limitations: (1) most
of these studies were not considering multiple uncertainties into account (both fuzzy and
stochastic) simultaneously in the MCDA; (2) the methodological proposals have been dealt
with homogenous information at a time (e.g., discrete values) (Zarghami et al. 2008; Lindhe
et al., 2013; Mousavi et al., 2013), lacking the capability to handle heterogeneous
information (e.g., discrete, continuous, interval valued and linguistic terms), concurrently
(Zagonari and Rossi, 2013). This in turn limits flexibility of the proposed methods and may
result in an information gap, as in a real-world decision situation we are often confronted
with the fact that significant information being very diverse. Subsequently, resulting
decisions from these procedures can be less reliable or impractical. In addition, the risk of
obtaining acceptable ranking – as it is perceived by decision makers – in prioritizing different
feasible management alternatives under uncertainty have been rarely connected with water
resources management decision-making processes. The consideration of risk of obtaining
acceptable ranking is not only important as indicator for the appropriateness analysis of
management alternatives but also allows the lower limit of making a sound decision under
uncertainty to be determined considering decision makers’ experience and attitudes. In
consequence, contributing to better understand human-water interactions (which remain
largely unexplored) through stimulating communication between decision makers and
modelers.
To overcome the aforementioned limitations, a fuzzy-stochastic multiple criteria decision
analysis tool is developed by integrating a variety of criteria representing economic,
environmental and social issues subject to multiple uncertainties. It presents a
methodological framework for combining objective and subjective criteria in a decision-

3 Proposed New Integrated Modeling Approaches
47
making procedure along with evaluating associated uncertainties to obtain an acceptable
ranking of candidate management alternatives. The proposed new fuzzy-stochastic multiple
criteria decision analysis comprises: simulation-optimization water management model,
fuzzy linguistic quantifiers, Monte Carlo simulation and pairwise comparison and ranking of
candidate management alternatives. Subsequently, enabling to deal with heterogeneous
information and incorporate decision makers‘ opinions and judgments in the decision-making
processes. The detailed solution procedure of this approach is presented in chapter 6.

48
4 Principles for Modeling the New Integrated
Approaches
This chapter presents the basic principles have been used in the modeling processes of the
new approaches – Bayesian network-based decision support tools and fuzzy-stochastic
multiple criteria decision analysis tool. Accordingly, in the following, the fundamental of the
main building elements of the proposed approaches are detailed and subsequently
employed in the solution procedures of the new approaches. The basics of Bayesian
network-based decision support tool – Bayesian networks, simulation-optimization, Pareto-
front clustering, and uncertainty and performance evaluation of Bayesian networks – are
first discussed. Then after, the fundaments of fuzzy-stochastic multiple criteria decision
analysis tool – fuzzy vs. stochastic uncertainty in water resources management, and basics
of fuzzy sets and its operations – are presented in detail.
4.1 Principles of Modeling Bayesian Network-Based Decsion Support
Tool
4.1.1 Bayesian Networks
BNs are probabilistic graphical models that represent a set of variables and their conditional
dependences (cause and effects) through a set of links (arcs) representing causal
relationship between these variables. BNs are application of Bayes’ theorem that links
occurrence of one event given the occurrence of another event (Pearl, 1988; Jensen and
Nielsen, 2007). BNs are composed of three fundamental elements:
A set of variables referring to a management system represented by nodes. Each
variable embodies a finite set of mutually exclusive states. States represent all the
possible conditions of the nodes/variables (‘nodes’ and ‘variables’ are used to mean
the same thing in this thesis). Variables can either be quantitative or qualitative, or
discrete or continuous. For example, weather a crop is sorghum or wheat, whether a
particular statement is true or false, groundwater level, rainfall depth, etc. can be
represented in a BN as a state of the node.

4 Principles for Modeling the New Integrated Approaches
49
A set of links (also known as directed acyclic graphs) representing causal
relationships between the nodes. In practice given two nodes A and B, if there is a
link from node A to node B (indicates that A causes B), B is described as a child of A,
and A as a parent. A node which does not have a parent (also known as root node)
represents an input variable, while, a node without children is a leaf node and
constitutes an output variable.
A set of probabilities, one for each node, specifying the probability of a node will
assume a particular value, given the values of states of its parents. These
probabilities describing the relationships between the nodes are called conditional
probability table (CPTs). Nodes without parents (root nodes) may only be associated
with unconditional probabilities (also called marginal probabilities).
Bayesian networks can help in identifying relationships between variables, if input
probabilities and conditional probabilistic relationships among variables are given. For
constructing a BN, the first recommended step is the identification of all relevant variables in
collaboration with stakeholders preferably (Cain, 2001). Once the relevant variables are
identified a range of possible states are assigned to them. States should represent all
possible conditions of the variables. The variable states can be assigned as numeric values
or intervals, qualitative estimations or boolean functions. The connections between variables
which characterize their dependencies are represented by arcs (see Fig. 6). Probabilistic
dependencies between variables are quantified using conditional probability tables (CPTs).
The CPTs are used to calculate the resulting probability of a variable given the values of its
parent(s). To fill the CPT with probability values, information can be obtained from various
sources like, model results, statistical data, and elicited from expert opinion.
The process by which new evidence is entered into the network and propagated through BN
is called “inference”. This process allows for the introduction and analysis of input variables
and to evaluate the consequences (influence) on the output variable values.
As an example, Fig. 6 shows a simple BN consisting of three nodes which represents:
aquifer recharge (R), variation of water table levels (H), and groundwater quality (S). Based
on the physical process, aquifer recharge (R) is conditionally independent; variation of water
table levels (H) and groundwater quality (S) are conditionally dependent on R and H,
respectively. As an illustration, two possible values (‘states’) {(h1, h2), (s1, s2), (r1, r2)} are
considered for the three variables (see also Fig. 6).

4 Principles for Modeling the New Integrated Approaches
50
Figure 6: An example of a simple Bayesian network formed by three variables with
associated conditional probability tables.
To complete the BN, the probability of aquifer recharge (P(R)), and the conditional probability
distributions P(R|H) and P(H, R|S) in form of CPT are required. The propagation of information
through the BN is performed by calculations of the conditional probability distributions P(H|R)
and P(S|H, R) based on Bayes’ rule (Eqs. 1 and 2).
)(
)|(*)()|(
RP
HRPHPRHP (1)
),(
)|,(*)(),|(
RHP
SRHPSPRHSP (2)
Here, the left-hand side of Eq. 1 is the conditional probability of H, given a set of
observations of R. The first term in the numerator of the right hand side of Eq. 1 is the prior
probability of H and the second term in the numerator is the likelihood of the observations of
R, if the response H is known. Likewise, the denominator of Equation 1 refers to the
probability of R.

4 Principles for Modeling the New Integrated Approaches
51
Once these probabilities are estimated, the BN is complete and ready to propagate
information. BNs can be used in this way to investigate the consequences of decisions or
observed values for the variables for which the attempt is to control.
4.1.2 Multi-Objective Optimization
Basics
In real-world engineering applications, many or even most, problems do have multiple
objectives, i.e., maximizing profit, minimizing cost, maximizing reliability, minimizing
environmental impact indicators, etc. These manifestations are difficult but realistic
problems need to be tackled. Generally, multi-objective optimizations are popular techniques
well-suited for this class of problems.
There are two general approaches to multi-objective optimization. One approach is to
combine the individual objective functions into a single composite function. Determination
of a single objective is possible with methods like weighted sum method, utility theory, etc.,
however, the problem lies in the correct selection of the weights or utility functions to
characterize the decision makers preferences. The difficulty to precisely select the correct
weights may persist with problem domains supposed to be well understood. It is also
important to notice that, small deviations in the weights can guide to very different solutions.
Hence, decision makers often favour a set of promising solutions given the multiple
objectives. The second approach is to establish a whole set of Pareto-optimal solutions. A
Pareto-optimal is a set of solutions that are non-dominated in relation to each other. In this
sense there is always compromise while moving from one Pareto-optimal solution to
another to achieve a certain amount of gain in the other.
A multi-objective optimization problem may be defined as follows: given an n-dimensional
decision variable vector f = {f1 . . . fn} in the solution space F, find a vector F* that minimize a
given set of K objective functions z(f*) = {z1(f*) . . . zk(f
*)}. The solution space F is generally
restricted by a series of constraints, such as gj(f*) = bj for j = 1 . . . m, and bounds on the
decision variables.
As many real-world decision problems deal with contradicting multiple objectives, optimizing
f with respect to a single objective often results in unacceptable results with regard to the
other objectives. Therefore, a reasonable solution to a multi-objective optimization problem
is to look for a set of solutions, each of which satisfies the objectives at an acceptable level

4 Principles for Modeling the New Integrated Approaches
52
without being dominated by another solution. A solution is referred to as Pareto-optimal, if it
is not dominated by another solution within the solution space (Fig. 7). Thus, a Pareto-
optimal solution cannot be improved with respect to any objective without worsening at
least one of the other objectives. The set of all feasible non-dominated solutions in F is
referred to as the Pareto optimal set, and for a given Pareto-optimal set, the corresponding
objective function values in the objective space is called the Pareto-front as it is illustrated in
Fig. 7.
4.1.3 Pareto-front Clustering
Multi-objective optimization is applied to a variety of fields with an ultimate goal of
generating a set of non-dominated solutions. Resulting Pareto-optimal solutions may contain
a very large set which in turn may cause difficulties for decision makers to select a particular
solution among the set. Analyzing the shape of the Pareto-front may help a decision maker
to understand the solution space and to identify possible trade-offs among the conflicting
objectives (Fig. 7).
However, as the Pareto-optimal solution consists of a large data set (i.e. hundreds of
potential solutions), it remains a significant challenge for decision makers to interpret. Given
these reasons and others, post-Pareto-optimal analysis is required so as to aid decision
makers in choosing a particular solution from potentially large set of non-dominated results.
The following steps are key to run efficient post-Pareto-optimal analysis (Chaudhari et al.,
2010):
Obtain the entire Pareto-optimal set or sub-set of solutions using a multi-objective
optimization.
Apply a cluster analysis algorithm to form clusters within Pareto-optimal solution set.
Determine the optimal number of clusters, either, (1) using a prior knowledge of the
relative importance of the conflicting objectives in the multi-objective optimization, or
(2) using cluster center estimation of the data which uses an average dissimilarity of
each data set with all other data within the same cluster.
A representative solution is then selected from each cluster. A solution closest to its
respective cluster centroid is chosen as a good representative solution.

4 Principles for Modeling the New Integrated Approaches
53
Finally, decision makers can analyze the selected representative results for further
applications.
Figure 7: Illustration showing a Pareto-optimal solution, where smaller y-axis (SI) and larger
x-axis (profit) values are preferred to larger y-axis and smaller x-axis values, respectively.
Hence, in this research, a Subtractive Clustering (SC) (Chiu, 1994; Yager and Filev, 1994) has
been used to group the Pareto set into clusters containing similar Pareto-optimal solutions.
Clustering analysis is a helpful means for identifying a set of data items into groups of more
similar data sets to each other than to those in the other groups. Objects in the same cluster
are more of similar type, while objects belonging to other clusters are of more dissimilar
type. When handling large amounts of data, clustering analysis helps to simplify the burden
of analyzing each data point, making it possible to look at properties of whole clusters
instead of individual objects.
The subtractive clustering algorithm according to Chen et al. (2008) is described as follows:

4 Principles for Modeling the New Integrated Approaches
54
Consider a group of n data points {y1, y2...yn}, where yi is a vector in the feature space.
Without loss of generality, it is assumed that feature data space is normalized with the
intention that all data points are bounded by a unit hypercube. It is considered each data
point as a potential cluster center and defines a measure of points to serve as a cluster
center. The potential of yi represented as Ui is calculated (Eq. 3) by.
n
j a
ji
ir
yyU )
)2/(
||||exp(
2
2
(3)
where, ra is a positive constant defining a neighborhood radius, and || ||, represents the
Euclidean distance. For a data point, potentially to serve as cluster center depends on how
many neighboring data points it will have. A point with many neighboring will have a high
potential while the point outside ra will have little chances to serve as cluster center.
A point having the highest potential is selected as the first cluster center C1. The potential
point of C1 is referred to as PotVal(C1). Afterwards, the potential of each data point yi is
revised (Eq. 4) as:
2
2
1
1)2/(
||||exp()(
b
i
iir
CyCPotValUU
(4)
where, rb = 1.5ra is often assumed to avoid coming up with closely spaced cluster centers.
The data points near the first cluster center will have greatly reduced their potential and will
unlikely be selected as next cluster center. Subsequently, the data point with the highest
potential is chosen as the second cluster center, after the potential of the data points have
been reduced according to (Eq. 4). This process is repeated till the potential of the
remaining points are again reduced. Generally, after the tth cluster center Ct is identified, and
the potential is revised (Eq. 5) as:
))2/(
||||exp()(
2
2
b
ti
tiir
CyCPotValUU
(5)
where, Ct is the location of the tth cluster center and PotVal(Ct) is its potential value.
Therefore, a MATLAB code has been employed in this study to perform the above
mentioned steps of the proposed clustering method. Accordingly, number of clusters has
been identified based on the shape of the Pareto-front and using a prior knowledge of the
relative importance of the conflicting objectives in the multi-objective optimization in such a

4 Principles for Modeling the New Integrated Approaches
55
way to help decision makers can better understand the Pareto-optimal solutions. These
clusters are further employed for scenario development, parameterization and interpretation
of the model results.
4.1.4 Uncertainty and Performance Evaluation of BN
Building a BN is systematically prone to errors (Marcot, 2006). This could be due to number
of reasons such as: statistical representation of the data, differences between groups of
expert opinions, and other sources of uncertainty. Therefore, it is important to address
techniques to evaluate uncertainty and performance of BN model results. In literature, there
is a limited BN model validation technique and application. Aguilera et al. (2011) has reported
that only 45% of BN-based models used validation techniques. Certainly, parameter
estimates obtained from an expert or from a relatively scarce data can have quite high
variance. Additionally, the networks can also be sensitive to a small change of the network
structure like adding, deleting or reversing. Consequently, the results of inference obtained
by using a particular BN-based model are not assured to be stable with respect to small
changes in the model.
Validating a BN-based model involves: testing the reasoning accuracy based on the model,
evaluating the model’s performance robustness, and evaluating the model’s tolerance to
noises. The model’s performance robustness and noise tolerance are very much related and
can be explored using sensitivity analysis. In Bayesian networks, sensitivity analysis is
employed to investigate the effect of the small changes of the numeric parameters on a
BN’s performance. Performances relate to how well a BN model diagnoses the accuracy of
model results, while BN model uncertainty relates to the distribution of posterior probability
values (output probability or state variables with calculated values) among different outcome
states. Therefore, it is desirable to obtain low sensitive model, i.e., ideal best model would
have high performance and low uncertainty that can well represent the domain knowledge.
In literature, there are some methods and metrics to evaluate BN-based model performance
and uncertainty to ensure credibility, acceptance, and appropriate application of model
results when used to inform decision makers. Summary of methods and metrics potentially
useful for assessing performance and uncertainty of BN models (e.g., as used by Marcot,
(2012) are presented in the appendix (Table A.1). Various measures commonly used in
literature for this purpose collectively provide a helpful set of complimentary insights into a
BN-based model performance and associated uncertainty. Based on the modeling goals and
the analysis or the decision-making process in hand, alternative measures offer utility in a

4 Principles for Modeling the New Integrated Approaches
56
range of ways (Table A.1). The modeler should be mindful of assumptions and limitations
before applying such measure.
To address BN-based model performance and uncertainty, in this thesis, sensitivity
analysis, influence analysis, and posterior probability certainty assessment index
(PPCI) were used as metrics to investigate BN-based model performance built for diagnosis
of coupled groundwater-agricultural hydrosystems. The details of the applied measures are
presented in the following sections
4.1.5 Sensitivity Analysis
Sensitivity analysis in BN-based modeling relates to identifying the level to which variation in
posterior probability distribution is explained given prior probability distributions. Sensitivity
analysis in this sense intends to determine BNs variables which influence the outcomes of
management interest in the modeling (Wang, 2006). This implies, sensitivity measures the
degree of variation in the BNs posterior probability distribution resulting from changes in the
evidence being entered in the BN. The resulting values in turn, enable one to rank the
evidence nodes (variables) accordingly so that to assist the experts in targeting future data
collection and identifying errors in the BN.
BN-based models sensitivity may be calculated using variance reduction (for continuous
variables) or entropy reduction (for ordinal-scale or categorical scale) (Pearl, 1988). Variance
reduction (VR) is deliberated as the anticipated reduction in the variation of the expected real
value of a posterior probability of a variable G that has g states, as a result of a prior
probability of a variable B that has b states. The VR thus, is computed (Eqs. 6 – 9) as:
)|()( BGVGVVR (6)
where, g g GEXgPGV 2)]()[()( (7)
g
g bGEXbgPBGV 2)]|()[|()|( (8)
g
gXgPGE )()( (9)
where, Xg is the quantitative real value of state g, E(G) is the anticipated real value of G
before applying new findings, E(G|b) is the anticipated real value of G after applying new

4 Principles for Modeling the New Integrated Approaches
57
findings (states) d for variable B and V(G) is the variance of the real value of G before a new
findings (Marcot, 2006).
Entropy reduction is calculated as the reduction of the variance for the expected value of an
output variable. As an illustration, consider an output variable G that has g states and an
input variable B that has b states. Then, entropy reduction (I), which measures the effect of
one variable on another, is computed (Eq. 10) as:
g b bPgP
bgPbgPBGEGEI
)()(
)],([log),()/()( 2 (10)
where E(G) is the entropy of G before any new findings. E(G|B) is the entropy of G after new
findings from variable B (Marcot, 2006).
The sensitivity analysis results are used to compare (rank-order) input variables numerically
with regard to which, each reduced variance or uncertainty (entropy) in a particular outcome
variable. Usually, sensitivity is calculated with input variables set to their default prior
probability distributions. Evaluating sensitivity of BN-based models can be used to
understand response of variables to the probability distributions of other variables.
Afterwards, efforts can then be directed to improve the level of accuracy for those variables
and to channel experts to elicit the limitations in the modeling.
4.1.6 Influence Analysis
Influence analysis which may also be called impact analysis refers to, evaluating effects of
selected input variables to posterior probability distributions. In the analysis input variables
are set to different scenarios (best or worst) depending on the point of interest. Results of
this analysis enable to compare posterior probability distributions generated from the
normative (business as usual) scenarios and from other scenario settings. Unlike sensitivity
analysis described above, specifying the value of input variables in influence analysis forces
the variables sensitivity analysis (entropy reduction) to zero, while it still may have a
significant influence on the posterior probability distribution outcome. Computing influence
runs can contribute to determine the extent to which each individual or set of individual
variables could affect the outcome results. Subsequently, this helps in decision-making
process where there is a need to prioritize activities (interventions) to best affect desirable
outcomes, or to get read of unwanted outcomes.

4 Principles for Modeling the New Integrated Approaches
58
4.1.7 Posterior Probability Certainty Assessment
Besides sensitivity analysis described earlier, there are several metrics which depict the
degree of uncertainty in the BN-based model outcomes, specifically, the dispersion of
posterior probability distribution values. Such metrics can help to support informed decision-
making, by analyzing uncertainty associated with BN-based model results and risk
(uncertainty) taking attitude of decision makers. Posterior probability certainty index (PPCI) is
one of existing methods capable of evaluating uncertainty in posterior probability
distributions.
PPCI is used as a metric to evaluate uncertainty of BN-based model outcomes. The
approach was described by Marcot (2012) and based on information theory, specifically on
the adaptation of the classic evenness index (Hill 1973). In this approach, the posterior
probability distributions consist of pi probability values among N number of states.
where Pi ranges [0 1] and 11
N
i
ip , PPCI is calculated (Eq. 11) as:
)ln(
1 1
N
Lp
PPCI
N
i
i
(11)
where,
0p0,
0p),(pln
i
iiL
The PPCI value ranges between [0, 1]. Models with higher PPCI values of their posterior
probability distributions suggest greater certainty in outcome predictions. The fact that
posterior probability certainty index is normalized makes the index suitable to compare
different models with different numbers of outcome states.

4 Principles for Modeling the New Integrated Approaches
59
4.2 Principles of Modeling Fuzzy-Stochastic Multiple Criteria Decision
Analysis Tool
4.2.1 Fuzzy vs. Stochastic Manifestation of Uncertainties in Water
Resources Management
Water resources management is complex because of the inherent interactions and the
associated feedbacks. The complexities are further subjected to multiple uncertainties. In
literature, different approaches have been used to accommodate uncertainties in water
resources management decision-making.
Uncertainties can be categorized into two groups: fuzzy and stochastic (probabilistic)
(Destouni, 1992; Helton, 1997). Fuzzy refers to uncertainty caused by lack of knowledge and
stochastic uncertainty refers to uncertainty caused by inherent variability. In the fuzzy
approach, membership functions are employed to describe vagueness and ambiguity in
human thoughts. This approach has capability to accommodate imprecise knowledge from
description of human language and to quantify uncertainties associated with linguistic
variables. In the stochastic (probabilistic) approach, on the other hand, probability density
functions are used to portray random variability in a decision problem under consideration.
Mathematical models using some statistical sampling algorithms (e.g., Monte Carlo method)
are then employed to propagate these probability densities to the output variables.
Generally, fuzzy approach is sound method to deal with uncertainties when there is no clear-
cut information to represent imprecise concepts. Fuzzy approaches are able to incorporate
qualitative and heuristic information. Meanwhile, stochastic approach is broadly used when
adequate information is available for calculating probability densities of uncertain variables.
The underlying principles behind these two uncertainty-handling approaches are unlike as it
is illustrated here (Fig. 8). For example, Fig. 8a represents a probability density function
(PDF) of rainfall which is an important input for hydrological modeling, while Fig. 8b
represents a membership function of “rainfall intensity” in terms of intensity of rainfall.
Linguistic variable “rainfall intensity” describe universal sets which may be broken down into
fuzzy words (e.g. low, medium, high etc.) which in turn imply numerical values.

4 Principles for Modeling the New Integrated Approaches
60
Figure 8: Comparison of stochastic (probabilistic) and fuzzy uncertainties (a) probability
density function and (b) fuzzy membership distribution function.
Following are some differences of the probability density and fuzzy membership functions of
a continuous variable (Fig. 8)
The area under the probability density function (PDF) of a variable in an interval is
equal to the probability of the variable assuming any value in the interval, while the
area under the membership function has no especial meaning and can have any
value. Therefore, the total area under the rainfall PDF curve is equal to one because it
is equal to the probability of the random variable assuming any value from - to + .
The area under the rainfall PDF curve in an interval is equal to the probability of
rainfall assuming any value in that interval, but the probability of assuming specific
value is zero (i.e. P(X = x0) = 0).
The probability of a continuous variable being in an interval of insignificant length is
usually zero, while the membership of the same event is usually greater than zero.
The membership function of rainfall intensity can be any value between zero and one
(i.e., µ(X = x1) = 0 ), implying that the rainfall intensity of x1 belongs to some
class of intensity levels like low, medium, high etc. with a possibility of ).
The maximum value of fuzzy membership distribution is one, while the maximum
value of the probability density can be greater than one.

4 Principles for Modeling the New Integrated Approaches
61
Water resources decision-making processes are associated with various uncertainties. For
that reason, modeling of uncertainty for integrated water resources management can be
explicit quantification of probability, possibility and potential unwanted consequences based
on all available information.
In this thesis, the uncertainties associated with interacting physical process, economic,
societal and environmental issues are analyzed using a new fuzzy-stochastic multiple criteria
analysis tool. Uncertainties associated with the criteria related to physical process of coupled
groundwater-agricultural hydrosystems are considered to be probabilistic, while uncertainties
in evaluation criteria associated with socio-economic concerns and parameters associated
with decision makers’ risk taking and risk aversion attitude (optimism degree) are assumed
to be fuzzy in nature. Hence, a fuzzy-stochastic approach was developed for addressing such
complexities and to systematically quantify multiple uncertainties associated with integrated
water resources management.
4.2.2 Basics of Fuzzy Sets and its Operation
Before illustrating solution procedures of a proposed fuzzy-stochastic approach, it is
important to present some basic concepts at first. This section starts with essential basics of
fuzzy set theory, which are based on Zadeh, (1965) and Zimmermann, (2010).
Fuzzy sets
Crisp sets are the sets that have been used quite broadly in classical sets. Crisp sets are
real-valued sets, that is, an element is either a member of the set or not. A membership
degree of 1 is assigned if an element belongs to a set, if not, a membership degree of 0 is
assigned (Eq. 12). If A is a collection of elements (universe) denoted generally by x, then a
subset µA in A is a set of ordered pairs:
A xif0
Axif1)(xA (12)
Fuzzy sets, on the other hand, allow elements to be ‘partially’ in a set, designating a
membership degree to each element. Fuzzy sets can have a membership degree in the
defined interval [0, 1] (Eq. 13). In other words, If X is a collection of elements (universe)
denoted generally by x, and then a fuzzy subset A in X is a set of ordered pairs:
1],0[)(X;x:))(,( AA xxxA (13)

4 Principles for Modeling the New Integrated Approaches
62
where, µA(x) is called the membership function which maps X to the membership space (i.e.,
it represents the membership degree of x in A). Its range is the subset of non-negative real
numbers whose supremum is finite. If µA(x) = 0, then point x does not belong to the fuzzy
set A. A fuzzy set A includes all elements x with µA(x) > 0. Fuzzy set A is a set of n ordered
pairs which can be expressed as follows:
n
A
2
2A
1
1
x
)( ., . .,
)(,
)( nA x
x
x
x
xA
(14)
Fuzzy membership functions are used to graphically represent a fuzzy set. Simple functions
are used to build membership functions, as defining fuzzy concepts using complex functions
dose not add more precision. The most commonly used membership function shapes
include triangular function (Eq. 15) and trapezoidal function (Eq. 16). The two membership
functions are illustrated in Fig. 9.
Triangular membership function may be defined as illustration by a lower limit a, an upper
limit b and a value v, where a < v < b is formulated (Eq. 15) as:
bx0,
bxv,v-b
x-b
vxa,a-v
a-x
ax,0
)(x (15)
Trapezoidal membership function may be defined as illustration by a lower limit a, an upper
limit d, a lower support limit b and an upper support limit c, where a < b < c < d is
formulated (Eq. 16) as:
dxc,c-d
x-d
cxb1,
bxa,a-b
a-x
d)(xor a)(x,0
)(x (16)

4 Principles for Modeling the New Integrated Approaches
63
Figure 9: Triangular and trapezoidal membership functions
Fuzzy Numbers
Fuzzy numbers are a special case of a general fuzzy set. They are normal and convex fuzzy
subsets of the set of real numbers R. A fuzzy set A is called normal, if at least one point of A
has a membership degree µA(x) equal to 1. At the same time, a fuzzy set is convex, if the
membership function consists of an increasing and a decreasing part (i.e., the membership
function does not include local minima). Therefore, fuzzy number A as a subset of the set of
real number R may be defined (Eq. 17) as:
1],0[)(R;x:)(,( AA xxxA (17)
Fuzzy numbers can be seen as a generalization of the usual concept of numbers. As any real
number can be considered as a fuzzy number with a single point support – the support of a
fuzzy set A including all elements x with µA(x) > 0 – is referred to as a crisp number.
Fuzzy Linguistic Variable
A fuzzy linguistic variable may be defined as a variable, whose values are words, phrases or
sentences in a given human language. For example, rainfall intensity can be considered as a
linguistic variable with values such as “very low intensity”, “low intensity”, “medium
intensity”, “high intensity” or “very high intensity” rainfall which entail numerical values
(see also Fig. 10). Describing a particular universal set of real-world using fuzzy linguistic
variables is much easier, given the fact that, fuzzy variables are very close to the nature of
human language. Consequently, real-world decision problems can be, in the first instance,
described intuitively. In addition, since words are usually less precise than numbers,

4 Principles for Modeling the New Integrated Approaches
64
linguistic variables provide a common basis in decision-making process for experts of
different professional backgrounds and suites for participatory modeling.
Figure 10: Linguistic variable “rainfall intensity”
Operations on Fuzzy Sets
In literature, there are three fundamental types of operators applied to fuzzy sets. On the
basis of two fuzzy sets A and B of the universe X and the respective membership functions
µA(x) and µB(x) these operators can be described as:
Operators for the intersection of fuzzy sets (the Min operator): The intersection of two fuzzy sets A and B is BAC . Its membership function is defined by µC(x) = min (µA(x), µB(x)).
Operator for the union of fuzzy sets (the Max operator): The union of two fuzzy sets
A and B is BAD . Its membership function is defined by µD(x) = max (µA(x),
µB(x)).
Complement(negation): the membership function of the complement is defined as:
)(1)(A
__ xxA

4 Principles for Modeling the New Integrated Approaches
65
Ordered Weighted Averaging (OWA) Operator
In addition to the three operators, there is especial aggregation operator called ordered
weighted averaging (OWA), which is a common generalization of the aggregation functions.
OWA was initiated by Yager (1988) and have been widely applied in various fields like
decision theory since then. Yager et al. (2011) recently has reviewed the OWA extensions
and applications. The OWA has been successfully applied to MCDA problems (see for
example, Xu and Da, 2003; Zarghami et al., 2008). The OWA operator, compared to other
aggregating operators is suitable to model optimism degree of decision makers (which is
also known as orness degree). This makes the operator to be an excellent candidate to be
used in ranking competitive alternatives which involves multiple decision makers and criteria.
An n-dimensional OWA operator is a mapping F: Rn R, which has an associated n
weighting vector w = (w1, w2 . . . wn), where, R =[0 , 1], and 1jW . Hence, for given n
input parameters, the input vector is aggregated using OWA operators (Eq. 18) as follows:
n
j
nnjjn bwbwbwbwaaaF1
221121 ...),...,,( (18)
where, F = total performance measure of each alternative and bj is the jth largest element in
the set of {a1, a2,...an} (i.e., evaluations of an alternative with respect to n criteria). It is
important to notice that the inputs of the OWA model are arranged in descending order
before multiplying them by the order weights.
The range of OWA between possible minimum and maximum can be expressed through the
degree of orness (optimism degree) and it depends on the optimism degree of decision
makers. Yager (1988) has defined the optimism degree ( ) (Eq. 19) as follows:
n
j
jwjnn 1
)(1
1 (19)
where,
Optimistic,0.15.0
Neutral,5.0
cPessimisti,5.00
)(degree
Optimism
The optimism degree values may range between zero and one, where zero represents very
risk aversion decision while one refers to very risk taking decision. This value may be
provided by all e DMs using linguistic variables. Optimism degree ( ) may therefore, have

4 Principles for Modeling the New Integrated Approaches
66
three major states in relation to optimistic and pessimistic views of decision makers. When
a decision maker has a pessimistic view about the decision-making process, the optimism
degree is considered as < 0.5, while a decision maker is assumed to have an optimistic
view when > 0.5. The central value ( = 0.5) is considered as neutral (Eq. 19).
Fuzzy linguistic quantifiers are used to quantify the order weights which characterize the
aggregation essentials. Fuzzy linguistic quantifiers are linguistic expression reflecting
perception towards the decision problems. Regular increasing monotonic (RIM) quantifiers
are employed, in this thesis, to model fuzzy linguistic quantifiers. Considering a fuzzy
membership function (µ), an n-dimensional OWA operator can be associated with a RIM
quantifier. Accordingly, the weighting vector can be calculated (Eq. 20) as (Yager, 1996):
njn
j
n
jw j ,...,2,1,
1
(20)
By substituting Eq. 20 into Eq. 19, the optimism degree can be estimated (Eq. 21) as:
n
j
jnn 1
)n
1-j()
n
j()(
1
1 (21)
There are various fuzzy membership function (µ), rr )( with a given positive parameter
α, being one of broadly used form. By expanding the summation in Eq. 21 and after some
simplification:
1
1
)(1
1 n
j n
j
n (22)
Afterwards, substituting r = j/n and computing the limit as n tends to infinity (Eq. 23):
1
0
1
01
1r(r)dr
dr (23)
Finally, substituting 1/1 and combining Eq. 18, 20 and 23, the total performance
measure (F) for each alternative can be estimated (Eq. 24) as:
j
n
j
bn
j
n
jF
1
11
11
1
(24)

4 Principles for Modeling the New Integrated Approaches
67
4.2.3 Ranking Management alternatives
Ranking management alternatives under uncertainty can be achieved based on the
corresponding cumulative density functions (CDFs) of the alternatives. The CDFs of total
performance values associated with the alternatives indicate degree of stochastic
dominance of one alternative over the other.
Mean value, maximum value, mean-plus-standard deviation, and ranking management
alternatives based on the corresponding CDFs are some of the traditional approaches
applied to rank alternatives under uncertainty. Ranking alternatives based on the
corresponding CDFs of decision criteria is most commonly used method (Hyde et al., 2004;
Xu and Tung, 2009; Subagadis et al., 2014b), as it is supposed it contains more information
about the alternatives than the rest. However, the CDFs can provide enough information for
the ranking when only the alternatives considered are monotonically superior or equal to
each other.
In situation where the CDFs are not monotonically superior or equal to each other, as it is in
this thesis, ranking is achieved by conducting pairwise comparison of alternatives under
consideration. The risk of obtaining an unacceptable ranking is used as criteria to rank the
alternatives. Risk in this context is defined according to Kaplan and Garrick, 1981; Tung et
al., 1993 as – probability of having unacceptable ranking multiplied by associated damage.
Where, associated damage is explained as the mean difference of OWA aggregated outputs
for a pair of alternatives. For example, the probability of obtaining an unacceptable ranking
for two alternatives (Ai and Aj) can be given (Eq. 25) as:
)0()( ijrijr aaPaaPP (25)
where, ai and aj are total performance values of Ai and Aj, respectively. Similarly, the risk of
obtaining an unacceptable ranking (expected consequence when A1 is chosen instead of A2)
is defined (Eq. 26) as:
ijijrij MDPR * (26)
where, Rij is the risk of obtaining an unacceptable ranking for the pair of management
alternatives under consideration; MDij is the mean differences of total performance values
between two alternatives; and Prij is the probability of ranking change.

4 Principles for Modeling the New Integrated Approaches
68
For example, considering the model out puts of a1 and a2 have a bivariate normal distribution
),,;,( 2
2
2
121 N (Dudewicz and Mishra, 1988):
2
2
22
2
22
1
11
2
1
11
22
)1(2
1
2
21
21
12
1),(
aaaa
eaaf (27)
where, 2
ii and are the mean and variances, respectively, and is the correlation
coefficient between a1 and a2. Accordingly, the probability of obtaining an acceptable ranking
is thus the volume of the part which is intersected by the plane a1 = a2:
A
a
dadaaafdadaaafP 12212121
1
),(),( (28)
where, A is the projection of the volume in the probability space of a2 < a1.
The ranking of management alternatives are regarded to be appropriate if the risk R is
smaller than an unacceptable risk level for all combinations of measures. The acceptable risk
level can be determined by DMs which in turn allows incorporate uncertainties related with
DMs attitude into the appropriate ranking analysis. To obtain acceptable risk and so that
acceptable ranking in decision-making processes, sensitivity analysis is used to explore the
effect of variation of inputs and model on the ranking.
4.2.4 Sensitivity Analysis of Ranking of Alternatives
Sensitivity Analysis with Respect to Inputs
The total performance values of alternatives are based on the evaluation of performance of
alternatives with respect to criteria and the optimism degree of decision makers. These
inputs are uncertain and the subsequent decision alternatives may be uncertain in various
circumstances as well. Therefore, it is important to simulate the total performance values
with uncertain inputs. To accomplish this purpose, it is important first to identify the input
variables and parameters which mainly determine the uncertainties in the decision-making
process. Accordingly, Morris method (Morris, 1991) is employed to determine the most
important inputs contributing to output uncertainty. The Morris method is based on the
definition of an elementary effect attributable to an input variable and parameter in a region
of experiment. The elementary effect (EE) is the indicator used in the Morris method to

4 Principles for Modeling the New Integrated Approaches
69
evaluate the effect of ith input on the outputs. For a given value of X, the elementary effect
for the ith input is defined (Eq. 29) as
/)](),...,...,([)( 1 XyxxxyXEE kii (29)
where is a predetermined integer representing variations of inputs, X is any selected
value in the region of experiment, k is number of inputs, and y is the output.
The order of influence of inputs are determined after calculating the Euclidean distance
between coordinates of Morris mean and Morris standard deviation (SD) – both calculated
from EE distribution – and the origin (0,0) (Campolongo and Saltelli, 1997). Results of the
analysis imply the larger the distance, the greater the influences of respective inputs are.
Sensitivity Analysis with Respect to the Optimism Degree
The optimistic or pessimistic view of decision makers has a significant effect on the final
water resources management decisions because of the inherent human-water interactions
and human-modified water resources management issues. The OWA operator quantifies the
effect of the optimism degree on the performance value of the alternatives. Conflict of
interest and uncertainties about the consequences of potential management interventions
demand to account a risk in a particular decision. The optimism degrees of decision makers
(risk taking and/or risk aversion attitude) consistently influence how the decision makers
respond to the decision environment. Accordingly, a sensitivity analysis is performed to
further study the impact of decision makers risk taking and risk aversion attitude (optimism
degree) on the total performance values of the alternatives.

70
5 Solution Procedures for BN-Based Decision Support
Tool
5.1 Construction of BN-Based Decision Support Tool
Basic solution procedures to develop the proposed BN-based decision support tool are
illustrated in Fig. 11 and further detailed in the subsequent sections. The development of
BN-based decision support tool with regard to participatory process and expert knowledge
acquisition are presented more thoroughly in the subsequent sections.
After analyzing and characterizing the management options and the resulting decision
problem, appropriate knowledge have to be provided and prepared in a second step. This
knowledge can be obtained from different sources like deterministic or stochastic simulation
model results, empirical knowledge and expert opinion. It forms the basis to develop and to
parameterize a BN model which is focused in this study on decision support for managing an
interacting groundwater-agricultural hydrosystem. In the subsequent steps, the developed
BN-based model is evaluated carefully, before any application of the developed BN model
started for analysis of the decision problem (see Fig. 11).
Drawing upon the lessons learned from Bayesian network basics and following the general
procedure (Fig. 11), a detailed methodological framework for developing a consistent task-
specific BN-based decision support tool has been proposed. Figure 12 and Table 2 shows
the steps involved in the framework. The first step for constructing a task-specific BN model
demands a thorough understanding of variables involved in the decision problem and the
causal links between them. Once identifying the relevant variables for the decision-making
problem, the variables are divided into three groups according to their function in the
network (see also Table 3):
Intervention variables: variables to describe proposed strategies for action that are
introduced to the BN as input variables.
Objective variables: variables used to support the decision-making process of a
considered hydrosystem.

5 Solution Procedures for BN-Based Decision Support Tool
71
Intermediate variables: variables of especial relevance to describe the system for
connecting intervention and objective variables.
Figure 11: General solution procedures for developing Bayesian network (BN)-based
decision support tool
Secondly, required information to define the states of the variables and the input probability
distributions (prior probabilities) has been collected from different data and knowledge
sources. For some variables, results from the simulation-optimization water management
model has been used as input; for other variables, expert knowledge and opinion, as well as
statistical data and scientific reports have been used as input. Finally, these data are
represented in conditional probability tables and fed into the BN. Once the probability of all
linked nodes has been updated by propagating the information through the BN, the objective
variable values are checked for meeting the termination criteria for consistent task-specific
BN. Here, the extent of substantial change on the objective variables’ results has been used
as termination criteria. If the termination criterion is not met, additional data sets from the

5 Solution Procedures for BN-Based Decision Support Tool
72
clustered scenarios are selected randomly and the whole training process is repeated. The
calculation of CPTs from data and inference propagation was performed using software
packages HUGIN ExpertTM (HUGIN Researcher 7.6).
Figure 12: Integrated modeling framework used in the development of BN-based decision
tool
5.2 Data and Knowledge Acquisitions
The aforementioned BN-based decision support tool, illustrated in Fig. 12, consists of: (1)
simulation-optimization integrated water management model, and (2) empirical knowledge
and expert opinion. The simulation-optimization of integrated water management model
comprises: a procedure for developing a groundwater surrogate model which calculates the
aquifer response – Water Resources Module, a procedure for developing an agricultural
surrogate model which simulates the behavior of farms – Agricultural Module, and an
optimization framework for linking both surrogates within a two-step optimization procedure

5 Solution Procedures for BN-Based Decision Support Tool
73
– Optimization Module. In this sub-section details of these knowledge sources have been
explained.
5.2.1 Simulation-Optimization of Integrated Water Management
Model
For simulating the interacting physical processes of a strongly coupled groundwater-
agriculture hydrosystem in arid coastal environments a simulation-based water management
model has been developed (Grundmann et al., 2012). The management model aims at
achieving best possible solutions for groundwater withdrawals for agricultural water use
including saline water management together with a substantial increase of the water use
efficiency by employing novel optimization strategies for irrigation control and scheduling. It
consists of three major modules (Fig. 15), (1) a water resources module for calculating the
aquifer response, (2) an agricultural module for simulating the behavior of farms, and (3) an
optimization module based on evolutionary optimization techniques for managing both,
water quality and water quantity. To achieve a robust and fast operation of the management
model, computationally intensive process-based domain models are emulated by surrogate
models, which describe the behaviour of process models using only their most relevant
features regarding management.
5.2.1.1 The Water Resources Module
The aquifer behavior, including the seawater interface, is modeled by the numerical density
depended groundwater flow model OpenGeoSys (Kolditz et al., 2008). OpenGeoSys was
replaced by an artificial neural network (ANN) which was trained using a scenario database
containing the abstractions and responses of the groundwater model for all realistically
feasible scenarios. The derived surrogate model is referred to as ANN-OGS and applied
within the Water Resources Module of the simulation-optimization integrated water
management model (Fig. 15). The procedure for deriving surrogate model for describing the
aquifer behavior (ANN-OGS) mainly consist the following set up.

5 Solution Procedures for BN-Based Decision Support Tool
74
Figure 13: Procedure for deriving the surrogate model for describing the aquifer behavior
(ANN-OGS) (Grundmann et al., 2012)
In the beginning, the 2D OpenGeoSys model is employed to generate a database containing
the responses of the numerical density-dependent groundwater flow model for all
reasonably possible abstraction scenarios. Abstraction rates Qi for each cultivation period i =
1...n as well as the state variables, average salinity concentration S and water levels h before
(ti-1) and after abstraction (ti), are stored in a scenario database for selected observation
points xk. Concurrently, number of scenarios over 20 years is simulated on a PC-cluster with
the 2D OpenGeoSys model. Afterwards, a multilayer perceptron net (Nabney, 2002) was
used to train an ANN. It was trained using a scenario database containing the responses of
the numerical model. Values of water level and average salinity at 13 given observation
points xk at the beginning of a cultivation period, and abstraction rate over the period is

5 Solution Procedures for BN-Based Decision Support Tool
75
employed as an input (26 input nodes) to the chosen structure of the ANN-OGS. The value
of the same state variables at the end of the cultivation period is provided as an output (25
output nodes) of the ANN-OGS as it is shown in (Fig. 13 and Eq. 34). The developed ANN-
OGS is used in simulation-optimization integrated water management model for optimizing
the groundwater abstraction rates according to a selected objective function (Fig. 15).
5.2.1.2 The Agricultural Module
For simulating the behavior of agricultural farms, a database of 2-dimensional crop water
production functions (2D-CWPF) is generated. 2D-CWPF describes the relationship between
the amount of irrigated water, its salinity and the potential crop yield for each crop assuming
optimal water applications and allows for an appropriate choice of crop patterns regarding
their salinity tolerance. For constructing CWPFs, the OCCASION methodology (Optimal
Climate Change Adaption Strategies in Irrigation; (Schütze and Schmitz, 2010) is used as
shown in Fig. 14, which consist of amongst others the soil-vegetation-atmosphere-transfer
(SVAT)-model APSIM (Keating et al., 2003) – adapted to the regional climate conditions
(Schütze et al., 2012b) – and the GET-OPTIS evolutionary optimization algorithm for optimal
irrigation scheduling and control (Schütze et al., 2012a). The CWPF is further extended by a
second dimension to consider salinity stress through the salinity tolerance index (Steppuhn
et al., 2005). Combining this index with a selected quantile of stochastic crop water
production function (SCWPF) (e.g., the CWPF with 90% reliability), enables to consider the
water quality and allows for an appropriate choice of crop patterns regarding their salinity
tolerance.
The 2D-CWPF, at the start coupled the agricultural production systems simulator (APSIM)
model with the GET-OPTIS, fitting evolutionary optimization algorithm, for optimal irrigation
scheduling so as to schedule optimal irrigation and to calculate the maximum yield for a
given amount of water (Loop 1 in Fig. 14). Afterwards, a single crop water production
function (CWPF) is derived by varying the given amounts of water for irrigation (Loop 2 in
Fig. 14). Consequently, the relationship between the amount of irrigated water and the
potential crop yield is depicted by the CWPF for each crop and season.

5 Solution Procedures for BN-Based Decision Support Tool
76
Figure 14: Procedures for the 2D-crop-water-production function (2D-CWPF) (Schütze and
Schmitz, 2010 and Schütze et al., 2012b)
In order to obtain more robust irrigation schedules different realizations of local weather
characteristics are included through Monte Carlo simulation (Loop 3 in Fig. 14). This helps to

5 Solution Procedures for BN-Based Decision Support Tool
77
enhance agricultural production with certain reliability. The LARS-WG, a stochastic weather
generator, based on the series approach with a detailed description given in (Semenov et
al., 1998) is used to produce synthetic weather characteristics like: daily time series of
precipitation, maximum and minimum temperature and solar radiation. Synthetic weather
variables are produced on the basis of historic observed data. The weather generator uses
observed data for a given site to determine a set of parameters for probability distributions.
Subsequently, Each synthetic weather realization results in a single CWPF and SCWPF
described by empirical joint probability function resulting from a statistical analysis of the
whole set of single CWPFs.
The SCWPF is further extended to include the irrigation water quality using the salinity
tolerance index which helps to incorporate salinity stress. Combining the salinity index and
SCWPF provides a 2D-SCWPF additional capability to guide selection of appropriate crop
pattern regarding their salinity tolerance. The SCWPF gives general practical irrigation
schedules which may attain a certain amount of yield with a given reliability taking climate
variability into account. By defining certain reliability levels (e.g., the CWPF with 90%
reliability), i.e., a given quantile, it is possible to derive conditional 2D-CWPF0.9. Finally,
functional relationships for defined soils, irrigation methods, crop patterns and optimal
irrigation schedules are formulated with 2D-SCWPF and results have been applied within the
agricultural module of the simulation-optimization integrated water management model
(Fig. 15).
5.2.1.3 The Optimization Module
The simulation-optimization integrated water management model, shown in Fig. 15, is
intended to solve the essential optimization problems, to be exact:
The incorporation of process model and their interactions within the optimization
procedure.
The use of contradicting objective functions applied in different time scope, such as
sustainable aquifer management in relation to saltwater intrusion dynamics vs. Short
term agricultural profit.
Simultaneous consideration of both water quantity and quality with the optimization
procedure.

5 Solution Procedures for BN-Based Decision Support Tool
78
The optimization module connects the water resources module and agricultural module and
aims for managing both – water quantity and quality – according to the given optimization
problem. Both modules are extended by different cost models to allow for an economical
evaluation of several management strategies. The formulated optimization problem is of
multi-objective type and considers a sustainability index (SI) as first objective function of1
(Eq. 30) and a second objective of2, which refers to the profit of the agricultural production
(Eq. 31).
Figure 15: Simulation-optimization integrated water management model for coupled
groundwater-agriculture systems consisting of water resources module, agricultural module
and optimization module” (for details see also Grundmann et al., 2013)
The sustainability index describes the stability of water balance and distribution of the salt
concentration in the groundwater system. The index evaluates the change of the aquifer
state between the final state tn and the initial state t1 of the simulation period using the
average salinity concentration S and the water level h on xk observation points. In this
procedure a smaller sustainability index value indicates more stable aquifer system.
end
k
knkend
k
knk
nh
xthxthabs
S
xtSxtSabstof
1 max
1
1 max
1
1
)),(),(()),(),(()( (30)
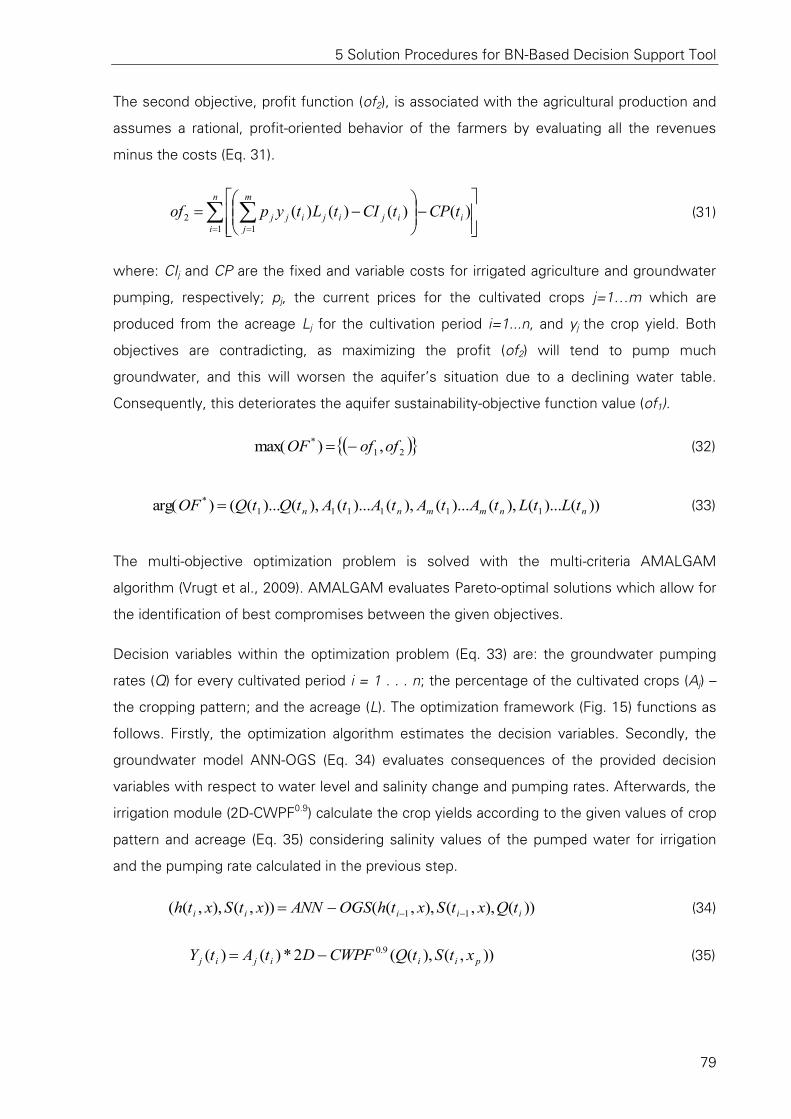
5 Solution Procedures for BN-Based Decision Support Tool
79
The second objective, profit function (of2), is associated with the agricultural production and
assumes a rational, profit-oriented behavior of the farmers by evaluating all the revenues
minus the costs (Eq. 31).
n
i
i
m
j
ijijijj tCPtCItLtypof1 1
2 )()()()( (31)
where: CIj and CP are the fixed and variable costs for irrigated agriculture and groundwater
pumping, respectively; pj, the current prices for the cultivated crops j=1…m which are
produced from the acreage Lj for the cultivation period i=1...n, and yj the crop yield. Both
objectives are contradicting, as maximizing the profit (of2) will tend to pump much
groundwater, and this will worsen the aquifer’s situation due to a declining water table.
Consequently, this deteriorates the aquifer sustainability-objective function value (of1).
21
* ,)max( ofofOF (32)
))()...(),()...(),()...(),()...(()arg( 111111
*
nnmmnn tLtLtAtAtAtAtQtQOF (33)
The multi-objective optimization problem is solved with the multi-criteria AMALGAM
algorithm (Vrugt et al., 2009). AMALGAM evaluates Pareto-optimal solutions which allow for
the identification of best compromises between the given objectives.
Decision variables within the optimization problem (Eq. 33) are: the groundwater pumping
rates (Q) for every cultivated period i = 1 . . . n; the percentage of the cultivated crops (Aj) –
the cropping pattern; and the acreage (L). The optimization framework (Fig. 15) functions as
follows. Firstly, the optimization algorithm estimates the decision variables. Secondly, the
groundwater model ANN-OGS (Eq. 34) evaluates consequences of the provided decision
variables with respect to water level and salinity change and pumping rates. Afterwards, the
irrigation module (2D-CWPF0.9) calculate the crop yields according to the given values of crop
pattern and acreage (Eq. 35) considering salinity values of the pumped water for irrigation
and the pumping rate calculated in the previous step.
))(),,(),,(()),(),,(( 11 iiiii tQxtSxthOGSANNxtSxth (34)
)),(),((2*)()( 9.0
piiijij xtStQCWPFDtAtY (35)

5 Solution Procedures for BN-Based Decision Support Tool
80
At last, the sustainability index (Eq. 30) and the net profit (Eq. 31) are calculated
incorporating regional specific cost models for irrigated agricultural production and the
groundwater abstraction. The optimization algorithms for the multi-objective problem which
has interactive simulations over improved estimates of the decision variables, allow for a
successive approximation of the true Pareto-front.
5.2.1.4 Pareto-front clustering for Selection of Management Scenarios
Analysing the shape of the Pareto-front helps decision makers to understand the solution
space and to identify possible trade-offs among the conflicting objectives. However, as the
Pareto-optimal solution consists of a large data set (i.e., 100s of potential solutions), it
remains a significant challenge for decision makers to interpret. Hence, in this thesis, Post-
Pareto-optimal analysis has been used to cluster the Pareto-optimal solutions, as it is
detailed in section 4. 2. These clusters are further employed for scenario development,
parameterization and interpretation of the model results.
5.2.2 Empirical Knowledge and Expert Opinion
Developing a BN-based decision support tool allows for participatory modeling process and
integrating different type of knowledge from diverse sources (see Fig. 4 and 11). This
knowledge and information can be obtained from deterministic or stochastic simulation
model results, empirical knowledge and expert opinion. Empirical knowledge comprises
information from surveys, literature, reports or census data. Meanwhile, expert opinion (or
knowledge) refers to subjective professional judgments. Professional judgment is needed
when there is a lack of objective data. Expert knowledge becomes an important asset in the
formal elicitation of the BN model structure, selection of variables and their states,
conditional probability and validation of the BN. Table 2 shows the details of participatory
process and expert knowledge acquisition in the development of BN-based decision support
tool.
Expert knowledge acquisition and participatory processes in this research for the
development of BN-based decision support tool began with a selection of relevant
stakeholders, a series of stakeholder meetings and follow up works as it is described in
Table 2. Key steps in the process have been defined based on previous studies that had a
more specific focus in participatory integrated modeling. In this case, the process was
structured following the guidelines laid by Cain (2001) and Bromley et al. (2005).

5 Solution Procedures for BN-Based Decision Support Tool
81
Table 2: Participatory process and expert knowledge acquisition in the development of BN-
based decision support tool
Key steps and meetings
Tasks Expected results Follow up
Understanding of the system
Name the most relevant variables in the system
Preliminary networks (at least two)
Establish a single preliminary network; identify the required data and its potential sources (model results, empirical knowledge, etc.)
Definition of variables and states
Validate the paramilitary network, Check the relevance of variables and states
Validation of the network and the states of variables as well as sources of data
Modify the BN structure based on the communications. Collect the data according to the sources, physical process model results and expert inputs. Start construction of CPTs
Validation of the BN structure and data completion
Check the latest changes in the network. Define the probabilities of the states of each variables
Validation of network structure. Expert input to set CPTs
Adapt variable values according to results; complete the CPTs using model results and expert and empirical inputs. First round of simulations
Validation of preliminary results
Verify, collect feedback and evaluate initial results
Evaluation of the initial results
Modify some data in the BN according to results
Final evaluation
Presentation of final results and evaluation
Evaluation of modeling results and participatory process
This research benefits from stakeholders’ participation within the frame of the IWAS-Project
(International Water Research Alliance Saxony) which aimed to closely collaborate with local
stakeholders. The modeling process took place between 2012 and 2014 but also profited
from modeling and data collection within the entire project life. Several workshops have
been performed together with experts of involved governmental agencies, local
organizations and universities with interest in the Oman’s costal hydrosystem and its future.
These discussions have contributed to get insights on obtaining professional judgments (in
terms of expert opinion) regarding the management intervention variables and involved
hydrosystem processes.
Furthermore, empirical knowledge has been obtained from reviews of relevant information
sources like FAO’s Information system on Water and Agriculture (AQUASTAT) (FAO, 2013)
and water resources reports (MRMWR, 1998).

5 Solution Procedures for BN-Based Decision Support Tool
82
5.3 Uncertainty and Performance Evaluation of BN-Based Decision
Support Tool
The results of inference obtained by using a particular BN-based model are not assured to be
stable with respect to small changes in the model. Validating a BN-based model involves,
testing the reasoning accuracy based on the model, evaluating the model’s performance
robustness and evaluating the model’s tolerance to noises etc. The model’s performance
robustness and noise tolerance are very much related and can be explored using sensitivity
analysis. In Bayesian networks, sensitivity analysis is employed to investigate the effect of
the small changes of the numeric parameters on a BNs performance. Performance relates
to how well a BN model diagnoses the accuracy of model results, while BN model
uncertainty relates to the distribution of posterior probability (output probability or state
variables with calculated values) values among different outcome states. Therefore, it may
be desirable to obtain low sensitive, i.e., ideal best model would have high performance and
low uncertainty that can well represent the domain knowledge. To address BN-based model
performance and uncertainty, in this thesis, sensitivity analysis, Influence analysis, and
posterior probability certainty assessment index have been used as metrics to investigate
BN-based model performance built for diagnosis of coupled groundwater-agricultural
hydrosystem. The detailed application procedure and their theoretical background regarding
the particular metrics have been described in chapter 4 (section 4.1.4 – 4.1.7).

83
6 Solution Procedures for Fuzzy-Stochastic Multiple
Criteria Decision Analysis Tool
Water resources management decisions can be complex because of the inherent
interactions and associated feedbacks among hydrological, economic, societal and
environmental issues. Such complexities are further compounded by multiple actors
frequently with conflicting interests and uncertainties about the consequences of potential
management decisions. This necessitates the water resources management decisions to be
analyzed as a multiple criteria multiple stakeholder decision problem subject to multiple
uncertainties. Previously, in chapter (section 3.2) relevant literatures regarding
implementation of water resources decision-making under multiple uncertainties with
various source of knowledge were reviewed.
It has been found from the review, that stochastic and fuzzy-set approaches have been
employed in various forms to accommodate uncertainties in water resources decision-
making processes. However, most of the previous studies have only dealt with
homogenous information at a time, lacking the capability to handle heterogeneous
information (Li et al., 2007; Subagadis et al., 2014b). In addition, there have been few
studies to successfully linking different types of uncertainties in water resources decision-
making in a single operational framework. This in turn, limits flexibility of the methods and
may result in an information gap, as in real-world decision-making, we are confronted with
diverse information and multiple uncertainties. This is because different information qualities
exist for various criteria and parameters. For example, uncertainties associated with physical
process (e.g., salinity) may be best described by probability distributions, while uncertainties
in societal and environmental criteria may be fuzzy in nature (e.g., salinity risk level). It is
imperative therefore efforts to be made to develop advanced modeling approaches that can
handle diverse knowledge and multiple uncertainties.
Therefore, as an extension of the prior efforts, in this section of the thesis, fuzzy-stochastic
multiple criteria decision analysis tool, that can accommodate diverse knowledge and
quantify both fuzzy and probabilistic uncertainties associated with physical processes,
economic, environmental and social criteria have been developed.

6 Solution Procedures for Fuzzy-Stochastic Multiple Criteria Decision Analysis Tool
84
The new approach is intended to systematically quantify both types of uncertainties (fuzzy
and probabilistic) through integration of physical model results, fuzzy logic, stakeholder
inputs, and stochastic simulation. The proposed fuzzy-stochastic multiple criteria decision
analysis tool is then applied to management of coupled groundwater-agricultural
hydrosystem which is affected by excessive groundwater withdrawal from the coastal
aquifer (the Al-Batinah coastal region in Oman) for irrigated agriculture and resulted to an
intrusion of marine saltwater threatening environmental stability and socio-economic
activities of the local community.
6.1 Fuzzy Approach
In realistic decision problems, it is understandable that much knowledge is not often crisp.
Since human judgment and/or preferences could be vague and can not always be estimated
as crisp values. The fuzzy set theory first introduced by Zadeh (1965) and detailed in
preceding section is thus used to deal with imprecise (non crisp) data and rationality of
uncertainties. Fuzzy sets are well suited to represent the imprecise nature of judgments,
such as linguistic terms used by human expert. Linguistic variables whose values are
expressed in linguistic terms have been used to express the optimism degree of decision
makers and to evaluate qualitative information. In this thesis, fuzzy triangular membership
function is employed to evaluate fuzzy and/or qualitative information regarding performance
rating of subjective criteria, as well as decision makers position concerning the decision-
making processes.
In this thesis, a positive triangle fuzzy number defined by its membership function µ(x) (Eq.
36) is applied for further working out:
otherwise
axaaaxa
axaaaax
x ijijijijij
ijijijijij
,0
),/()(
),/()(
)( 32233
21121
(36)
where aij1, aij2 and aij3 refer to the minimum, most likely, and maximum values, respectively.
6.2 Stochastic Approach
In stochastic approach, probability distributions are used to describe natural variability and
randomness associated with input parameters. These distributions are then propagated to
the output variables through mathematical models using statistical sampling. The Monte

6 Solution Procedures for Fuzzy-Stochastic Multiple Criteria Decision Analysis Tool
85
Carlo simulation (MCS) is a dominant tool to address variability and uncertain phenomena,
given statistical estimates of available information. Various probability distributions can be
used to model uncertainty of input variables and parameters making a link with Monte Carlo
simulation. Stochastic approach is widely used when sufficient information is available (e.g.,
from modeling of physical processes) for estimating the probability distribution of uncertain
parameters.
In the development of the proposed fuzzy-stochastic multiple criteria decision analysis tool, a
stochastic modeling approach has been developed by incorporating a Monte Carlo
simulation within the OWA aggregation operator which can calculate total performance
measure of each alternative. Thus, a stochastic modeling has been implemented with the
following procedure: (a) generate random numbers for each input parameters (2) for each
parameter, a specified statistical distribution is used to transform the random numbers to
corresponding random variates (c) the generated random variates is stored in an array for
each parameter (d) random variates values for each parameter obtained from the array are
used as deterministic input to OWA operator (e) estimate total performance measure for
each Monte Carlo run for each alternative (f) the resulting outputs for each Monte Carlo run
are stored for further analysis (g) repeat steps (a)-(f) for a given number of Monte Carlo runs
and (h) analyze the total performance of each alternative and compute cumulative
probability distribution and associated statistical moments of the alternatives.
6.3 Fuzzy-Stochastic Approach
As it has been discussed in the previous sections (3.2, 6.1 and 6.2) water resources
management decision-making analysis using either fuzzy or stochastic approach may lead to
potential shortcomings (Li et al., 2007; Zagonari and Rossi, 2013). At the outset, using
stochastic approach requires that input information should be precisely specified; however,
in many real-world applications the available information is imprecise. In addition, human
experts tend to use linguistic terms to express their judgments regarding the decision-
making process, as well as to formulate qualitative information for when there is lack of
quantitative knowledge. The proposed fuzzy-stochastic modeling approach is intended to
capturing quantitative, as well as fuzzy and/or qualitative information which can be used in
decision-making process and to systematically quantify associated multiple uncertainties
(both fuzzy and probabilistic). Figure 16 illustrates a schematic of a new fuzzy-stochastic
multiple criteria decision analysis tool.

6 Solution Procedures for Fuzzy-Stochastic Multiple Criteria Decision Analysis Tool
86
The approach is presented in a set of major five steps (Fig. 16). The first step involves
characterizing the decision problem. The actors and stakeholders involved in the decision-
making process translate appropriate management decisional issues into set of criteria and
management alternatives. In the second step, performances of criteria representing diverse
issues in terms of economic, social and environmental dimensions are evaluated with
respect to the alternatives. An integrated simulation-optimization water management model
is employed to optimize interacting physical process and to evaluate criteria derived from the
process. Meanwhile, fuzzy and/or qualitative information regarding subjective criteria are
evaluated in linguistic terms. The triangular distribution is adopted to approximate the
probability density distribution of the linguistic assessment.
Afterwards, the simulation-optimization and linguistic assessment results are regarded as
input values into the Monte Carlo simulation. The Monte Carlo simulation generates
probabilistic decision matrix of alternatives versus criteria in an uncertain environment.
Based on these results, total performance of the alternatives is aggregated using the OWA
operator and management alternative with the highest total performance is identified.
Finally, candidate management alternatives under uncertainty are ranked-based on the total
performance and afterwards, sensitivity of management alternative ranking to different
uncertainty is investigated. The details of these procedures are explained further as follows
(see also Fig.16):
Step 1: The first step of the proposed approach involves characterization of the decision
problem into a set of alternatives and evaluation criteria. Alternatives and criteria are
generally developed by actors and stakeholders involved in water resources management
decision-making through collective discussion (see also section 5.2).
A group of e decision makers (DMs) and/or experts (d = 1…e) determine the relevant m
alternatives, Ai (i = 1...m), under each of n criteria Cj (j = 1…n). As DMs may be not equally
important in the decision-making process it is important to consider degree of importance
for each DM. For instance, assuming degree of importance of DMs as Id = (Id1, Id2, Id3), if I1 =
I2 = ... = Ie, it indicates that all DMs play same role in group decision-making process.
Step 2: Evaluate performance values that are assigned to each criteria with respect to each
alternative. These values may be obtained from models (e.g., integrated simulation-
optimization model), or through empirical knowledge and expert judgment based on nature
of criteria and availability of information.

6 Solution Procedures for Fuzzy-Stochastic Multiple Criteria Decision Analysis Tool
87
Figure 16: Flow chart of the proposed fuzzy-stochastic multiple criteria decision analysis
For example, for simulating the interacting physical processes of a strongly coupled
groundwater-agricultural hydrosystem, simulation-optimization model can be employed to
enumerate criteria derived from the processes. The simulated results can then be used to
define an independent probability density function (PDFs) for the corresponding criteria.
On the other hand, decision-makers and/or experts evaluate performance value of subjective
criteria using linguistic variables instead of crisp values. Linguistic variables are variables
whose values are given in linguistic terms. For example, these values for the ratings may
contain variables like, very poor (VP), poor (P), fair (F), good (G), and very good (VG). These

6 Solution Procedures for Fuzzy-Stochastic Multiple Criteria Decision Analysis Tool
88
linguistic variables are represented by corresponding triangular fuzzy numbers. Relations
between linguistic variables and fuzzy numbers used for the evaluation of criteria with
respect to the alternatives are shown in Fig. 16a. For sake of simplicity and as it is
commonly used in engineering and management, triangular fuzzy numbers are used for this
work among different fuzzy numbers (Chou et al., 2008). The minimum, most likely, and
upper bound values of performance of subjective criteria are provided by the geometric
mean technique. Accordingly, triangular fuzzy number (aij1, aij2, aij3) for representing group
performance rating of subjective criteria with respect to each alternative by all e DMs are
aggregated using Eq. 37 to reflect the group attitude.
(37)
where, x1ij, x2ij,.......,xeij are the performance rating of alternative Ai provided by each decision
maker.
Step 3: As it has been discussed in (section 6.3), decision makers’ optimism degree ( )
regarding decision-making process is evaluated in this step. Optimism degree of DMs refers
to the level of confidence that DMs do have towards the general decision-making process of
the decision problem and process of prioritizing a set of management alternatives. The
optimism degree values may range between zero and one, where zero represents very risk
aversion decision while one refers to very risk taking decision. This value is provided by all e
DMs using linguistic variables using triangular fuzzy numbers illustrated in Fig. 17b. The
values are aggregated by the geometric mean technique (Eq. 38) to reflect group attitude.
Minimum, most likely and maximum values are represented by triangular fuzzy numbers
),,( 321 , respectively (see also Fig. 16).
(38)
33232313133
/1
1
222
11212111111
,...,,max
,
,,...,,min
ee
ee
d
dd
ee
III
I
III
33322331133
/1
1
222
112211111
,....,,max
,
,,....,,min
eijeijijij
ee
d
dijdij
edieijijij
xIxIxIa
xIa
xIxIxIa

6 Solution Procedures for Fuzzy-Stochastic Multiple Criteria Decision Analysis Tool
89
Step 4: Perform Monte Carlo simulation (MCS) as it is detailed in section (5.5). As described
earlier step1, step 2 and step 3, model results and expert assessments are used to define
different PDFs describing performance of different criteria and input parameters. Afterwards,
these PDFs drawn from model results and fuzzy triangular numbers are regarded as input to
the Monte Carlo simulation. The Monte Carlo simulation generates probabilistic decision
matrix of alternatives versus criteria. Once MCSs are performed, aggregation for each
realization is calculated using the order weighted averaging (OWA) operator to determine
CDFs of each alternative (see Fig. 16).
Step 5: Data aggregation using OWA operator is presented in detailed in (section 6.3). The
total performance value for each alternative under stochastic environment is calculated using
OWA operator. OWA as an aggregation operator was initiated by Yager (1988) and since
then has been applied extensively. The range of OWA between possible minimum and
maximum value can be expressed through the orness degree (optimism degree) and it
depends on the optimism degree of decision makers. In this work the fuzzy quantifiers of
the form as shown in Fig. 17b are used in questioning group of DMs as it is detailed in step
3 (see also Fig. 16).
The total performance measure of each alternative using OWA is calculated using Eq. 24 as
it is derived in (section 6.3). An alternative with highest total values is considered to be most
satisfying alternative. This calculation is repeated for number of MCS realizations and the
CDF describing the overall performance of each alternative is developed.
Step 6: Ranking of alternatives and sensitivity analysis. Repeating step 4 and 5 for a number
of iterations (e.g., 1000), the overall total performance of alternatives can be obtained and
plotted as CDFs.
Mean value, maximum value, mean-plus-standard deviation, and ranking management
alternatives based on the corresponding CDF are some of the traditional approaches applied
to rank alternatives under uncertainty. Ranking alternatives based on the corresponding
CDFs of decision criteria is most commonly used method (Hyde et al., 2004; Xu and Tung,
2009; Subagadis et al., 2014b), as it is supposed it contains more information about an
alternative than the rest. However, the CDFs can provide enough information for the ranking
when only the alternatives considered are monotonically superior or equal to each other.

6 Solution Procedures for Fuzzy-Stochastic Multiple Criteria Decision Analysis Tool
90
Figure 17: Membership spread of linguistic scales (a) for evaluation of subjective criteria
with respect to alternatives (b) for evaluation of optimism degree of DMs.
6.4 Sensitivity Analysis
In situation where the CDFs are not monotonically superior or equal to each other, as it is in
this thesis, ranking is achieved by conducting pairwise comparison of alternatives under
consideration. The risk of obtaining an unacceptable ranking is used as criteria to rank the
alternatives. The acceptable risk level can be determined by DMs this in turn allows to
incorporate DMs attitude to uncertainties into the appropriate ranking. To obtain acceptable
risk and so that acceptable ranking in decision making process, sensitivity analysis is used to
explore the effect of variation of inputs and model on the ranking as it is discussed in
chapter 4 (section 4.2 and see also Fig.16).
The optimistic or pessimistic view of decision makers has a significant effect on the final
water resources management decisions because of the inherent human-water interactions
and human-modified water resources management issues. The OWA operator quantifies the
effect of the optimism degree on the performance value of the alternatives. Conflict of
interest and uncertainties about the consequences of potential management interventions
demand to account a risk in a particular decision. The optimism degrees of decision makers
(risk taking and/or risk aversion attitude) consistently influence how the decision makers
respond to the decision environment. Accordingly, a sensitivity analysis is performed to
further study the impact of decision makers’ risk taking and risk aversion attitude (optimism
degree) on the total performance values of the alternatives.

6 Solution Procedures for Fuzzy-Stochastic Multiple Criteria Decision Analysis Tool
91
To obtain acceptable ranking as perceived by DMs, in decision-making process sensitivity of
different sets of input values to resulting ranking has been also investigated (see also
application section 7.3).

92
7 Application: Integrated Modeling Approach for
Supporting Management Decisions of Coupled
Groundwater-Agricultural Systems (Oman)
7.1 Study Site and Decision Problem
A real-world water management problem implemented in this thesis refers to a typical
situation of a coastal agricultural region in an arid environment. Arid and semi arid regions –
which receive relatively low overall amounts of precipitation in the form of rainfall or snow –
cover approximately 40% of the Earth’s land area, and support 2 billion people, 90% of
whom live in developing countries (UN, 2011). Water scarcity, over-exploitation of
groundwater, incomplete information about groundwater recharge, inefficient irrigation and
saltwater intrusion in coastal areas are among typical water-related problems in those
regions. These challenges are further exacerbated by climate change and ever increasing
population.
The study is oriented on the specific situation of the Al-Batinah region in northern Oman. It is
intended to contribute towards the development of integrated water resources'
management strategies for an agricultural coastal plain which is being affected by saltwater
intrusion driven landward due to excessive groundwater extraction for irrigated agriculture,
threatening the economic basis and associated social activities.
The general description of the study area is shown in Fig. 18, indicating wadis (intermittent
streams) originating from the Hajar Mountains and running into the coast, artificial recharge
dams and a number of groundwater abstraction wells. The study area covers an area of
about 2460 km2 which extends over some 30km broad coastal plain bordered by the Gulf of
Oman (the Sea of Oman) and the Hajar Mountains.
The Al-Batinah represents one of the major settlement areas in Oman (with almost 65% of
the nation’s population (ca. 800,000 inhabitants)) living in this region. In addition, one-third of
economically active population of the nation is working in the agriculture sector underlying
its importance for the society. As soils are especially fertile in the coastal plain, agriculture
plays an important role in this region. This in turn led most of the available water resource to
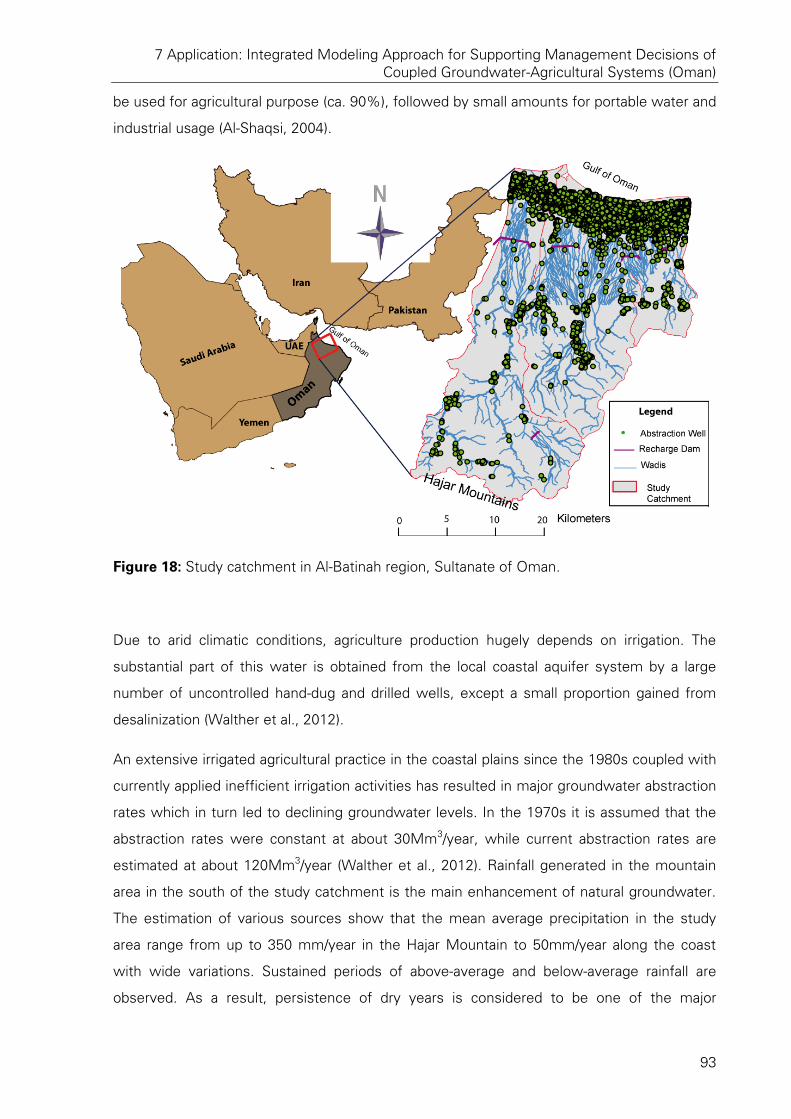
7 Application: Integrated Modeling Approach for Supporting Management Decisions of Coupled Groundwater-Agricultural Systems (Oman)
93
be used for agricultural purpose (ca. 90%), followed by small amounts for portable water and
industrial usage (Al-Shaqsi, 2004).
Figure 18: Study catchment in Al-Batinah region, Sultanate of Oman.
Due to arid climatic conditions, agriculture production hugely depends on irrigation. The
substantial part of this water is obtained from the local coastal aquifer system by a large
number of uncontrolled hand-dug and drilled wells, except a small proportion gained from
desalinization (Walther et al., 2012).
An extensive irrigated agricultural practice in the coastal plains since the 1980s coupled with
currently applied inefficient irrigation activities has resulted in major groundwater abstraction
rates which in turn led to declining groundwater levels. In the 1970s it is assumed that the
abstraction rates were constant at about 30Mm3/year, while current abstraction rates are
estimated at about 120Mm3/year (Walther et al., 2012). Rainfall generated in the mountain
area in the south of the study catchment is the main enhancement of natural groundwater.
The estimation of various sources show that the mean average precipitation in the study
area range from up to 350 mm/year in the Hajar Mountain to 50mm/year along the coast
with wide variations. Sustained periods of above-average and below-average rainfall are
observed. As a result, persistence of dry years is considered to be one of the major

7 Application: Integrated Modeling Approach for Supporting Management Decisions of Coupled Groundwater-Agricultural Systems (Oman)
94
challenges for effective water resources management. The approximated recharge from the
mountains into the aquifer system is only 50Mm3/year (Gerner et al., 2012). Significant
disproportion in the current abstraction rate (ca.120Mm3/year) and replenishment level (ca.
50Mm3/year) led to a considerable negative water balance since late the 1970s followed by
an alarming decline of groundwater levels accompanied with saltwater intrusion into the
coastal aquifer (Walther et al., 2012). Continuous decline in groundwater levels cause the
natural groundwater gradient to reverse leading to intrusion of seawater into the aquifer and
consequent gradual soil salinization. Particularly in the coastal plain of the study area, shallow
wells of small farms and household run dry, to the extent that people abandon their farms
and therewith endangering associated socio-economic conditions as well as traditional social
structure.
Some management interventions have been already undertaken by the government in order
to improve the situation. Exemplarily, these interventions refer either to the water resources
side by building artificial groundwater recharge dams in order to use surface water runoff
more efficiently for recharging the aquifer or to the water demand side by implementing
measures like stop of drilling new wells or shifting the cultivation of fodder crops with high
water demands more inland. However, the situation remains still worse and may require
more drastic management interventions which may range between the extremes of
stopping all agricultural activities in order to recover the local aquifer system or producing as
much as possible as long as water and soil resources will be available (sustainable aquifer
vs. high profitable agricultural production). Due to the nonlinear behavior of the coupled
physical processes of the coastal aquifer-agriculture hydrosystem and its interactions with
numerous decision makers (farmers, governmental agencies, etc.), which have different,
sometimes contradicting, interests and views on how to manage the system in the best
way, the decision-making problem is very complex. Finally, only a combination of different
measures or management interventions will yield to an improvement of the situation.
Based on the description and discussion above, the following conclusions can be drawn
regarding the water resources management in this setting:
Management of the interacting groundwater-agricultural hydrosystems has to
consider different socio-economic and environmental issues as well as viewpoints of
involved stakeholder in addition to the physical processes.

7 Application: Integrated Modeling Approach for Supporting Management Decisions of Coupled Groundwater-Agricultural Systems (Oman)
95
Presence of incommensurable and conflicting objectives inherent in the coupled
groundwater-agricultural hydrosystems require the development of tools that have
the capability to integrate diverse knowledge in a unified operational framework to
support the decision-making process of finding appropriate management
interventions or policies under uncertainty.
We do not know everything how different interacting processes (hydrological,
economic, social and environmental) and their feedbacks work, and that even if we
do know how things work, it is highly likely they are going to change. This implies
learning should be embodied in managing coupled groundwater-agricultural systems
in a way that to build social learning so that shared agreement and trust among
society to act collectively in addition to understanding how things work.
To contribute towards here above discussed water resources management decision
problems and to achieve the intended goals, the two new integrated modeling approaches
proposed in this thesis in the preceding sections – BN-based decision support tool (chapter
5) and fuzzy-stochastic multiple decision analysis tool (chapter 6) – have been implemented
in the study area and are presented in the following sections.
7.2 BN-Based Decision Support Tool Application
An application is performed to demonstrate the functionality of the proposed approach – BN-
based decision support tool – for evaluating the efficiency as well as the uncertainty about
the consequences of plausible hydrosystem management strategies. The application
investigates the linkage and feedbacks between hydrological and socio-economic
interactions by a complementary application of coupled component models and BN model
for a typical management problem of the coastal agricultural region (see section 7.1). More
specifically, the management problem refers to the coastal aquifer used for agricultural
production which is affected by saltwater intrusion due to excessive groundwater extraction
for irrigation. This in turn led to a conflict of interest among various water actors as well as
uncertainties about the impacts of different water management interventions. The following
interventions and their combinations are investigated exemplarily for a hypothetical farm or
demand region located in the vicinity of the sea: (1) climate conditions and artificial recharge
which refer to the water resources side, and (2) implementation of water quotas and
subsidies which refer to the water demand side.

7 Application: Integrated Modeling Approach for Supporting Management Decisions of Coupled Groundwater-Agricultural Systems (Oman)
96
The application procedures of BN-based decision support tool may be summarized into three
major steps (see also chapter 5):
The conceptualization of the linkage among variables impacting the hydrosystem
within a task-specific Bayesian network model by expanding coupled component
physical process model results with additional empirical knowledge.
The simulation of interactions and feedbacks of the strongly coupled groundwater-
agriculture-hydrosystem and its multi-criteria optimization within an integrated
simulation-optimization water management model.
The implementation of the task-specific Bayesian network model to investigate
different combinations of management interventions for supporting a decision-
making process.
7.2.1 Setup of the BN Application
Within the described modeling framework detailed in section 5.1, the BN has been used to
present the linkage between hydrological and socio-economic interactions for a typical
management problem of agricultural coastal arid regions at a farm scale combining the
knowledge obtained from simulation-optimization water management model and different
empirical data sources. The BN has been trained for each management scenario using the
data sets from the Pareto-optimal clusters, and additional data obtained from expert
knowledge as well as empirical data.
In the application, the interest has been to assess the impact of plausible hydrosystem
management strategies on three intended management goals in the study area: (1) net profit
(dollar/ha year), (2) direct agricultural employments (employments/ha year), and (3)
sustainability of the hydrosystem represented as sustainability index (SI) – given the
knowledge of several intervention and intermediate variables that are expected to influence
the hydrosystem (see also Table 3). Accordingly, a BN model at a farm scale has been
constructed comprising the following variables: sustainability of hydrosystem, variation of
aquifer levels, groundwater quality, ground water extraction rates, extent of water quotas,
aquifer recharge, irrigation water demand, aquifer artificial recharge, incentive tools,
cultivated acreage, climate conditions, total costs comprising fixed and variable irrigation
pumping costs, annual agricultural income, direct agricultural employment, and crop pattern.

7 Application: Integrated Modeling Approach for Supporting Management Decisions of Coupled Groundwater-Agricultural Systems (Oman)
97
Table 3: Variables used in the Bayesian Network (BN) model development and their
definitions
Group Name of variables Explanations Source of information
Intervention variables
Incentive tools Percentage reduction of agricultural water use using subsidizing irrigation equipments & training farmers
Expert opinion
Artificial recharges Percentage of annual aquifer recharge from artificial aquifer recharge schemes
Empirical knowledge
Climate conditions Percentage change from normal scenarios
Expert opinion
Water quotas Percentage of water use reduction through implementing a water quota system
Expert opinion
Intermediate variables
Crop pattern Percentage of crop fractions Model results
Aquifer recharge Amount of recharge in Mm3/year Empirical knowledge Irrigation water demand Amount of irrigation water (mm) Model results Groundwater extraction Amount of groundwater extraction rates
in Mm3/year Model results
Variation of water table levels
Water table drawdown in (m) Model results
Groundwater quality Salinity (dS/m) Model results Cultivated acreage Area of farm in use (ha) Model results Costs Total cost for pumping & irrigation
(consisting variable and fixed costs) in ($ /year)
Model results
Objective variables
Net profit Total agricultural net profit ($ / ha year) Model results
Sustainability of the hydrosystem
Sustainability index (SI) Model results
Direct agricultural employment
Total number of employments / ha year Empirical knowledge
7.2.2 Setup of the Simulation-Optimization Water Management
Model for Coupled Groundwater-Agriculture Hydrosystems
The application was carried out according to the characteristics of the Wadi Ma’awil
catchment located on the northeast coast of Oman (see also section 7.1 and Grundmann et
al., 2013). Thereby, the long-term evaluation of the environmental and economical
development of a hypothetical farm under different management strategies was
investigated. For the sake of simplicity, the cultivation of two different crops, maize – a salt
sensitive cash crop and sorghum – a lower priced but more salt resistant crop, growing in
two seasons per year was assumed. Furthermore, a 2D vertical slice of the unconfined 3D
alluvial, coastal aquifer model (Walther et al., 2012) was constructed to simulate

7 Application: Integrated Modeling Approach for Supporting Management Decisions of Coupled Groundwater-Agricultural Systems (Oman)
98
groundwater flow and to account for saline water intrusion and transport. Fixed and variable
costs for installation and operation of pumping and irrigation equipment were incorporated.
Finally, a multi-criteria optimization run was performed to solve the multi-objective
optimization problem (Eqs. 30 and 31) over the next 20 years. Decision variables were the
yearly cultivated acreage, the yearly cropping pattern and the yearly irrigation water demands
which resulted in a number of 60 decision variables for the 20-year period. The multi-criteria
optimization run provided a large set of Pareto-optimal solutions. Each of these solutions
refers to an optimal management strategy according to the weighting between the given
objectives of1 (sustainability) and of2 (profit) (Eqs. 30 and 31). Besides optimal values for the
decision variables, the output of the water management model contains corresponding
values for groundwater level, aquifer salinity, and other variables.
In order to simplify the application, the clustering algorithm, as it is detailed in section 4.2,
was applied to combine similar management strategies (provided by the Pareto-optimal
solutions of the simulation-optimization model) into three different management scenarios
(clusters). These are:
A1 - hydrosystem sustainability oriented: under this scenario, an increase in
hydrosystem stability comes with higher agricultural profit risk.
A2 - multi-objective: The stakeholders (farmers) pay same attention to both – aquifer
sustainability and agricultural profit levels – that is, only a moderate change in the
hydrological system stability occurs if the profit of the agricultural production
increases.
A3 - agricultural profit oriented: in this scenario, an increase of the agricultural
production comes with a high risk to hydrosystem sustainability.
7.2.3 Impact Analysis of Alternative Management Policies
After developing and evaluating for its performance and consistency, the BN-based model
has been used to analyze the influence of alternative management policies. This was done
through evaluating effects of selected variables which represent alternative management
policies on posterior probability of the goals of hydrosystem management. For instance, the
influence of certain policies like, pessimistic or optimistic set of intervention values, on
posterior probability distribution of objective variables within the BN has been investigated.

7 Application: Integrated Modeling Approach for Supporting Management Decisions of Coupled Groundwater-Agricultural Systems (Oman)
99
Posterior probability results are then used to compare and analyze different policies and their
implications for a holistic hydrosystem management. In the application, three conflicting
management policies have been used for impact analysis.
normative: refers to setting states of all intervention to their expected values, i.e
business as usual
all worst: refers to setting states of intervention variables to their potential worst
values, and
all best: refers to setting states of intervention variables to their plausibly best case
values.
This can help to prioritize alternative management strategies to best effect desirable or to
avoid disagreeable policies.
7.2.4 Results and Discussion
7.2.4.1 Results of Simulation-Optimization Water Management Model of Coupled
Groundwater-Agriculture
The results of multi-criteria optimization (Pareto-optimal solutions) are presented in Fig. 19.
The sustainability index (of1) is plotted against the profit (of2) for solutions which are
evaluated through integrated simulation-optimization water management model discussed in
preceding sections. Therefore, Fig. 19a represents all solutions, where dark points represent
non-Pareto-optimal solution and blue points represent the Pareto-optimal solutions, obtained
from the optimization.
Figure 19: (a) Pareto solutions for the objective functions ‘Sustainability index’ and ‘profit
[$/ha year]’, points in blue representing Pareto-optimal solutions, (b) Cluster (A1, A2 and A3)
of the Pareto set.

7 Application: Integrated Modeling Approach for Supporting Management Decisions of Coupled Groundwater-Agricultural Systems (Oman)
100
The Pareto-optimal solutions consist of usually many solutions from which it could be
difficult to identify a range of solutions which can achieve similar level of objectives. For
example, there are 2,697 Pareto-optimal solutions in this prototype application. Pareto-
optimal solutions have been divided into three clusters based on the shape of the Pareto-
front, using the subtractive clustering technique (see Fig. 19b).
7.2.4.2 Results of BN-Based Decision Support Model Structure and Prior Probabilities
The scenarios of these three cluster values in conjunction with expert knowledge and
empirical data have been used as scenarios for further analysis of the proposed BN-based
decision support tool. A task-specific BN model has been constructed at farm scale using
the methodological procedure discussed in section 5.2. The developed BN model consisted
of fifteen nodes and twenty links (Fig. 20). Out of the fifteen nodes, four are inputs
representing different water management intervention variables and three are outputs
representing management objectives (see also Table 3 and 4). This Bayesian network has
been trained for each alternative management scenario (A1, A2 and A3).
Figure 20: Structure of the BN-based decision support tool for supporting management
decisions of a coupled groundwater-agriculture hydrosystem at farm scale
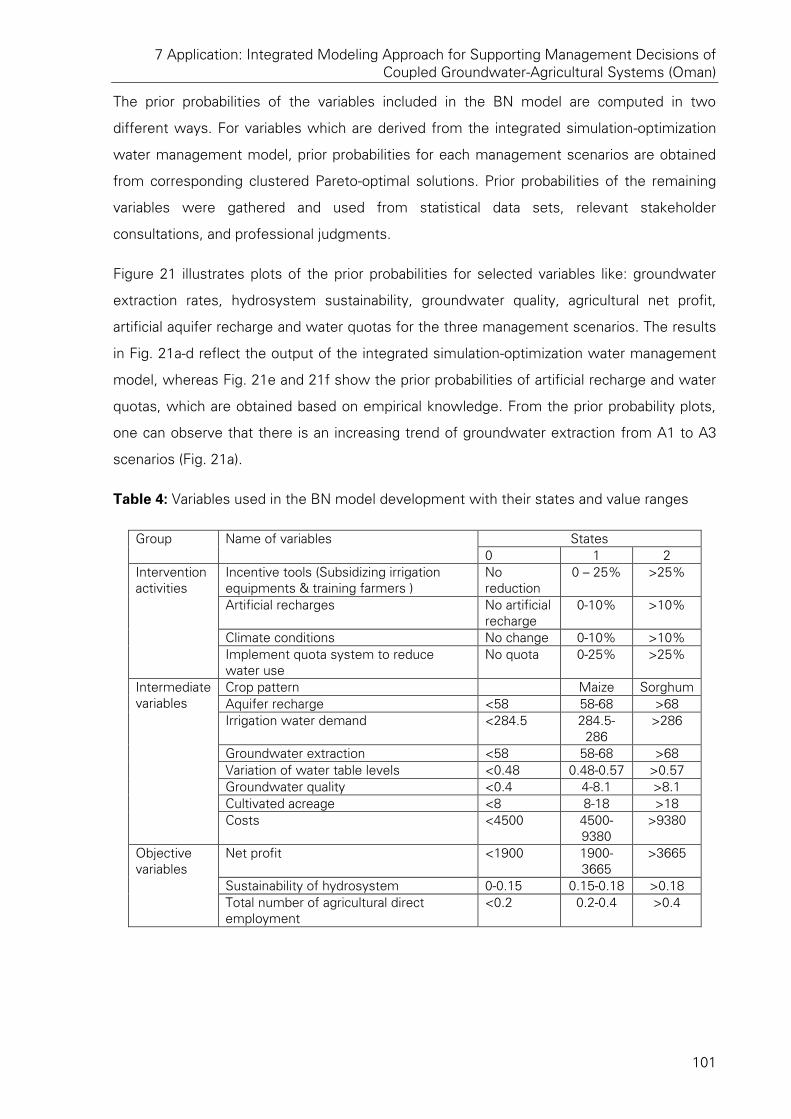
7 Application: Integrated Modeling Approach for Supporting Management Decisions of Coupled Groundwater-Agricultural Systems (Oman)
101
The prior probabilities of the variables included in the BN model are computed in two
different ways. For variables which are derived from the integrated simulation-optimization
water management model, prior probabilities for each management scenarios are obtained
from corresponding clustered Pareto-optimal solutions. Prior probabilities of the remaining
variables were gathered and used from statistical data sets, relevant stakeholder
consultations, and professional judgments.
Figure 21 illustrates plots of the prior probabilities for selected variables like: groundwater
extraction rates, hydrosystem sustainability, groundwater quality, agricultural net profit,
artificial aquifer recharge and water quotas for the three management scenarios. The results
in Fig. 21a-d reflect the output of the integrated simulation-optimization water management
model, whereas Fig. 21e and 21f show the prior probabilities of artificial recharge and water
quotas, which are obtained based on empirical knowledge. From the prior probability plots,
one can observe that there is an increasing trend of groundwater extraction from A1 to A3
scenarios (Fig. 21a).
Table 4: Variables used in the BN model development with their states and value ranges
Group Name of variables States 0 1 2
Intervention activities
Incentive tools (Subsidizing irrigation equipments & training farmers )
No reduction
0 – 25% >25%
Artificial recharges No artificial recharge
0-10% >10%
Climate conditions No change 0-10% >10% Implement quota system to reduce water use
No quota 0-25% >25%
Intermediate variables
Crop pattern Maize Sorghum Aquifer recharge <58 58-68 >68 Irrigation water demand <284.5 284.5-
286 >286
Groundwater extraction <58 58-68 >68 Variation of water table levels <0.48 0.48-0.57 >0.57 Groundwater quality <0.4 4-8.1 >8.1 Cultivated acreage <8 8-18 >18 Costs <4500 4500-
9380 >9380
Objective variables
Net profit <1900 1900-3665
>3665
Sustainability of hydrosystem 0-0.15 0.15-0.18 >0.18 Total number of agricultural direct employment
<0.2 0.2-0.4 >0.4

7 Application: Integrated Modeling Approach for Supporting Management Decisions of Coupled Groundwater-Agricultural Systems (Oman)
102
This increased groundwater extraction has seemingly contributed to higher net profits for
corresponding scenarios (Fig. 21d), which comes at the expense of a declining hydrosystem
quality, represented by the hydrosystem sustainability index and groundwater quality (see
Fig. 21b and c).
Figure 21: Prior probability distributions of different management scenarios (A1, A2 and A3)
for selected variables of the task-specific BN like (a) groundwater extraction rates
(Mm3/year), (b) hydrosystem sustainability (SI), and (c) groundwater quality (dS/m) (d) net
profit ($/ha year), (e) artificial recharge (percentage of additional annual aquifer recharge from
artificial recharge scheme) and (f) water quotas (percentage of water use reduction through
implementing a water quota system).

7 Application: Integrated Modeling Approach for Supporting Management Decisions of Coupled Groundwater-Agricultural Systems (Oman)
103
For groundwater quality, the A3 scenario has a remarkably high water quality problem, the
probability of values higher than 8.1 dS/m is around 80% (Fig. 21c). Furthermore, the
hydrosystem SI values also show an increasing trend from A1 to A3 scenarios, the
increment under A3 alternative scenario being more significant. Logically, this is in
agreement when compared with groundwater extraction and groundwater quality values
under the same scenario (Fig. 21a - d). The prior probability distribution of artificial recharge
and water quotas are illustrated in Fig. 21e and 21f, respectively. As these are the
interventions aimed to palliate the aquifer water balance disequilibrium, the results
belonging to all scenarios represent practically plausible values. For example, the probability
of implementing water quota and reversing the disequilibrium has less than a 15% chance,
as it is shown in Fig. 21f.
7.2.4.3 Sensitivity Analysis
A sensitivity analysis based on entropy reduction has been carried out to increase the
understanding of the relationship between input and output variables in the developed BN
model (as it is detailed in section 4.1.5). As an illustration, the sustainability of hydrosystem
and net profit variables has been considered as target output variables. These variables are
influenced by a broad range of variables included in the developed BN model. The results
shown in Table 5 indicate the ranking of variables influencing the target variables under the
three management scenarios (A1, A2 and A3), the most influencing variables being on the
top of the list in each case.
For the sustainability of the hydrosystem, the sensitivity analysis suggested the most
sensitive variables as: groundwater extraction, climate condition, and implementing water
quota. On the other hand, the sensitivity results show that, groundwater quality, climate
condition and costs are the variables influencing agricultural net profit outcomes most. The
influence of these variables under the three alternative scenarios is more or less consistent,
especially for most influencing variables (see Table 5). From the results of this sensitivity
analysis one can observe that the intervention variables (like: water quota, climate
conditions, and incentive tools) are influencing both objective variables significantly. For
instance, it is important to notice that implementing water quota is the most influencing
variable under A3 scenario for the sustainability of the hydrosystem. The sensitivity analysis
allow to assess consequences of variables introduced in the BN representing possible
actions or management interventions on those variables for which the attempt is to control.
Furthermore, this would help the decision makers to make informed decisions while
planning for the management intervention strategies.

7 Application: Integrated Modeling Approach for Supporting Management Decisions of Coupled Groundwater-Agricultural Systems (Oman)
104
Table 5: Sensitivity analysis conducted on the BN model, considering the sustainability of
the hydrosystem and net profit as target node under three different alternative scenarios.
Sustainability of hydrosystem Net profit Influencing node Entropy
reduction Cumulative percent of entropy reduction
Influencing node Entropy reduction
Cumulative percent of entropy reduction
A1-sustainability oriented alternative Groundwater quality
0.211 23 Costs 0.568 42
Climate conditions 0.17 42 Groundwater extraction
0.203 57
Variation of water table levels
0.158 60 Crop pattern 0.164 69
Irrigation water demand
0.082 69 Water quotas 0.107 77
Aquifer recharge 0.079 77 Climate conditions 0.088 83 Water quota 0.077 86 Groundwater quality 0.067 88 Incentive tools 0.062 93 Irrigation water
demand 0.061 93
Groundwater extraction
0.058 99 Aquifer recharge 0.052 96
Artificial recharge 0.003 100 Variation of water table levels
0.042 100
A2-multi-objective alternative Climate conditions 0.462 30 Groundwater
extraction 0.477 25
Groundwater quality
0.324 52 Climate conditions 0.414 47
Aquifer recharge 0.212 65 Costs 0.311 63 Variation of water table levels
0.178 77 Water quotas 0.244 76
Artificial recharge 0.123 85 Crop pattern 0.196 86 Groundwater extraction
0.084 91 Irrigation water demand
0.175 95
Water quota 0.059 94 Groundwater quality 0.063 98 Irrigation water demand
0.057 98 Aquifer recharge 0.023 100
Incentive tools 0.024 100 A3-profit oriented alternative Climate conditions 0.448 35 Water quotas 0.621 26 Variation of water table levels
0.199 50 Groundwater extraction
0.543 49
Groundwater quality
0.159 62 Costs 0.37 65
Aquifer recharge 0.148 73 Crop pattern 0.2 74 Groundwater extraction
0.13 83 Irrigation water demand
0.187 82
Water quota 0.077 89 Incentive tools 0.182 89 Artificial recharge 0.055 94 Climate conditions 0.146 96 Irrigation water demand
0.04 97 Variation of water table levels
0.052 97
Incentive tools 0.037 100 Groundwater quality 0.048 100 Variables are listed here in decreasing entropy reduction i.e. sensitivity values.

7 Application: Integrated Modeling Approach for Supporting Management Decisions of Coupled Groundwater-Agricultural Systems (Oman)
105
7.2.4.4 Posterior Probability Certainty Index (PPCI)
The PPCI results have been analyzed in order to evaluate the degree of certainty of posterior
probability outcomes. This result is obtained by setting intervention variables to normative
(business as usual) values for the three alternative scenarios (A1, A2 and A3). The posterior
probability certainty index implies full certainty when PPCI = 1, and full uncertainty when
PPCI = 0. As it is shown in Fig. 22, posterior probability certainty of hydrosystem
sustainability index (SI), net profit, and direct agricultural employment have been analyzed.
For clarity of presentation, the hydrosystem sustainability index (SI) variable values were
classified in three categories represented as: safe (0-0.15), medium (0.15-0.18), and unsafe
(> 0.18). For clarity of presentation, probabilities of medium and unsafe have been combined
and treated as P(medium or unsafe). Posterior probability of net profit with state value of
>3665 $/ha year is treated as P(maximum net profit). Similarly, direct agricultural
employment in terms of total number of employments/ha year, has been presented as
P(medium to high) when there is greater than 0.2/ha year (Fig. 22a and b).
The results indicate that greater certainty of the BN-based model outcomes when P(medium
or unsafe) is > 0.6, which represents mostly A2 and A3 scenarios (see Fig. 22a). On the
other hand, BN-based model outcomes suggest greater certainty when P(maximum net
profit) is very high (e.g., > 0.8, which represents mostly A3 scenarios (see Fig. 22b)). The
PPCI results also show that greater uncertainty occurs when P(medium or unsafe) has lower
posterior probability outcomes. The results indicate that PPCI outcomes for direct
agricultural employment rate certainty resemble that of agricultural profit, in which the
prospect of direct agricultural employment could be more certain under A3 scenarios (see
Fig. 22c). Analysis of this type can significantly contribute to prioritize different alternative
scenarios for future planning with better confidence and certainty.

7 Application: Integrated Modeling Approach for Supporting Management Decisions of Coupled Groundwater-Agricultural Systems (Oman)
106
Figure 22: The posterior probability certainty index as function of the posterior probability of
(a) SI is in state of medium or unsafe, (b) maximum net profit, and (c) medium to high direct
agricultural employment, in each of the three alternative scenarios (A1, A2 and A3).
7.2.4.5 Application of Alternative Management Policies
An impact analysis has been carried out to investigate the effects of intervention variables
for different management policies. This has been done by considering groups of intervention
variables and setting the intervention variables states to different plausible state values for
each alternative management policy (normative, all worst, and all best). Finally, the inference
information has been propagated through the developed BN-based model. The intervention
variables and associated states for the analyzed alternative management policies are shown
in Table 6.

7 Application: Integrated Modeling Approach for Supporting Management Decisions of Coupled Groundwater-Agricultural Systems (Oman)
107
Table 6: Alternative management policy and corresponding variable states (For the values of
the states refer to Table 4)
Intervention variables
Alternative management policy normative all worst all best
Incentive tools state 0 state 0 state 2 Artificial recharges state 1 state 0 state 2 Climate conditions state 1 state 2 state 0 Water quota state 0 state 0 state 1
The results of the impact analysis of different management policies are illustrated in Fig. 23.
The SI variable values were classified in three categories represented as: safe, medium, and
unsafe. From the SI results (Fig. 23a), it can be observed that the probability of SI to be in
medium or unsafe state is highest under A3 scenario, which is as high as 42% when the
states of input variables are set to “all worst” policy. The probability of sustainability index to
be in a less vulnerable state is obtained, when the BN model is run with A1 scenario under
“all best” management policy, as expected.
The results of the impact analysis of alternative management policies on agricultural profit
shows that the probability of obtaining the maximum net profit is more likely under the
alternative management policy of “all best” (Fig. 23b). Similarly, the chance of having the
maximum profit under “normative” policy is better than that of the “all worst” alternative
policy. The impact analysis shows that the chance to obtain maximum agricultural profit
could be considerably lowered for A3 scenario under “all worst” policy, while the effect of
“normative” and “all best” policies – for the same A3 scenario indicates an increasing
probability. Similarly, Fig. 23c shows the impact analysis of alternative management policies
on different management scenarios of with respect to direct agricultural employment. The
results show that scenarios intended to implement agricultural profit have the highest
employment figures.
Further influence analyses results for both hydrosystem sustainability and net profit indicate
that the probability of hydrosystem sustainability to be at risk is in the rank-order of “all
worst”, “normative” and “all best” policies and likelihood of obtaining maximum agricultural
net profit is in the rank-order of “all best”, “normative” and “all worst” policies. This
indicates that the developed BN model represents the physical model reasonably. The

7 Application: Integrated Modeling Approach for Supporting Management Decisions of Coupled Groundwater-Agricultural Systems (Oman)
108
influence analysis results of these types can be used to inform decision makers and
stakeholders with realistic expectations of implementing particular management policy.
Figure 23: Impact analysis of alternative management policies on different management
scenarios (A1, A2 and A3) evaluated by the probabilities of: (a) hydrosystem sustainability
index becoming medium or unsafe, (b) agricultural profit to obtain maximum net profit, and
(c) medium to high direct agricultural employment.
7.2.5 Summary of the Discussion
The application of BN-based decision support tool aimed to conceptualize the linkages
between hydrological and socio-economic processes through an integrated framework to
support decision-making in water management of coupled groundwater-agriculture
hydrosystems. The approach integrated hydrological knowledge, obtained from multi-
objective results of a simulation-optimisation water management model which considers
feedbacks within the hydrosystem, and additional empirical and expert knowledge regarding
socio-economic issues of potential management interventions in a BN-based model. An

7 Application: Integrated Modeling Approach for Supporting Management Decisions of Coupled Groundwater-Agricultural Systems (Oman)
109
exemplary application was performed for integrated management of a coastal agricultural
hydrosystem prone to saltwater intrusion, located in the Al-Batinah region in Oman. The BN-
based decision support tool was intended to assess the impact of alternative management
interventions on sustainable aquifer management while accounting for economic
(agriculture) and social interests (e.g., rural employment in the agriculture sector).
Exemplarily, selected interventions were investigated separately and in combination: climate
conditions and artificial recharge which refer to the water resources side as well as
implementation of water quotas and subsidies which referred to the water demand side.
Results of the sensitivity analysis showed that these variables are among the most
influencing variables (see Table 5). However, since climate conditions can not be controlled,
they would contribute less as management intervention. Therefore, it is recommended to
encourage decision makers to implement demand side management interventions which
have significant impact (see Fig. 23).
A major focus of this research was the integration of hydrological knowledge with empirical
knowledge inferred from socio-economic interests in a BN-based framework. This provides a
more rigorous scientific foundation for the decision-making and communication of scenarios,
impact analysis, and interpretation of model results between decision makers and
stakeholders. In addition, the approach accounts for the associated knowledge uncertainty
which is represented in the BN-based model in a probabilistic way. The explicit consideration
of these uncertainties enables decision makers to assess the risks associated with
implementing alternative management strategies.
The presented BN-based modeling approach forms the basis to analyze linkages within
hydrology and socio-economic processes in a single framework. However, by no means the
developed tool is exhaustive. Some of the key challenges include: 1) the model
development was based on limited information regarding socio-economic and environmental
input data, 2) the difficulty for stakeholders to express their knowledge about relationships
between variables in form of the probability, 3) the fact that BN use discrete states rather
than continuous probability distributions required discretization of probability distributions
which may lead to information losses – subsequently affecting the modeling results.
Furthermore, the simplified prototype application has been limited by using only three
management scenarios in order to illustrate the functionality of the framework.
To improve the model results, future research should focus on the one hand on improving
the quality of input data through comprehensive data survey and intensive discussions with

7 Application: Integrated Modeling Approach for Supporting Management Decisions of Coupled Groundwater-Agricultural Systems (Oman)
110
stakeholders. In addition, as the developed BN-based modeling approach was illustrated at a
farm scale it is required to test the methodology at multiple farm (regional) scale. On the
other hand, additional research is required to support more informed decision-making as well
as the understanding of interactions and feedbacks between hydrological processes and
socio-economic dependencies of complex hydrosystems. This can be done by developing
integrated approaches which use several types of modeling simultaneously or
complementary, like shown in this work.
7.3 Fuzzy-Stochastic Multiple Criteria Decision Analysis Tool
In the following, an application is presented to demonstrate the applicability and
effectiveness of the proposed fuzzy-stochastic multiple criteria decision analysis tool. The
application deals with an agricultural coastal region, where groundwater overexploitation
from the coastal aquifer has resulted to saltwater intrusion threatening the economic basis
of farmers and associated societal activities. The detailed description of the study area and
the decision problem is presented in section 7.1
7.3.1 Criterion and Alternative Identification
7.3.1.1 Criteria Identification and their Formulations
Based on the descriptions of the decision problem in the study area, this application is
intended to prioritize a set of management alternatives that would help to respond to the
current unbalanced relationship between water resources availability and water demand in
this coastal region. The management alternatives and evaluation criteria were determined
based on: (1) an integrated simulation-based water management model which accounts for
the interaction of physical processes of strongly coupled groundwater-agriculture
hydrosystems, and (2) expert knowledge and the water resources master plan (MRMWR,
1998) for the study area. Considering the availability of data and the integrated simulation-
based optimization model development situations at the stage of this research, three
management alternatives (A1, A2 and A3) and five criteria profit (C1), costs (C2), extraction
(C3), salinity (C4), and employment of rural labor (C5) are considered here, as illustrated in
Table 7.
Evaluations of the identified criteria are performed based on their formulation and required
knowledge sources (see section 6.6 and 5.4 for details regarding knowledge acquisition).
Criteria enumerated from physical process (C1, C2, C3 and C4) are evaluated from the

7 Application: Integrated Modeling Approach for Supporting Management Decisions of Coupled Groundwater-Agricultural Systems (Oman)
111
integrated simulation-optimization water management model detailed in section 6.3, while
social criterion (C5) is evaluated based on empirical knowledge and experts’ opinion in a way
it is described in section 6.6 (see also Table 7).
Table 7: Summary of criteria included in the decision problem analysis
Classification Criteria description Measurable factors Formulations
Economic Profit (C1) Total annual agricultural net profit ($/ha year)
Eq. 31
Costs (C2) Total variable and fixed cost for pumping and irrigation ($/year)
Eq. 31
Environmental Extraction rates (C3) Groundwater abstraction rates (Mm3/year)
Eq. 30 and Eq. 31
Salinity (C4) Salinity (dS/m) Eq. 30
Social Employment of rural labor (C5)
Total number of direct agricultural employment /ha year
Eq. 36
7.3.1.2 Alternative Identification
Taking into account the ideas raised in the water resources master plan and decision
problems described in the preceding sections, the overall goal for the management in the
study area is that groundwater levels are to be stabilized with additional aim of maintaining
social and economic interest of the stakeholders. Management alternatives were created in
accordance with this idea in the integrated simulation-optimization water management
model by clustering Pareto-optimal solutions which have similar levels of goals attainment,
as well as practical implications. Accordingly, three different alternatives have been
formulated for purpose of multiple criteria decision analysis:
A1 – hydrosystem sustainability oriented: under this management alternative, an
increase in hydrosystem stability comes with higher agricultural profit risk.
A2 – multi-objective: under this alternative, the decision-makers and/or farmers would
pay same attention for both aquifer sustainability and agricultural profit levels; i.e.
only a moderate change in the hydrological system stability, occurs if the profit of the
agricultural production increases.
A3 – agricultural profit oriented: under this alternative, an increase of the agricultural
production comes with high risk of hydrosystem sustainability.

7 Application: Integrated Modeling Approach for Supporting Management Decisions of Coupled Groundwater-Agricultural Systems (Oman)
112
7.3.2 Results and Discussion
The proposed fuzzy-stochastic multiple criteria decision analysis solution procedures have
been employed primarily to identify decisional management alternatives and corresponding
criteria. Following the proposed steps, the integrated simulation-optimization water
management model coupled with empirical knowledge and experts’ professional judgments
were used to characterize and evaluate the criteria with respect to management alternatives.
The results of integrated simulation-optimization water management model are shown in
Fig. 24. Figure 24a shows Pareto solutions where the sustainability index (of1) is plotted
against the profit (of2), where, dark dots represent all solutions and points in blue
representing Pareto-optimal dataset (i.e., the Pareto front). The Pareto-optimal solution may
consist of usually too many solutions, which could be difficult to identify a range of which
can achieve similar level of results. For instance, in this application we have 2,697 Pareto-
optimal solutions. Thus, in this application, Pareto-optimal solutions have been clustered into
three classes (A1, A2 and A3) based on the shape and results of Pareto-front as well as their
practical implications, using subtractive clustering technique as it is detailed in (section 4.2)
(Fig. 24b).
The clusters comprises: (1) hydrosystem sustainability oriented (A1), where a decrease in
sustainability index (of1) which implies an increase in hydrosystem stability can be
maintained only with significant compromise with agricultural profit; (2) multi-objective (A2),
in this range, only a moderate change in hydrosystem stability occurs if the profit of the
agricultural production increases; and (3) agricultural profit oriented (A3), where an increase
in profit of agricultural production occurs with a higher risk of hydrosystem stability. This
indicates that, the Pareto-optimal data sets in the later two clusters, i.e., A2 and A3, an
increase in profit of agricultural production can be risky in respective of groundwater
systems’ stability.
Figure 24c represents the temporal variability in profit, costs, extraction rates, and salinity for
the specific solutions of the three clusters (hydrosystem sustainability oriented (A1), multi-
objective (A2), and agricultural profit oriented (A3)). The hydrosystem sustainability oriented
alternative shows a small increase in profit during the first 10 years and relatively constant
profit then after. In contrast, the multi-objective alternative shows a significant increase in
profit during the first 10 years and then decreasing with time until profit is constant. The
profit-oriented alternative generates an increasing profit during first 10 years and then
diminishes with time passing.

7 Application: Integrated Modeling Approach for Supporting Management Decisions of Coupled Groundwater-Agricultural Systems (Oman)
113
Figure 24: (a) Pareto solutions for the objective functions ‘sustainability index (SI) and profit
($/year) points in blue representing Pareto-optimal solution (b) cluster (A1, A2 and A3) of
Pareto set (c) evaluations of criteria with respect to the management alternatives.

7 Application: Integrated Modeling Approach for Supporting Management Decisions of Coupled Groundwater-Agricultural Systems (Oman)
114
These patterns are also reflected in groundwater extraction rates and associated costs. The
groundwater extraction rates follow the same pattern with agricultural profit under
hydrosystem sustainability and multi-objective oriented alternatives, in which profit of
agricultural production rise and fall with groundwater extraction rates throughout the time
frame. A rising and falling of profit with groundwater extraction rates are not maintained
under the profit oriented alternative during the last 5 years of the time frame, where profit
did not increase albeit increasing groundwater extraction rates. This is due to increasing
salinity in irrigation water as it is shown in the last row of Fig. 24c. The salinity in irrigation
water rises very quickly in the last 5 years and reaches a level at which farmers not get a
profit from the agricultural production any longer. These results are used to define
independent PDFs which then are used as an input for the Monte Carlo simulation.
The results of linguistic assessment for alternatives with respect to subjective criterion (C5)
are shown in Table 8. The results were provided by three decision makers and/or experts.
These assessments were aggregated into three groups such that triangular probability
distribution functions can be approximated using Eq. 37. Similarly, Table 9 shows the
evaluation of the optimism degree ( ) provided by decision makers using fuzzy membership
function acquired from a questionnaire survey. The resulting triangular PDFs are used as an
input for the Monte Carlo simulation as it is described in section 6.2.
Table 8: Expert assessment for evaluation of alternatives with respect to subjective criteria
using linguistic variables
Alternatives Criterion (C5) DM1
DM2
DM3
Aggregated
A1
L
VL
L
(0,0,5)
A2
M
L
H
(0,4.7177,10)
A3
VH
H
M
(2,7.0473,10)
Table 9: Evaluation of optimism degree ( ) using linguistic variables
Optimism degree ( ) Decision makers DM1
DM2
DM3
Linguistic variables
M
H
H
Triangular fuzzy numbers
(0.2,0.5,0.8)
(0.5,0.7,1)
(0.5,0.7,1)
Aggregated group fuzzy value
(0.2, 0.62573, 1)

7 Application: Integrated Modeling Approach for Supporting Management Decisions of Coupled Groundwater-Agricultural Systems (Oman)
115
Once the input probability distributions are obtained, Monte Carlo simulations are performed
(based on procedures detailed in section 6.2). Subsequently, 15 probability distributions are
provided after a number of iterations. Figure 25 shows results of the Monte Carlo simulation
representing the alternatives versus criteria matrix. Similarly, Fig. 26 represents the
simulated optimism degree of DMs. Based on these results, total performance of the
alternatives are calculated using OWA aggregation operator (see Step 4 and 5).
Figure 25: The decision matrix values – Monte Carlo simulated histograms and fitted
probability distributions for the alternative versus criteria matrix.

7 Application: Integrated Modeling Approach for Supporting Management Decisions of Coupled Groundwater-Agricultural Systems (Oman)
116
Figure 26: Histogram of the optimism degree ( ) and the fitted probability distribution
Following the aforementioned aggregation procedure (Step 4 and 5 in section 6.3), total
performance values (TPVs) for each alternative is calculated. The calculation is repeated for a
number of realizations considering fixed optimism degree value at a time, and a cumulative
distribution function (CDF) is obtained for each alternative.
As it is discussed in detail in (section 6.4), ranking management alternatives under
uncertainty can be achieved based on the corresponding cumulative density functions of the
alternatives. The CDFs of total performance values associated with the alternatives indicate
degree of stochastic dominance of one alternative over the other. For example, Fig. 27
shows the CDF results of the three alternatives with respect to two different optimism
degree – 0.5 (Fig. 27a) and 0.2 (Fig. 27b). The CDF plots for the two optimism degrees
demonstrate that multi-objective alternative (A2) appeared to be the most attractive solution
in order to counterbalance the coastal aquifer saltwater intrusion problem. Profit oriented
(A3) and sustainability oriented (A1) management alternatives rank second and third,
respectively. The ranking of the alternatives is unchanged for those two different optimism
degrees (0.5 and 0.2), but with different total performance value ranges. From results
illustrated in Fig. 27, it can be seen that the total value of A2 may range between 10 and 17
units for the optimism degree of 0.5, while the total value for the same alternative range
between 12 and 19.5 units for the optimism degree of 0.2.
Stochastic ranking-based decision-making approaches like the one proposed in this thesis
can provide probability of ranking or ranking reversal, in addition to how much better one
alternative is over another. This can be achieved mainly through ranking the correlation
coefficient, measuring the degree of similarity between pairs of rankings and then selecting
the ranking that maximizes the overall average agreement (Hyde et al., 2004; Xu and Tung,
2009).

7 Application: Integrated Modeling Approach for Supporting Management Decisions of Coupled Groundwater-Agricultural Systems (Oman)
117
Results of the stochastic ranking based on the correlation for the alternatives are presented
in the following. Table 10 and 11 summarized the probability of ranking of the three
alternatives considering ± 10 uncertainties in their total performance for optimism degree of
0.5 and 0.2, respectively. It can be seen that A1 is ranked in third place with the highest
overall chance of 100%, illustrating that the alternative under the considered optimism
degrees is less sensitive to uncertainty. Multi-objective (A2) and profit oriented (A3)
alternatives has first and second places with a chance of 84.5% for the optimism degree of
0.5, respectively (Table 10). Similarly, the alternatives are ranked as, A2 > A3 > A1 for the
optimism degree of 0.2 with a chance of 77%, 77% and 100%, respectively (see also Table
11).
Table 10: Probability of ranking of three alternatives based on simulations with ± 10
uncertainties in total performance values for optimism degree of 0.5 based on ranking
correlation
Rank Sustainability oriented (A1) Multi-objective (A2) Profit oriented (A3) 1 0.0 84.5 15.5 2 0.0 15.5 84.5 3 100.0 0.0 0.0
Figure 27: Superimposed cumulative distribution functions generated using OWA operator
for the optimism degree of 0.5 (Fig. 27a) and 0.2 (Fig. 27b) for the three alternatives.

7 Application: Integrated Modeling Approach for Supporting Management Decisions of Coupled Groundwater-Agricultural Systems (Oman)
118
Table 11: Probability of ranking of three alternatives based on simulations with ± 10
uncertainties in total performance values for optimism degree of 0.2 based on ranking
correlation
Rank Sustainability oriented (A1) Multi-objective (A2) Profit oriented (A3) 1 0.0 77 23 2 0.0 23 77 3 100.0 0.0 0.0
7.3.2.1 Sensitivity Analysis
Sensitivity Analysis with Respect to Inputs
The total performance values of the alternatives are based on the evaluation of performance
of the alternatives with respect to the criteria and the optimism degree. These inputs are
uncertain and the optimal decision may vary in various circumstances. Therefore, it is
important to simulate the total performance values with uncertain inputs. To accomplish this
purpose, it is important first to identify the input variables and parameters which mostly
determine the uncertainties in the modeling. Consequently, Morris method (Morris, 1991) is
employed to determine the most important inputs contributing to output uncertainty. The
Morris method is based on the definition of an elementary effect attributable to an input
variable and parameter in a region of experiment. The elementary effect EE is the indicator
used in the Morris method to evaluate the effect of ith input on the outputs. For a given value
of X, the elementary effect for the ith input is defined by (Eq. 25).
Accordingly, after a number of Monte Carlo simulations, most influential inputs on the total
performance values are displayed in Table 12 and Fig. 28. From the results it can be
observed that the optimism degree ( ) – OWA operator parameter – is the most influencing
parameter. This, at the same time, would confirm our perception about the importance of
the optimism degree in the decision-making process and the need to analyze its sensitivity.

7 Application: Integrated Modeling Approach for Supporting Management Decisions of Coupled Groundwater-Agricultural Systems (Oman)
119
Figure 28: Morris results on input criteria and optimism degree
Table 12: Sensitivity results of input criteria and optimism degree according to Morris
method
Inputs Morris mean Morris SD Euclidian distance Influence ranks Optimism degree Extraction rates Salinity Profit Costs Employment
0.698 0.447 0.391 0.3123 0.224 0.112
0.738 0.628 0.222 0.0299 0.075 0.074
1.0162 0.7704 0.4494 0.3038 0.2357 0.1338
1 2 3 4 5 6
Sensitivity Analysis with Respect to the Optimism Degree
The optimistic or pessimistic view of decision makers has a significant effect on the final
water resources management decisions because of the inherent human-water interactions
and human-modified water resources management issues. The OWA operator (Eq. 24)
quantifies the effect of the optimism degree on the performance value of the alternatives.
Conflict of interest and uncertainties about the consequences of potential management
interventions demand to account a risk in a particular decision. The optimism degrees of
decision makers (risk taking and/or risk aversion attitude) consistently influence how the
decision makers respond to the decision environment.
In this section, a sensitivity analysis is performed to further study the impact of decision
makers’ risk taking and risk aversion attitude (optimism degree) on the total performance
values of the alternatives.

7 Application: Integrated Modeling Approach for Supporting Management Decisions of Coupled Groundwater-Agricultural Systems (Oman)
120
Figure 29: Sensitivity analysis for variation in optimism degree on total performance value
of the alternatives
Initial, sensitivity analysis using the optimism degree of 0.5 and 0.2 showed that there is a
marked deference in the final CDFs of the total performance values (see Fig. 27). Now the
sensitivity analysis is extended to optimism degree of 0.1, 0.2, 0.3, 0.4, 0.5, 0.6, 0.7, 0.8, 0.9
and 1.0. Following the procedures detailed in section 6.4 (Fig. 16), the total performance
values for the alternatives under different optimism degrees have been simulated. Once
these simulations carried out, the statistical values such as 25th, 50th and 75th percentiles are
reported (Fig. 29) using a box plot illustration. The results for the three alternatives (A1, A2
and A3) show that with a risk aversion attitude of decision makers (that is decrease in
optimism degree), there is an increase in the total performance values in general (Fig. 29).
Meanwhile, from the results, one can observe that as the optimism degree increases there
is a decrease in the total performance values but to a different extent for each alternative.
This may be interpreted as, under risk taking decision-making process there is significant
disagreement in prioritizing among sustainability oriented, multi-objective and profit oriented
management strategies, than it is under risk aversion decision-making process.

7 Application: Integrated Modeling Approach for Supporting Management Decisions of Coupled Groundwater-Agricultural Systems (Oman)
121
Furthermore, sensitivity of ranking under different degrees of optimism has been conducted.
The results of this analysis are depicted in Fig. 29 indicating the final ranking with respect to
different optimism degrees. Accordingly, these results show that any change of optimism
degree in risk aversion circumstances does not change the final ranking of the alternatives. It
demonstrates that the ranking of the alternatives (A2 > A3 > A1) remain stable and robust
under a risk aversion decision-making process.
Figure 30: Sensitivity of ranking under different optimism degrees
Contrary to this, under the risk-taking decision-making process, it appears that there are
fewer consensuses about the ranking. As it can be seen from Fig. 29 and 30, there is a
considerable overlap among the TPV of the three alternatives, thus it is becoming difficult to
prioritize among management alternatives.
Figure 31: Cumulative distributions of total performance values under risk taking decision-
making process

7 Application: Integrated Modeling Approach for Supporting Management Decisions of Coupled Groundwater-Agricultural Systems (Oman)
122
Similar results can be observed in Fig. 31, where the CDFs of the alternatives are
intersecting and overlapping. These considerable overlaps could be attributed to the
uncertainties caused by subjective judgments or lack of knowledge. Therefore, under the
risk taking decision-making process like this, it is important to account for the likelihood that
a ranking may change due to uncertainties.
For that reason, in this thesis a ranking of alternative management scenarios has been
conducted based on parwise comparison of the alternatives and risk of obtaining an
acceptable ranking as perceived by decision makers. This in turn enables to utilize full
uncertainty through pairwise comparison of management alternatives, on the basis of the
risk defined by the probability of obtaining an acceptable ranking and mean difference in total
performance for the pair of management alternatives. The risk of obtaining an unacceptable
ranking is used as criteria to rank alternatives. Computational details can be found in section
6.4.
Figure 32: Probability of ranking change, for the risk taking decision-making process,
indicated by projection
Results from these analyses are shown in Table 13 and Fig. 32. Table 13 shows mean
difference of total performance values (upper right), probability of ranking change (lower left)
and risk of ranking change between alternatives (in parenthesis) for the risk taking decision-
making process. Figure 31 illustrates pairwise comparison of two management alternatives

7 Application: Integrated Modeling Approach for Supporting Management Decisions of Coupled Groundwater-Agricultural Systems (Oman)
123
(A1 and A2) depicting the probability of ranking change between the alternatives. A
probability of 0.42 for alternative a1 and a2 indicates that probability of ranking change is
42%. The product of probability of ranking change and mean difference of total performance
values is calculated to provide risk levels of pairwise comparison of the alternatives. The
ranking of management alternatives are regarded to be appropriate if the risk is smaller than
an unacceptable risk level for all combinations of measures. The acceptable risk level can be
determined by DMs and this in turn allows incorporating DMs attitude into the decision-
making process. The probability of ranking change of different combination of other pairs of
alternatives is illustrated in the appendix (A.4).
Table 13: Mean difference of total performance values (upper right), probability of ranking
change (lower left) and risk of ranking change between alternatives (in parenthesis) – for the
risk taking decision-making process
ai aj a1 a2 a3
a1 _ 2.2
0.7
a2 0.42 (0.99)
_ 1.5
a3 0.37 (0.259)
0.49 (0.735)
_
7.3.3 Summary of the Discussion
This section of the thesis has presented the application of the proposed approach – fuzzy-
stochastic multiple criteria decision analysis tool – dealing with heterogeneous information
evaluation and ranking management alternatives under multiple uncertainties. The proposed
methodology can be opted for the management of complex water resources systems when
in addition to physical processes also socio-economic and environmental aspects have to be
considered.
The approach is presented in a set of major steps (see Fig. 16). The first step involves
characterizing the decision problem. The actors involved in the decision-making process
translate appropriate management decision issues into a set of criteria and management
alternatives. In the second step, performances of variety of criteria representing diverse
issues in terms of economic, social and environmental dimensions are evaluated with
respect to the alternatives. A simulation-optimization water management model is employed
to optimize interacting physical process and to evaluate criteria derived from the process.

7 Application: Integrated Modeling Approach for Supporting Management Decisions of Coupled Groundwater-Agricultural Systems (Oman)
124
Meanwhile, fuzzy and/or qualitative information regarding management alternatives are
evaluated in linguistic terms. The triangular distribution is adopted to approximate the
probability density distribution of the linguistic assessment. Afterwards, the simulation-
optimization and linguistic assessment results are regarded as input values into the Monte
Carlo simulation. The Monte Carlo simulation generates a probabilistic decision matrix of
alternatives versus criteria in an uncertain environment. Based on these results, total
performance of the alternatives is aggregated using the ordered weighted averaging (OWA)
operator and the management alternative with the highest total performance is identified as
best alternative. Finally, candidate management alternatives under uncertainty were ranked
and sensitivity of the ranking to different uncertainty was investigated.
A real-world water management problem dealing with a coastal aquifer system affected by
saltwater intrusion due to excessive groundwater extraction for irrigated agriculture was
carried out to test the functionality of the proposed approach. Three management
alternatives (sustainability, multi-objective and profit oriented) were evaluated against
hydrologically, environmentally and socio-economically motivated criteria (extraction rates,
salinity, profit, costs and employment of rural labor).
The results show that, the proposed methodology is flexible enough to deal with
heterogeneous information and incorporate decision makers’ opinions and judgments in
decision-making process. Moreover, the methodological framework has shown it is capable
of providing a means to address the effects of multiple uncertainty sources that requires
information improvement in order to attain the desired level of confidence in decision-
making.
Summary and specific conclusions of the discussions are as follows:
The proposed fuzzy-stochastic multiple criteria decision analysis tool can be used for
the management of complex water resources systems when in addition to physical
processes also socio-economic and environmental aspects have to be considered.
As decision-making under certainty is mostly trivial it is important to consider
associated uncertainties appropriately. Thus, in the proposed decision-making
approach, uncertainties attributed to natural variability and randomness are handled
using MCS while uncertainties due to subjectivity and lack of knowledge are dealt
with using fuzzy-stochastic analysis.

7 Application: Integrated Modeling Approach for Supporting Management Decisions of Coupled Groundwater-Agricultural Systems (Oman)
125
The decision makers’ attitude (degree of optimism) regarding decision-making
process is dominant input parameter in the final ranking of management alternatives.
Risk aversion and risk taking attitude of decision makers have resulted in different
ranking of management alternatives for the presented application.
However, it is also important to notice that this approach has its own limitation which needs
further attention: (1) the approach is sensitive to subjective judgment ranging from
evaluation of fuzzy and/or qualitative information to determination of the acceptable risk
levels in the decision-making process, therefore, it is recommended to give special
consideration in assessing the consensus of relevant stakeholders and decision-makers to
improve the results; (2) future research should focus on improving the quality of the
modeling components such as: input data, the simulation-optimization model and
comprehensive discussion with stakeholders and decision makers.
126
8 Summary and Conclusion
Reliable decision support tools for addressing decision-making processes about water
resources systems are fundamental in order to respond to different challenges related to the
development of appropriate management interventions or policies. It has become
increasingly clear that the pressing problems in water resources management have to be
tackled with transformative approaches that can take socio-economic and environmental
issues into account in addition to the physical hydrological processes. Furthermore, mostly
decision-making under certainty is of very little significance to the effectiveness of
management. It is of great importance to provide decision makers with tools that incorporate
risk and uncertainty in decisions, as real-world water resources management issues are
subject to multiple uncertainties. To date, this is not yet fully up to the state-of-the-art. The
current situation requires new or improved decision support tools in which diverse issues
(hydrological, socio-economic and environmental issues) are combined in a unified manner,
with a means to incorporate associated uncertainties and communicate them in a
transparent way considering a persistent involvement of stakeholders. Conventional
methods such as optimization techniques are commonly applied for identifying a
management solution for a wide range of demands. These conventional methods are not
wrong or bad, but they do not always fit to real-world water-related challenges, as
suggested solutions might be optimal but may not be stable solutions (i.e., stakeholders
may find the optimal solutions to be unfair, thus requiring additional evaluation regarding
their acceptance and willingness of societies for cooperation to implement the
recommended solutions).
To fill in the aforementioned research gaps and to achieve the intended goals, two new
integrated modeling approaches to support management decisions of water resources
systems under multiple uncertainties were developed in this thesis. The developed
strategies were tested in an agricultural coastal region, where excessive groundwater
withdrawal from the coastal aquifer for irrigated agriculture has resulted in a saltwater
intrusion threatening socio-economic bases of local communities.
This research can be summarized with the following set of conclusions, some related to the
methodology and some related to results of different scenario analyses of coupled
groundwater-agricultural hydrosystems:

8 Summary and Conclusion
127
The methodology developed in the first part of this research – Bayesian network-
based decision support tool – has enabled the combination of integrated modeling
and participatory approaches to address hydrosystems management. The Bayesian
network-based decision support tool has demonstrated its suitability as a
participatory platform and as an integrative framework where diverse modeling tools
can be combined. It has also the capability to present the outcomes with the
associated uncertainties for selected indicators in the scenario analysis, enabling
decision makers to assess the probabilities to obtain different values for each of
those indicators.
The methodology developed in the second part of this research – fuzzy-stochastic
multiple criteria decision analysis tool – has enabled to systematically quantify both
probabilistic (stochastic) and fuzzy uncertainties associated with hydrological, socio-
economic and environmental criteria through effectively linking both types of
uncertainties. It has integrated physical process-based models, fuzzy logic, expert
involvement and stochastic simulation within a general framework. This
development was based on: (1) evaluation of a coupled groundwater-agricultural
system and formulation of criteria derived from the physical processes using an
integrated simulation-optimization model, (2) quantification of socio-economic criteria
and optimism degree of decision makers regarding the decision-making process
using fuzzy membership functions acquired from a questionnaire survey, (3)
incorporation of ordered weighted averaging – an aggregation operator – with
Monte Carlo simulation algorithm in order to account for associated stochastic
uncertainty, (4) examination of simulation results expressed as CDFs, and (5)
ranking of candidate alternatives based on the performance of the alternatives and
risk taking attitude of decision makers. The robustness and flexibility is unique to the
method, as it is enhanced through its capability to reflect two types of uncertainties
and accommodation of heterogeneous information in a unified framework.
The results from the Bayesian network-based decision support tool have allowed the
impact assessment of alternative management interventions on sustainability of
aquifer management while accounting for economic (agriculture) and societal
interests (rural employment in the agricultural sector) in the study area. Different
management interventions – which refer to both water resources supply and
demand side – were assessed. Outputs obtained indicate that the probability of

8 Summary and Conclusion
128
maintaining a sustainable aquifer while upholding other goals (e.g., economic and
societal) appear to be very low. The situations require a combination of both, water
resources supply side as well as the demand side management measures, with
more aggressive measures being taken on the demand side. Failing to enforce such
measures could demand more drastic management interventions which may range
between the extremes of stopping all agricultural activities in order that – the local
aquifer system can recover, to producing as much as possible for as long as water
and soil resources are available.
The results from the fuzzy-stochastic multiple criteria decision analysis tool has
allowed to analyze three management alternatives namely: (1) hydrosystem
sustainability oriented, (2) multi-objective, and (3) agricultural profit oriented. The
analysis has provided potential decision alternatives which can serve as a platform
for negotiation and further exploration. The developed method offers a unique
suitability to systematically quantify multiple uncertainties associated with the
decision problem. Sensitivity analysis applied within the developed tool has shown
that risk aversion and risk taking attitude by decision makers may yield in different
ranking of the alternatives.
The presented new integrated modeling approaches form the basis to analyze linkages
within hydrology and socio-economic processes in a unified framework. However, the
developed tools have their own limitations. Some of the challenges include: 1) The
development of the tools were based on limited information regarding some socio-economic
and environmental input data, 2) the real-world application was limited by using only three
simplified management scenarios in order to illustrate the functionality of the frameworks,
and 3) the applications were tested on a prototype farm scale. It may be useful, therefore,
to extend the modeling approaches functionality to allow an even broader range of
application. Firstly, testing (verify) the developed approaches at multiple scales (e.g., at
regional scale) and at different hydro-climatic conditions. Secondly, improving the quality of
input data especially with regard to human input and associated uncertainties which may
result in information losses, which in turn may affect the modeling results. Thirdly, a follow
up for effective support of decision-making, the tools should be updated and their
performance monitored regularly, with the involvement of key stakeholders learning from
past experiences adopting enhanced protocols for planning.

8 Summary and Conclusion
129
However, to address more water-related challenges in contemporary human driven changes,
involving feedbacks across multiple scales and actors especially incorporating two-way
feedbacks between human and water systems need to be modeled more rigorously, in
order to fully realize the potential of modeling approaches, like those shown in this thesis.

130
References
Abrishamchi, A., Ebrahimian, A., Tajrishi, M., and Mariño, M. (2005). Case Study: Application
of Multicriteria Decision Making to Urban Water Supply. Journal of Water Resources
Planning and Management, 131(4), 326-335.
Afshar, A., Mariño, M., Saadatpour, M., and Afshar, A. (2010). Fuzzy TOPSIS Multi-Criteria
Decision Analysis Applied to Karun Reservoirs System. Water Resources
Management, 25(2), 545-563.
Aguilera, P. A., Fernández, A., Fernández, R., Rumí, R., and Salmerón, A. (2011). Bayesian
networks in environmental modelling. Environmental Modelling & Software, 26(12),
1376-1388.
Akbar, M., Aliabadi, S., Patel, R., and Watts, M. (2013). A fully automated and integrated
multi-scale forecasting scheme for emergency preparedness. Environmental
Modelling & Software, 39(0), 24-38.
Akhbari, M., and Grigg, N. (2013). A Framework for an Agent-Based Model to Manage Water
Resources Conflicts. Water Resources Management, 27(11), 4039-4052.
Al-Shaqsi, S. (2004). The socio economic and cultural aspects in the implementation of water
demand management, a case study in the Sultanate of Oman. PhD thesis,
Department of Geography, University of Nottingham, Nottingham.
Ascough II, J. C., Maier, H. R., Ravalico, J. K., and Strudley, M. W. (2008). Future research
challenges for incorporation of uncertainty in environmental and ecological decision-
making. Ecological Modelling, 219, 383-399.
Aulinas, M., Nieves, J. C., Cortés, U., and Poch, M. (2011). Supporting decision making in
urban wastewater systems using a knowledge-based approach. Environmental
Modelling & Software, 26(5), 562-572.
Bana e Costa, C., De Corte, J., and Vansnick, J. (2005). On the mathematical foundation of
MACBETH. In: Figueira J, Salvatore G, Ehrgott M (eds) Multiple criteria decision
analysis: state of the art surveys. Springer, Berlin | Heidelberg, pp409–442.

References
131
Barton, D. N., Kuikka, S., Varis, O., Uusitalo, L., Henriksen, H. J., Borsuk, M., de la Hera, A.,
Farmani, R., Johnson, S., and Linnell, J. D. C. (2012). Bayesian networks in
environmental and resource management. Integrated Environmental Assessment
and Management, 8(3), 418-429.
Barton, D. N., Saloranta, T., Moe, S. J., Eggestad, H. O., and Kuikka, S. (2008). Bayesian
belief networks as a meta-modelling tool in integrated river basin management Pros
and cons in evaluating nutrient abatement decisions under uncertainty in a
Norwegian river basin. Ecological Economics, 66(1), 91-104.
Borsuk, M. E., Stow, C. A., and Reckhow, K. H. (2004). A Bayesian network of
eutrophication models for synthesis, prediction, and uncertainty analysis. Ecological
Modelling, 173(2-3), 219-239.
Bromley, J., Jackson, N. A., Clymer, O. J., Giacomello, A. M., and Jensen, F. V. (2005). The
use of Hugin® to develop Bayesian networks as an aid to integrated water resource
planning. Environmental Modelling & Software, 20(2), 231-242.
Cai, X., Lasdon, L., and Michelsen, A. (2004). Group Decision Making in Water Resources
Planning Using Multiple Objective Analysis. Journal of Water Resources Planning and
Management, 130(1), 4-14.
Cai, X., McKinney, D., and Lasdon, L. (2003). Integrated Hydrologic-Agronomic-Economic
Model for River Basin Management. Journal of Water Resources Planning and
Management, 129(1), 4-17.
Cain, J. (2001 ). Planning improvements in natural resource management. Guidelines for
using Bayesian networks to support the planning and management of development
programmes in the water sector and beyond. Centre for Ecology and Hydrology,
Wallingford.
Campolongo, F., and Saltelli, A. (1997). Sensitivity analysis of an environmental model: an
application of different analysis methods. Reliability Engineering & System Safety,
57(1), 49-69.
Carmona, G., Varela-Ortega, C., and Bromley, J. (2011). The Use of Participatory Object-
Oriented Bayesian Networks and Agro-Economic Models for Groundwater
Management in Spain. Water Resources Management, 25(5), 1509-1524.

References
132
Carmona, G., Varela-Ortega, C., and Bromley, J. (2013). Supporting decision making under
uncertainty: Development of a participatory integrated model for water management
in the middle Guadiana river basin. Environmental Modelling & Software, 50(0), 144-
157.
Castelletti, A., and Soncini-Sessa, R. (2007). Bayesian Networks and participatory modelling
in water resource management. Environmental Modelling & Software, 22(8), 1075-
1088.
Chaudhari, P., Dharaskar, R., and Thakare, V. (2010). Computing the most significant solution
from Pareto front obtained in multi-objective evolutionary. J Adv Comput Sci Appl
1(4):63-68.
Chen, J., Qin, Z., and Jia, J. (2008). A Weighted Mean Subtractive Clustering Algorithm.
Information Technology Journal, 7: 356-360.
Chen, S. H., Jakeman, A. J., and Norton, J. P. (2008). Artificial Intelligence techniques: An
introduction to their use for modelling environmental systems. Mathematics and
Computers in Simulation, 78(2-3), 379-400.
Chiu, S. L. (1994). Fuzzy Model Identification Based on Cluster Estimation. Journal on
Intelligent Fuzzy Systems,, 2, 267-278.
Chou, S.-Y., Chang, Y.-H., and Shen, C.-Y. (2008). A fuzzy simple additive weighting system
under group decision-making for facility location selection with objective/subjective
attributes. European Journal of Operational Research, 189(1), 132-145.
Craswell, E., Bonnell, M., Bossio, D., Demuth, S., Giesen, N., and Pahl-Wostl, C. (2007).
Transitions towards adaptive management of water facing climate and global change.
Integrated Assessment of Water Resources and Global Change, Springer,
Netherlands, 49-62.
Destouni, G. (1992). Prediction uncertainty in solute flux through heterogeneous soil. Water
Resources Research, 28(3), 793-801.
Di Baldassarre, G., Viglione, A., Carr, G., Kuil, L., Salinas, J. L., and Blöschl, G. (2013). Socio-
hydrology: conceptualising human-flood interactions. Hydrol. Earth Syst. Sci.
Discuss., 10(4), 4515-4536.

References
133
Dietz, T. (2003). What is a Good Decision? Criteria for Environmental Decision Making.
Human Ecology, 10(1), 33-39.
Drobinski, P., Anav, A., Lebeaupin Brossier, C., Samson, G., Stéfanon, M., Bastin, S.,
Baklouti, M., Béranger, K., Beuvier, J., Bourdallé-Badie, R., Coquart, L., D'Andrea, F.,
de Noblet-Ducoudré, N., Diaz, F., Dutay, J.-C., Ethe, C., Foujols, M.-A.,
Khvorostyanov, D., Madec, G., Mancip, M., Masson, S., Menut, L., Palmieri, J.,
Polcher, J., Turquety, S., Valcke, S., and Viovy, N. (2012). Model of the Regional
Coupled Earth system (MORCE): Application to process and climate studies in
vulnerable regions. Environmental Modelling & Software, 35, 1-18.
Dudewicz, E., and Mishra, S. (1988). Modern mathematical statistics. Wiley series in
probability and mathematical statistics. Wiley, New York.
EU Commission (2000). Directive 2000/60/EC of the European Parliament and of the Council,
establishing a framework for the Community action in the field of water policy.
Official Journal of the Eureopan Economics, K 327.
Falkenmark, M., and Rockström, J. (2004). Balancing water for humans and nature: The new
approach in ecohydrology. Earthscan, London, UK.
FAO (2013). AQUASTAT database, Food and agriculture organization of the United Nations
(FAO). On-line database available from: URL http://www.fao.org/nr/water/aquastat/
(last accessed on 13/03/2013).
Figueira, J., Mousseau, V., and Roy, B. (2005). ELECTRE methods. In: Figueira J, Salvatore
G, Ehrgott M (eds) Multiple criteria decision analysis: state of the art surveys.
Springer, Heidelberg | New York, pp133–162.
Forester, J. (1961). Industrial dynamics. M.I.T Press, Cambridge, MA.
Gerner, A., Schütze, N., and Schmitz, G. H. (2012). Portrayal of fuzzy recharge areas for
water balance modelling-a case study in northern Oman. Adv. Geosci., 31, 1-7.
Giordano, R., D'Agostino, D., Apollonio, C., Lamaddalena, N., and Vurro, M. (2013). Bayesian
Belief Network to support conflict analysis for groundwater protection: The case of
the Apulia region. Journal of Environmental Management, 115, 136-146.

References
134
Giupponi, C., and Sgobbi, A. (2013). Decision support systems for water resources
management in developing countries: Learning from experiences in Africa. Water
5(798–818).
Grundmann, J., Schu¨tze, N., Schmitz, G., and Al-Shaqsi, S. (2012). Towards an integrated
arid zone water management using simulation-based optimisation. Environmental
Earth Sciences, 65(5), 1381-1394.
Grundmann, J., Schuetze, N., and Lennartz, F. (2013). Sustainable management of a coupled
groundwater-agriculture hydrosystem using multi-criteria simulation based
optimisation. Water Science and Technology, 67(3), 689-698.
GWP (2000). Global water partnership (GWP) Integrated water resources management. Tac
Background Papers No. 4. Stockholm, Sweden.
GWP (2012). Global water partnership (GWP) available from: URL http:// www.gwp.org/The-
Challenge/What-is-IWRM/.
Hajkowicz, S., and Collins, K. (2007). A Review of Multiple Criteria Analysis for Water
Resource Planning and Management. Water Resources Management, 21(9), 1553-
1566.
Harou, J. J., Pulido-Velazquez, M., Rosenberg, D. E., Medellín-Azuara, J., Lund, J. R., and
Howitt, R. E. (2009). Hydro-economic models: Concepts, design, applications, and
future prospects. Journal of Hydrology, 375(3-4), 627-643.
Hassanzadeh, E., Elshorbagy, A., Wheater, H., and Gober, P. (2014). Managing water in
complex systems: An integrated water resources model for Saskatchewan, Canada.
Environmental Modelling & Software, 58(0), 12-26.
Helton, J. C. (1997). Uncertainty and sensitivity analysis in the presence of stochastic and
subjective uncertainty. Journal of Statistical Computation and Simulation, 57(1-4), 3-
76.
Henriksen, H. J., Rasmussen, P., Brandt, G., von Bülow, D., and Jensen, F. V. (2007). Public
participation modelling using Bayesian networks in management of groundwater
contamination. Environmental Modelling & Software, 22(8), 1101-1113.
Hering, J., and Ingold, K. (2012). Water resources management: what should be integrated?.
Science, 336(6086), 1234-1235.

References
135
Hill, M. O. (1973). Diversity and Evenness: A unifying notation and its consequences.
Ecology, 54(2), 427-432.
Hong, B., Limburg, K. E., Hall, M. H., Mountrakis, G., Groffman, P. M., Hyde, K., Luo, L.,
Kelly, V. R., and Myers, S. J. (2012). An integrated monitoring/modeling framework
for assessing human-nature interactions in urbanizing watersheds: Wappinger and
Onondaga Creek watersheds, New York, USA. Environmental Modelling & Software,
32(0), 1-15.
Hyde, K., Maier, H., and Colby, C. (2004). Reliability-Based Approach to Multicriteria Decision
Analysis for Water Resources. Journal of Water Resources Planning and
Management, 130(6), 429-438.
Hyde, K. M. (2006). Uncertainty analysis methods for multi-criteria decision analysis, PhD
thesis, The university of Adelaide, Adelaide.
Jakeman, A. J., and Letcher, R. A. (2003). Integrated assessment and modelling: features,
principles and examples for catchment management. Environmental Modelling &
Software, 18(6), 491-501.
Jensen, F. V., and Nielsen, T. D. (2007). Bayesian Networks and Decission Graphs, Springer,
Berlin, p448.
Jiao, W., and Xu, Z. (2013). A distributed runoff model for the mountainous region of the
Heihe River Basin (China) based on the spatial modeling environment (SME) I: model
structure and equations. Environmental Earth Sciences, 68(3), 881-888.
Jing, L., Chen, B., Zhang, B., and Peng, H. (2013). A hybrid fuzzy stochastic analytical
hierarchy process (FSAHP) approach for evaluating ballast water treatment
technologies. Environmental Systems Research C7 - 10, 2(1), 1-10.
Kalbacher, T., Delfs, J.-O., Shao, H., Wang, W., Walther, M., Samaniego, L., Schneider, C.,
Kumar, R., Musolff, A., Centler, F., Sun, F., Hildebrandt, A., Liedl, R., Borchardt, D.,
Krebs, P., and Kolditz, O. (2012). The IWAS-ToolBox: Software coupling for an
integrated water resources management. Environmental Earth Sciences, 65(5), 1367-
1380.
Kalbus, E., Kalbacher, T., Kolditz, O., Krüger, E., Seegert, J., Röstel, G., Teutsch, G.,
Borchardt, D., and Krebs, P. (2012). Integrated Water Resources Management under

References
136
different hydrological, climatic and socio-economic conditions. Environmental Earth
Sciences, 65(5), 1363-1366.
Kaplan, S., and Garrick, B. J. (1981). On The Quantitative Definition of Risk. Risk Analysis,
1(1), 11-27.
Keating, B., Carberry. PS, Hammer. GL, Probert. ME, Robertson. MJ, Holzworth. D, Huth.
NI, Hargreaves. JNG, Meinke. H, Hochman. Z, McLean. G, Verburg. K, Snow. V,
Dimes. JP, Silburn. M, Wang. E, Brown. S, Bristow. KL, Asseng. S, and al., C. S. e.
(2003). An overview of APSIM, a model designed for farming systems simulation.
European Journal of Agronomy, 18(13-14).
Kelly, R. A., Jakeman, A. J., Barreteau, O., Borsuk, M. E., ElSawah, S., Hamilton, S. H.,
Henriksen, H. J. r., Kuikka, S., Maier, H. R., Rizzoli, A. E., van Delden, H., and Voinov,
A. A. (2013). Selecting among five common modelling approaches for integrated
environmental assessment and management. Environmental Modelling & Software,
47(0), 159-181.
Koudstaal, R., Rijsberman, F. R., and Savenije, H. H. G. (1992). Water and sustainable
development. Nat. Resour.Forum, 16, 277-290.
Koutsoyiannis, D. (2013). Hydrology and change. Hydrological Sciences Journal, 58(6), 1177-
1197.
Kragt, M. E., Robson, B. J., and Macleod, C. J. A. (2013). Modellers' roles in structuring
integrative research projects. Environmental Modelling & Software, 39(0), 322-330.
Landuyt, D., Lemmens, P., D'Hondt, R., Broekx, S., Liekens, I., De Bie, T., Declerck, S. A. J.,
De Meester, L., and Goethals, P. L. M. (2014). An ecosystem service approach to
support integrated pond management: A case study using Bayesian belief networks--
Highlighting opportunities and risks. Journal of Environmental Management, 145, 79-
87.
Li, J., Huang, G. H., Zeng, G., Maqsood, I., and Huang, Y. (2007). An integrated fuzzy-
stochastic modeling approach for risk assessment of groundwater contamination.
Journal of Environmental Management, 82(2), 173-188.

References
137
Li, X., Wei, J., Fu, X., Li, T., and Wang, G. (2014). Knowledge-Based Approach for Reservoir
System Optimization. Journal of Water Resources Planning and Management,
140(6), 04014001.
Lindhe, A., Rosén, L., Norberg, T., Røstum, J., and Pettersson, T. R. (2013). Uncertainty
modelling in multi-criteria analysis of water safety measures. Environment Systems
and Decisions, 33(2), 195-208.
Liu, Y., Gupta, H., Springer, E., and Wagener, T. (2008). Linking science with environmental
decision making: Experiences from an integrated modeling approach to supporting
sustainable water resources management. Environmental Modelling & Software,
23(7), 846-858.
Loucks, D., and van Beek, E. (2005). Water resources systems planning and management:
an introduction to methods, models and applications. UNESCO,Paris.
Marcot, B. G. (2006). Characterizing species at risk I: modeling rare species under the
Northwest Forest Plan. Ecology and Society, 11(2).
Marcot, B. G. (2012). Metrics for evaluating performance and uncertainty of Bayesian
network models. Ecological Modelling, 230(0), 50-62.
Marke, T., Strasser, U., Kraller, G., Warscher, M., Kunstmann, H., Franz, H., and Vogel, M.
(2013). The Berchtesgaden National Park (Bavaria, Germany): a platform for
interdisciplinary catchment research. Environmental Earth Sciences, 69(2), 679-694.
Matthies, M., Berlekamp, J., Lautenbach, S., Graf, N., and Reimer, S. (2006). System
analysis of water quality management for the Elbe river basin. Environmental
Modelling & Software, 21(9), 1309-1318.
Matthies, M., Giupponi, C., and Ostendorf, B. (2007). Environmental decision support
systems: Current issues, methods and tools. Environmental Modelling & Software,
22(2), 123-127.
Molina, J. L., Bromley, J., García-Aróstegui, J. L., Sullivan, C., and Benavente, J. (2010).
Integrated water resources management of overexploited hydrogeological systems
using Object-Oriented Bayesian Networks. Environmental Modelling & Software,
25(4), 383-397.

References
138
Montanari, A., Young, G., Savenije, H. H. G., Hughes, D., Wagener, T., Ren, L. L.,
Koutsoyiannis, D., Cudennec, C., Toth, E., Grimaldi, S., Blöschl, G., Sivapalan, M.,
Beven, K., Gupta, H., Hipsey, M., Schaefli, B., Arheimer, B., Boegh, E., Schymanski,
S. J., Di Baldassarre, G., Yu, B., Hubert, P., Huang, Y., Schumann, A., Post, D. A.,
Srinivasan, V., Harman, C., Thompson, S., Rogger, M., Viglione, A., McMillan, H.,
Characklis, G., Pang, Z., and Belyaev, V. (2013). "Panta Rhei - Everything Flows":
Change in hydrology and society -The IAHS Scientific Decade 2013 -2022.
Hydrological Sciences Journal, 58(6), 1256-1275.
Morris, M. D. (1991). Factorial sampling plans for preliminary computational experiments.
Technometrics, 33, 161-174.
Mousavi, S. M., Jolai, F., and Tavakkoli-Moghaddam, R. (2013). A Fuzzy Stochastic Multi-
Attribute Group Decision-Making Approach for Selection Problems. Group Decision
and Negotiation, 22(2), 207-233.
MRMWR (1998). Ministry of Regional Municipalities and Water Resources (MRMWR) (1998)
Water resources mater plan for Oman. Sultanate of Oman, Oman.
Nabney, I. (2002). NETLAB Algorithms for Pattern Recognition, Springer, London.
Pahl-Wostl, C. (2002). Participative and Stakeholder-Based Policy Design, Evaluation and
Modeling Processes. Integrated Assessment, 3(1), 3-14.
Pahl-Wostl, C. (2007). The implications of complexity for integrated resources management.
Environmental Modelling & Software, 22(5), 561-569.
Pearl, J. (1988). Probabilistic reasoning in intelligent systems: networks of plausible
inference, Morgan Kaufmann Publishers Inc, Waltham.
Pearl, J. (1991). Probabilistic reasoning in intelligent systems: networks of plausible
inference. Revised second printing, Morgan Kaufmann Publishers,San Mateo,
California. PP. 384.
Pérez-Miñana, E., Krause, P. J., and Thornton, J. (2012). Bayesian Networks for the
management of greenhouse gas emissions in the British agricultural sector.
Environmental Modelling & Software, 35(0), 132-148.
Rakhmatullaev, S., Huneau, F. d. r., Kazbekov, J., Le Coustumer, P., Jumanov, J., El Oifi, B.,
Motelica-Heino, M., and Hrkal, Z. (2010). Groundwater resources use and

References
139
management in the Amu Darya River Basin (Central Asia). Environmental Earth
Sciences, 59(6), 1183-1193.
Reddy, M., and Kumar, D. (2007). Multi-objective particle swarm optimization for generating
optimal trade-offs in reservoir operation. Hydrol Process, 21:2897–2909.
Reichert, P., and Borsuk, M. E. (2005). Does high forecast uncertainty preclude effective
decision support?. Environmental Modelling & Software, 20(8), 991-1001.
Rivera, E. C., de Queiroz, J. F., Ferraz, J. M., and Ortega, E. (2007). Systems models to
evaluate eutrophication in the Broa Reservoir, São Carlos, Brazil. Ecological
Modelling, 202(3-4), 518-526.
Rotmans, J., and Van Asselt, M. (1996). Integrated assessment: A growing child on its way
to maturity. Climatic Change, 34(3-4), 327-336.
Rounsevell, M. D. A., Arneth, A., Alexander, P., Brown, D. G., de Noblet-Ducoudré, N., Ellis,
E., Finnigan, J., Galvin, K., Grigg, N., Harman, I., Lennox, J., Magliocca, N., Parker, D.,
O'Neill, B. C., Verburg, P. H., and Young, O. (2014). Towards decision-based global
land use models for improved understanding of the Earth system. Earth Syst.
Dynam., 5(1), 117-137.
Saaty, T. (1980). The Analytic Hierarchy Process: Planning, Priority Setting and Resource
Allocation, McGraw-Hill, New York, NY, USA.
Schütze, N., de Paly, M., and Shamir, U. (2012a). Novel simulation-based algorithms for
optimal open-loop and closed-loop scheduling of deficit irrigation systems. Journal of
Hydroinformatics, 14(1), 136-151.
Schütze, N., Kloss, S., Lennartz, F., Al Bakri, A., and Schmitz, G. (2012b). Optimal planning
and operation of irrigation systems under water resource constraints in Oman
considering climatic uncertainty. Environmental Earth Sciences, 65(5), 1511-1521.
Schütze, N., and Schmitz, G. (2010). OCCASION: New Planning Tool for Optimal Climate
Change Adaption Strategies in Irrigation. Journal of Irrigation and Drainage
Engineering, 136(12), 836-846.
Semenov, M., Brooks, R., Barrow, E., and Richardson, C. (1998). Comparison of the WGEN
and LARS-WG stochastic weather generators for diverse climates. Clim Res
10(2):95–107.

References
140
Serrat-Capdevila, A., Valdes, J., and Gupta, H. (2011). Decision support systems in water
resources planning and management: stakeholder participation and the sustainable
path to science-based decision making. In Jao C (ed) Efficient decision support
systems -practice and challenges from current to future. InTech, India.
Simonovic, S. P. (2009). Managing Water Resources: Methods and Tools for a Systems
Approach. UNESCO, UK.
Simonovic, S. P., and Fahmy, H. (1999). A new modeling approach for water resources
policy analysis. Water Resources Research, 35(1), 295-304.
Simonovic, S. P., and Nirupama. (2005). A spatial multi-objective decision-making under
uncertainty for water resources management. Journal of Hydroinformatics, 7 117-
133.
Smajgl, A., Brown, D. G., Valbuena, D., and Huigen, M. G. A. (2011). Empirical
characterisation of agent behaviours in socio-ecological systems. Environmental
Modelling & Software, 26(7), 837-844.
Soncini-Sessa, R., Weber, E., and Castelletti, A. (2007). Integrated and participatory water
resources management-theory, Elsevier, Amsterdam.
Steppuhn, H., Genuchten. MT, and CM, v. G. ( 2005). Root-zone salinity: II. Indices for
tolerance in agricultural crops. Crop Sci, 45(1), 221-232.
Stewart, T. (2005). Dealing with Uncertainties in MCDA. Multiple Criteria Decision Analysis:
State of the Art Surveys, Springer, New York, 445-466.
Subagadis, Y., Grundmann, J., Schütze, N., and Schmitz, G. (2014a). An integrated approach
to conceptualise hydrological and socio-economic interaction for supporting
management decisions of coupled groundwater-agricultural systems. Environmental
Earth Sciences, 72 (12), 4917–4933, doi10.1007/s12665-014-3238-1.
Subagadis, Y. H., Schütze, N., and Grundmann, J. (2014b). Multi-criteria multi-stakeholder
decision analysis using a fuzzy-stochastic approach for hydrosystem management.
Proc. IAHS, 364, 464-469,doi:10.5194/piahs-364-464-2014.
Subagadis, Y. H., Schütze, N., and Grundmann, J. (2015). A fuzzy-stochastic modeling
approach for multiple criteria decision analysis of coupled groundwater-agriculteral
systems under multiple uncertainites. Water Resources Managment (in review).

References
141
Tesfamariam, S., and Sadiq, R. (2008). Probabilistic risk analysis using ordered weighted
averaging (OWA) operators. Stochastic Environmental Research and Risk
Assessment, 22(1), 1-15.
Ticehurst, J. L., Curtis, A., and Merritt, W. S. (2011). Using Bayesian Networks to
complement conventional analyses to explore landholder management of native
vegetation. Environmental Modelling & Software, 26(1), 52-65.
Ticehurst, J. L., Newham, L. T. H., Rissik, D., Letcher, R. A., and Jakeman, A. J. (2007). A
Bayesian network approach for assessing the sustainability of coastal lakes in New
South Wales, Australia. Environmental Modelling & Software, 22(8), 1129-1139.
Tung, Y.-K., Wang, P.-Y., and Yang, J.-C. (1993). Water resource projects evaluation and
ranking under economic uncertainty. Water Resources Management, 7(4), 311-333.
UN (2011). Environmental managmnet group (EMG), a United Nations (UN) system-wide
coordination body on environment and human settlements.Geneva, Switzerland.
UNEP/GRID-Arendal (2008). Vital water graphics: An overview of the state of the world's
fresh and marine waters - 2nd edition, GRID-Arendal, Norway.
UN Water (2012). Managing water under uncertainty and risk, The United Nations world
water development report 4, UN Water Reports, World Water Assessment
Programme, UNESCO, Paris, France.
van Delden, H., Seppelt, R., White, R., and Jakeman, A. J. (2011). A methodology for the
design and development of integrated models for policy support. Environmental
Modelling & Software, 26(3), 266-279.
Voinov, A., and Bousquet, F. (2010). Modelling with stakeholders. Environmental Modelling
& Software, 25(11), 1268-1281.
Voinov, A., and Cerco, C. (2010). Model integration and the role of data. Environmental
Modelling & Software, 25(8), 965-969.
Vrugt, J. A., Robinson, B. A., and Hyman, J. M. (2009). Self-Adaptive Multimethod Search for
Global Optimization in Real-Parameter Spaces. Evolutionary Computation, IEEE
Transactions on, 13(2), 243-259.

References
142
Vucetic, D., and Simonovic, S. P. (2011). Water resources decision making under
uncertainty. A report prepared for the canadian foundation for climate and
atmospheric sciences, London, Canada.
Walther, M., Delfs, J. O., Grundmann, J., Kolditz, O., and Liedl, R. (2012). Saltwater intrusion
modeling: Verification and application to an agricultural coastal arid region in Oman.
Journal of Computational and Applied Mathematics, 236(18), 4798-4809.
Wang, H. (2006). Using sensitivity analysis to validate Bayesian networks for airplane
subsystem diagnosis. Aerospace Conference, IEEE, 10 pp.
Wei, S., Yang, H., Song, J., Abbaspour, K. C., and Xu, Z. (2012). System dynamics simulation
model for assessing socio-economic impacts of different levels of environmental
flow allocation in the Weihe River Basin, China. European Journal of Operational
Research, 221(1), 248-262.
Wong, E. T. T., Norman, G., and Flanagan, R. (2000). A fuzzy stochastic technique for project
selection. Construction Management and Economics, 18(4), 407-414.
Xu, Y.-P., and Tung, Y.-K. (2008). Decision-making in Water Management under Uncertainty.
Water Resources Management, 22(5), 535-550.
Xu, Z. S., and Da, Q. L. (2003). An overview of operators for aggregating information.
International Journal of Intelligent Systems, 18(9), 953-969.
Yager, R., and Filev, D. (1994). Generation of Fuzzy Rules by Mountain Clustering. Journal of
Intelligent & Fuzzy Systems, 2(3), 209-219.
Yager, R. R. (1996). Quantifier guided aggregation using OWA operators. International
Journal of Intelligent Systems, 11(1), 49-73.
Yager, R. R., Kacprzyk, J., and Beliakov, G. (2011). Recent Developments in the Ordered
Weighted Averaging Operators: Theory and Practice, Springer, Berlin | Heidelberg.
Zadeh, L. (1965a). Fuzzy sets. Information and controls, 8, 338 -353.
Zagonari, F., and Rossi, C. (2013). A heterogeneous multi-criteria multi-expert decision-
support system for scoring combinations of flood mitigation and recovery options.
Environmental Modelling & Software, 49(0), 152-165.

References
143
Zarghami, M., Szidarovszky, F., and Ardakanian, R. (2008). A fuzzy-stochastic OWA model
for robust multi-criteria decision making. Fuzzy Optimization and Decision Making,
7(1), 1-15.
Zeleny, M. (1973). Compromise Programming. In Multiple Criteria Decision Making, (editors
J. Cochrane and M. Zeleny), pages 262-301. University of South Carolina Press,
Columbia.
Zhang, R., Duan, Z., Tan, M., and Chen, X. (2012). The assessment of water stress with the
Water Poverty Index in the Shiyang River Basin in China. Environmental Earth
Sciences, 67(7), 2155-2160.
Zhang, X. H., Zhang, H. W., Chen, B., Chen, G. Q., and Zhao, X. H. (2008). Water resources
planning based on complex system dynamics: A case study of Tianjin city.
Communications in Nonlinear Science and Numerical Simulation, 13(10), 2328-2336.
Zimmermann, H. J. (2010). Fuzzy set theory. Wiley Interdisciplinary Reviews: Computational
Statistics, 2(3), 317-332.

144
Appendix A
A.1Summary of different measures
A.2 Exemplary sensitivity analysis conducted on the BN model
A.3 Superimposed cumulative distribution functions generated using OWA operator
A.4 Probability of ranking change

Appendix
145
A.1 Summary of different measures potentially useful for assessing performance and
uncertainty of BN models (modified after Marcot 2012).
Measure (metric) Use Assumptions and limitations
Model sensitivity and
influnce
Entropy reduction
Variance reduction
Influnce analysis
Applied to ordinal-scale or
categorical variables
Applied to continous variables
Determines incremental effects of selected inputs set to best, worst, or other specified values.
Input variables are set to their default priori probabilities unless specifically desired otherwise
As above
Best used for scenario analysis and not necessarily for prediction
Model outcome
uncertainty
Posterior probability certainty index
Gini coefficient
Bayesian credible interval
Indexes degree of dispersion of posterior probability values among outcome states, normalized for number of states and possible minimum and maximum values
Indexes degree of dispersion of posterior probability values among outcome states
Depicts range of model results for a specified percent level of acceptability
Useful if the degree of spread of probabilities among outcome states is of interest in a decision framework
Maximum value is constrained by number of states
Assumes continuous or ordinal-scale variables; not meaningful with categorical variables. Interval range should be selected prior to model development
Model complexty
Number of variables
Number of links
Number of node states
Number of conditional probabilities
Determines degrees of freedom Depicts degree of connectivity
of variables in the model
Affects model precision and overall number of probability values in the model
Sensitive to model structure, including variable connections and precision
Important to include latent variables
Important to denote and include any links between correlated input variables
Count number of states after discretizing continuous functions to desired precision
Does not include prior (unconditional) probability tables; could include if desired

Appendix
146
A.2 Exemplary sensitivity analysis conducted on the BN model, considering sustainability
of hydrosystem and net profit as target node under a particular alternative scenario (A1).

Appendix
147
A.3 Superimposed cumulative distribution functions generated using OWA operator for the
optimism degree of 0.5 (a) and 0.2 (b), 0.7 (c), and 0.3 (d) for the three alternatives.

Appendix
148
A.4 Probability of ranking change, for the risk taking decision-making process, indicated by
projections.

Selected Publications
149
Appendix B
Selected Publications of the Author
Page 151
Subagadis, Y., Grundmann, J., Schütze, N., and Schmitz, G. (2014a).
An integrated approach to conceptualise hydrological and socio-
economic interaction for supporting management decisions of coupled
groundwater-agricultural systems.
Environmental Earth Sciences, 72 (12), 4917–4933, DOI:10.1007/s12665-014-3238-1.
Page 169 Subagadis, Y. H., Schütze, N., and Grundmann, J. (2014b).
Multi-criteria multi-stakeholder decision analysis using a fuzzy-
stochastic approach for hydrosystem management.
Proc. IAHS, 364, 464-469,DOI:10.5194/piahs-364-464-2014.

THEMATIC ISSUE
An integrated approach to conceptualise hydrologicaland socio-economic interaction for supporting managementdecisions of coupled groundwater–agricultural systems
Yohannes Hagos Subagadis • Jens Grundmann •
Niels Schutze • Gerd H. Schmitz
Received: 15 November 2013 / Accepted: 28 March 2014 / Published online: 18 April 2014
� Springer-Verlag Berlin Heidelberg 2014
Abstract The management of complex interacting hy-
drosystems is challenging if in addition to the physical
processes also socio-economic and environmental aspects
have to be considered. This causes conflicts of interests
among various water actors with mostly contradicting
objectives and uncertainties about the consequences of
potential management interventions. The objective of this
paper is to present a methodological framework to support
decision making under uncertainties for the management of
complex hydrosystems. The proposed framework concep-
tualises hydrological and socio-economic interactions by
constructing a Bayesian network (BN)-based decision
support tool for a typical management problem of agri-
cultural coastal regions. Thereby, the paper demonstrates
the value of combining two different commonly used
integrated modelling approaches. Coupled domain models
are applied to simulate the nonlinearities and feedbacks of
a strongly interacting groundwater–agriculture hydrosys-
tem. Afterwards, a BN is used to integrate their results
together with empirical knowledge and expert opinions
regarding potential management interventions. A prototype
application is performed for a coastal arid region, which is
affected by saltwater intrusion into a coastal aquifer due to
excessive groundwater extraction for irrigated agriculture.
It addresses the issues of contradicting management
objectives such as sustainable aquifer management vs.
profitable agricultural production and the problem of
finding appropriate management interventions or policies.
Several policy combinations have been analysed regarding
their efficiency within different management scenarios in a
probabilistic way, which enables decision makers to assess
the risks associated with implementing alternative man-
agement strategies. In addition, efficient metrics for eval-
uating performance and uncertainty of the developed task-
specific BN are used which underline the reliability of the
results.
Keywords Bayesian network � Simulation–optimisation �Integrated management � Decision support tool �Groundwater � Agriculture
Introduction
The management of water resources in areas with high
demands and scarcity of water coupled with socio-eco-
nomic and environmental issues is extremely challenging
(Craswell et al. 2007; Kalbus et al. 2012; Zhang et al.
2012). Frequently, the competition for water causes con-
flicts of interests among various water actors with mostly
contradicting objectives. Furthermore, uncertainty about
the consequences of potential management interventions
poses unique challenge for decision makers (Craswell et al.
2007; Jiao and Xu 2013).
The traditional approach of considering water issue
isolated from socio-economic and environmental aspects is
no longer viable (Hong et al. 2012; Marke et al. 2013). To
address these challenges, the principles and policies of
Integrated Water Resources Management (IWRM) had
been formulated (GPW 2012). This includes participation
of stakeholders through their engagement in the decision-
making process of water management (Carmona et al.
2011). However, environmental and natural resources
Y. H. Subagadis (&) � J. Grundmann � N. Schutze �G. H. Schmitz
Institute of Hydrology and Meteorology, Technische Universitat
Dresden, 01069 Dresden, Germany
e-mail: [email protected];
123
Environ Earth Sci (2014) 72:4917–4933
DOI 10.1007/s12665-014-3238-1
managers and decision makers need models which help
them to understand the effectiveness of alternative man-
agement decisions (Matthies et al. 2007). Water resources
managers currently face a challenge to find quantitative
tools for evaluating the consequences of their management
interventions, if in addition to the physical processes also
socio-economic and environmental aspects are considered
(Henriksen et al. 2007; Molina et al. 2010).
In the literature, the development of integrated Decision
Support Systems (DSS) is considered as one of the best
ways to handle water resources interwoven with numerous
socio-economic activities, as well as environmental issues
(Liu et al. 2008; Serrat-Capdevila et al. 2011). Until now,
the development and implementation of an effective deci-
sion support tool on the basis of a holistic understanding of
system processes (hydrological, environmental and socio-
economic) is fraught with problems (Serrat-Capdevila et al.
2011; Hering and Ingold 2012).
The main challenge of applying a DSS approach in real-
world IWRM is the high complexity due to nonlinearities,
feedbacks and delays in decision making (Loucks and Beek
2005). This entails the need to develop appropriate tools
for overcoming these complexities and incorporating
uncertainty to support decision making. Modelling
approaches that can integrate different system processes
into a combined framework are considered to be useful
tools to understand the complex interaction and to evaluate
how these system processes respond to various changes
(Rakhmatullaev et al. 2010; Kalbacher et al. 2012; Kragt
et al. 2013; Marke et al. 2013). Kelly et al. (2013) reviewed
most commonly used approaches for integrated modelling
such as (1) Bayesian network (BN), (2) coupled domain
models (coupled component models), (3) agent-based
models, (4) system dynamics and (5) knowledge-based
models. These types of models have important differences
which limit their applicability depending on how and what
issues they can accommodate such as knowledge type,
uncertainty and stakeholder engagement. For example, a
Bayesian network model is a powerful tool for handling
system processes with uncertain input (or output) charac-
terised by probability distribution, while coupled domain
models are more suitable for simulating system processes
with nonlinearity and feedbacks. Until recently, many
water system modelling approaches were restricted to
single disciplinary models that represent physical systems
with limited consideration of socio-economic issues and
stakeholder participation (Perez-Minana et al. 2012). For
effective decision making, it is important to embrace
simultaneous and/or complementary use of interdisciplin-
ary methods to overcome traditional decision-making
problems and to allow for the incorporation of a broader
knowledge. To improve the ability of integrated modelling
it is important to expand an approach that can incorporate
multidisciplinary system process, analyses management
alternatives with the involvement of stakeholders and
communicate results in a transparent way.
Bayesian network is an integrated modelling approach for
depicting probabilistic relations among elements of the
model, where objective data are lacking and use of expert
opinion is necessary (Barton et al. 2008; Ticehurst et al.
2011; Kelly et al. 2013). This is helpful to capture uncertainty
involved in the complexity and for quantification of societal
and human inputs, which require soft knowledge (Bromley
et al. 2005; Barton et al. 2012). The use of BN presents a
number of advantages over other decision support tools
(Castelletti and Soncini-Sessa 2007; Ticehurst et al. 2007;
Giordano et al. 2013), for example: (1) stakeholder inputs,
expert opinions and local knowledge can be easily incorpo-
rated; (2) a variety of information such as quantitative and
qualitative data can be integrated; and (3) uncertainty among
variables can be represented simply and the model can be
easily updated if new information is available. However, BN
alone is inadequate to address the complexity of water sys-
tems such as optimisation of complex water systems,
dynamic feedbacks, nonlinearity and delays (Kelly et al.
2013). Therefore, combining BN with other integrated
modelling approaches can compensate for these deficiencies.
The management of water resources involving strong
interactions between groundwater and agriculture is asso-
ciated with contradicting objectives (e.g. maintaining sus-
tainable groundwater abstraction vs. maximising
agricultural profit), as they affect each other adversely.
Multi-criteria optimisation of coupled domain models
allows for addressing these trade-offs (Grundmann et al.
2013). Applying multi-criteria optimisation techniques
generate a large number of so-called Pareto-optimal solu-
tions, depending on the formulation of the management
problem. However, interpreting and communicating those
solutions to decision makers remain a significant challenge,
because a Pareto-optimal data set consists usually of too
many solutions. Therefore, it is difficult to identify solutions,
which have similar levels of goals attainment corresponding
to sets of decisions. This entails for post-Pareto-optimality
analysis to assist decision makers to understand Pareto-
optimal solutions in multi-objective decision problems
(Reddy and Kumar 2007; Chaudhari et al. 2010).
The objective of this study is to develop a methodo-
logical framework to support decision making under
uncertainties for the management of complex hydrosys-
tems. The proposed framework conceptualises hydrologi-
cal and socio-economic interactions by constructing a
Bayesian network-based decision support tool for a typical
management problem of agricultural coastal regions.
Thereby, the paper demonstrates the value of combining
two different commonly used integrated modelling
approaches. At first, coupled domain models are applied to
4918 Environ Earth Sci (2014) 72:4917–4933
123
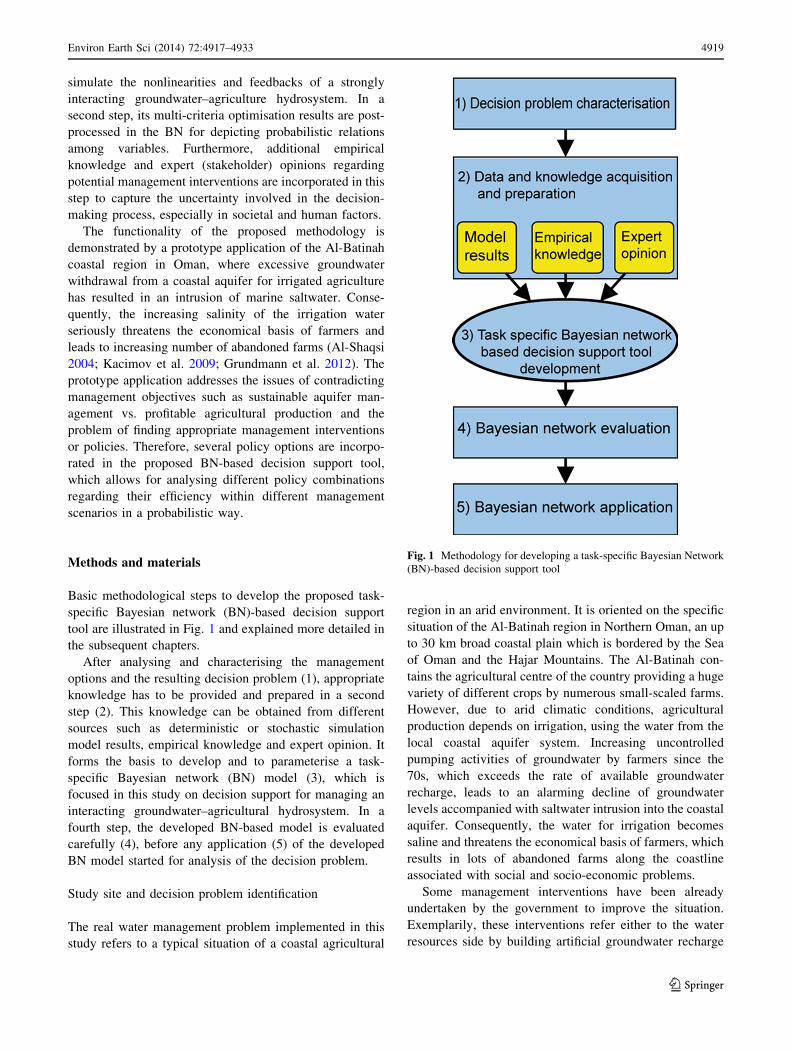
simulate the nonlinearities and feedbacks of a strongly
interacting groundwater–agriculture hydrosystem. In a
second step, its multi-criteria optimisation results are post-
processed in the BN for depicting probabilistic relations
among variables. Furthermore, additional empirical
knowledge and expert (stakeholder) opinions regarding
potential management interventions are incorporated in this
step to capture the uncertainty involved in the decision-
making process, especially in societal and human factors.
The functionality of the proposed methodology is
demonstrated by a prototype application of the Al-Batinah
coastal region in Oman, where excessive groundwater
withdrawal from a coastal aquifer for irrigated agriculture
has resulted in an intrusion of marine saltwater. Conse-
quently, the increasing salinity of the irrigation water
seriously threatens the economical basis of farmers and
leads to increasing number of abandoned farms (Al-Shaqsi
2004; Kacimov et al. 2009; Grundmann et al. 2012). The
prototype application addresses the issues of contradicting
management objectives such as sustainable aquifer man-
agement vs. profitable agricultural production and the
problem of finding appropriate management interventions
or policies. Therefore, several policy options are incorpo-
rated in the proposed BN-based decision support tool,
which allows for analysing different policy combinations
regarding their efficiency within different management
scenarios in a probabilistic way.
Methods and materials
Basic methodological steps to develop the proposed task-
specific Bayesian network (BN)-based decision support
tool are illustrated in Fig. 1 and explained more detailed in
the subsequent chapters.
After analysing and characterising the management
options and the resulting decision problem (1), appropriate
knowledge has to be provided and prepared in a second
step (2). This knowledge can be obtained from different
sources such as deterministic or stochastic simulation
model results, empirical knowledge and expert opinion. It
forms the basis to develop and to parameterise a task-
specific Bayesian network (BN) model (3), which is
focused in this study on decision support for managing an
interacting groundwater–agricultural hydrosystem. In a
fourth step, the developed BN-based model is evaluated
carefully (4), before any application (5) of the developed
BN model started for analysis of the decision problem.
Study site and decision problem identification
The real water management problem implemented in this
study refers to a typical situation of a coastal agricultural
region in an arid environment. It is oriented on the specific
situation of the Al-Batinah region in Northern Oman, an up
to 30 km broad coastal plain which is bordered by the Sea
of Oman and the Hajar Mountains. The Al-Batinah con-
tains the agricultural centre of the country providing a huge
variety of different crops by numerous small-scaled farms.
However, due to arid climatic conditions, agricultural
production depends on irrigation, using the water from the
local coastal aquifer system. Increasing uncontrolled
pumping activities of groundwater by farmers since the
70s, which exceeds the rate of available groundwater
recharge, leads to an alarming decline of groundwater
levels accompanied with saltwater intrusion into the coastal
aquifer. Consequently, the water for irrigation becomes
saline and threatens the economical basis of farmers, which
results in lots of abandoned farms along the coastline
associated with social and socio-economic problems.
Some management interventions have been already
undertaken by the government to improve the situation.
Exemplarily, these interventions refer either to the water
resources side by building artificial groundwater recharge
Fig. 1 Methodology for developing a task-specific Bayesian Network
(BN)-based decision support tool
Environ Earth Sci (2014) 72:4917–4933 4919
123

dams to use surface water runoff more efficiently for
recharging the aquifer or to the water demand side by
implementing measures such as stopping of drilling new
wells or moving fodder crops with high water demands
more inland. However, the situation remains still worse and
may require more drastic management interventions which
may range between the extremes of stopping all agricul-
tural activities to recover the local aquifer system or pro-
ducing as much as possible as long as water and soil
resources will be available (sustainable aquifer vs. high
profitable agricultural production). Due to the nonlinear
behaviour of the coupled physical processes of the coastal
aquifer–agriculture hydrosystem and its interactions with
numerous decision makers (farmers, governmental agen-
cies, etc.), which have different, sometimes contradicting,
interests and views on how to manage the system in a best
way, the decision-making problem is very complex.
Finally, only a combination of different measures or
management interventions will yield to an improvement of
the situation.
Data and knowledge sources
Simulation–optimisation water management model
for coupled groundwater–agriculture hydrosystems
For simulating the interacting physical processes of a
strongly coupled groundwater–agriculture hydrosystem in
arid coastal environments, a simulation-based water man-
agement model has been developed by Grundmann et al.
(2012, 2013). The management model aims at achieving
best possible solutions for groundwater withdrawals for
agricultural water use including saline water management
together with a substantial increase of the water use effi-
ciency by employing novel optimisation strategies for
irrigation control and scheduling. It consists of three major
modules: (1) a water resources module for calculating the
aquifer response, (2) an agricultural module for simulating
the behaviour of farms, and (3) an optimisation module
based on evolutionary optimisation techniques for manag-
ing both, water quality and water quantity (Fig. 2). To
achieve a robust and fast operation of the management
model, computationally intensive process-based domain
models are emulated by surrogate models, which describe
the behaviour of process models using only their most
relevant features regarding management.
The water resources module The aquifer behaviour,
including the seawater interface, is modelled by the
numerical density-depended groundwater flow model
OpenGeoSys (Kolditz et al. 2008). OpenGeoSys was
replaced by an artificial neural network (ANN), which was
trained using a scenario database containing the abstrac-
tions and responses of the groundwater model for all
realistically feasible scenarios. The derived surrogate
model is referred to as ANN-OGS and applied within the
‘‘Water Resources Module’’ of the water management
model (Fig. 2).
The agricultural module For simulating the behaviour of
agricultural farms, a database of two-dimensional crop
water production functions (2D-CWPF) is generated. 2D-
Fig. 2 Simulation–optimisation water management model for coupled groundwater–agriculture hydrosystems consisting of ‘‘water resources
module’’, ‘‘agricultural module’’ and ‘‘optimisation module’’ (for details see also Grundmann et al. 2013)
4920 Environ Earth Sci (2014) 72:4917–4933
123

CWPF describes the relationship between the amount of
irrigated water, its salinity and the potential crop yield for
each crop assuming optimal water applications and allows
for an appropriate choice of crop patterns regarding their
salinity tolerance. For constructing CWPFs, the OCCA-
SION methodology (Optimal Climate Change Adaption
Strategies in Irrigation; Schutze and Schmitz 2010) is used,
which consists of amongst others the soil–vegetation–
atmosphere–transfer (SVAT) model, APSIM (Keating
et al. 2003)––adapted to the regional climate conditions
(Schutze et al. 2012b), and the GET-OPTIS evolutionary
optimisation algorithm for optimal irrigation scheduling
and control (Schutze et al. 2012a). Combining the CWPF
with the salinity tolerance index (Steppuhn et al. 2005)
results in a 2D-CWPF applied within the ‘‘agricultural
module’’ of the water management model (Fig. 2).
The optimisation module The ‘‘optimisation module’’
connects the groundwater and agricultural module and
aims for managing both––water quantity and quality––
according to the given optimisation problem. The optimi-
sation problem is of multi-objective type and considers a
sustainability index (SI) as first objective function of1(Eq. 1) and a second objective of2, which refers to the
profit of the agricultural production (Eq. 2).
The sustainability index describes the stability of the
hydrosystem and evaluates the change of the aquifer state
between the final state tn and the initial state t1 of the
simulation period using the average salinity concentration
S and the water level h on xk observation points
of 1ðtnÞ ¼Xend
k¼1
absðSðt1; xkÞ � Sðtn; xkÞÞSmax
þXend
k¼1
absðhðt1; xkÞ � hðtn; xkÞÞhmax
ð1Þ
The profit function (of2) assumes a rational, profit-ori-
ented behaviour of the farmers by evaluating all the reve-
nues minus the costs (Eq. 2).
of 2 ¼Xn
i¼1
Xm
j¼1
pjyjðtiÞLjðtiÞ � CIjðtiÞ !
� CPðtiÞ" #
ð2Þ
where CIj and CP are the fixed and variable costs for
irrigated agriculture and groundwater pumping, respec-
tively; pj, the current prices for the cultivated crops
j = 1…m which are produced from the acreage Lj for the
cultivation period i = 1…n, and yj the crop yield.
Both objectives are contradicting, as maximising the
profit (of2) will tend to pump much groundwater, and this
will worsen the aquifer’s situation due to a declining water
table. Consequently, this deteriorates the aquifer sustain-
ability–objective function value (of1).
The multi-objective optimisation problem is solved with
the multi-criteria AMALGAM algorithm (Vrugt et al.
2009). AMALGAM evaluates Pareto-optimal solutions,
which allow for identification of best compromises
between the given objectives. Decision variables within the
optimisation problem are: the percentage of the cultivated
crops, the cropping pattern, the acreage and the ground-
water pumping rates for every cultivated period i = 1…n.
(see Fig. 2 and for detailed information Grundmann et al.
2013).
Pareto-front clustering for selection of management sce-
narios Analysing the shape of the Pareto-front helps
decision makers to understand the solution space and to
identify possible trade-offs among the conflicting objec-
tives. However, as the Pareto-optimal solution consists of a
large data set (i.e. 100 of potential solutions), it remains a
significant challenge for decision makers to interpret.
Hence, subtractive clustering (SC) (Chiu 1994; Yager and
Filev 1994) has been used to group the Pareto set into
clusters containing similar Pareto-optimal solutions. These
clusters are further employed for scenario development,
parameterisation and interpretation of the model results.
Based on the location of a data point with respect to all
other data points within the Pareto-optimal solutions, SC
calculates the potential of a data point to become a cluster
centre. Afterwards, the locations of the centres are adapted
to represent the behaviour and similarity of the data points
in a best way. For applying the SC algorithm, the number
of clusters and their initial locations has to be specified by
the user.
Empirical knowledge and expert opinion
Developing a BN-based decision support tool allows for
integrating different type and sources of data (see Fig. 1).
This data can be obtained from deterministic or stochastic
simulation model results, empirical knowledge and expert
opinion. Empirical knowledge comprises information from
surveys, literature, reports or census data. Meanwhile,
expert opinion (or knowledge) refers to subjective profes-
sional judgements. Professional judgement is needed when
there is a lack of objective data. Expert knowledge
becomes an important asset in the formal elicitation of the
BN model structure, selection of variables and their states,
and conditional probability.
This research benefits from stakeholders’ participation
within the frame of the IWAS-Project (International Water
Research Alliance Saxony). Several workshops have been
performed together with experts of involved governmental
agencies, local organisations and universities with interest
in the Oman’s costal hydrosystem and its future. These
discussions have contributed to get insights for obtaining
Environ Earth Sci (2014) 72:4917–4933 4921
123

professional judgments (in terms of expert opinion)
regarding the management intervention variables and
involved hydrosystem processes.
Furthermore, empirical knowledge has been obtained
from reviews of relevant information sources such as
FAO’s Information system on Water and Agriculture
(AQUASTAT) (FAO 2013) and water resources reports
(MRMWR 1998).
Development of a task-specific Bayesian
network-based decision support tool
Principles
Bayesian network model is a probabilistic graphical model
representing a set of variables (cause and effects) and a set
of directed arcs between variables (paths of influence). BNs
are application of Bayes’ theorem that links occurrence of
one event given the occurrence of another event (Pearl
1988; Jensen and Nielsen 2007). BN can help in identifying
relationships between variables, if input probabilities and
conditional probabilistic relationships among variables are
given.
For constructing a BN, the first recommended step is the
identification of all relevant variables in collaboration with
stakeholders preferably (Cain 2001). Once the relevant
variables are identified, a range of possible states is
assigned to them. States should represent all possible
conditions of the variables. The variable states can be
assigned as numeric values or intervals, qualitative esti-
mations or boolean functions. The connections between
variables which characterise their dependencies are repre-
sented by arcs (see Fig. 3). The variable where the arc
originates is called the parent, while where the arc ends is
called the child.
Probabilistic dependencies between variables are quan-
tified using conditional probability tables (CPTs). The
CPTs are used to calculate the resulting probability of a
variable given the values of its parent(s). To fill the CPT
with probability values, information can be obtained from
various sources such as model results, statistical data, and
elicited from expert opinion.
The process by which new evidence entered into the
network and propagated through BN is called ‘‘inference’’.
This process allows for the introduction and analysis of
input variables and to evaluate the consequences (influ-
ence) on the output variable values.
As an example, Fig. 3 shows a simple BN consisting of
three nodes which represents: aquifer recharge (R), varia-
tion of water table levels (H), and groundwater quality (S).
Based on the physical process, aquifer recharge (R) is
conditionally independent; variation of water table levels
(H) and groundwater quality (S) is conditionally dependent
on aquifer recharge(R) and variation of water table levels
(H), respectively. As an illustration, two possible values
(‘states’) [(h1, h2) (s1, s2), (r1, r2)] are considered for the
three variables. To complete the BN, the probability of
aquifer recharge (P(R)), and the conditional probability
distributions P(R|H) and P(H, R|S) in form of CPT are
required. The propagation of information through the BN is
performed by calculations of the conditional probability
distributions P(H|R) and P(S|H, R) based on Bayes’ rule.
(Eqs. 3 and 4).
PðHjRÞ ¼ PðHÞ � PðRjHÞPðRÞ ð3Þ
PðSjH;RÞ ¼ PðSÞ � PðH;RjSÞPðH;RÞ ð4Þ
Here, the left-hand side of Eq. 3 is the conditional
probability of H, given a set of observations of R. The first
term in the numerator of the right-hand side of Eq. 3 is the
prior probability of H, and the second term in the numer-
ator is the likelihood of the observations of R, if the
response H is known. Likewise, the denominator of Eq. 3
refers to the probability of R.
Once these probabilities are estimated, the BN is com-
plete and ready to propagate information. BNs can be used
in this way to investigate the consequences of decisions or
observed values for the variables for which the attempt is to
control.
Fig. 3 An example of a simple Bayesian network formed by three
variables with associated conditional probability tables
4922 Environ Earth Sci (2014) 72:4917–4933
123
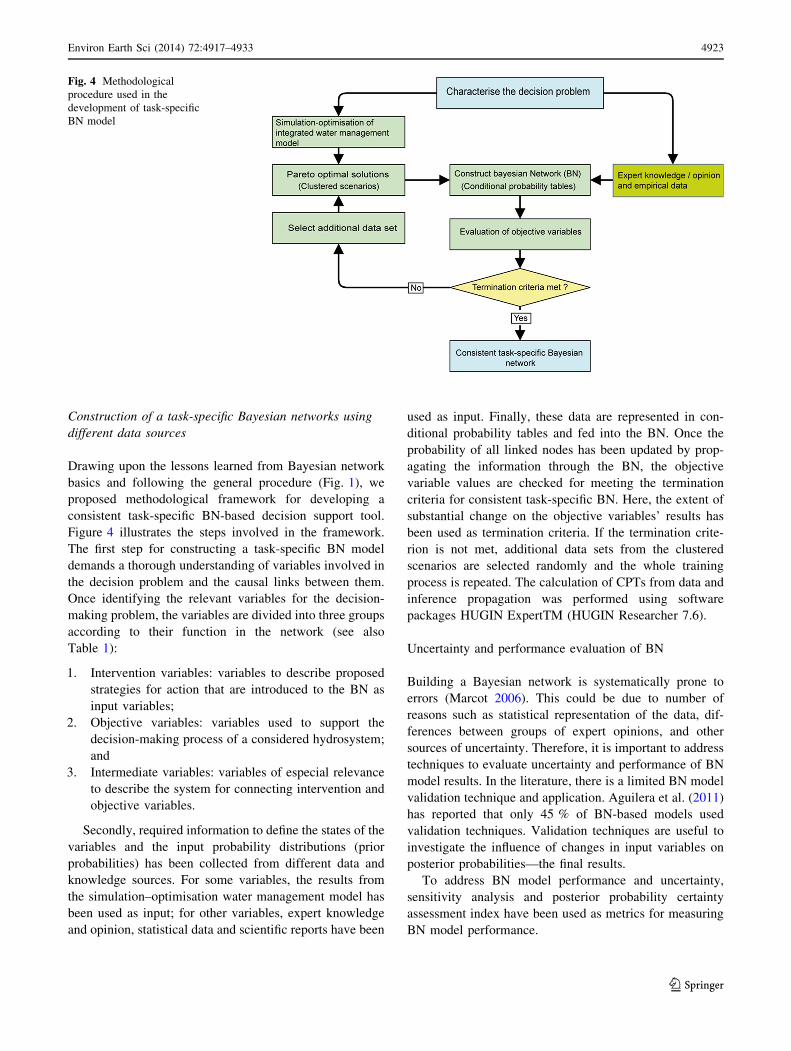
Construction of a task-specific Bayesian networks using
different data sources
Drawing upon the lessons learned from Bayesian network
basics and following the general procedure (Fig. 1), we
proposed methodological framework for developing a
consistent task-specific BN-based decision support tool.
Figure 4 illustrates the steps involved in the framework.
The first step for constructing a task-specific BN model
demands a thorough understanding of variables involved in
the decision problem and the causal links between them.
Once identifying the relevant variables for the decision-
making problem, the variables are divided into three groups
according to their function in the network (see also
Table 1):
1. Intervention variables: variables to describe proposed
strategies for action that are introduced to the BN as
input variables;
2. Objective variables: variables used to support the
decision-making process of a considered hydrosystem;
and
3. Intermediate variables: variables of especial relevance
to describe the system for connecting intervention and
objective variables.
Secondly, required information to define the states of the
variables and the input probability distributions (prior
probabilities) has been collected from different data and
knowledge sources. For some variables, the results from
the simulation–optimisation water management model has
been used as input; for other variables, expert knowledge
and opinion, statistical data and scientific reports have been
used as input. Finally, these data are represented in con-
ditional probability tables and fed into the BN. Once the
probability of all linked nodes has been updated by prop-
agating the information through the BN, the objective
variable values are checked for meeting the termination
criteria for consistent task-specific BN. Here, the extent of
substantial change on the objective variables’ results has
been used as termination criteria. If the termination crite-
rion is not met, additional data sets from the clustered
scenarios are selected randomly and the whole training
process is repeated. The calculation of CPTs from data and
inference propagation was performed using software
packages HUGIN ExpertTM (HUGIN Researcher 7.6).
Uncertainty and performance evaluation of BN
Building a Bayesian network is systematically prone to
errors (Marcot 2006). This could be due to number of
reasons such as statistical representation of the data, dif-
ferences between groups of expert opinions, and other
sources of uncertainty. Therefore, it is important to address
techniques to evaluate uncertainty and performance of BN
model results. In the literature, there is a limited BN model
validation technique and application. Aguilera et al. (2011)
has reported that only 45 % of BN-based models used
validation techniques. Validation techniques are useful to
investigate the influence of changes in input variables on
posterior probabilities––the final results.
To address BN model performance and uncertainty,
sensitivity analysis and posterior probability certainty
assessment index have been used as metrics for measuring
BN model performance.
Fig. 4 Methodological
procedure used in the
development of task-specific
BN model
Environ Earth Sci (2014) 72:4917–4933 4923
123

Sensitivity analysis
Sensitivity analysis in Bayesian network modelling per-
tains to identify network variables that have the highest
influence on the variables of management interest (Wang
2006). BN model sensitivity can be calculated using
entropy reduction (Pearl 1988). Entropy reduction is cal-
culated as the reduction of the variance for the expected
value of an output variable. As an illustration, consider an
output variable Q that has q states, and an input variable
F that has f states. Then, entropy reduction (I), which
measures the effect of one variable on another, is com-
puted as:
I ¼ EðQÞ � EðQ=FÞ ¼X
q
X
f
Pðq; f Þ log2½Pðq; f Þ�PðqÞPðf Þ ð5Þ
where E(Q) is the entropy of Q before any new findings.
E(Q/F) is the entropy of Q after new findings from variable
F. Usually, sensitivity is calculated with input variables set
to their default prior probability distributions. Evaluating
sensitivity of BN models can be used to understand
response of variables to the probability distributions of
other variables. From the results of a sensitivity analysis,
the impact of input variables can be compared quantita-
tively or in a ranked order.
Posterior probability certainty assessment
Posterior Probability Certainty Index (PPCI) is used as a
metric to evaluate uncertainty of BN model outcomes. The
approach was described by Marcot (2012) and based on
information theory, specifically on the adaptation of the
classic evenness index (Hill 1973). In this approach, the
posterior probability distributions consist of pi probability
values among N number.
Where Pi ranges [0, 1] andPN
I¼1 pi ¼ 1, PPCI is cal-
culated as:
PPCI ¼ 1��PN
i¼1 piL
lnðNÞ ð6Þ
where L ¼ lnðPiÞ; Pi [ 00; Pi¼0
n
The PPCI value ranges between [0, 1]. Models with higher
PPCI values of their posterior probability distributions sug-
gest greater certainty in outcome predictions.
Prototype application
A prototype application is performed to demonstrate the
functionality of the proposed methodology for evaluating
the efficiency as well as the uncertainty about the
consequences of plausible hydrosystem management
strategies. The example illustrates the linkage and feed-
backs between hydrological and socio-economic interac-
tions by a complementary application of hydrosystem
models and Bayesian networks for a typical management
problem of agricultural, coastal arid regions (see Ch. 2.1.).
More specifically, the management problem refers to a
coastal aquifer used for agricultural production, which is
affected by saltwater intrusion due to excessive ground-
water extraction for irrigation. This in turn led to a conflict
of interest among various water actors as well as uncer-
tainty about the impacts of different water management
interventions. The following interventions and their com-
binations are investigated exemplarily for a hypothetical
farm or demand region located in the vicinity of the sea: (1)
climate conditions and artificial recharge which refer to the
water resources side, and (2) implementation of water
quotas and subsidies which refer to the water demand side.
The application consists of three elementary steps:
1. The simulation of interactions and feedbacks of the
strongly coupled groundwater–agriculture hydrosys-
tem and their multi-criteria optimisation within an
integrated simulation–optimisation water management
model;
2. The conceptualisation of the linkage among variables
impacting the hydrosystem within a task-specific
Bayesian network model by expanding physical pro-
cess model results with additional empirical
knowledge;
3. The application of the task-specific Bayesian network
model to investigate different combinations of man-
agement interventions for supporting a decision-mak-
ing process.
Setup of the simulation–optimisation
water management model for coupled
groundwater–agriculture hydrosystems
The prototype application was carried out according to
the characteristics of the Wadi Ma’awil catchment located
on the northeast coast of the Sultanate of Oman
(Grundmann et al. 2012, 2013). Thereby, the long-term
evaluation of the environmental and economical devel-
opment of a hypothetical farm or demand region under
different management strategies was investigated. For the
sake of simplicity, the cultivation of two different crops,
maize––a salt sensitive cash crop and sorghum––a lower
priced but more salt resistant crop, growing in the two
seasons per year was assumed. Furthermore, a 2D vertical
slice of the unconfined 3D alluvial, coastal aquifer model
(Walther et al. 2012) was constructed to simulate
groundwater flow and to account for saline intrusion and
4924 Environ Earth Sci (2014) 72:4917–4933
123

transport. Fixed and variable costs for installation and
operation of pumping and irrigation equipment have been
incorporated. Finally, a multi-criteria optimisation run
was performed to solve the multi-objective optimisation
problem (Eqs. 1 and 2) over the next 20 years. Decision
variables were the yearly cultivated acreage, the yearly
cropping pattern and the yearly irrigation water demands
which result in a number of 60 decision variables for the
20-year period. The multi-criteria optimisation run pro-
vided a large set of Pareto-optimal solutions. Each of these
solutions refers to an optimal management strategy
according to the weighting between the given objectives
of1 (sustainability) and of2 (profit) (Eqs. 1 and 2). Besides
optimal values for the decision variables, the output of the
water management model contains corresponding values
for groundwater level, aquifer salinity, and other variables.
In order to simplify the prototype application, the cluster
algorithm was applied to combine similar management
strategies (provided by the Pareto-optimal solutions of the
water management model) into three different management
scenarios (clusters). These are:
1. A1––hydrosystem sustainability oriented: under this
scenario, an increase in hydrosystem stability comes
with higher agricultural profit risk.
2. A2––multi-objective: The stakeholders (farmers) pay
the same attention for both aquifer sustainability and
agricultural profit levels; i.e. only a moderate change in
the hydrological system stability occurs if the profit of
the agricultural production increases.
3. A3––agricultural profit oriented: under this scenario,
an increase of the agricultural production comes with
high risk of hydrosystem sustainability.
Setup of the BN application
Within the described modelling framework, the BN has
been used to present the linkage between hydrological and
socio-economic interactions for a typical management
problem of agricultural, coastal arid regions at a farm scale
combining the knowledge obtained from simulation to
optimisation water management model and different
empirical data sources. The BN was trained for each
management scenario using the data sets from the Pareto-
optimal clusters, and additional data obtained from expert
knowledge as well as empirical data.
In our application, the interest was to assess the impact
of plausible hydrosystem management strategies on: (1) net
profit (dollar/ha year), (2) direct agricultural employments
(employments/ha year), and (3) sustainability of the hy-
drosystem represented as sustainability index (SI); given
knowledge of several intervention and intermediate vari-
ables that are expected to influence the hydrosystem
(Table 1). Accordingly, a BN model at a farm scale has
been constructed comprising the following variables:
Table 1 Variables used in the Bayesian network (BN) model development and their definitions
Group Name of variables Explanations Source of information
Intervention variables Incentive tools Percentage reduction of agricultural water
use using subsidising irrigation
equipments and training farmers
Expert opinion
Artificial recharges Percentage of annual aquifer recharge
from artificial aquifer recharge schemes
Empirical knowledge
Climate conditions Percentage change from normal scenarios Expert opinion
Water quotas Percentage of water use reduction through
implementing water quota system
Expert opinion
Intermediate variables Crop pattern Percentage of crop fractions Model results
Aquifer recharge Amount of recharge in Mm3/year Empirical knowledge
Irrigation water demand Amount of irrigation water (mm) Model results
Groundwater extraction Amount of groundwater extraction rates
in Mm3/year
Model results
Variation of water table levels Water table drawdown in (m) Model results
Groundwater quality Salinity (dS/m) Model results
Cultivated acreage Area of farm in use (ha) Model results
Costs Total cost for pumping and irrigation
(consisting variable and fixed costs) in
($/year)
Model results
Objective variables Net profit Total agricultural net profit ($/ha year) Model results
Sustainability of hydrosystem Sustainability index (SI) Model results
Direct agricultural employment Total number of employments/ha year Empirical knowledge
Environ Earth Sci (2014) 72:4917–4933 4925
123

sustainability of hydrosystem, variation of aquifer levels,
groundwater quality, ground water extraction rates, extent
of water quotas, aquifer recharge, irrigation water demand,
aquifer artificial recharge, incentive tools, cultivated acre-
age, climate conditions, total costs comprising fixed and
variable irrigation pumping costs, annual agricultural
income, direct agricultural employment, and crop pattern.
Impact analysis of alternative management policies
After developing and evaluating for its performance and
consistency, the task-specific Bayesian network model has
been used to analyse the influence of alternative manage-
ment policies. This was done through evaluating effects of
selected variables, which represent alternative management
policies on posterior probability of the goals of hydrosys-
tem management. For instance, the influence of certain
policies such as pessimistic or optimistic set of intervention
values, on posterior probability distribution of objective
variables within the Bayesian network has been investi-
gated. Posterior probability results are then used to com-
pare and analyse different policies and their implications
for holistic hydrosystem management. In our prototype
application, three conflicting management policies have
been used for impact analysis.
• ‘‘normative’’: refers to setting states of all intervention
to their expected values, i.e. business as usual
• ‘‘all worst’’: refers to setting states of intervention
variables to their potential worst, and
• ‘‘all best’’: refers to setting states of intervention
variables to their plausibly best case values.
This can help to prioritise alternative management
strategies to the best effect desirable or to avoid disagree-
able policies.
Results and discussion
Results of simulation–optimisation water management
model of coupled groundwater–agriculture
The results of multi-criteria optimisation (Pareto-optimal
solutions) are presented in Fig. 5. The sustainability index
(of1) is plotted against the profit (of2) for solutions, which
are evaluated through integrated simulation–optimisation
water management model discussed in preceding sections.
Therefore, Fig. 5a represents all solutions, where dark
point representing non-Pareto-optimal solution and blue
point representing Pareto-optimal front, obtained from the
optimisation. The Pareto-optimal solution consists of usu-
ally many solutions, which could be difficult to identify a
range of solutions which can achieve similar level of
objectives. For example, there are 2,697 Pareto-optimal
solutions in this prototype application. Pareto-optimal
solutions have been divided into three clusters based on the
shape of Pareto-front, using the subtractive clustering
technique (see Fig. 5b).
Results of task-specific BN model structure and prior
probabilities
The scenarios of these three cluster values in conjunction
with expert knowledge and empirical data have been used
as scenarios for further analysis of the proposed BN-based
decision support tool. A task-specific BN model has been
constructed at farm scale using the methodological pro-
cedure discussed in ‘‘Construction of a task-specific
Bayesian networks using different data sources’’. The
developed BN model consisted of 15 nodes and 20 links
(Fig. 6). Out of the 15 nodes, four are inputs representing
different water management intervention variables and
three are outputs representing management objectives (see
also Tables 1, 2). This Bayesian network has been trained
for each alternative management scenario (A1, A2 and
A3).
The prior probabilities of the variables included in the
BN model are computed in two different ways. For vari-
ables which are derived from the integrated simulation–
optimisation water management model, prior probabilities
for each management scenarios are obtained from corre-
sponding clustered Pareto-optimal solutions. Prior proba-
bilities of the remaining variables were gathered and used
from statistical data sets, relevant stakeholder consulta-
tions, and professional judgments.
Figure 7 illustrates plots of the prior probabilities for
selected variables such as groundwater extraction rates,
hydrosystem sustainability, groundwater quality, agricul-
tural net profit, artificial aquifer recharge and water quotas
for the three management scenarios. The results in Fig. 7a–
d reflect the output of the integrated simulation–optimisa-
tion water management model. Whereas, Fig. 7e, f shows
the prior probabilities of artificial recharge and water
quotas, which are obtained based on empirical knowledge.
From the prior probability plots, one can observe that there
is an increasing trend of groundwater extraction from A1 to
A3 scenarios (Fig. 7a). These increased groundwater
extractions have seemingly contributed to higher net profit
for corresponding scenarios (Fig. 7d), which comes in the
expense of declining hydrosystem quality, explained by
hydrosystem sustainability index and groundwater quality
(see Fig. 7b, c). For groundwater quality, the A3 scenario
has a remarkably high water quality problem, the proba-
bility of values higher than 8.1 dS/m is around 80 %
4926 Environ Earth Sci (2014) 72:4917–4933
123

(Fig. 7c). Furthermore, the hydrosystem sustainability
index values also show an increasing trend from A1 to A3
scenarios, the increment under A3 alternative scenario
being more significant. Logically, this is in agreement
when compared with groundwater extraction and ground-
water quality values under the same scenario (Fig. 7a–d).
The prior probability distribution of artificial recharge and
water quotas are illustrated in Fig. 7e, f, respectively. As
these are the interventions aimed to palliate the aquifer
water balance disequilibrium, the results belonging to all
scenarios represent practically plausible values. For
example, probability of implementing water quota and
reversing the disequilibrium has \15 % chance, as it is
shown in Fig. 7f.
Fig. 5 a Pareto solutions for the objective functions ‘Sustainability index’ and ‘profit ($/year)’, points in blue representing Pareto-optimal
solutions, b Cluster (A1, A2 and A3) of the Pareto set
Fig. 6 Structure of the task-specific Bayesian network (BN) for supporting management decisions of a coupled groundwater–agriculture
hydrosystem at farm scale
Environ Earth Sci (2014) 72:4917–4933 4927
123

Sensitivity analysis
Sensitivity analysis based on entropy reduction has been
carried out to increase the understanding of relationship
between input and output variables in the developed BN
model. As an illustration, sustainability of hydrosystem and
net profit variables has been considered as target output
variables. These variables are influenced by a broad range
of variables included in the developed BN model. The
results shown in Table 3 indicate the ranking of variables
influencing the target variables under the three manage-
ment scenarios (A1, A2 and A3), the most influencing
variables being on the top of the list in each case.
For the sustainability of hydrosystem, sensitivity ana-
lysis suggested the most sensitive variables as groundwater
extraction, climate condition, and implementing water
quota. On the other hand, the sensitivity results show that,
groundwater quality, climate condition and costs are the
variables influencing agricultural net profit outcomes most.
The influence of these variables under the three alternative
scenarios (A1, A2 and A3) is more or less consistent,
especially for most influencing variables (see Table 3).
From the results of this sensitivity analysis, one can
observe that the intervention variables (such as water
quota, climate conditions, and incentive tools) are influ-
encing both objective variables significantly. For instance,
it is important to notice that implementing water quota is
the most influencing variable under A3 scenario for sus-
tainability of hydrosystem. The sensitivity analysis allows
to assess the consequences of variables introduced in the
BN representing possible actions or management inter-
ventions on those variables for which the attempt is to
control. Furthermore, this would help the decision makers
to make informed decisions while planning for the man-
agement intervention strategies.
Posterior probability certainty index
The PPCI results have been analysed to evaluate the degree
of certainty of posterior probability outcomes. This result is
obtained setting intervention variables to normative (busi-
ness as usual) values for the three alternative scenarios (A1,
A2 and A3). The posterior probability certainty index
implies full certainty when PPCI = 1, and full uncertainty
when PPCI = 0. As an illustration, posterior probability
certainty of hydrosystem sustainability index (SI) and net
profit has been analysed.
For clarity of presentation, the hydrosystem sustain-
ability index (SI) variable values were classified in three
categories represented as safe (0–0.15), medium
(0.15–0.18), and unsafe ([0.18). For clarity of presenta-
tion, probabilities of medium and unsafe have been com-
bined and treated as P(medium or unsafe). Posterior
probability of net profit with state value of [3,665 $/year is
treated as P(maximum net profit) (Fig. 8a, b). The results
indicate that greater certainty of the BN model outcomes
when P(medium or unsafe) is [0.6, which represents
mostly A2 and A3 scenarios (see Fig. 8a). On the other
Table 2 Variables used in the
BN model development with
their states and value ranges
Group Name of variables States
0 1 2
Intervention
activities
Incentive tools (subsidising irrigation
equipments and training farmers)
No reduction 0–25 % [25 %
Artificial recharges No artificial
recharge
0–10 % [10 %
Climate conditions No change 0–10 % [10 %
Implement quota system to reduce
water use
No quota 0–25 % [25 %
Intermediate
variables
Crop pattern Maize Sorghum
Aquifer recharge \58 58–68 [68
Irrigation water demand \284.5 284.5–286 [286
Groundwater extraction \58 58–68 [68
Variation of water table levels \0.48 0.48–0.57 [0.57
Groundwater quality \0.4 4–8.1 [8.1
Cultivated acreage \8 8–18 [18
Costs \4,500 4,500–9,380 [9,380
Objective
variables
Net profit \1,900 1,900–3,665 [3,665
Sustainability of hydrosystem 0–0.15 0.15–0.18 [0.18
Total number of agricultural direct
employment
\0.2 0.2–0.4 [0.4
4928 Environ Earth Sci (2014) 72:4917–4933
123

hand, BN model outcomes suggest a greater certainty when
P(maximum net profit) is very high [e.g., [0.8, which
represents mostly A3 scenarios (see Fig. 8b)]. The PPCI
results also clearly show that greater uncertainty occurs
when P(medium or unsafe) has lower posterior probability
outcomes. Analysis of this type can significantly contribute
to prioritise different alternative scenarios for future plan-
ning with better confidence and certainty.
Application of alternative management policies
Impact analysis has been carried out to investigate the
effects of intervention variables for different management
policies. This has been done by considering groups of
intervention variables and setting the intervention vari-
ables’ states to different plausible state values for each
alternative management policy (‘‘normative’’, ‘‘all worst’’
and ‘‘all best’’). Finally, the inference information has been
propagated through the developed BN model. The inter-
vention variables and associated states for the analysed
alternative management policies are shown in Table 4.
Figure 9 illustrates the results of impact analysis of
different management policies. The hydrosystem sustain-
ability index (SI) variable values were classified into three
categories as safe, medium, and unsafe. From the SI results
(Fig. 9a), it can be observed that the probability of SI to be
in medium or unsafe state is highest under A3 scenario,
which is as high as 42 % when the states of input variables
Fig. 7 Prior probability distributions of different management sce-
narios (A1, A2 and A3) for selected variables of the task-specific BN
such as (a) groundwater extraction rates (Mm3/year), (b) hydrosystem
sustainability (SI), and (c) groundwater quality (dS/m) (d) net profit
($/ha year), (e) artificial recharge (percentage of additional annual
aquifer recharge from artificial recharge scheme) and (f) water quotas
(percentage of water use reduction through implementing water quota
system)
Environ Earth Sci (2014) 72:4917–4933 4929
123

are set to ‘‘all worst’’ policy. The probability of sustain-
ability index to be in less vulnerable state is obtained, when
the BN model runs with A1 scenario under ‘‘all best’’
management policy, as expected.
The results of impact analysis of alternative manage-
ment policy on agricultural profit shows that probability of
obtaining maximum net profit is more likely under alter-
native management policy of ‘‘all best’’ (Fig. 9b). Simi-
larly, the chance of having maximum profit under
‘‘normative’’ policy is better than that of ‘‘all worst’’
alternative policy. The impact analysis shows that the
chance to obtain maximum agricultural profit could be
considerably lowered for A3 scenario under ‘‘all worst’’
policy, while the effect of ‘‘normative’’ and ‘‘all best’’
policies––for the same A3 scenario indicates an increasing
probability.
Further influence analysis results for both hydrosystem
sustainability, and net profit indicates that the probability
of hydrosystem sustainability to be at risk is in the rank-
order of ‘‘all worst’’, ‘‘normative’’ and ‘‘all best’’ policies;
and likelihood of obtaining maximum agricultural net
profit is in the rank-order of ‘‘all best’’, ‘‘normative’’ and
‘‘all worst’’ policies. This indicates that the developed BN
model represents the physical model reasonably. Influence
Table 3 Sensitivity analysis conducted on the BN model, considering sustainability of hydrosystem and net profit as target node under three
different alternative scenarios (A1, A2, and A3)
Sustainability of hydrosystem Net profit
Influencing node Entropy reduction Cumulative percent
of entropy reduction
Influencing node Entropy
reduction
Cumulative percent
of entropy reduction
A1-sustainability oriented alternative
Groundwater quality 0.211 23 Costs 0.568 42
Climate conditions 0.17 42 Groundwater extraction 0.203 57
Variation of water table levels 0.158 60 Crop pattern 0.164 69
Irrigation water demand 0.082 69 Water quotas 0.107 77
Aquifer recharge 0.079 77 Climate conditions 0.088 83
Water quota 0.077 86 Groundwater quality 0.067 88
Incentive tools 0.062 93 Irrigation water demand 0.061 93
Groundwater extraction 0.058 99 Aquifer recharge 0.052 96
Artificial recharge 0.003 100 Variation of water table levels 0.042 100
A2-multi-objective alternative
Climate conditions 0.462 30 Groundwater extraction 0.477 25
Groundwater quality 0.324 52 Climate conditions 0.414 47
Aquifer recharge 0.212 65 Costs 0.311 63
Variation of water table levels 0.178 77 Water quotas 0.244 76
Artificial recharge 0.123 85 Crop pattern 0.196 86
Groundwater extraction 0.084 91 Irrigation water demand 0.175 95
Water quota 0.059 94 Groundwater quality 0.063 98
Irrigation water demand 0.057 98 Aquifer recharge 0.023 100
Incentive tools 0.024 100
A3-profit oriented alternative
Climate conditions 0.448 35 Water quotas 0.621 26
Variation of water table levels 0.199 50 Groundwater extraction 0.543 49
Groundwater quality 0.159 62 Costs 0.37 65
Aquifer recharge 0.148 73 Crop pattern 0.2 74
Groundwater extraction 0.13 83 Irrigation water demand 0.187 82
Water quota 0.077 89 Incentive tools 0.182 89
Artificial recharge 0.055 94 Climate conditions 0.146 96
Irrigation water demand 0.04 97 Variation of water table levels 0.052 97
Incentive tools 0.037 100 Groundwater quality 0.048 100
Variables are listed here in decreasing entropy reduction, i.e. sensitivity values
4930 Environ Earth Sci (2014) 72:4917–4933
123

analysis results of these types can be used to inform
decision makers and stakeholders with realistic expecta-
tions of implementing particular management policy.
Summary and conclusion
The research presented in this paper aimed to conceptualise
the linkages between hydrological and socio-economic
processes through an integrated framework to support
decision making in water management of coupled
groundwater–agriculture hydrosystems. The approach
integrated hydrological knowledge, obtained from multi-
objective results in a simulation–optimisation water man-
agement model which considers feedbacks within the hy-
drosystem, and additional empirical and expert knowledge
regarding socio-economic issues of potential management
interventions in a Bayesian network model. A prototype
application was performed for integrated management of a
coastal agricultural hydrosystem prone to salt water intru-
sion, located in the south Al-Batinah region in Oman. The
task-specific BN-based decision support tool was intended
to assess the impact of alternative management interven-
tions on sustainable aquifer management while accounting
for economic (agriculture) and social interests (e.g. rural
employment in the agriculture sector). Exemplarily,
selected interventions have been investigated separately
and in combination: climate conditions and artificial
recharge, which refer to the water resources side as well as
implementation of water quotas and subsidies which refer
to the water demand side. Results of sensitivity analysis
showed that these variables are amongst the most influ-
encing variables (see Table 3). However, since climatic
Fig. 8 Example of the posterior
probability certainty index as
function of the posterior
probability of: (a) hydrosystem
sustainability index is in state of
medium or unsafe;
(b) maximum net profit, in each
of the three alternative scenarios
(A1, A2 and A3)
Table 4 Alternative management policy and corresponding variable
states (the values of the states refer to Table 2)
Intervention variables Alternative management policy
Normative All worst All best
Incentive tools State 0 State 0 State 2
Artificial recharges State 1 State 0 State 2
Climate conditions State 1 State 2 State 0
Water quota State 0 State 0 State 1
Fig. 9 Impact analysis of alternative management policies on
different management scenarios (A1, A2 and A3) evaluated by the
probabilities of: (a) hydrosystem sustainability index becoming
medium or unsafe and (b) agricultural profit to obtain maximum
net profit
Environ Earth Sci (2014) 72:4917–4933 4931
123

conditions cannot be controlled, they would contribute less
as management intervention. Therefore, it is recommended
to encourage decision makers to implement demand-side
management interventions, which have significant impact
(see Fig. 9).
A major focus of this research was the integration of
hydrological knowledge with empirical knowledge inferred
from socio-economic interests in a BN framework. This
provides a more rigorous scientific foundation for the
decision and communication of scenarios and impact ana-
lysis and interpretation of model results between water
experts, decision makers and stakeholders. In addition, the
approach accounts for the associated knowledge uncer-
tainty, which is represented in the BN in a probabilistic
way. The explicit consideration of these uncertainties
enables decision makers to assess the risks associated with
implementing alternative management strategies.
The presented prototype BN-based modelling approach
forms the basis to analyse linkages within hydrology and
socio-economic processes in a single framework. However,
by no means the developed tool is exhaustive. Some of the
key challenges include: (1) the model development was
based on limited information regarding socio-economic
and environmental input data, (2) the difficulty for stake-
holders to express their knowledge about relationships
between variables in the form of probability, (3) the fact
that BN uses discrete states rather than continuous proba-
bility distributions required discretization of probability
distributions, which arise information losses––subse-
quently may affect the modelling results. Furthermore, the
simplified prototype application has been limited by using
only three management scenarios to illustrate the func-
tionality of the framework.
To improve the model results, future research should focus
on the one hand on improving the quality of input data through
comprehensive data survey and intensive discussions with
stakeholders. In addition, as the developed BN-based mod-
elling approach was illustrated at a farm scale it is required to
test the methodology at multiple farm (regional) scale. On the
other hand, additional research is required to support more
informed decision making as well as the understanding of
interactions and feedbacks between hydrological processes
and socio-economic dependencies of complex hydrosystems.
This can be done by developing integrated approaches, which
use several types of modelling simultaneously or comple-
mentary, like the one shown in this paper.
Acknowledgments The manuscript was prepared within the
research project IWAS funded by the German Federal Ministry of
Education and Research (BMBF) under Grant No. 02WM1166. The
writers wish to thank the Ministry of Regional Municipalities and
Water Resources of the Sultanate of Oman for supporting the IWAS-
IWRM project. Additionally, the first author gratefully acknowledges
the funding received towards his Ph.D from KAAD.
References
Aguilera PA, Fernandez A, Fernandez R, Rumı R, Salmeron A (2011)
Bayesian networks in environmental modeling. Environ Model
Softw 26(12):1376–1388
Al-Shaqsi (2004) The socio economic and cultural aspects in the
implementation of water demand management, a case study in
the Sultanate of Oman. PhD thesis, Department of Geography,
University of Nottingham, Nottingham
Barton DN, Saloranta T, Moe SJ, Eggestad HO, Kuikka S (2008)
Bayesian belief networks as a meta-modelling tool in integrated
river basin management Pros and cons in evaluating nutrient
abatement decisions under uncertainty in a Norwegian river
basin. Ecol Econ 66(1):91–104
Barton DN, Kuikka S, Varis O, Uusitalo L, Henriksen HJ, Borsuk M,
de la Hera A, Farmani R, Johnson S, Linnell JDC (2012)
Bayesian networks in environmental and resource management.
Integr Environ Assess Manage 8(3):418–429
Bromley J, Jackson NA, Clymer OJ, Giacomello AM, Jensen FV
(2005) The use of Hugin� to develop Bayesian networks as an
aid to integrated water resource planning. Environ Model Softw
20(2):231–242
Cain J (2001) Planning improvements in natural resource manage-
ment. Guidelines for using Bayesian networks to support the
planning and management of development programmes in the
water sector and beyond. Centre for Ecology and Hydrology,
Wallingford
Carmona G, Varela-Ortega C, Bromley J (2011) The use of
participatory object-oriented bayesian networks and agro-eco-
nomic models for groundwater management in Spain. Water Res
Manage 25(5):1509–1524
Castelletti A, Soncini-Sessa R (2007) Bayesian networks and
participatory modelling in water resource management. Environ
Model Softw 22(8):1075–1088
Chaudhari PM, Dharaskar RV, Thakare VM (2010) Computing the
most significant solution from Pareto front obtained in multi-
objective evolutionary. Int J Adv Comput Sci Appl 1(4):63–68
Chiu SL (1994) Fuzzy model identification based on cluster
estimation. J Intell Fuzzy Syst 2:267–278
Craswell E, Bonnell M, Bossio D, Demuth S, Giesen N, Pahl-Wostl
C (2007) Transitions towards adaptive management of water
facing climate and global change. Integrated assessment of
water resources and global change. Springer, Netherlands,
pp 49–62
FAO (2013) AQUASTAT database, Food and agriculture organiza-
tion of the United Nations (FAO). On-line database available
from: http://www.fao.org/nr/water/aquastat/ (last accessed on
13/03/2013)
Giordano R, D’Agostino D, Apolloni C, Lamaddalena N, Vurro M
(2013) Bayesian belief network to support conflict analysis for
groundwater protection: the case of the Apulia region. J Environ
Manage 115:136–146
GPW (2012) Global water partnership (GWP) available from: http://
www.gwp.org/The-Challenge/What-is-IWRM/
Grundmann J, Schutze N, Schmitz G, Al-Shaqsi S (2012) Towards an
integrated arid zone water management using simulation-based
optimisation. Environ Earth Sci 65(5):1381–1394
Grundmann J, Schutze N, Lennartz F (2013) Sustainable management
of a coupled groundwater–agriculture hydrosystem using multi-
criteria simulation based optimisation. Water Sci Technol
67(3):689–698
Henriksen HJ, Rasmussen P, Brandt G, von Bulow D, Jensen FV
(2007) Public participation modelling using Bayesian networks
in management of groundwater contamination. Environ Model
Softw 22(8):1101–1113
4932 Environ Earth Sci (2014) 72:4917–4933
123

Hering JG, Ingold KM (2012) Water resources management: what
should be integrated? Science 336(6086):1234–1235
Hill MO (1973) Diversity and evenness: a unifying notation and its
consequences. Ecology 54(2):427–432
Hong B, Limburg KE, Hall MH, Mountrakis G, Groffman PM, Hyde
K, Luo L, Kelly VR, Myers SJ (2012) An integrated monitoring/
modeling framework for assessing human–nature interactions in
urbanizing watersheds: Wappinger and Onondaga creek water-
sheds, New York, USA. Environ Model Softw 32:1–15
Jensen FV, Nielsen TD (2007) Bayesian networks and decision
graphs. Springer, Berlin, p 448
Jiao W, Xu Z (2013) A distributed runoff model for the mountainous
region of the Heihe river basin (China) based on the spatial
modeling environment (SME) I: model structure and equations.
Environ Earth Sci 68(3):881–888
Kacimov AR, Sherif MM, Perret JS, Al-Mushikhi A (2009) Control
of sea-water intrusion by salt-water pumping: coast of Oman.
Hydrogeol J 17(3):541–558
Kalbacher T, Delfs JO, Shao H, Wang W, Walther M, Samaniego L,
Schneider C, Kumar R, Musolff A, Centler F, Sun F, Hildebrandt
A, Liedl R, Borchardt D, Krebs P, Kolditz O (2012) The IWAS-
ToolBox: software coupling for an integrated water resources
management. Environ Earth Sci 65(5):1367–1380
Kalbus E, Kalbacher T, Kolditz O, Kruger E, Seegert Jr, Rostel G,
Teutsch G, Borchardt D, Krebs P (2012) Integrated water
resources management under different hydrological, climatic and
socio-economic conditions. Environ Earth Sci 65(5):1363–1366
Keating BA, Carberry PS, Hammer GL, Probert ME, Robertson MJ,
Holzworth D, Huth NI, Hargreaves JNG, Meinke H, Hochman Z,
McLean G, Verburg K, Snow V, Dimes JP, Silburn M, Wang E,
Brown S, Bristow KL, Asseng S, Chapman S et al (2003) An
overview of APSIM, a model designed for farming systems
simulation. Eur J Agron 18(3–4):267–288
Kelly RA, Jakeman AJ, Barreteau O, Borsuk ME, ElSawah S,
Hamilton SH, Henriksen HJr, Kuikka S, Maier HR, Rizzoli AE,
van Delden H, Voinov AA (2013) Selecting among five common
modelling approaches for integrated environmental assessment
and management. Environ Model Softw 47:159–181
Kolditz O, Delfs JO, Burger CM, Beinhorn M, Park C-H (2008)
Numerical analysis of coupled hydrosystems based on an object-
oriented compartment approach. J Hydroinf 10(3):227–244.
doi:10.2166/hydro.2008.003
Kragt ME, Robson BJ, Macleod CJA (2013) Modellers’ roles in
structuring integrative research projects. Environ Model Softw
39:322–330
Liu Y, Gupta H, Springer E, Wagener T (2008) Linking science with
environmental decision making: experiences from an integrated
modeling approach to supporting sustainable water resources
management. Environ Model Softw 23(7):846–858
Loucks DP, van Beek E (2005) Water resources systems planning and
management: an introduction to methods, models and applica-
tions. UNESCO, Paris
Marcot BG (2012) Metrics for evaluating performance and uncer-
tainty of Bayesian network models. Ecol Model 230:50–62
Marcot BG (2006) Characterizing species at risk I: modeling rare
species under the Northwest forest plan. Ecol Soc 11(2):10
Marke T, Strasser U, Kraller G, Warscher M, Kunstmann H, Franz H,
Vogel M (2013) The Berchtesgaden national park (Bavaria,
Germany): a platform for interdisciplinary catchment research.
Environ Earth Sci 69(2):679–694
Matthies M, Giupponi C, Ostendorf B (2007) Environmental decision
support systems: current issues, methods and tools. Environ
Model Softw 22(2):123–127
Molina JL, Bromley J, Garcıa-Arostegui JL, Sullivan C, Benavente J
(2010) Integrated water resources management of overexploited
hydrogeological systems using object-oriented Bayesian net-
works. Environ Model Softw 25(4):383–397
MRMWR 1998 Ministry of Regional Municipalities and Water
Resources (MRMWR) (1998) Water resources master plan for
Oman. Sultanate of Oman, Oman
Pearl J (1988) Probabilistic reasoning in intelligent systems: networks
of plausible inference. Morgan Kaufmann Publishers Inc,
Waltham
Perez-Minana E, Krause PJ, Thornton J (2012) Bayesian networks for
the management of greenhouse gas emissions in the British
agricultural sector. Environ Model Softw 35:132–148
Rakhmatullaev S, Huneau F, Kazbekov J, Le Coustumer P, Jumanov
J, El Oifi B, Motelica-Heino M, Hrkal Z (2010) Groundwater
resources use and management in the Amu Darya River Basin
(Central Asia). Environ Earth Sci 59(6):1183–1193
Reddy MJ, Kumar DN (2007) Multi-objective particle swarm
optimization for generating optimal trade-offs in reservoir
operation. Hydrol Process 21:2897–2909
Schutze N, Schmitz G (2010) OCCASION: new planning tool for
optimal climate change adaption strategies in irrigation. J Irrig
Drain Eng 136(12):836–846
Schutze N, de Paly M, Shamir U (2012a) Novel simulation-based
algorithms for optimal open-loop and closed-loop scheduling of
deficit irrigation systems. J Hydroinfo 14(1):136–151
Schutze N, Kloss S, Lennartz F, Al-Bakri A, Schmitz G (2012b)
Optimal planning and operation of irrigation systems under
water resource constraints in Oman considering climatic uncer-
tainty. Environ Earth Sci 65(5):1511–1521
Serrat-Capdevila A, Valdes JB, Gupta HV (2011) Decision support
systems in water resources planning and management: stake-
holder participation and the sustainable path to science-based
decision making. In: Jao C (ed) Efficient decision support
systems––practice and challenges from current to future. InTech,
India
Steppuhn H, Genuchten MT, van Grieve CM (2005) Root-zone
salinity: II. Indices for tolerance in agricultural crops. Crop Sci
45(1):221–232
Ticehurst JL, Newham LTH, Rissik D, Letcher RA, Jakeman AJ
(2007) A Bayesian network approach for assessing the sustain-
ability of coastal lakes in New South Wales, Australia. Environ
Model Softw 22(8):1129–1139
Ticehurst JL, Curtis A, Merritt WS (2011) Using Bayesian networks
to complement conventional analyses to explore landholder
management of native vegetation. Environ Model Softw
26(1):52–65
Vrugt JA, Robinson BA, Hyman JM (2009) Self-adaptive multi-
method search for global optimization in real-parameter spaces.
Evol Comput IEEE Trans 13(2):243–259
Walther M, Delfs JO, Grundmann J, Kolditz O, Liedl R (2012)
Saltwater intrusion modeling: verification and application to an
agricultural coastal arid region in Oman. J Comput Appl Math
236(18):4798–4809
Wang H (2006) Using sensitivity analysis to validate Bayesian
networks for airplane subsystem diagnosis, In: Aerospace
Conference, 2006 IEEE
Yager R, Filev D (1994) Generation of fuzzy rules by mountain
clustering. J Intell Fuzzy Syst 2(3):209–219
Zhang R, Duan Z, Tan M, Chen X (2012) The assessment of water
stress with the water poverty index in the Shiyang River Basin in
China. Environ Earth Sci 67(7):2155–2160
Environ Earth Sci (2014) 72:4917–4933 4933
123

Evolving Water Resources Systems: Understanding, Predicting and Managing Water–Society Interactions Proceedings of ICWRS2014, Bologna, Italy, June 2014 (IAHS Publ. 364, 2014).
464
Multi-criteria multi-stakeholder decision analysis using a fuzzy-stochastic approach for hydrosystem management YOHANNES H. SUBAGADIS, NIELS SCHÜTZE & JENS GRUNDMANN Technische Universität Dresden, Institute of Hydrology and Meteorology, 01069 Dresden, Germany [email protected] Abstract The conventional methods used to solve multi-criteria multi-stakeholder problems are less strongly formulated, as they normally incorporate only homogeneous information at a time and suggest aggregating objectives of different decision-makers avoiding water–society interactions. In this contribution, Multi-Criteria Group Decision Analysis (MCGDA) using a fuzzy-stochastic approach has been proposed to rank a set of alternatives in water management decisions incorporating heterogeneous information under uncertainty. The decision making framework takes hydrologically, environmentally, and socio-economically motivated conflicting objectives into consideration. The criteria related to the performance of the physical system are optimized using multi-criteria simulation-based optimization, and fuzzy linguistic quantifiers have been used to evaluate subjective criteria and to assess stakeholders’ degree of optimism. The proposed methodology is applied to find effective and robust intervention strategies for the management of a coastal hydrosystem affected by saltwater intrusion due to excessive groundwater extraction for irrigated agriculture and municipal use. Preliminary results show that the MCGDA based on a fuzzy-stochastic approach gives useful support for robust decision-making and is sensitive to the decision makers’ degree of optimism. Key words multi-criteria decision analysis; fuzzy-stochastic approach; coastal hydrosystem management INTRODUCTION
In many real-world water resources management problems, the decision-making process is generally complex and faced with multiple criteria related to the physical environment and socio-economics to consider. This makes the problem a multi-criteria (or multi-objective) decision problem for which one single solution is not readily available due to the existing trade-offs among conflicting quantitative and qualitative objectives. In addition, the water resources management decision-making process and its final outcomes are affected by the inputs and perceptions of different parties involved in the process, which also leads to a problem of multiple stakeholders or a multi-decision maker problem. Many Multi-Criteria Decision Making (MCDM) techniques conventionally used in the literature to solve real-world water resources management problem give unsatisfactory solutions (Raju et al. 2000, Xu and Tung 2009) for the following reasons: (i) they normally incorporate only homogeneous information (either numerical or linguistic variables) and do not deal with heterogeneous information simultaneously, and (ii) different types of uncertainty (subjective and objective) of different alternatives are not considered at the same time. In recent years, there has been limited efforts to incorporate different types of uncertainty in multi-criteria decision-making (Chou et al. 2008, Xu and Tung 2009, Zarghami and Szidarovszky 2009, Mousavi et al. 2013). However, there are still limitations when different types of uncertainty are incorporated into multi-criteria decision-making based on heterogeneous information. In addition, applications of these techniques, which also consider water–society interactions in real-world water resources management, are rare. Study area and decision problem
The feasibility of MCGDA using a fuzzy-stochastic approach is tested in a real-world hydrosystem assuming group decision-making under uncertainty. The water management problem of this study refers to a coastal agricultural region in an arid environment and is adapted to the specific situation of the Al-Batinah region in northern Oman. Enduring overexploitation of the aquifer has caused the intrusion of marine salt water from the sea. Consequently, shallow wells of small farms and households run dry and/or irrigation water becomes increasingly saline – which has enforced numerous people to abandon their farms, thereby endangering the traditional socio-economic structures and way of living (Al-Shaqsi 2004, Grundmann et al. 2012).
Copyright 2014 IAHS Press
doi:10.5194/piahs-364-464-2014

Multi-criteria multi-stakeholder decision analysis
465
Therefore, the goal of this study is to look for best management strategies that would help to respond to the current unbalanced relationship between water resources availability and water demand in this coastal region. The management alternatives and evaluation criteria were determined based on: (1) an integrated simulation-based water management model which accounts for the interaction of physical processes of a strongly coupled groundwater-agriculture hydrosystem, and (2) expert knowledge and literature review. Considering the availability of data and the integrated simulation-based optimization model development situations at the stage of this research, three management alternatives (A1, A2 and A3) and five criteria (C1, C2, C3, C4 and C5) are considered here, as illustrated in Table 1. METHODS
In response to the aforementioned decision problem, this paper presents a new methodological framework for combining objective and subjective criteria in a decision-making procedure, and the Table 1 Criteria and alternatives developed to address the decision problem. Alternatives Criterion A1: Hydrosystem sustainability oriented: under this value range an intended increase in hydrosystem stability comes with higher agricultural profit risk A2:Multi-objective: The stakeholders (farmers) pay same attention for both aquifer sustainability and agricultural profit A3:Agricultural profit oriented: under this scenario, an increase of the agricultural production yield comes with high risk of hydrosystem sustainability
Economic factors C1:Profitability of crops (annual economic profit) C2:Cost of irrigation (pumping, variable and fixed costs)
Environmental factors
C3:Pumped water quantity (discharge) C4:Water quality (salinity)
Social factors C5:Job creation (employment of rural
labour)
Fig. 1 Flow chart of the multi-criteria multi-stakeholder decision analysis using a fuzzy-stochastic approach.

Yohannes H. Subagadis et al.
466
evaluation of the related uncertainties in water resources management. A fuzzy-stochastic approach is developed to demonstrate how the approach can effectively be used to prioritize different management alternatives under different types of uncertainty (subjective/objective) and information (qualitative/quantitative). A schematic of the proposed methodology is shown as a flow chart in Fig. 1. The first step of the proposed approach involves evaluating the performance of alternatives with respect to the different types of criteria. The ratings of alternatives with respect to objective and subjective criteria are evaluated by simulation-based optimization and fuzzy linguistic quantifiers, respectively. The model results and experts’ linguistic assessments are aggregated to approximate a series of probability distributions for randomized alternatives with respect to the criteria. Monte Carlo simulation is then used to generate a random normalized decision matrix of probability distribution functions which standardizes different types of criteria with respect to uncertainty (subjective/objective) and information (qualitative/quantitative). Thereafter, the optimism degree of decision makers is calculated and the cumulative distribution function (CDF) for each alternative (using OWA operator to calculate the total performance of each alternative) is produced. Finally, management alternatives are ranked based on the corresponding CDF of the alternatives (Fig. 1). Ordered Weighted Averaging (OWA) operator The total performance value for each alternative under a stochastic environment is calculated using the OWA operator. OWA as an aggregation operator was initiated by Yager (1988) and since then has been applied extensively. The range of OWA between possible minimum and maximum value can be expressed through the orness degree (optimism degree) and it depends on the optimism degree of Decision Makers (DMs). In this paper the fuzzy quantifiers of the form as shown in Table 2 are used in questioning the group of DMs (see Fig. 1). Table 2 Relations between fuzzy numbers and linguistic quantifiers for optimism degree evaluations. Linguistic variables Triangular fuzzy numbers Optimistic condition Very low (VL) (0,0.0.3) Very pessimistic Low (L) (0,0.3,0.5) Pessimistic Medium (M) (0.2,0.5,0.8) Neutral High (H) (0.5,0.7,1) Optimistic Very high (VH) (0.7,1,1) Very optimistic The total performance measure of each alternative using OWA is calculated using equation (1) as it is derived by Yager (1996):
j
n
jb
nj
njF *1
1
1111
∑=
−−
−
−
=
θθ
(1)
where, F = total performance measure of an alternative, bj is the jth largest element in the input set, θ is the optimism degree quantified by DMs, and n stands for a number of input parameters. An alternative with highest total values is considered to be most satisfying alternative. This calculation is repeated for number of MCS realizations and the CDF describing the overall performance of each alternative was developed. The CDF’s shape and magnitude of the total performance of the alternatives generated through MCS depend on the optimism degree of the DMs, as well as subjective and objective criteria (see equation (1)). DATA ACQUISITION Simulation-based water management model For simulating the interacting physical processes of a strongly coupled groundwater–agriculture hydrosystem in arid coastal environments, a simulation-based optimization model was developed

Multi-criteria multi-stakeholder decision analysis
467
by Grundmann et al. (2012, 2013). The optimization model, which is based on multi-criteria evolutionary optimization techniques, connects simulation models describing the interaction of the groundwater system and the agricultural production, and is used for managing both water quality and water quantity. The optimization problem is of multi-objective type and considers a sustainability index (SI) and profit of agricultural production as objectives. The SI describes the stability of the hydrosystem evaluating the change of the aquifer state in a simulation period using average salinity concentrations and aquifer water levels (Grundmann et al. 2013). The results of the multi-criteria optimization (Pareto-optimal solutions) are presented in Fig. 2. The Pareto optimal solutions were divided into three clusters (A1, A2 and A3) based on the shape of the Pareto front, using the subtractive clustering technique (Chiu 1994). The clusters represent specific classes of optimal solutions assuming that certain weights are assigned to the single objectives. Accordingly, in this study the three clusters (A1, A2, and A3) represent different management alternatives (see Table 1 for the description of management alternatives). Expert knowledge
For performance evaluation of management alternatives with respect to subjective criteria and to quantify decision makers’ judgment and opinion about the decision problem, necessary information is obtained from expert knowledge (Fig. 1). Therefore, a linguistic judgment is obtained from experts through questionnaires, expert panels, and survey. In this study, five triangular fuzzy numbers are used to represent linguistic terms with the expectation that experts will feel more comfortable using linguistic terms instead of crisp numbers to express their opinion and evaluate management alternatives.
Fig. 2 (a) Pareto solutions for the objective functions “Sustainability index” and “profit ($/year)”, (b) derived cluster visualization (A1, A2, and A3) on the Pareto front.
Table 3 Expert assessment for evaluating alternatives with respect to subjective criteria using linguistic variables. Alternatives Criterion (C5)
DM1 DM2 DM3 Aggregated A1 L VL L (0,0,5) A2 M L H (0,4.7177,10) A3 VH H M (2,7.0473,10) The linguistic assessment for alternatives with respect to the subjective criteria (C5) and the optimism degree (θ) of decision makers’ have been provided by three experts (DM1 – DM2). They were asked to rate the performance of each alternative with respect to C5 and optimism degree (θ) using a linguistic scale. Tables 3 and 4 summarise the linguistic assessment made by individual experts, as well as the aggregated values. To incorporate this qualitative and subjective information in the decision making process, the assessments have been aggregated such that triangular fuzzy distributions can be estimated in order to generate random triangular fuzzy numbers. The most possible, lower and upper bound values of a triangular fuzzy number are calculated using the geometric mean technique.
(a) (b)

Yohannes H. Subagadis et al.
468
Table 4 Evaluation of optimism degree (θ) using linguistic variables. Optimism degree (θ) Decision makers
DM1 DM2 DM3 Linguistic variables M H H Triangular fuzzy numbers (0.2,0.5,0.8) (0.5,0.7,1) (0.5,0.7,1) Aggregated group fuzzy value (0.2, 0.62573, 1) RESULTS
The results and statistics have been obtained by following the proposed MCGDA fuzzy-stochastic approach (Fig. 1). Once the probability distributions of the input parameters are determined, MCSs are performed to generate random values for all input parameters. After performing MCSs, 15 PDFs are obtained and theoretical statistical distribution models are fitted to the empirical PDFs. Figure 3 shows exemplary simulated input decision matrix values. Similar calculations were calculated for the alternatives with respect to all criteria. These simulated values are then used as inputs for the OWA operator, which serves as an aggregation tool to compute the total performance of each alternative. The calculation is repeated for a number of realizations considering a fixed optimism degree value at a time. As the result, a final CDF is obtained. The CDF of the three alternatives (A1, A2, and A3) considering an optimism degree of 0.5 are shown in Fig. 4. The output of the result provides the DMs with a range of possible values that each alternative may attain. In addition, the results can help to prioritise between alternatives showing how much one alternative can be better over the other. For example, the possible total value of alternative A3 ranges from 12.2 to 18.3. In contrast to the deterministic approach, the proposed approach enables the decision makers to examine the complete variability of possible outcomes for each alternative. Based on the results of the generated CDFs for the particular optimism degree, the alternatives are ranked as A3 > A2 > A1 (Fig. 4).
Fig. 3 The decision matrix values – histogram and fitted probability distribution
Fig. 4 Cumulative distribution functions (CDFs) generated using OWA operator for the optimism degree of 0.5, for alternatives A1, A2, and A3.
Sensitivity analysis
The resulting CDF in the previous section are based on a single optimism degree value at a time. To evaluate results of total performance values of the alternatives under different optimism degrees, a sensitivity analysis is conducted. The exemplary results of the sensitivity analysis are displayed in Fig. 5 for alternative A2. The results show that there is a significant variation in the

Multi-criteria multi-stakeholder decision analysis
469
total performance values of the alternative depending on the optimism degree. With an increase in optimism degree the total performance values decrease indicating the extent of risk-taking of decision makers. The illustrated sensitivity analysis is important as it shows that the interactive effect of DMs being risk-taking or risk-averse, can influence the final prioritization of management alternatives (Fig. 5).
Fig. 5 The MCS sensitivity analysis for various optimism degrees (θ), on the total performance values of the alternatives (A1, A2 and A3).
CONCLUSIONS
In this contribution an effective MCGDA using a fuzzy-stochastic approach was proposed. The results shows that the MCGDA using a fuzzy-stochastic approach gives insights that those decisions are sensitive to DMs’ degree of optimism. This implies societal actions are conditioning the hydrosystem. Thus, it is important to further develop modelling techniques that can strengthen the interaction between water and society and to provide stakeholders with tools to prioritise alternative management strategies for sustainable development. REFERENCES Al-Shaqsi, S. (2004) The socio economic and cultural aspects in the implementation of water demand management, a case study
in the Sultanate of Oman. Department of Geography, University of Nottingham. Chiu, S. L. (1994) Fuzzy model identification based on cluster estimation. Journal on Intelligent Fuzzy Systems 2, 267–278. Chou, S.-Y., Chang, Y.-H. and Shen, C.-Y. (2008) A fuzzy simple additive weighting system under group decision-making for
facility location selection with objective/subjective attributes. European Journal of Operational Research 189(1), 132–145.
Grundmann, J., Schuetze, N., and Lennartz, F. (2013) Sustainable management of a coupled groundwater-agriculture hydrosystem using multi-criteria simulation based optimisation. Water Science and Technology 67(3), 689–698.
Grundmann, J., et al. (2012) Towards an integrated arid zone water management using simulation-based optimisation. Environmental Earth Sciences 65(5), 1381–1394.
Mousavi, S. M., Jolai, F. and Tavakkoli-Moghaddam, R. (2013) A Fuzzy Stochastic Multi-Attribute Group Decision-Making Approach for Selection Problems. Group Decision and Negotiation 22(2), 207–233.
Raju, K. S., Duckstein, L. and Arondel, C. (2000) Multicriterion analysis for sustainable water resources planning: a case study in Spain. Water Resources Management 14(6), 435–456.
Xu, Y. and Tung, Y. (2009) Decision rules for water resources management under uncertainty. J. Water Resour. Plann. Manage. 135(3), 149–159.
Yager, R. R. (1988) On ordered weighted averaging aggregation operators in multi criteria decision making. IEEE Trans Syst Man cybern (18), 183–190.
Yager, R. R. (1996) Quantifier guided aggregation using OWA operators. Int. J. Intell Syst. 11, 49–73. Zarghami, M. & Szidarovszky, F.(2009) Stochastic-fuzzy multi criteria decision making for robust water resources
management. Stochastic Environmental Research and Risk Assessment 23(3), 329–339.


![An Integrated Approach to System Modeling Using a ...hv/articles/Modelling/p307-fishwick.pdf · the usual object oriented modeling approach within SE [16, 79], specific modeling methods](https://img.dokumen.tips/doc/110x75/5faaf2ef6a58cc4d6662294c/an-integrated-approach-to-system-modeling-using-a-hvarticlesmodellingp307-fishwickpdf.jpg)