Embed Size (px)
Citation preview

A New Baseline Model for Estimating Willingness to Payfrom Discrete Choice Models
Mikołaj [email protected]
Richard [email protected]

Calculating WTP from discrete choice models Contingent valuation Marginal rates of substitution (implicit prices, WTP)
Ratios of utility function parameters at constant utility level
A simple example
True parameters – WTP (MRS) = ratio Uncertainty – parameters are random variables
--------+------------------------------------------------------------------| Standard Prob. 95% Confidence
ANS| Coefficient Error z |z|>Z* Interval--------+------------------------------------------------------------------B1 | .56023*** .09336 6.00 .0000 .37726 .74320COST | .00715*** .00084 8.47 .0000 .00550 .00881
--------+------------------------------------------------------------------Note: ***, **, * ==> Significance at 1%, 5%, 10% level.---------------------------------------------------------------------------

Calculating WTP from discrete choice models Usual practice for calculating mean (median) WTP Ratio of coefficients
Usual practice for calculating confidence interval of WTP: Delta method Krinsky and Robb parametric bootstraping
But… Algebra of random variables – regular algebraic rules do not apply Maximum likelihood estimation – parameters asymptotically normal Distribution of WTP = ratio (quotient) distribution
Shape of the distribution is not normal (not even symmetrical) Undefined moments (mean, standard deviation) Median not necessarily equal to the ratio of means
Demonstrate problems with the delta / K&R method Propose alternative model specification to overcome these problems

Ratio distribution of two normally distributed variables , – random variables following some known distributions, with joint distribution function
– random variable following some (ratio) distribution, with PDF given by:
For and following bivariate normal density:
B C ,f b c
W B C
,w u c f uc c dc
B C
22
22
, ; , ; , ;
1 1 1exp 2
2 12 1
BC B C B C
C CB B
B B C CB C
w b c
c cb b

Ratio distribution of two normally distributed variables PDF of becomes:
=> Cauchy distribution Moments are infinite if has non‐zero density at
W B C
2 22
2 2 22 2 2
2
32 2 22 2 2 2
2
0
1 1 1 exp 2
2 12
1exp
2 22
1exp
2
B B C C B C C
C B B C CB
B B C CB B C C
B C B B C C B C C B B C
B B C CB B C C
w uu u
u uq u
u u
q dq
1
2 2 2 2 21 2
B B C
B C B B C C
u
u u
0B C 0u C

Ratio distribution of two normally distributed variables

p‐value of B
p‐value of C
corr. coef. B/Cpseudo‐mean(K&R)
median (K&R)
pseudo‐st.dev. (K&R)
pseudo‐st.dev. (delta)
0.10 0.10 ‐0.90 1.00 0.67 0.77 0.57 1.190.10 0.10 ‐0.50 1.00 0.82 0.77 0.74 1.050.10 0.10 0.00 1.00 1.00 0.83 0.94 0.860.10 0.10 0.50 1.00 1.18 0.91 1.13 0.610.10 0.10 0.90 1.00 1.33 0.98 1.29 0.270.10 0.01 ‐0.90 1.00 0.79 0.86 0.44 0.970.10 0.01 ‐0.50 1.00 0.88 0.86 0.59 0.870.10 0.01 0.00 1.00 1.00 0.90 0.76 0.720.10 0.01 0.50 1.00 1.12 0.95 0.91 0.530.10 0.01 0.90 1.00 1.21 0.99 1.02 0.310.01 0.10 ‐0.90 1.00 0.79 0.86 0.44 0.970.01 0.10 ‐0.50 1.00 0.88 0.86 0.59 0.870.01 0.10 0.00 1.00 1.00 0.90 0.76 0.720.01 0.10 0.50 1.00 1.12 0.95 0.91 0.530.01 0.10 0.90 1.00 1.21 0.99 1.02 0.310.01 0.01 ‐0.90 1.00 0.86 0.89 0.27 0.760.01 0.01 ‐0.50 1.00 0.92 0.90 0.42 0.670.01 0.01 0.00 1.00 1.00 0.93 0.57 0.550.01 0.01 0.50 1.00 1.08 0.96 0.69 0.390.01 0.01 0.90 1.00 1.14 0.99 0.78 0.17

Ratio distribution of two normally distributed variables In summary
Distribution is not normal (and not even symmetrical) Ratio of coefficients is not equal to the median … and not equal to the mean (which does not exist) … so does standard deviation
Using Krinsky and Robb parametric bootstrapping is wrong Not enough draws mask infinite mean and standard deviation of the
distribution Usually standard deviation explodes more easily than mean
Using Gaussian approximation (delta method) to derive standard deviation and confidence intervals is wrong Cauchy tails generated by positive density on both side of zero (Khuri,
Casella, 2002, American Statistician) Gleser, Hwang (1987, The Annals of Statistics) – impossible to construct
finite confidence intervals for ratio variables that have positive density around zero

Behavior of delta and Krinsky Robb estimates for ratio‐based WTP
Method Draws MeanStandard Deviation
Median 95% c.i. / quantile range
Analytical – Undefined Undefined 0.97 (‐0.52,4.28)
Delta – 1* 0.51 1* (0.00,2.00)
Krinsky and Robb
100 1.31 2.14 0.91 (0.06,9.05)
1000 1.00 3.94 0.93 (0.00,3.98)
10,000 0.65 58.32 0.96 (‐0.45,4.13)
100,000 0.90 53.30 0.97 (‐0.50,4.26)
1,000,000 0.93 155.20 0.97 (‐0.52,4.27)
10,000,000 ‐26.42 86104.39 0.97 (‐0.52,4.29)
Fieller – 1* – 1* (-∞,-2.21e13)∪(0.00,+∞)

The problem with the ratio The problem not unique to choice modeling ML estimator of the ratio is inconsistent: Bergstrom (1962,
Econometrica), Zellner (1978, Journal of Econometrics) Ratio undefined
Distributed lagged models (Lianos and Rausser, 1972, Journal of the American Statistical Association)
Reduce rank regression used in tests of cointegration (Phillips 1994, Econometrica)
Instrumental variables (Woglom 2001, Econometrica) Travel cost demand models (Adamowicz, Fletcher, Graham‐Tomasi,
1989, AJAE) …but not seen as a serious problem due to Dorfman, Kling, Sexton (1990, AJAE)
Fieller bounds (Hirschberg, Lye, 2010, The American Statistician)

Alternative specification for the MNL model The typical specification for the MNL model Cost enters linearly:
The alternative specification Cost enters exponentially:
Estimation proceeds in the usual way Cost parameter will now be strictly positive Daly Hess Train (2012) show this parameterization assures finite
moments Consistent with economic theory
i ij ij ij ijU Alternative j U z β x
expi ij ij ij ijU Alternative j U z β x

p‐value of B
p‐value of C
corr. coefficient
B/CLinear specification Exponential specification
pseudo‐mean
pseudo‐std.dev.
median mean std.dev. median
0.1 0.1 ‐0.99 1 4.73 3365 0.86 2.23 3.46 1.140.1 0.1 ‐0.50 1 0.38 1094 0.88 1.89 2.67 1.080.1 0.1 0.00 1 ‐0.21 784 0.90 1.53 1.83 1.020.1 0.1 0.50 1 2.51 1550 0.94 1.17 1.17 0.960.1 0.1 0.99 1 1.00 22 1.00 0.83 0.95 1.000.1 0.01 ‐0.99 1 1.04 824 0.99 1.62 1.81 1.100.1 0.01 ‐0.50 1 1.70 224 0.99 1.43 1.44 1.050.1 0.01 0.00 1 1.36 95 0.99 1.24 1.09 1.020.1 0.01 0.50 1 0.39 610 1.00 1.05 0.77 0.980.1 0.01 0.99 1 0.86 74 1.00 0.87 0.54 1.020.01 0.1 ‐0.99 1 ‐0.14 978 0.88 1.98 2.68 1.150.01 0.1 ‐0.50 1 1.38 385 0.90 1.76 2.14 1.110.01 0.1 0.00 1 ‐0.52 1115 0.92 1.53 1.59 1.070.01 0.1 0.50 1 0.53 593 0.94 1.30 1.00 1.040.01 0.1 0.99 1 1.16 220 0.97 1.08 0.42 1.110.01 0.01 ‐0.99 1 1.60 145 0.99 1.48 1.38 1.100.01 0.01 ‐0.50 1 1.55 163 0.99 1.36 1.13 1.070.01 0.01 0.00 1 1.33 122 0.99 1.24 0.86 1.040.01 0.01 0.50 1 1.18 68 1.00 1.12 0.58 1.020.01 0.01 0.99 1 1.00 3 1.00 1.00 0.21 1.04

Empirical illustration 1a –Oil spill prevention in California’s central coast
MNL typical specification(cost enters linearly)
MNLalternative specification 1(cost enters exponentially)
MNL alternative specification 2
(ASC and cost enter exponentially)
B – ASC associated with introducing the scenario
0.5602***(0.0941)
0.5602***(0.0941)
‐0.5794***(0.1680)
C – cost associated with introducing the scenario
7.1523***(0.8361)
1.9674***(0.1169)
1.9674***(0.1169)
Ratio of coefficients $78.32 $78.34 $78.35Median WTP – K&R $78.32 $77.81 $78.35E(WTP) – K&R $78.25 (undefined) $77.73 $78.85Std. err. E(WTP) – delta $8.83 (undefined) $8.83 $8.83Std. err. E(WTP) – K&R $9.03 (undefined) $9.00 $8.91
95% c.i. E(WTP) – delta $60.63 – $96.01 $60.70 – $95.98 $60.88 – $95.81
95% c.i. E(WTP) – Fieller $60.22 – $95.83 $60.25 – $95.84 $60.26 – $95.85
95% c.i. E(WTP) – K&R (quantile range) $60.25 – $95.82 $59.71 – $95.21 $62.83 – $97.71
Log‐likelihood ‐712.7737 ‐712.7737 ‐712.7737AIC/n 1.3180 1.3180 1.3180n (observations) 1085 1085 1085

Empirical distribution of WTP (n=1085)

Empirical illustration 1brandom subsample of n=100
MNL typical specification(cost enters linearly)
MNLalternative specification 1(cost enters exponentially)
MNL alternative specification 2
(ASC and cost enter exponentially)
B – ASC associated with introducing the scenario
0.2842(0.2988)
0.2842(0.2988)
‐1.2579(1.0513)
C – cost associated with introducing the scenario
5.8786**(2.8110)
1.7713***(0.4782)
1.7713***(0.4782)
Ratio of coefficients $48.35 $48.37 $48.38Median WTP – K&R $49.48 $43.71 $48.38E(WTP) – K&R $37.49 (undefined) $34.43 $65.37Std. err. E(WTP) – delta $37.55 (undefined) $37.52 $37.52Std. err. E(WTP) – K&R $1.59*105 (undefined) $56.23 $59.42
95% c.i. E(WTP) – delta ‐$3.11*105 – $3.11*105 ‐$61.83 – $158.57 ‐$68.08 – $164.84
95% c.i. E(WTP) – Fieller ‐$567.43 – $139.11 ‐$565.00 – $139.12 ‐$564.38 – $139.14
95% c.i. E(WTP) – K&R (quantile range) ‐$151.99 – $152.64 ‐$106.30 – $113.71 $10.58 – $221.35
Log‐likelihood ‐66.8654 ‐66.8654 ‐66.8654AIC/n 1.3770 1.3770 1.3770n (observations) 100 100 100

Empirical distribution of WTP (n=100)

Empirical illustration 2Alternative Fuels Vehicle DCE
RPL – typical specification(cost parameters enter linearly)
RPL – alternative specification(cost parameters enter exponentially)
Means Standard deviations Means Standard deviationsrange(log‐normally distributed)
‐0.9007(0.6439)
‐0.6041***(0.2342)
‐0.9007(0.6439)
‐0.6041***(0.2342)
electric(normally distributed)
‐1.5392***(0.3961)
‐0.7544**(0.3248)
‐1.5393***(0.3961)
‐0.7543**(0.3249)
hybrid(normally distributed)
0.3839**(0.1635)
0.7306***(0.1216)
0.3840**(0.1635)
0.7306***(0.1216)
p_medium(normally distributed)
0.1197(0.1016)
0.2074(0.2337)
0.1197(0.1016)
0.2075(0.2337)
p_high(normally distributed)
0.4548***(0.1115)
0.4671***(0.1546)
0.4548***(0.1115)
0.4672***(0.1546)
c_purchase(fixed)
0.4472***(0.0295) – ‐0.8046***
(0.0659) –
c_operate(fixed)
0.0132***(0.0035) – ‐4.3297***
(0.2641) –
Ratio of coefficients $22.82 $22.81Median WTP – K&R $41.73 $39.42E(WTP) – K&R $49.96 (undefined) $47.19Std. err. E(WTP) – delta $28.53 (undefined) $28.51Std. err. E(WTP) – K&R $715.76 (undefined) $34.78
95% c.i. E(WTP) – delta ‐$33.09 – $78.73 ‐$33.08 – $78.69
95% c.i. E(WTP) – Fieller ‐$15.61 – $118.35 ‐$15.60 – $118.27
95% c.i. E(WTP) – K&R (quantile range) $11.00 – $151.97 $10.58 – $138.01
Log‐likelihood ‐1358.0826 ‐1358.0826AIC/n 1.8465 1.8465n (observations) 1484 1484
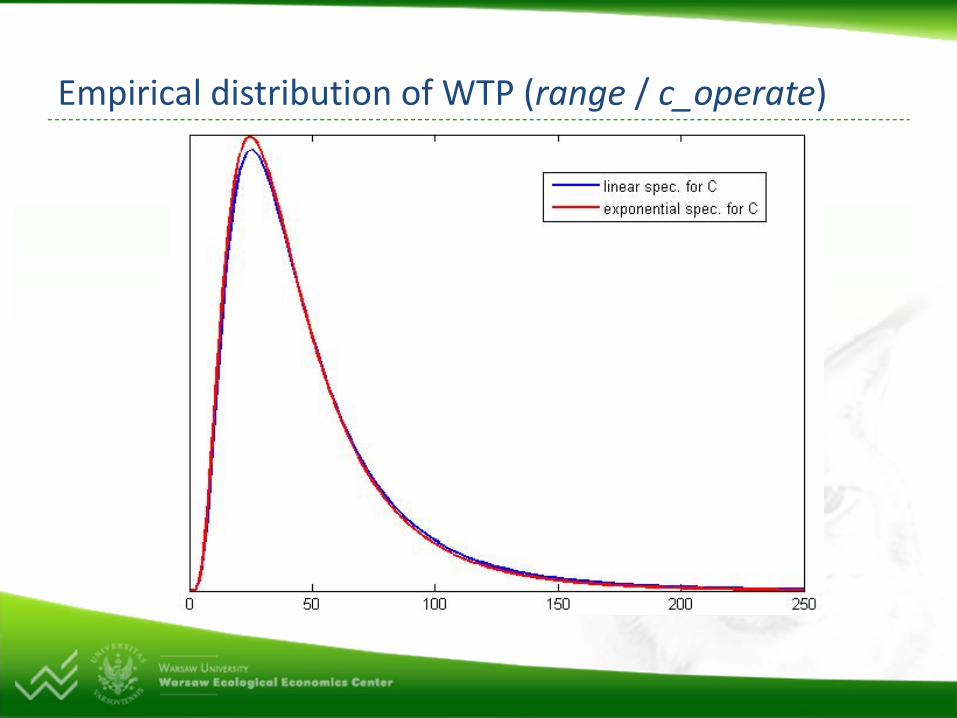
Empirical distribution of WTP (range / c_operate)

Conclusions The alternative specification does not change the model fit or shape of WTP distribution much
It allows to calculate moments of the WTP distribution Ratio of coefficients may be close to the median (especially if Band C far from 0 and highly correlated)
New reference statistical model for discrete choice experiment contingent valuation Monetary attribute has support in positive (negative) values only
Possible to calculate moments / apply K&R and delta Possible to apply the same approach to other parameters


![Discrete Choice Modeling - pages.stern.nyu.edupages.stern.nyu.edu/~wgreene/DiscreteChoice/2014/... · [Part 8] 3/26 Discrete Choice Modeling Nested Logit Correlation Structure for](https://img.dokumen.tips/doc/110x75/5fd89d10161e3b1e8e50006b/discrete-choice-modeling-pagessternnyu-wgreenediscretechoice2014-part.jpg)

![9. Heterogeneity: Latent Class Modelspeople.stern.nyu.edu › wgreene › DiscreteChoice › 2014 › DC2014-9-LCModels.pdf[Topic 9-Latent Class Models] 3/66 Latent Classes • A population](https://img.dokumen.tips/doc/110x75/5f03e2617e708231d40b3e43/9-heterogeneity-latent-class-a-wgreene-a-discretechoice-a-2014-a-dc2014-9-lcmodelspdf.jpg)