Embed Size (px)
Citation preview
A report for Defra
August 2012
Estimating baseline levels of reuse via C&I reuse, remanufacture and refurbishment
This report has been prepared by: Dr Philip Derbyshire, Dr Josie Arendorf and Dr Ben Walsh Checked as a final copy by: Katie Deegan Reviewed by: Date: 8 August 2012 Contact: [email protected] File reference number: AEA-01 307.docx
Oakdene Hollins provides clients with these services: ● Modelling and impact assessment ● Programme management and evaluation ● Project management ● Ecolabelling advice ● Carbon footprinting ● Critical review of life cycle assessment ● Policy and strategy development ● Lean manufacturing ● Economic analysis ● Market appraisal.
For more information visit www.oakdenehollins.co.uk
Oakdene Hollins is registered to ISO 9001:2008
Contents amendment record This report has been amended and issued as follows:
Version Date Description Author Editor
1 13 Jul 12 Original LM
2 8 Aug 12 Format changes, text changes to Section 3 and Appendix B KD
2 14 Aug 12 Changes to data in WP3 BW
We print our reports on Ecolabel / recycled paper
For Defra
Contents
1 Introduction 1
2 WP2: Review of the 2009 C&I Waste Survey 2 2.1 Introduction 2 2.2 Review of the survey methodology 2 2.3 Analysis of the dataset 4 2.4 Industry interviews 9 2.5 Conclusion 10
3 WP3: Revision of the CRR Survey 13 3.1 Introduction and methodology 13 3.2 Tyre retreads 14 3.3 Automotive 14 3.4 Off-road equipment 15 3.5 Pumps, compressors and fans 15 3.6 Conclusion 16

For Defra 1
1 Introduction
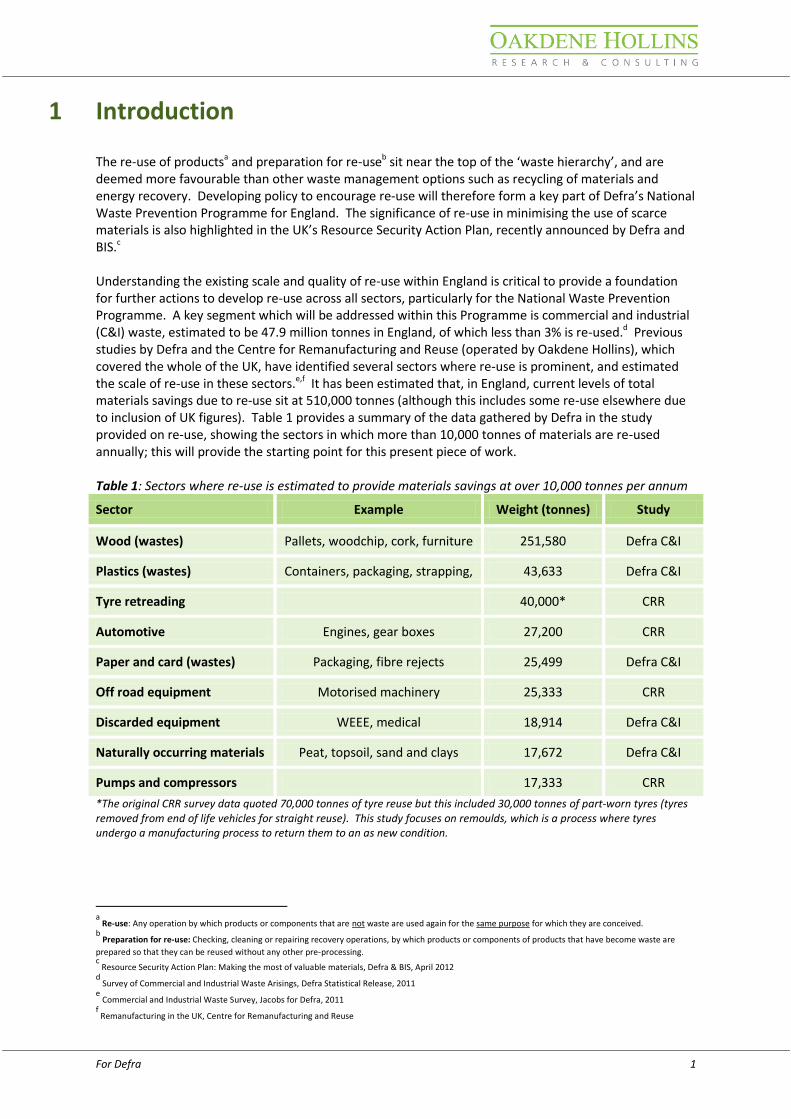
The re-use of productsa and preparation for re-useb sit near the top of the ‘waste hierarchy’, and are deemed more favourable than other waste management options such as recycling of materials and energy recovery. Developing policy to encourage re-use will therefore form a key part of Defra’s National Waste Prevention Programme for England. The significance of re-use in minimising the use of scarce materials is also highlighted in the UK’s Resource Security Action Plan, recently announced by Defra and BIS.c Understanding the existing scale and quality of re-use within England is critical to provide a foundation for further actions to develop re-use across all sectors, particularly for the National Waste Prevention Programme. A key segment which will be addressed within this Programme is commercial and industrial (C&I) waste, estimated to be 47.9 million tonnes in England, of which less than 3% is re-used.d Previous studies by Defra and the Centre for Remanufacturing and Reuse (operated by Oakdene Hollins), which covered the whole of the UK, have identified several sectors where re-use is prominent, and estimated the scale of re-use in these sectors.e,f It has been estimated that, in England, current levels of total materials savings due to re-use sit at 510,000 tonnes (although this includes some re-use elsewhere due to inclusion of UK figures). Table 1 provides a summary of the data gathered by Defra in the study provided on re-use, showing the sectors in which more than 10,000 tonnes of materials are re-used annually; this will provide the starting point for this present piece of work. Table 1: Sectors where re-use is estimated to provide materials savings at over 10,000 tonnes per annum
Sector Example Weight (tonnes) Study
Wood (wastes) Pallets, woodchip, cork, furniture 251,580 Defra C&I
Plastics (wastes) Containers, packaging, strapping, 43,633 Defra C&I
Tyre retreading 40,000* CRR
Automotive Engines, gear boxes 27,200 CRR
Paper and card (wastes) Packaging, fibre rejects 25,499 Defra C&I
Off road equipment Motorised machinery 25,333 CRR
Discarded equipment WEEE, medical 18,914 Defra C&I
Naturally occurring materials Peat, topsoil, sand and clays 17,672 Defra C&I
Pumps and compressors 17,333 CRR
*The original CRR survey data quoted 70,000 tonnes of tyre reuse but this included 30,000 tonnes of part-worn tyres (tyres removed from end of life vehicles for straight reuse). This study focuses on remoulds, which is a process where tyres undergo a manufacturing process to return them to an as new condition.
a Re-use: Any operation by which products or components that are not waste are used again for the same purpose for which they are conceived.
b Preparation for re-use: Checking, cleaning or repairing recovery operations, by which products or components of products that have become waste are
prepared so that they can be reused without any other pre-processing. c Resource Security Action Plan: Making the most of valuable materials, Defra & BIS, April 2012
d Survey of Commercial and Industrial Waste Arisings, Defra Statistical Release, 2011
e Commercial and Industrial Waste Survey, Jacobs for Defra, 2011
f Remanufacturing in the UK, Centre for Remanufacturing and Reuse
2 For Defra
2 WP2: Review of the 2009 C&I Waste Survey
2.1 Introduction
Within the 2009 C&I Waste Survey the re-use of waste was characterised by sectors and waste type, and estimated to account for 1.3 million tonnes of waste in total. However, many of the waste types are incompatible with the accepted definition of re-use and have already been excluded on this basis, e.g. animal and vegetable waste, sludge and chemical wastes. By excluding these waste types and sectors it has been estimated that amount of re-use is closer to 350,000 tonnes. Despite these preliminary efforts to more fully characterise the re-use in C&I waste streams, further analysis was needed to understand whether the definition of re-use was consistent across these sectors and to identify where the term had been appropriately used.
2.2 Review of the survey methodology
2.2.1 Purpose
This section critically evaluates the methodology used for the 2009 C&I Waste Survey, particularly focusing on the definitions of re-use and how this was communicated to survey staff and businesses. The full survey report was evaluated and we requested any additional relevant methodology information from the Defra Waste Statistics department but we are advised that nothing additionally relevant to re-use was available.
2.2.2 Waste Framework Directivea definitions
It is critical to first understand what is meant by re-use and what activity should be captured when quantifying its occurrence. The following are the definitions of re-use were used, as defined within Waste Framework Directive (our emphases added): Re-use Any operation by which products or components that are not waste are used
again for the same purpose for which they are conceived. Preparation for re-use Checking, cleaning or repairing recovery operations, by which products or
components of products that have become waste are prepared so that they can be re-used without any other pre-processing.
Recycling Any recovery operation by which waste materials are reprocessed into
products, materials or substances whether for the original or other purposes. It includes the reprocessing of organic material but does not include energy recovery and the reprocessing into materials that are to be used as fuels or for backfilling operations.
Recovery Any operation the principal result of which is waste serving a useful purpose by
replacing other materials which would otherwise have been used to fulfil a particular function, or waste being prepared to fulfil that function, in the plant or in the wider economy.
Preparation for re-use is promoted within the waste hierarchy as an activity that is more favourable than recycling, recovering energy or landfill. The logic of this hierarchy is that the energy and labour that have
a Directive 2008/98/EC of the European Parliament
For Defra 3
been sunk into the original product are preserved fully; by requiring additional reprocessing much of this investment is lost. The definition of re-use includes the statement that the products or components are not waste, this reflects the intention that only items that are in good condition can re-used. Items that have become waste and are not in a suitable condition can be remedied through preparation for re-use activities. Capturing re-use through a survey of waste activity could only record preparation for re-use and not re-use. The business activity that includes genuine re-use remains hidden from this methodology.
2.2.3 Re-use within the C&I waste survey
The original survey provided nine waste management options to choose from, with many of these further sub-categorised. Each of the nine waste management categories also allowed for an ‘unknown’ option where the subcategory was not known or did not fit with the limited options. It was recognised that recycling and re-use were two distinct waste management methods. Furthermore, re-use was allowed as an option only if off-premises or off-site; this is justified on the basis that internal re-use does not contribute to the business’s waste streams. The following definition appears in the full report and it is assumed that this was the definition that was provided to surveyors and business respondents. Re-used off-premises Waste material from one business could be a valuable material for re-use for
another business/process. For example, Incinerator Bottom Ash (IBA) produced from an energy from waste facility is an inert material that can be recycled into aggregate and used in the construction industry. Aggregates are primarily used for the manufacture of Asphalt and Concrete Products.
This demonstrates some methodological confusion between re-use and recycling. Comparing this to the survey definition of recycling given below reveals no clear distinction: Recycling Recycling recovers materials, by preventing them from being disposed of, and
makes them into new goods. This can involve turning the old material into a new version of the same thing, or materials can be recycled into something completely different. For example, used glass bottles can be recycled into new bottles, or they can be recycled into something different, such materials used in road construction.
It can be seen that it would be very difficult for survey respondents to consistently differentiate their activity as either re-use or recycling. The two available sub-categories for off-premises re-use are given below: Recycled Aggregates Derived from reprocessing materials previously used in construction.
Examples include recycled concrete from construction and demolition waste material (C&DW) and railway ballast.
Secondary Aggregates Usually by-products of other industrial processes not previously used in
construction. Secondary Aggregates can be further sub-divided into manufactured and natural, depending on their source. Examples of manufactured secondary aggregates are pulverised fuel ash (PFA) and metallurgical slags. Natural secondary aggregates include china clay sand and slate aggregate.
4 For Defra
The incompatibility of the two defined subcategories with the accepted definition of re-use for these materials led us to exclude them from our analysis. A third option was available for survey respondents, namely ‘reuse – unknown’, and this was chosen for the majority of the identified re-use of these three materials. In addition to classifying the waste management method for each waste stream there were questions to determine the suitability of the waste stream for certain processing methods. Survey respondents were asked whether the waste was suitable for on-site or off-site re-use.
2.2.4 Conclusion
The definition of re-use within the methodology has some inconsistencies with the accepted definition of re-use, and is likely to have resulted in an overestimation of the re-use of waste in England. Conversely, it is likely that any products or components that are re-used by business and industry which have residual value would not be classed as waste. This would lead to an underestimation of re-use in certain areas.
2.3 Analysis of the dataset
2.3.1 Purpose
By applying the definition of re-use and preparation for re-use, an initial revision of the re-use figure from 1.3 million tonnes to 350,000 tonnes was made on the basis of the type of waste and its suitability for re-use. Further investigation of this 350,000 tonnes is warranted to more accurately determine actual re-use.
2.3.2 Scope
We focused on a selection of waste streams that were most likely to include significant re-use and which covered a significant tonnage. Initially the sectors were screened using waste type and industry, to identify those with the largest quantities to investigate further. A preliminary screening, using data for each waste type for each C&I sector, identified the following waste types/sectors groupings:
wood waste across all sectors (primarily textiles/wood/paper/publishing and retail & wholesale)
paper and card waste across all sectors (primarily food, drink & tobacco, and retail & wholesale)
non-metal / plastics (only chemicals & non-metallic minerals manufacture, and retail & wholesale).
Together these account for around 300,000 tonnes of the revised (350,000 tonnes) figure, covering the majority of the identified possible re-use.
2.3.3 Data preparation
The complete C&I Waste Survey dataset was obtained for the purpose of analysing the relevant entries. The overall dataset detailed approximately 40,000 waste streams from over 6,000 businesses across a wide range of commercial and industrial sectors. The descriptive data relating to each individual business were received separately from the waste stream data. The datasets were merged in order to assign company specific data to each of the waste streams. This merged dataset was further supplemented by matching the 5-digit SIC descriptor to each waste stream. The data was filtered to only include entries where the waste management method was defined as ‘reuse - unknown’. There were three categories of re-use permitted within the survey, of which only ‘reuse -
For Defra 5
unknown’ was thought to be relevant to the required definition of re-use. The definitions of re-use are discussed in more detail in section 2.2.3. Filters were applied to the final dataset to extract the data required for the analysis:
wood waste across all sectors (primarily textiles/wood/paper/publishing and retail & wholesale)
paper and card waste across all sectors (primarily food, drink & tobacco, and retail & wholesale)
non-metal / plastics from chemicals & non-metallic minerals manufacture, and retail & wholesale.
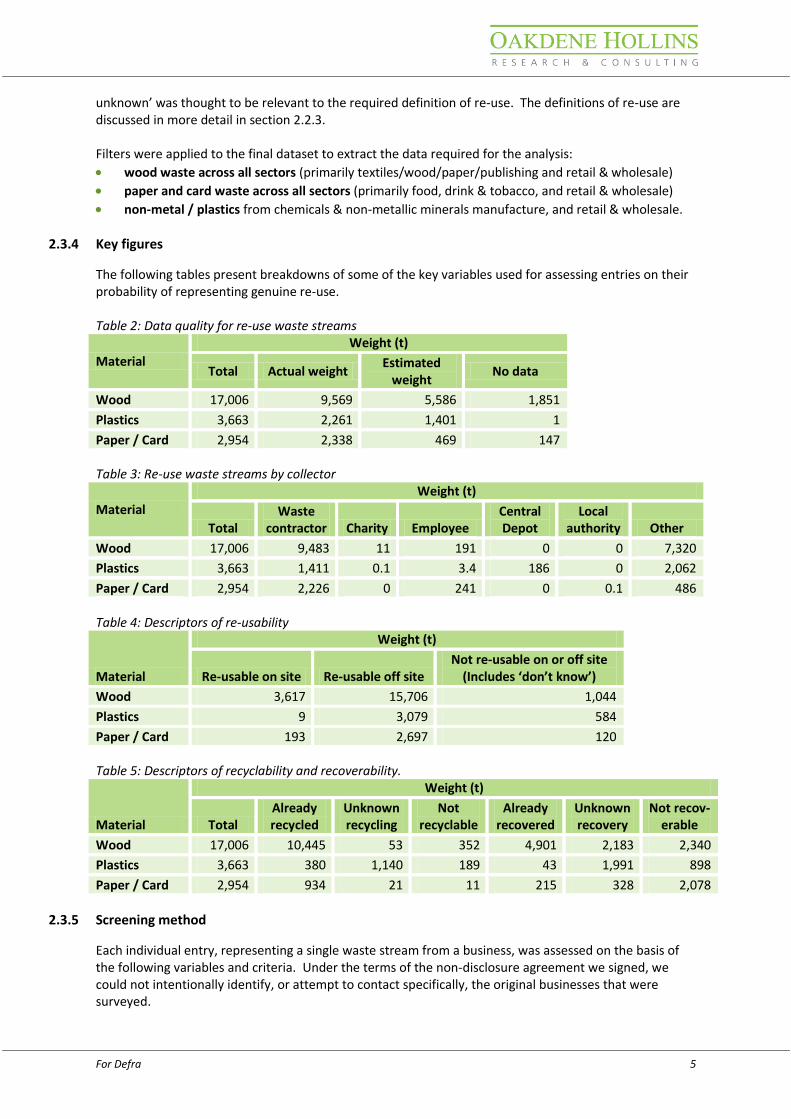
2.3.4 Key figures
The following tables present breakdowns of some of the key variables used for assessing entries on their probability of representing genuine re-use. Table 2: Data quality for re-use waste streams
Material
Weight (t)
Total Actual weight Estimated
weight No data
Wood 17,006 9,569 5,586 1,851
Plastics 3,663 2,261 1,401 1
Paper / Card 2,954 2,338 469 147 Table 3: Re-use waste streams by collector
Material
Weight (t)
Total Waste
contractor Charity Employee Central Depot
Local authority Other
Wood 17,006 9,483 11 191 0 0 7,320
Plastics 3,663 1,411 0.1 3.4 186 0 2,062
Paper / Card 2,954 2,226 0 241 0 0.1 486 Table 4: Descriptors of re-usability
Material
Weight (t)
Re-usable on site Re-usable off site Not re-usable on or off site
(Includes ‘don’t know’)
Wood 3,617 15,706 1,044
Plastics 9 3,079 584
Paper / Card 193 2,697 120 Table 5: Descriptors of recyclability and recoverability.
Material
Weight (t)
Total Already recycled
Unknown recycling
Not recyclable
Already recovered
Unknown recovery
Not recov-erable
Wood 17,006 10,445 53 352 4,901 2,183 2,340
Plastics 3,663 380 1,140 189 43 1,991 898
Paper / Card 2,954 934 21 11 215 328 2,078
2.3.5 Screening method
Each individual entry, representing a single waste stream from a business, was assessed on the basis of the following variables and criteria. Under the terms of the non-disclosure agreement we signed, we could not intentionally identify, or attempt to contact specifically, the original businesses that were surveyed.
6 For Defra
The variables that were taken into account: 1. SIC Descriptor – This provided a detailed description of the industry that the business was engaged
in. The knowledge of the industry allowed for an estimation of the origin of the waste stream and provided the basis of the industry interviews.
2. Company size – In total there were six descriptive categories of business size (5-9, 10-19, 20-49, 50-99, 100-249 and > 250). The size of the business allowed an approximate assessment of whether employee re use was realistic.
3. Weight – This data gave the weight of that waste stream over the year 2009. The magnitude of the waste stream influenced amount of time spent evaluating that waste stream in order to focus time on greatest contributors. Significant weights were treated more sceptically, particularly if this represented the only waste stream of that material for the business, e.g. a cardboard box manufacturer with only one large paper / card waste stream is unlikely to represent genuine re use.
4. Waste collector – This identified the party collecting the waste and was a critical variable since the capabilities of the collecting party determined the probability of re use. The breakdown of waste collectors for each waste type is given in Table 3. It can be seen that waste contractors were the most common waste collector by weight for wood and paper / card and the second most common for plastics. On this basis waste contractors were interviewed separately to determine whether re use through them was a realistic prospect. Confidence of re use was much higher where employees or charities were identified as the waste collector.
5. Contract type - This field captured whether waste collection occurred at a set frequency or whether the waste was collected when the collection container was full. A set frequency waste collection marginally decreased confidence of genuine re use.
6. Frequency / calculated item weight - Some entries included a frequency figure which, according to the survey methodology, was designed to capture the number of times the waste was collected in 2009. In many cases figures such as 12, 26 or 52 were recorded, indicating that this captured a regular waste collection service; this would marginally decrease confidence of genuine re-use. In a significant number of cases the frequency field was clearly used to calculate the weight of a large quantity of regular items. Where this was the case we divided the total weight by the frequency to derive the individual item weight. For many wood waste entries this resulted in an item weight of precisely 20 kg; this significantly increased the confidence that the waste stream represented the re use of wooden pallets which were later described by pallet collection industry to weigh on average approximately 18 kg.
7. Collection container – The collection container data field was primarily used for estimating volumes of waste for subsequent conversion to weights. Many entries included a waste container description, even though the weight was not estimated. The description of the waste container helped evaluate the likely source and composition of the waste stream, e.g. a plastic products manufacturer described their plastic waste stream as being collected in a drum, further casting doubt on whether this represented genuine re-use.
8. Re-usable on or off site – Survey respondents were asked two separate questions on whether the waste stream was re-usable on- and off-site; the questions are outlined in section 2.2.3 Some waste streams were identified as not being suitable for re-use on- or off-site, thereby decreasing confidence of genuine re-use. Where waste streams were identified as re-usable on-site this suggested a genuinely re-usable product and thereby increased confidence. The breakdown of these descriptors across the waste types is presented in Table 4.
For Defra 7
9. Recyclable – The survey respondents were asked “Could this waste by recycled if it is not already?” and given four options: ‘Already recycled’, ‘Yes’, ‘No’ and ‘Don’t know’. Where ‘Already recycled’ was chosen for waste streams it decreased the confidence that this presented genuine re-use. A chosen option of ‘Don’t know’ marginally decreased confidence on the basis of data collection quality. A breakdown of the responses is presented in Table 5.
10. Recoverable – The survey respondents were asked “Could this material be recovered if it is not already, or if it is already recycled? i.e. via incineration with energy, MBT etc” and given four options: ‘Already recovered’, ‘Yes’, ‘No’ and ‘Don’t know’. Where ‘Already recovered’ was chosen for waste streams it decreased the confidence that this presented genuine re use. A chosen option of ‘Don’t know’ marginally decreased confidence on the basis of data collection quality. A breakdown of the responses is presented in Table 5.
For business waste streams that we were unsure about or represented a weight that would significantly affect the total, we also evaluated the waste stream in the context of the other waste streams for the business. For example a business engaged in the manufacture of plastic products had a plastic waste stream that was identified as being re-used. For the whole business this was the only plastics waste stream, thereby indicating that all plastic waste from this business is re-used through a waste contractor. Given the interviews with waste contractors where recycling was the only significant processing method we concluded that this particular waste stream was very unlikely to represent genuine re-use. Each waste stream was graded from 1 – 4 on probability of being genuine re-use using the following guidelines: 1. High confidence of re-use:
a. Employees or charities identified as collection agency b. Weight fits sense check with size of business c. Interviews confirmed widespread re-use. d. Industry group likely to re-use material
2. Likely to be re-use: a. No significant reason to exclude as re-use.
3. Unlikely to be re-use: a. More than one criteria to exclude as re-use b. Weight.
4. Very unlikely to be re-use: a. Questionable data quality b. Conflicting factors c. Obvious recycling.
2.3.6 Plastics
The raw data for plastics re-use included data that covered 3,663 tonnes from 35 business waste streams. This data was grossed up to represent 30,577 tonnes nationally. The top five waste streams accounted for 2,907 tonnes, or 79% of the total tonnage. Of these five waste streams we conducted interviews covering the industry group for four of them. Of the total 35 waste streams the interviews covered the industries for 20 of them, or 3,115 tonnes. There were seven entries from business engaged in the manufacture of plastic products (SIC222); these accounted for 1,172 tonnes (32% of the total weight). Many of these entries were significant weights and in most cases represented the only plastics waste stream to emerge from these businesses. We judged that it would unlikely that manufacturers of plastic products would dispose of significant quantities of plastic products that are suitable for re-use. It was much more likely that this represented post industrial waste recycling. We conducted interviews to confirm this (section 0).
8 For Defra
A second significant industry for the re-use of plastics was the clothing retail sector, accounting for 557 tonnes (15% of the total weight). There were two businesses from this industry classification (SIC47710) that had large weights associated with them. It was hypothesised that this could represent clothing hanger re-used; this was corroborated in industry interviews (section 0). The final significant industry was the retail sale of food and beverages (SIC47110), accounting for 1,379 tonnes (38% of the total weight). The large presence of this industry group can be explained simply by the number of businesses that were interviewed that were classified within this group. Of the 6,005 businesses that were surveyed, 921 were classified as operating under SIC47110 (over 15% of businesses surveyed). Of these 921 businesses, 757 of them were surveyed using corporate collected data that will have even greater inconsistencies regarding the definition of re-use. Nonetheless we interviewed this industry group to determine whether there was genuine re-use occurring (section 0)
2.3.7 Wood
The raw data for wood re-use included data that covered 17,006 tonnes from 189 business waste streams. This data was grossed up by Jacobs to represent 251,580 tonnes nationally. The top five waste streams accounted for 7,163 tonnes, or 42% of the total tonnage. Of these five waste streams we conducted interviews covering the industry group for four of them. Of the total 189 waste streams the interviews covered the industries for 40 of them, or 8,532 tonnes. Wooden pallets were identified as a very likely source of a significant portion of the re-use of wood, with figures obtained in the interview section, suggesting that this alone could easily account for a national gross of over 250,000 tonnes. When analysing the data there were in many cases estimates produced using very high frequency figures suggesting that this was not used as a frequency of collection but rather representing the number of items disposed of. By dividing the total weight by the frequency we could establish the weight of a single item. Of the total dataset of 189 items, 123 included frequency figures that were not zero. Of the 123 data items 35 had a calculated item weight of precisely 20 kg. It is likely that 20 kg was taken as the proxy for pallets when companies could only provide volume figures rather than weights. The waste streams with a calculated item weight of 20 kg will therefore be included except in circumstances where other variables contradict this assessment.
2.3.8 Paper and card
The raw data for paper and card re-use included data that covered 2,954 tonnes from 47 business waste streams. This data was grossed up by Jacobs to represent 25,499 tonnes nationally. The top five waste streams accounted for 2,167 tonnes, or 73% of the total tonnage. Of these five waste streams we conducted interviews covering the industry group for two of them. Of the total 47 waste streams the interviews covered the industries for 8 of them, or 1,833 tonnes. Two businesses engaged in the manufacture of other paper and paperboard containers accounted for over 50% of the total tonnage, 1,531 tonnes. Interviews with this industry confirmed that this would be unlikely to represent genuine re-use. Combined with the fact that both businesses only had a single paper and card waste stream we can confidently exclude these as genuine re-use. Mixed waste streams Mixed waste streams were also included in the full dataset but were excluded from the analysis on the principle that items of re-use value are much less likely within a heterogeneous waste stream. It is possible that in some cases the mixed waste data type was chosen in order to capture a more accurate material composition for single items during the survey e.g. furniture.
For Defra 9
The survey methodology for converting volumes to weights relied on a conversion factor which is fixed depending on the main waste material classification. For mixed waste and household waste these conversion factors were 0.06 and 0.11 respectively, considerably lower than the conversion factors for plastic, wood and paper at 0.22, 0.25 and 0.2 respectively. We identified a total of 15 mixed or household waste streams which may represent the re-use of furniture; these entries totalled 389 tonnes. We estimate that this could represent approximately 5,000 tonnes of re-use nationally based on the grossing up methodology used for wood. The Mixed wastes will have affected the grossing up methodology for Jacobs but accounting for this would have been very difficult based on the raw data we received.
2.3.9 Conclusion
This section outlined the general methodology and criteria that were used to assess the waste data. For each of the waste type some of the key entries and industries were highlighted as examples. The specific comments and findings for each entry are contained within the working copy of the dataset. No conclusions on the magnitude of genuine re-use are drawn at this stage since these findings need to be combined with the information obtained during the industry interviews. The key findings are presented in the final section (section 2.5) and are based on all the available data and information.
2.4 Industry interviews
2.4.1 Purpose
The industry interviews were carried out following the analysis of the dataset. There were a number of industries that accounted for significant weights of re-use and we were unable to confidently determine from the data alone whether this represented significant re-use. The interviews provided additional information that allowed a more confident assessment of the data. Conversations with similar organisations, to those whom would have been contacted for the original survey, also allowed for valuable feedback on methodology. They were also a means of testing the hypothesis that there is general confusion between recycling and re-use.
2.4.2 Scope
The industry groups chosen for interviews were selected on the basis of uncertainty, contribution to total tonnage and likelihood of encountering genuine re-use. The number of interviews conducted for each industry group depended on the importance of group and the level of participation we could achieve within a short time frame.
2.4.3 Conclusion
31 interviews were carried out across eight industry groups and five waste contractors. Records of the individual interviews are included in Appendix A. The results from the interviews were used to refine the analysis of the dataset where relevant. Throughout the course of the interviews it became clear that there were only two main products that were re-used by the majority of the businesses, namely wooden pallets (which could include other wooden secondary packaging) and cardboard boxes. There are successful businesses engaged in managing second hand wooden pallets and cardboard boxes but much of the re-use appears to be ad-hoc, particularly for cardboard boxes.
10 For Defra
Some individual cases of re-use were also uncovered, such as clothing hanger re-use in clothing retailers or furniture re-use within educational establishments. Predominantly the interviews revealed that there was indeed widespread confusion on the definition of re-use and that many people instinctively believe that recycling is a form of re-use. For some of the manufacturer interviews there was an insistence that their activity, essentially post industrial waste recycling, was re-use despite reiterating the accepted definition.
2.5 Conclusion
The Jacobs C&I waste survey estimated that 1.3 million tonnes of re-use occurred in the year 2009. Preliminary analysis of the waste types involved suggested that the actual figure was much lower, estimated to be 350,000 tonnes. In this section we applied a more comprehensive analysis methodology to obtain with greater confidence a more accurate estimate. Our approach was to investigate the previous survey’s methodology and identify how re-use was classified. This provided an understanding of whether the term ‘re-use’ was open to interpretation, and whether it was appropriately and consistently applied across all sectors. A database of the raw data was interrogated for the three waste types across the C&I sector groupings outlined in section 2.3.2, to identify in more detail where re-use was identified in this previous survey. The full dataset was filtered to only include relevant entries and then each entry was individually evaluated based on a number of criteria to determine whether it represented genuine re-use. Once this refinement is completed, a short industry survey of 31 businesses was performed to identify re-use and to determine how re-use was generally interpreted. Stakeholders within the relevant industries were contacted, and industry re-use discussed and characterised using semi-structured interviews. This process identified what was included in the original re-use category and whether it was appropriate for inclusion as re-use; this led to a qualitative estimate of the constituents of the waste for re-use in each sector. This analysis allowed a picture of re-use to be built up for each of these sectors in a consistent manner, identifying what constituted true re-use in these sectors. A discussion of the differences between the re-use figures originally described within the waste survey and the evidence presented though our research is made where appropriate. Areas where further information is needed or would be useful are also identified. There were originally 271 waste streams that fit within the scope of which 192 are possibly re-use. Each waste stream had its own unique data that led to either its inclusion or exclusion based on the described methodology and professional judgement. It is not within the scope of this report to describe each waste stream individually but where groupings of interest were identified these were described.
2.5.1 Plastics
The raw data for plastics re-use included data that covered 3,663 tonnes from 35 business waste streams. This data was grossed up by Jacobs to represent 30,577 tonnes nationally. The top five waste streams accounted for 2,907 tonnes, or 79% of the total tonnage. Of these five waste streams we conducted interviews covering the industry group for four of them. Of the total 35 waste streams the interviews covered the industries for 20 of them, or 3,115 tonnes. Of the 3,663 tonnes we are confident that at least 558 tonnes represents genuine re-use, of which 557 tonnes is accounted for by the re-use of clothing hangers by specialist clothing retailers through two different entries. We confirmed by interview that clothing hanger re-use occurs and these may have been
For Defra 11
treated as a waste product in the past. The remaining re-use that we were confident on are comprised of 8 small waste streams, making the number of waste streams representing genuine re-use 10 of 35. This grosses up to a national re-use figure of 4,655 tonnes, this is 15% of the original figure. By relaxing the required confidence level to the degree of assuming re-use where there are only minor concerns for data quality or probability of re-use gives a survey tonnage of 658 tonnes. This figure includes 15 of the 35 business waste streams and grosses up nationally to 5,489 tonnes, or 18% of the original figure. The remainder of the data had data quality issues or there were significant reasons to conclude that the waste stream did not represent genuine re-use.
2.5.2 Paper and card
The raw data for paper and card re-use included data that covered 2,954 tonnes from 47 business waste streams. This data was grossed up by Jacobs to represent 25,499 tonnes nationally. The top five waste streams accounted for 2,167 tonnes, or 73% of the total tonnage. Of these five waste streams we conducted interviews covering the industry group for two of them. Of the total 47 waste streams the interviews covered the industries for 8 of them, or 1,833 tonnes. Two businesses engaged in the manufacture of other paper and paperboard containers accounted for over 50% of the total tonnage, 1,531 tonnes. Interviews with this industry confirmed that this would be unlikely to represent genuine re-use. Combined with the fact that both businesses only had a single paper and card waste stream we can confidently exclude these as genuine re-use. Of the original 47 waste streams we could only identify two where we had a high degree of confidence that genuine re-use was occurring. The two waste streams had a combined weight of 23.8 tonnes; this would represent a gross national weight of 205 tonnes of re-use, or 0.8% of the original figure. With a relaxing of the confidence level we identified 12 waste streams that possibly represented re-use, these had a combined weight of 142 tonnes. Grossing this tonnage up, it represents a national figure of 1,226 tonnes, or 4.8% of the original figure. The remaining waste streams were classified as unlikely to be genuine re-use based on a number of factors. We were confident that 21 waste streams, weighing 2,438 tonnes, were not re-use based on waste contractor and industry interviews and data quality. A promising area of re-use within the paper and card waste stream was identified as the re-use of surplus, misprinted or second hand cardboard boxes. There is a niche of businesses engaged in commercially facilitating this.
2.5.3 Wood
The raw data for wood re-use included data that covered 17,006 tonnes from 189 business waste streams. This data was grossed up by Jacobs to represent 251,580 tonnes nationally. The top five waste streams accounted for 7,163 tonnes, or 42% of the total tonnage. Of these five waste streams we conducted interviews covering the industry group for four of them. Of the total 189 waste streams the interviews covered the industries for 40 of them, or 8,532 tonnes. Of the 17,006 tonnes we are confident that at least 4,955 tonnes represents genuine re-use; there were 75 waste streams in total where there was a high confidence of re-use. This grosses up to a national re-use figure of 73,894 tonnes, this is 29% of the original figure.
12 For Defra
By relaxing the confidence level to incorporate materials where there were minor concerns over if genuine reuse was occurring increases the amount of reuse by 11,618 tonnes. This figure includes 165 of the 189 business waste streams and grosses up nationally to 171,872 tonnes, or 68% of the original figure. The two main categories of wood re-use we identified through interviews were wooden pallets and furniture. For all waste streams a subjective assessment was made on whether it was likely that the waste stream was comprised of pallets. Of the 165 waste streams where re-use was thought to be likely, we estimate that 140 were probably pallets. These waste streams added up to 11,319 tonnes and would represent 167,449 tonnes nationally, or 67% of the original figure. Interviews with businesses engaged in collecting surplus and damaged pallets revealed that a significant proportion of the pallets that they collect are sent to be chipped or burnt. The majority of the survey business waste streams only included a single wood waste stream and it is therefore unlikely that this wastage is already accounted for in the survey data. It is likely that between 20% and 60% of the wood identified as re-used by businesses are subsequently recycled by the pallet contractor, thereby revising the 167,449 tonnes down to between 67,000 (40%) and 134,000 (80%) tonnes nationally. Interviews with wooden pallet re-users revealed that the much of the broken wood that they handle as an industry is sold on to a specific chipboard manufacturer. This chipboard manufacturer stated to us that they purchase 150,000 tonnes of broken pallets per year. Given that this broken wood could represent between 20% and 60% of the total pallets handled by the re-users we estimate that this indicates pallet re-use between 100,000 and 600,000 tonnes. This is discussed in greater detail in the appendix under interview WD01. An additional issue with measuring wooden pallet re-use through surveys of business and industry is that only a fraction of businesses we interviewed would identify pallets as waste. In many cases they are viewed as a valuable resource or are subject to supplier take-back on following deliveries.
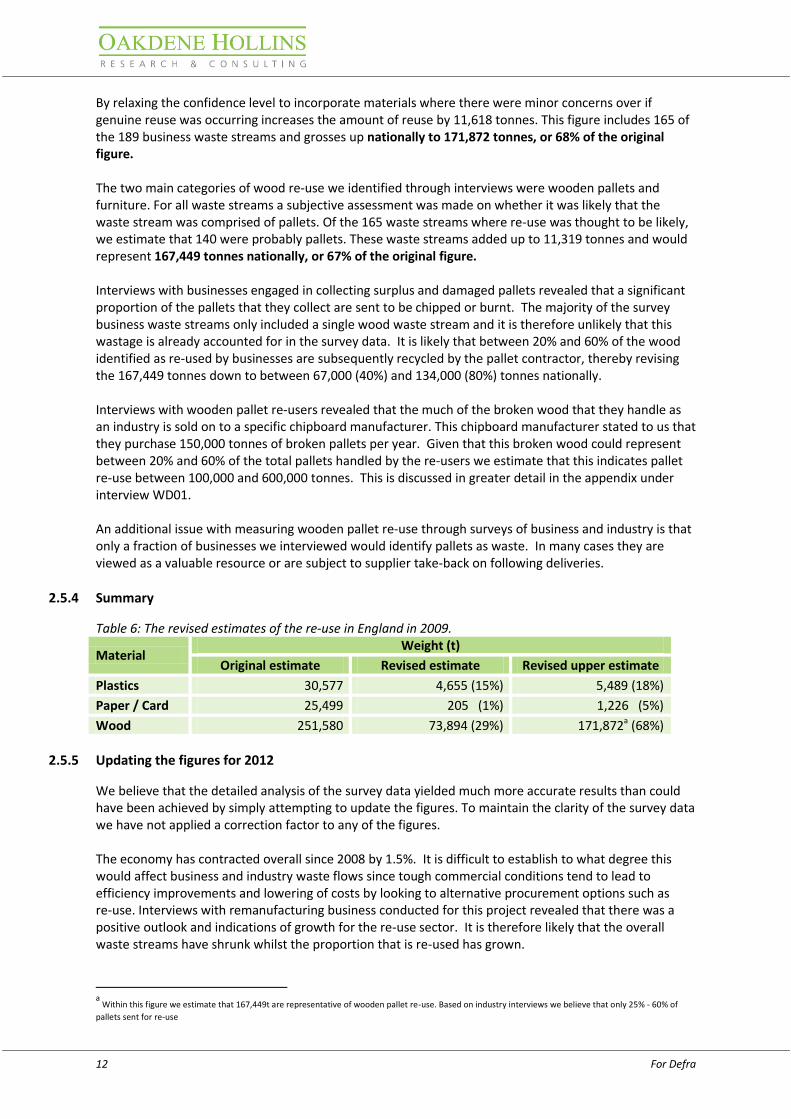
2.5.4 Summary
Table 6: The revised estimates of the re-use in England in 2009.
Material Weight (t)
Original estimate Revised estimate Revised upper estimate
Plastics 30,577 4,655 (15%) 5,489 (18%)
Paper / Card 25,499 205 (1%) 1,226 (5%)
Wood 251,580 73,894 (29%) 171,872a (68%)
2.5.5 Updating the figures for 2012
We believe that the detailed analysis of the survey data yielded much more accurate results than could have been achieved by simply attempting to update the figures. To maintain the clarity of the survey data we have not applied a correction factor to any of the figures. The economy has contracted overall since 2008 by 1.5%. It is difficult to establish to what degree this would affect business and industry waste flows since tough commercial conditions tend to lead to efficiency improvements and lowering of costs by looking to alternative procurement options such as re-use. Interviews with remanufacturing business conducted for this project revealed that there was a positive outlook and indications of growth for the re-use sector. It is therefore likely that the overall waste streams have shrunk whilst the proportion that is re-used has grown.
a Within this figure we estimate that 167,449t are representative of wooden pallet re-use. Based on industry interviews we believe that only 25% - 60% of
pallets sent for re-use
For Defra 13
3 WP3: Revision of the CRR Survey
3.1 Introduction and methodology
In 2009 a survey conducted by the Centre for Remanufacturing and Reuse (CRR) attempted to identify and capture remanufacturing and re-use activity at a sectoral level in the UK. An analysis of business inquiry data (ONS 2007) was conducted, and top-level divisions were identified that were known to have high relevance to remanufacturing and re-use. The total turnover for these manufacturing divisions was calculated to be £65 billion. Criteria were developed to identify groups of relevant sectors for the survey; in total 16 sectors were identified. These sectors encompass a large portion of the remanufacturing activity in the UK. Remanufacturing and re-use were then characterised for each sector using a standardised approach. Key elements of this approach include defining the sector, collecting data from organisations and analysis of the results to estimate turnovers and material savings. The methodology used for the 2009 CRR was considered robust in providing reliable data on the level of remanufacturing and re-use. The previous survey used semi-structured interviews along with analysis of the sectors to determine market size and approximate savings. As a result, unlike with the C&I waste survey, a detailed analysis of the survey data was considered unnecessary. However, economic uncertainty over the last three years meant that the data presented within this survey now required updating. To gain an understanding of the change in re-use levels since the last CRR survey, the four sectors with the highest material savings were revisited in order to gauge the trends which have influenced them since 2009. The four sectors with highest material savings are:
tyre retreads
automotive
off-road equipment
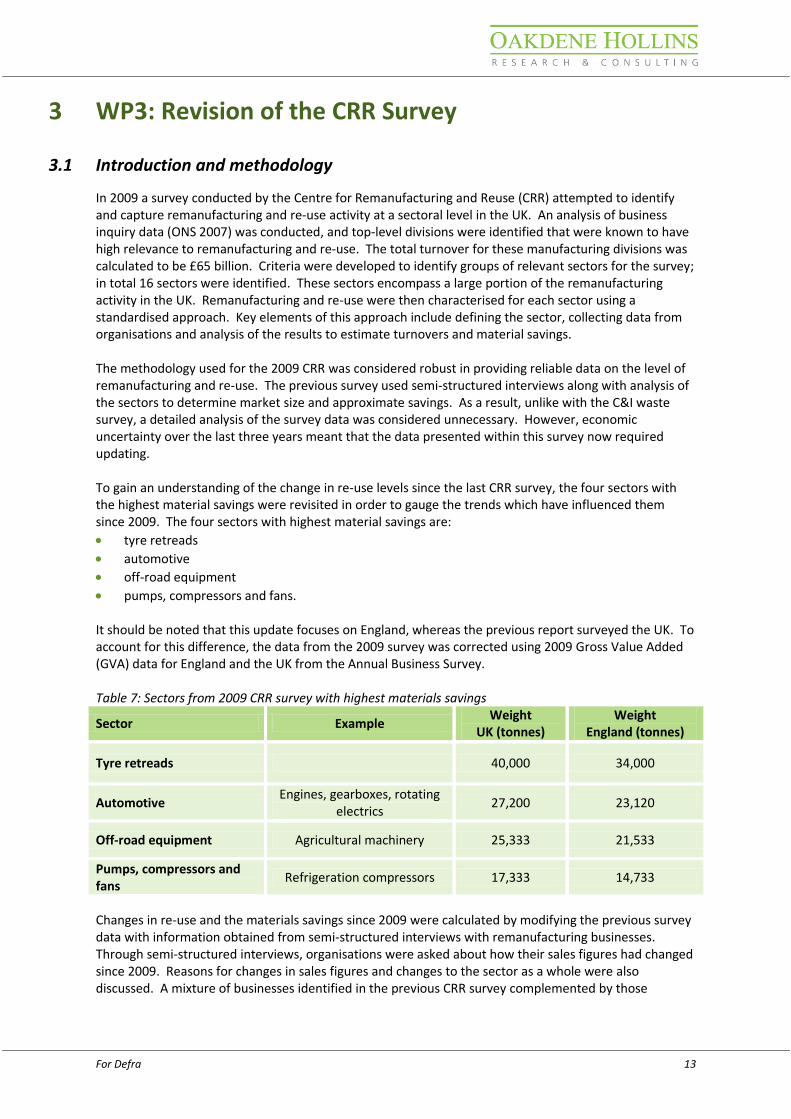
pumps, compressors and fans. It should be noted that this update focuses on England, whereas the previous report surveyed the UK. To account for this difference, the data from the 2009 survey was corrected using 2009 Gross Value Added (GVA) data for England and the UK from the Annual Business Survey. Table 7: Sectors from 2009 CRR survey with highest materials savings
Sector Example Weight
UK (tonnes) Weight
England (tonnes)
Tyre retreads 40,000 34,000
Automotive Engines, gearboxes, rotating
electrics 27,200 23,120
Off-road equipment Agricultural machinery 25,333 21,533
Pumps, compressors and fans
Refrigeration compressors 17,333 14,733
Changes in re-use and the materials savings since 2009 were calculated by modifying the previous survey data with information obtained from semi-structured interviews with remanufacturing businesses. Through semi-structured interviews, organisations were asked about how their sales figures had changed since 2009. Reasons for changes in sales figures and changes to the sector as a whole were also discussed. A mixture of businesses identified in the previous CRR survey complemented by those
14 For Defra
identified since were contacted. Where possible, discussions with relevant trade organisations were held to gain an overview of the sector. The material savings where then estimated by applying the changes in sales reported through the interviews to the data from the previous survey. The variation in responses meant that it was more appropriate to report the results as a range rather than a single figure. Further discussions with industry helped validate these findings by providing a context that helped explained the underlying reasons for the trends. This also helped identifying inconsistent and unreliable results (which were then removed from the analysis).
3.2 Tyre retreads
Tyre-treading can be broadly classified by the area of application. Since 2009 the industry as a whole has been buoyant and has been growing at a rate of 5-10% per year since 2009, with off-road vehicles being the largest area of growth. Reasons for this growth were given as the fall in cheap imports from China where withdrawals of government subsidies and increasing rubber prices have affected pricing and made customers more cost conscious. Table 8: Volume of UK and England Tyre retreads in 2009 Subsector Weight England (tonnes)
Cars, light commercial vehicles and motor-cycles 2,559
Commercial and off-road vehicles 31,441
However, within the tyre treading industry not all sub-sectors have experienced growth over the past few years. In contrast to commercial and off-road vehicles, we found that sales figures for car retreads had declined since 2009. This is in accordance with our previous survey which reported that the car retread market has seen a steady decline since 2001. Table 9: Trends in sales data since 2009 for tyre retreading subsectors Subsector Change since 2009
Cars, light commercial vehicles and motor-cycles 2% decrease
Commercial and off-road vehicles 20-25% increase
3.3 Automotive
The automotive sector is traditionally an area in which remanufacturing has thrived, and our findings indicate that this continues to be the case. However, the industry has changed since the last survey and has become more competitive thus leading to reduced margins and the need to diversify. Many smaller businesses contacted, commented that remanufacture is only financially viable for larger companies. In this sector, remanufacturing is most commonly used to supply replacement parts, either through vehicle manufacturer warranty services or through the third party aftermarket. Several companies commented that the volume of work from vehicle manufacture warranties had increased significantly over the past few years due to manufacturers looking for cost effective methods for fulfilling warranty duties. For rotating electrics, smaller companies interviewed reported that they had suffered due to increased competition from cheap far eastern copies. Conversely, a larger company interviewed reported that there business was largely unaffected by cheap copies as their remanufactured rotating electrics were better quality.
For Defra 15
Table 10: Trends in sales data since 2009 for automotive subsectors
Subsector Change since 2009
Engines 0%
Drive train components 20% increase
Rotating electrics Between 5% decrease and 20% increase
Turbo and superchargers 0%
Other 10% increase
3.4 Off-road equipment
The equipment included within this sector includes motorised and unpowered machinery used within the agricultural, construction and mining industries. Due to the nature of the work this equipment carries out, it is well built, well looked after and has a long lifespan. The majority of remanufacturing in this sector occurs on parts for engine powered machinery such as engines and gear boxes. Overall remanufacturing and re-use activity in this sector has increased since 2009, however figures varied significantly across different companies. In general components remanufacturers reported the largest increases in sales figures, for instance a 50% increase in sales was reported by a company whose main activity is tractor engine remanufacture. Increase in demand from OEMs for reconditioned agricultural equipment was mentioned as the reason for increased activity in this sector. However, it was also mentioned that a change in subsides had caused farmers to buy new as opposed to reconditioned agricultural equipment. Table 11: Trends in sales data since 2009 for off-road equipment subsectors
Subsector Change since 2009
Agricultural machinery Varies from 15% decrease to a 50% increase
Construction and mining equipment 10% increase
3.5 Pumps, compressors and fans
The design, mechanical nature and gradual technical development of pumps and compressors makes them well suited to remanufacture and other forms of re-use. They are durable, and many components such as the casing will last almost indefinitely. Since the last survey there has been little change in the pump industry, however within the compressor industry remanufacture and re-use has become more widespread and established. Unfortunately, data from the previous survey was not split by subsectors, consequently the lack of activity in pump and compressor remanufacturing is not apparent from the headline figures. Businesses across all three subsectors mentioned that since 2009 their industry has been under increased threat from Chinese manufactured goods and in many cases it is cheaper to buy new than it is to refurbish or repair.
16 For Defra
Table 12: Trends in sales data since 2009 for pumps, compressors and fans
Subsector Change since 2009
Pumps 0% - no change
Compressors 5% decrease to a 33% increase
Fans 0% - no change
3.6 Conclusion
Using the method described earlier, data from interviews has been applied to materials savings from the previous survey to provide an estimate of the current levels of remanufacturing and re-use activities in four industry sectors. Overall, re-use and remanufacturing activity has increased across all four sectors in focus. Within these industries, tyre retreading has shown the largest overall increase in demand. In contrast to the manufacturing sector, remanufacturing has been less affected and appears to be thriving during the economic downturn. The combination of closed loop products and product-service orientated business models make it more resilient to economic fluctuations. Table 13: Revised data for 2012 for materials savings from sectors showing highest levels of remanufacturing and re-use activity in 2009 survey.
Sector Weight
England (tonnes) Change
Number of interviews conducted
Tyre retreading 40,237-41,809*
2% decrease to a 25%
increase 4, including 1 trade
association
Automotive
21,964-27,744
5% decrease to a 20% increase
7
Off-road equipment
18,303-32,300
15% decrease to a 50% increase
8
Pumps, compressors and fans
13,996-19,595
5% decrease to a 33% increase
9, including 1 trade association
*These figures were calculated by applying a 2%decrease for light vehicle tyres and a 20-25% increase for commercial tyres.
For Defra 17
Appendix
Appendix A: Interview records - Review of the 2009 C&I Waste Survey The following sections outline the interviews that were conducted. The confidentiality of the businesses we contacted has been ensured through anonymous references.
Waste contractors (5 Interviews)
Many of the waste streams identified waste contractors as the collection method. A number of waste contractors were therefore contacted to establish whether re-use was a likely fate for the materials waste stream. A discussion with the Technical Director of one of the largest waste contractors in the UK revealed that materials of a sufficiently high quality for re-use or preparation for re-use were rarely disposed. Any re-use of such materials was likely to be on an ad-hoc basis where operators at the disposal sites identify individual items that are suitable for resale. There are no significant arrangements with any clients for regular collections of materials that are re-used or prepared for re-use. Discussing the individual materials, it was mentioned that paper and card are rarely suitable for re-use on account of it usually being damp or crumpled. On the topic of plastics the only items that would potentially be re-used are large items such as garden furniture; however such items are unlikely to originate from business and industry on a regular basis. Wooden items that are re-used through waste contractors would be products such as furniture which are rarely of sufficient quality. It was confirmed that wooden pallets would not be remanufactured if received and would either be recycled or burnt for energy. (WC01) Another major waste contractor with close ties to many large businesses was interviewed. It was their assessment that both plastic and paper / card was not re-used on any scale within waste contractors. They were also of the opinion that confusion between re-use and recycling was highly likely amongst business and industry during the survey; this was justified based on experience with customers. Plastic trays within food retailer supply chains were discussed and it was stated that these are re-used internally by the retailers and that they were only ever treated as waste once they were damaged. This view was also given by food retailers during interviews presented in section 0. Wood re-use was thought to be a more likely scenario with the majority relating to pallet re-use and some isolated furniture re-use. (WC02)
A waste contractor focused on the processing of plastic waste was interviewed and they revealed that they process over 20,000 tonnes of plastic waste each year. The majority of the plastic waste, which includes broken plastic pallets from food retailers, is chopped, segregated and remelted. The only example of re-use that was given was the occasional plastic pallet but these accounted for much less than 1 tonnes per year. The business also handles cardboard but the majority of this is received baled and unsuitable for re-use. It was the interviewee’s opinion that waste contractors will rarely see materials or products suitable for re-use. It was suggested that there a number of businesses that make best use of re-usable materials and act as intermediaries between the waste source and the waste contractor. Examples of this are wooden pallet merchants who will take surplus pallets and then only dispose of the ones beyond repair through waste contractors. (WC03) A waste company identified as the recycling agent for a wood product manufacturer was interviewed to confirm the fate of the received wood. All wood that is received by them is recycled by chipping and then sold on. Cardboard and plastics are also processed by this waste management company and there is no re-use, just recycling. (WC04) A dedicated wooden pallet recycling business was interviewed, having been identified as a contractor for a retailer of food. The director of the business told us that they process approximately 50,000 pallets per
18 For Defra
month, weighing 900 t. The business re-uses as many of the pallets as possible and usually achieves a re-use rate of 75% - 80%. Pallets that have minor damage are repaired using parts from other damaged pallets. Of the original 900 tonnes an estimated 200 tonnes is beyond economical repair and sent to a waste wood processor for chipping. (WC05) There is evidence that the figures given above (WC05) are a gross over-estimate of the number of pallets that are suitable for immediate re-use. The chipboard business (WD01) interviewed in section 0 approached their primary supplier of wood chipping from pallets. This pallet recycler stated that only 10% of the pallets they receive are suitable for immediate re-use and a further 30% suitable following repair; the remaining 60% are chipped. (WC06)
Manufacture of wood and of products of wood and cork, SIC16 (4 Interviews)
A very large manufacturer of wood veneer chipboard was interviewed on the basis of clarifying a single large wood re-use waste stream in the data and being identified by pallet re-users as the main buyer of pallets for chipping. It was confirmed that no waste wood products were in a suitable condition for re-use and that most waste was fed back into the manufacturing process or burnt for heat on-site. It was revealed that as a business they purchase 300,000 tonnes of recycled wood per annum and that a minimum of 50% of this is comprised of broken wooden pallets. If the 20% disposal rate given by the wooden pallet recycler (WC05) is representative of the industry, then this could indicate that approximately 600,000 tonnes of pallets are re-used per year by the businesses that supply this chipboard manufacturer alonea. Using the more conservative disposal rate of 60% given by the other recycler (WC06) this figure would be revised down to 100,000 tonnes.b (WD01) A roof truss manufacturer stated that any offcuts that were large enough to be useful were re-used on-site as part of the manufacturing process. Small offcuts were sold as firewood and saw dust was sold to local farmers as substrate for the dairy cow sheds. No wood waste was sent to waste contractors for disposal and none was re-used for its original purpose. (WD02) A small joinery engaged in manufacturing bespoke wood components had an onsite burner that was automatically fed by saw dust extractors and manually fed with wood offcuts. No wood waste was re-used or disposed of by any other means. (WD03) A wood veneer laminate manufacturer stated that all of their wood waste was collected and processed by a waste management company that we also interviewed. The interview with the waste management company confirmed that there was no re-use, only recycling into chippings. (WD04)
Manufacture of other paper and paperboard containers, SIC17219 (2 Interviews)
A cardboard box manufacturer capable of producing both conventional and die-cut boxes was interviewed. The business sources corrugated cardboard from other businesses and cuts the boards to the required size and shape. This process results in a significant amount of post industrial waste that is recycled through a waste contractor. This business also purchases second hand boxes to sell on to customers at a lower price. This means that the business is engaged in re-use but not of industrial waste. Had this business been questioned in the waste survey then they would have not treated the second hand boxes that they purchase as a waste stream. (PC01) One of the main businesses engaged in the purchase and resale of surplus and second hand boxes in England revealed that this was a niche market with significant tonnages. The importance of contracts with large organisations was highlighted as a source for high quality second hand packaging. It was raised that recycling targets have had a negative impact on the supply of second hand boxes despite re-use
a 50% of 300,000t is 150,000 t. If 150,000t is representative of 20% then the remaining 80% accounts for 600,000 t.
b 50% of 300,000t is 150,000 t. If 150,000t is representative of 60% then the remaining 40% accounts for 100,000 t.
For Defra 19
being the more beneficial activity. Businesses such as this demonstrate that there is an active re-use market for boxes. (PC02)
Printing n.e.c.a, SIC18129 (3 Interviews)
A large printing company in England was interviewed. The only significant waste stream for wood within the industry was identified as pallets. The business receives many pallets from materials suppliers and these are re-used internally by using them to ship finished produce. The demand for pallets outstrips supply so they have to purchase additional pallets. Some of the pallets they receive from materials suppliers are broken or not suitable for internal re-use in which case they are recycled. On the topic of paper or card re-use it was confirmed that nothing they produce would be suitable for re-use since it is printed material that would only have value to the specific client. (PR01) A high street printing shop explained to us that any supplies that are delivered on pallets will eventually have the pallets returned to the suppliers through backhauling; these would never be treated as waste by the business since they know the suppliers will take them at the next delivery. The only legitimate re-use that was identified was the occasional customers taking or returning cardboard boxes which are then re-used as boxes. (PR02) A printer and bookbinder re-used wooden pallets received from suppliers by shipping customer orders on them. Any broken pallets are collected and burnt in a residential burner. The re-use of cardboard boxes is common place in the business. (PR03)
Manufacture of essential oils, SIC20530 (2 Interviews)
One of the larger manufacturers of essential oils was interviewed. This business imports the raw materials from the countries of origin and then processes and blends them to produce the essential oils. One of their largest waste streams are steel drums which they crush and recycle rather than re-use. Any broken wooden pallets are scrapped on site and turned into fire wood. Good pallets coming in from suppliers are re-used in a closed loop on site and would not be counted as waste until they were broken. No significant plastic waste streams were identified and any plastic they do dispose of is recycled. (EO01) A much smaller essential oil manufacturer was interviewed and they could not identify any re-use of waste streams within their business. (EO02)
Manufacture of rubber and plastic products, SIC222 (5 Interviews)
A manufacturer of plastic goods was initially convinced that they carry out re-use of plastic on a large scale. The activities that they believed to be re-use were the bailing up and sale of packaging waste, the regrinding and reintroduction of process waste to the production machinery, raw material supplier take-back schemes and the purchase of recycled raw materials. These activities are classified as recycling and fall outside the definition of re-use. The only notable re-use of materials that occurred within the business was the purchase of second-hand wooden pallets, further reinforcing the strong nature of this re-use industry. (PL01) Shorter interviews were conducted with four other businesses engaged in manufacturing plastic products. The unanimous view was that post industrial waste recycling was common place and that varying proportions of recycled raw materials were used depending on the product specification. None of the businesses identified any re-use of plastics within their organisation. (PL02, PL03, PL04 and PL05) Five interviews were conducted and none identified re-use of plastic and only one identified re-use of wood by purchasing second-hand pallets. At four of the businesses there was initial confusion as to
a n.e.c.: not elsewhere classified

20 For Defra
whether their activity was classed as re-use. As a result of the industry interviews we conclude that there is no widespread re-use of plastic within the SIC222 industry and that any waste streams identified as re-use are more likely to be post industrial waste recycling.
Retail sale in non-specialised stores with food, beverages or tobacco predominating, SIC47110 (4 Interviews)
All three of the largest food retailers by market share were interviewed for this survey; they are not presented in order of market share. A fourth retailer had provided us with a detailed breakdown of their store waste and their processing method, which allowed us to establish where re-use was occurring. A conversation with a manager within the procurement department revealed that they do not carry out re-use of any of their packaging materials and no examples of re-use elsewhere in the business could be identified. Furthermore when discussing re-usable packaging such as pallets, plastic crates etc., it was confirmed that these are viewed as multiple use products and would not be classified as waste until they were damaged and no longer fit for purpose. The tonnages for these products would therefore not be captured in a survey of waste and can be confidently excluded from the figures. (FD01) The packaging manager at the second of the largest food retailers responded to the question of what happens to their waste by stating that they do not have waste, they have resources. This raises the valid point that, particularly amongst large businesses, there is a shift away from waste management to resource efficiency. The conversation confirmed that plastic crates, and other secondary packaging, would not be viewed as a waste stream that is re-used but rather as a product that has a lifetime spanning multiple uses. On the topic of wood re-use it was confirmed that this would almost certainly just be pallets. Any surplus or broken pallets are returned directly to the pallet supplier for processing. Interviews with the pallet industry revealed that, as expected, there is active repair and re-use activity. The retailer informed us that each year they source approximately 500,000 pallets, of which 134,000 were returned to the supplier in a broken condition; no data on re-use rates at the pallet supplier was available. (FD02) We spoke to the waste and recycling manager at the final one of the three largest food retailers. They were keen to provide us with a more considered answer and held an internal discussion with the waste and corporate responsibility teams. They could not identify any re-use of waste streams and confirmed that secondary packaging such as plastic crates and wooden pallets are considered as assets and would not enter the waste stream unless damaged. The damaged pallets and surplus pallets were sent to waste contractors to be recycled. (FD03) Access to comprehensive waste data for a different major UK food retailer revealed that across the entire operation there was approximately 300 tonnes of wood waste classified as being re-used. Contact with the dedicated waste handler revealed that this was solely comprised of pallet re-use. (FD04)
Retail sale of clothing in specialised stores, SIC47110 (2 Interviews)
A major clothing retailer was interviewed and it was established that the re-use of clothing hangers is routine within their business and likely to account for some of the significant tonnages observed in the waste survey for this industry group. No other cases of re-use were identified, although plastic crates were mentioned. The clothes are received in plastic crates and require hanging by staff at the store; the clothes hangers are supplied to each store separately. When customers purchase goods from the store it is assumed they do not want to keep the hangers but can on request. The removed hangers are placed in a bin and re-used for the next batch of clothes that require hanging. If a store has more hangers then they need, or the hangers are not sorted, they can be sent to a central processing facility where they are sorted and sent back out to stores. Occasionally the image of the stores will change and new hangers styles will be
For Defra 21
introduced; the old style hangers are then cascaded down to their clearance stores. Hangers are only ever recycled when they are damaged. (CL01) A second interview confirmed that hangers are routinely re-used within stores in a closed loop. This retailer realises the value of the hangers and discourages customers to take them at the point of purchase. Surplus hangers at stores are backhauled to a central facility and subject to an automated stress test to verify their condition. Hangers that are damaged or fail the stress test are granulated for recycling. (CL02) Two strong cases for routine hanger re-use were identified that could easily account for the tonnages represented in the survey data. These data items can be classed with some confidence as genuine re-use.
Education, SIC85 (4 interviews)
Three local primary schools were interviewed of which two stated that they allow staff and parents to take home unwanted furniture. One of these schools actively encourages this and identifies themselves as leaders within the county for sustainability issues. Given that within just three interviews there were already two instances of furniture re-use it was recognised that the figures in the survey were most likely reliable. (ED01, ED02 and ED03) A large English university actively advertises the re-use of furniture and other items on their website and make provision for their students to get involved. The university estimates that they have made savings of £37,000 and 30 tCO2. Given this proactive attitude by one university it is reasonable to assume that there are other universities that are also actively re-using waste and that the figures in the survey data are genuine. (ED04)

22 For Defra
Appendix B: Interview records for CRR survey update The following outlines the interviews conducted as part of the CRR survey update. The confidentiality of the businesses we contacted has been ensured through anonymous references.
Tyre retreaders (5 interviews)
A discussion with one of the industry associations revealed that the whole retreading market is very buoyant and has been growing at a rate of 5–10% per year since 2009. Detailed data for the years 2009, 2010 and 2011 confirm this growth in terms of both sales and production. No data for 2012 had yet been produced but indications from industry were that growth was continuing. This would result in total growth of 20–25% from 2009 to 2012 for the commercial and off-road vehicle tyre retreading industry. This headline figure hides the explosion in growth for the tractor and earthmover tyres, which constitutes just over 1% of the commercial and off-road sector. Between 2009 and 2011 the industry grew by 260%, producing 2,200 units in 2009 compared with 5,700 in 2011. In 2010 the production and sales figures were even higher at 7,100, perhaps demonstrating the volatility of this industry. For cars, light commercial vehicles and motorcycles, data, covering approximately 50% of this industry sector shows that between 2009 and 2011 this sector declined 2% in terms of sales and declined 7% in terms of production. (TR01) Reasons for this growth were given as the fall in cheap imports from China where withdrawals of government subsidies and increasing rubber prices have affected pricing. The customers for tyres have also become more cost-conscious and give serious consideration to retread tyres where in the past they may have been overlooked. (TR02) Interviews were also conducted with four tyre retreading businesses, to verify the reports from the trade association. A tyre retreading business stated that the threat from Chinese imports had largely subsided thanks to increasing raw material prices which they are better shielded from. Its business has increased 40%-60% since the survey was done in 2009 and this trend was thought to apply largely to the whole retread industry. OEMs have shown a greater interest in retread since they are losing some of their core business as hauliers look for more cost effective options. (TR03 &TR04). A retreading business engaged in retreads for car and light commercial vehicles told us that its business has been fairly static for the past few years and that increasing rubber prices have made no difference to the demand for its service. (TR05)
Automotive remanufacturers (7 interviews)
A small engine remanufacturing business contacted told us that sales had stayed roughly the same and that the majority of its work was through guarantees on engine parts. (AU01) Three businesses were contacted that remanufacture rotating electrics. A large company contacted reported that it had seen a significant increase in sales over the last three years and this was attributed to the quality of remanufactured parts compared to cheap Chinese copies. (AU03) However another company contacted stated that it had seen a decline in sales, due to increased competition from cheap Chinese copies. (AU04) A small company contacted told us that the market has changed significantly since 2009 and smaller companies can no longer compete and are frequently being over taken by larger companies. It stated that remanufacturing is only financially viable for larger companies due to economies of scale. (AU05) A large remanufacturer of automotive parts reported that it had seen a large increase in sales. The reasons stated for this were competition failing, higher volumes and better quality products compared to cheap copies. (AU02) Another remanufacturer of automotive parts contacted had also seen an increase
For Defra 23
in sales. It also told us that it had diversified its business in order to survive and it now remanufactures a larger range of parts. (AU07) A supplier of remanufactured turbo chargers reported that it had seen little change in its business since 2009. (AU06)
Off-road equipment (8 interviews)
A small tractor engine remanufacturer contacted reported that it had seen demand for its products grow considerably since 2009, particularly in 2011 and 2012. For 2009 and 2010 it was remanufacturing approximately 45 engines per year. This rose to 57 in 2011 (25% growth over 2009) and is on track for approximately 70 engines in 2012 (50% growth over 2009). One driver for this growth has been the demand from OEMs such as Ford for reconditioned engines to provide for its customers. (OR02) A conversation with a large dealer for used agricultural equipment revealed that there had been a decrease in sales of used tractors and other agricultural equipment and that this was true of the whole sector. The dealer also reported that there had also been a decrease in new sales. (OR01) A supplier of reconditioned tractors and agricultural machinery reported that there is a thriving export market for reconditioned and remanufactured agricultural equipment to developing markets. It told us that its business had seen strong growth in the past three years but it could not comment on England. (OR3) Another business engaged in both exports and domestic sales told us that its business has been doing very well since 2010. Whilst 80% of its business was traditionally exports, this has declined in the past few years due to exchange rates. The domestic sales of the reconditioned tractors has grown sufficiently to counteract the drop in exports. This is possibly due to a strong marketing effort through farming publications, and may not reflect a growth in demand for reconditioned tractors. The view of farming in general in the UK was very positive, with a statement that it is as good as it has ever been. (OR04) A family-run specialist gardening equipment retailer told us that the demand for their reconditioned lawn mowers has seen very strong growth in the past two years. Its business model is to use the autumn and winters seasons to build reconditioned stock for sale in the spring and summer. Whereas it usually builds sufficient stock for the whole year, this year it sold out at Easter despite having similar stock levels to start with. Demand for the reconditioned lawnmowers was estimated to have grown by at least 25% since 2009. The reason for this is that the imported lawn mowers have become much less competitive recently due to exchange rates and stock limitations from Japan. In terms of customer attitudes the retailer has seen that customers are much more sensitive to prices and will shop around now whereas they used to come in to the store and choose on the spot. (OR05) We spoke to a remanufacturer of gearboxes for agricultural machinery who reported that its turnover had decreased. The reasons given were that farmers now had more subsidies than a few years ago and as a result are buying new equipment rather than remanufactured. (OR06) A change in farmers’ attitudes was also reported by a supplier of agricultural machinery, who reported that the change had caused a decrease in sales of reconditioned equipment. (OR07) An OEM of plant and earthmoving equipment was interviewed regarding their efforts to provide remanufactured products. They see it as part of their core offering and as a better alternative to repair of customer’s equipment. Their remanufacturing activity brings products back up to OEM quality and are marketed as such. There is a strong domestic and export market for their remanufactured products. No estimate for growth could be given but their remanufactured business has definitely grown rather than shrunk over the past three years. (OR08)
24 For Defra
Pumps, compressor and fan remanufacturers (9 interviews)
A major pump manufacturer contacted, told us that they had seen very little change in their pump reconditioning business however manufacturing had seen a 50% increase since 2009. (PU01) A company that specialises in refurbishment of high pressure jetting units reported that its sales had fallen due to a change in legislation. (PU02) We spoke to a trade association for pump manufacturers that was unaware of any remanufacture or reconditioning activity taking place and commented that its members had never discussed it. (PU03) Four companies who undertake compressor remanufacturing were contacted. A large remanufacturing business contacted reported that their business had been growing steadily since 2009, at around 11% per year. (CO1) A refrigeration company told us that it had seen a 5% decrease in sales for remanufactured goods, due to market-led demands. In order to become more competitive it has had to decrease its margins. (CO2) Another remanufacturing business contacted had seen no change in its sales figures; however it had noticed an increasing amount of foreign pumps. (CO3) A supplier of remanufactured compressors for refrigeration and air conditioning had seen their business grow since 2009. (CO4) We spoke to a supplier of industrial fans that had seen no change in the number of fans that it recondition since 2009. Fans are only reconditioned or remanufactured if they are custom built, otherwise it is always cheaper to buy new. The reasons stated for this were cheap imports from China and the high cost of labour in Britain. (FA02) One manufacturer we interviewed was not aware of any remanufacturing activity at all within the industry. (FA01)
About the authors:
Ben Walsh MSci PhD
Senior Consultant Ben joined us in 2005 with previous experience in clean technology. He is knowledgeable on the processes and drivers of innovation, has first-hand experience of technology transfer and years of experience monitoring collaborative research projects. He has delivered several major reports including the Environmental Benefits of Nanotechnology, the Manufacturing Strategy for the East Midlands and several studies on remanufacturing. He has produced studies examining the sustainable research within EPSRC and developed a methodology to value innovation, in particular nanotechnology. Ben is also the Manager for the Centre for Remanufacturing and Reuse.
Josie Arendorf MSci PhD With a background in scientific research, since joining Oakdene Hollins Josie has utilised her technical skills in a diverse range of projects for clients including the UK government, European Commission and private companies. Her work has covered several topics including battery recycling, critical metals and repair and remanufacturing. She has undertaken analysis of raw product data to produce risk dependency and supplier maps. Josie joined Oakdene Hollins in November 2011 with a PhD in physical organic chemistry and a Master of Science degree with first class honours in chemistry from University College London.
Philip Derbyshire BSc EngD Phil joined Oakdene Hollins in 2011 as a Technical Consultant. Projects he has worked on include preparing a technical appraisal for the OECD on the use of nanotechnology for renewable energy and completing a lifecycle assessment study comparing remanufacturing in Europe and the Far East. As a trained lifecycle assessment practitioner, his work is focused on collecting high quality data to develop accurate models of complex systems. Before joining us, Phil completed an Engineering Doctorate at Cranfield University: an industry-focused research programme that included the first of a two year MBA from Cranfield School of Management. His first degree was in nanotechnology, providing him with a multi-disciplinary scientific perspective.
Disclaimer: Oakdene Hollins believes the content of this report to be correct as at the date of writing. The opinions contained in this report, except where specifically attributed, are those of Oakdene Hollins. They are based upon the information that was available to us at the time of writing. We are always pleased to receive updated information and opposing opinions about any of the contents. The listing or featuring of a particular product or company does not constitute an endorsement by Oakdene Hollins, and we cannot guarantee the performance of individual products or materials. This report must not be used to endorse, or suggest our endorsement of, a commercial product or service. All statements in this report (other than statements of historical facts) that address future market developments, government actions and events, may be deemed ‘forward-looking statements’. Although Oakdene Hollins believes the outcomes expressed in such forward-looking statements are based on reasonable assumptions, such statements are not guarantees of future performance: actual results or developments may differ materially. Factors that could cause such material differences include emergence of new technologies and applications, changes to regulations, and unforeseen general economic, market or business conditions. We have prepared this report with all reasonable skill, care and diligence within the terms of the contract with the client. Although we have made every reasonable effort to ensure the accuracy of information presented in this report, Oakdene Hollins cannot expressly guarantee the accuracy and reliability of the estimates, forecasts and conclusions herein. Factors such as prices and regulatory requirements are subject to change, and users of the report should check the current situation. In addition, care should be taken in using any of the cost information provided as it is based upon specific assumptions (such as scale, location, context, etc.). Clients should satisfy themselves beforehand as to the adequacy of the information in this report before making any decisions based on it.


![Tyre Retreading Machine Specification[1]](https://img.dokumen.tips/doc/110x75/577ce4ab1a28abf1038ee381/tyre-retreading-machine-specification1.jpg)


