Embed Size (px)
Citation preview

micromachines
Article
A New Analytical Model to Estimate the VoltageValue and Position of the Pull-In Limit of aMEMS CantileverCevher Ak 1 and Ali Yildiz 2,*
1 Department of Electrical and Electronics Engineering, Toros University, Mersin 33140, Turkey;[email protected]
2 Department of Electrical and Electronics Engineering, Mersin University, Mersin 33343, Turkey* Correspondence: [email protected]; Tel.: +90-324-361-0001
Academic Editors: Hiroshi Toshiyoshi and Nam-Trung NguyenReceived: 25 January 2016; Accepted: 18 March 2016; Published: 24 March 2016
Abstract: In this study, a new analytical model is developed for an electrostatic MicroelectromechanicalSystem (MEMS) cantilever actuator to establish a relation between the displacement of its tip andthe applied voltage. The proposed model defines the micro-cantilever as a rigid beam supportedby a hinge at the fixed-end with a spring point force balancing the structure. The approach of themodel is based on calculation of the electrostatic pressure centroid on the cantilever beam to localizethe equivalent electrostatic point load. Principle outcome of the model is just one formula valid forall displacements ranging from the initial to the pull-in limit position. Our model also shows thatthe pull-in limit position of a cantilever is approximately 44% of the initial gap. This result agreeswell with both simulation results and experimental measurements reported previously. The formulahas been validated by comparing the results with former empirical studies. For displacements closeto the pull-in limit, the percentage errors of the formula are within 1% when compared with realmeasurements carried out by previous studies. The formula also gives close results (less than 4%)when compared to simulation outcomes obtained by finite element analysis. In addition, the proposedformula measures up to numerical solutions obtained from several distributed models which demandrecursive solutions in structural and electrostatic domains.
Keywords: cantilever; electrostatic actuator; lumped model; pull-in limit; pull-in voltage; pivot model
1. Introduction
Electrostatic cantilevers have been very popular due to their low-power requirements, smalldimensions, and ease of fabrication. They have been used as a pressure sensor [1,2], as a microwaveswitch [3–6], as an air flow sensor [7–9], as an inkjet head [10–12], as chemical and biologicalsensors [13–15], and as an energy harvester for Microelectromechanical System (MEMS) devices [16–18].
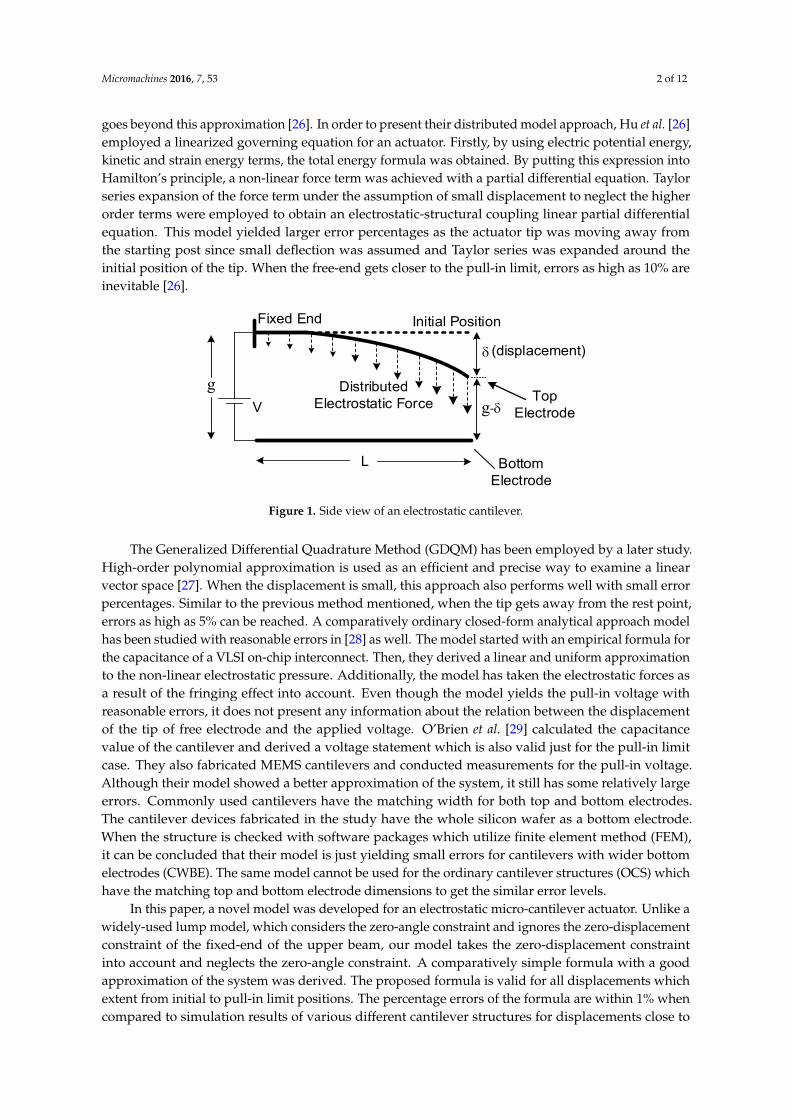
An electrostatic MEMS cantilever consist of two parallel beams forming a capacitor. The bottombeam is stationary and fabricated on the substrate. The top beam is suspended with an effectivearea A and is raised by a gap, g, over the ground beam. One side of the upper electrode is not fixedand entirely free to move and the opposite side is fixed to substrate. As voltage difference betweenconductive plates gets higher, the free-end will start to incline towards to bottom electrode due toelectrostatic force. Actual behavior of a cantilever can be seen distinctly in Figure 1.
Derivation of an analytical formula to calculate the pull-in limit of a cantilever actuator isnot a trivial task due to its non-linear behavior. Researchers have been using a lumped modelfor MEMS-based electrostatic cantilevers to estimate the pull-in limit position for more than twodecades [19–25]. The lumped model approximates the pull-in limit position as one-third of the originalspacing (g/3). Notwithstanding, previous research demonstrated experimentally that the pull-in limit
Micromachines 2016, 7, 53; doi:10.3390/mi7040053 www.mdpi.com/journal/micromachines
Micromachines 2016, 7, 53 2 of 12
goes beyond this approximation [26]. In order to present their distributed model approach, Hu et al. [26]employed a linearized governing equation for an actuator. Firstly, by using electric potential energy,kinetic and strain energy terms, the total energy formula was obtained. By putting this expression intoHamilton’s principle, a non-linear force term was achieved with a partial differential equation. Taylorseries expansion of the force term under the assumption of small displacement to neglect the higherorder terms were employed to obtain an electrostatic-structural coupling linear partial differentialequation. This model yielded larger error percentages as the actuator tip was moving away fromthe starting post since small deflection was assumed and Taylor series was expanded around theinitial position of the tip. When the free-end gets closer to the pull-in limit, errors as high as 10% areinevitable [26].
Micromachines 2016, 7, 53 2 of 12
this approximation [26]. In order to present their distributed model approach, Hu et al. [26] employed a linearized governing equation for an actuator. Firstly, by using electric potential energy, kinetic and strain energy terms, the total energy formula was obtained. By putting this expression into Hamilton’s principle, a non-linear force term was achieved with a partial differential equation. Taylor series expansion of the force term under the assumption of small displacement to neglect the higher order terms were employed to obtain an electrostatic-structural coupling linear partial differential equation. This model yielded larger error percentages as the actuator tip was moving away from the starting post since small deflection was assumed and Taylor series was expanded around the initial position of the tip. When the free-end gets closer to the pull-in limit, errors as high as 10% are inevitable [26].
L
V
Initial Position
δ (displacement)
Fixed End
g-δ
BottomElectrode
TopElectrode
g Distributed Electrostatic Force
Figure 1. Side view of an electrostatic cantilever.
The Generalized Differential Quadrature Method (GDQM) has been employed by a later study. High-order polynomial approximation is used as an efficient and precise way to examine a linear vector space [27]. When the displacement is small, this approach also performs well with small error percentages. Similar to the previous method mentioned, when the tip gets away from the rest point, errors as high as 5% can be reached. A comparatively ordinary closed-form analytical approach model has been studied with reasonable errors in [28] as well. The model started with an empirical formula for the capacitance of a VLSI on-chip interconnect. Then, they derived a linear and uniform approximation to the non-linear electrostatic pressure. Additionally, the model has taken the electrostatic forces as a result of the fringing effect into account. Even though the model yields the pull-in voltage with reasonable errors, it does not present any information about the relation between the displacement of the tip of free electrode and the applied voltage. O’Brien et al. [29] calculated the capacitance value of the cantilever and derived a voltage statement which is also valid just for the pull-in limit case. They also fabricated MEMS cantilevers and conducted measurements for the pull-in voltage. Although their model showed a better approximation of the system, it still has some relatively large errors. Commonly used cantilevers have the matching width for both top and bottom electrodes. The cantilever devices fabricated in the study have the whole silicon wafer as a bottom electrode. When the structure is checked with software packages which utilize finite element method (FEM), it can be concluded that their model is just yielding small errors for cantilevers with wider bottom electrodes (CWBE). The same model cannot be used for the ordinary cantilever structures (OCS) which have the matching top and bottom electrode dimensions to get the similar error levels.
In this paper, a novel model was developed for an electrostatic micro-cantilever actuator. Unlike a widely-used lump model, which considers the zero-angle constraint and ignores the zero-displacement constraint of the fixed-end of the upper beam, our model takes the zero-displacement constraint into account and neglects the zero-angle constraint. A comparatively simple formula with a good approximation of the system was derived. The proposed formula is valid for all displacements which extent from initial to pull-in limit positions. The percentage errors of the formula are within 1% when compared to simulation results of various different cantilever structures for displacements close to
Figure 1. Side view of an electrostatic cantilever.
The Generalized Differential Quadrature Method (GDQM) has been employed by a later study.High-order polynomial approximation is used as an efficient and precise way to examine a linearvector space [27]. When the displacement is small, this approach also performs well with small errorpercentages. Similar to the previous method mentioned, when the tip gets away from the rest point,errors as high as 5% can be reached. A comparatively ordinary closed-form analytical approach modelhas been studied with reasonable errors in [28] as well. The model started with an empirical formula forthe capacitance of a VLSI on-chip interconnect. Then, they derived a linear and uniform approximationto the non-linear electrostatic pressure. Additionally, the model has taken the electrostatic forces asa result of the fringing effect into account. Even though the model yields the pull-in voltage withreasonable errors, it does not present any information about the relation between the displacementof the tip of free electrode and the applied voltage. O’Brien et al. [29] calculated the capacitancevalue of the cantilever and derived a voltage statement which is also valid just for the pull-in limitcase. They also fabricated MEMS cantilevers and conducted measurements for the pull-in voltage.Although their model showed a better approximation of the system, it still has some relatively largeerrors. Commonly used cantilevers have the matching width for both top and bottom electrodes.The cantilever devices fabricated in the study have the whole silicon wafer as a bottom electrode.When the structure is checked with software packages which utilize finite element method (FEM),it can be concluded that their model is just yielding small errors for cantilevers with wider bottomelectrodes (CWBE). The same model cannot be used for the ordinary cantilever structures (OCS) whichhave the matching top and bottom electrode dimensions to get the similar error levels.
In this paper, a novel model was developed for an electrostatic micro-cantilever actuator. Unlike awidely-used lump model, which considers the zero-angle constraint and ignores the zero-displacementconstraint of the fixed-end of the upper beam, our model takes the zero-displacement constraintinto account and neglects the zero-angle constraint. A comparatively simple formula with a goodapproximation of the system was derived. The proposed formula is valid for all displacements whichextent from initial to pull-in limit positions. The percentage errors of the formula are within 1% whencompared to simulation results of various different cantilever structures for displacements close to
Micromachines 2016, 7, 53 3 of 12
the pull-in limit position. The proposed model also measures up to numerical results obtained fromdifferent distributed models while using lower computing efforts.
2. Lumped Model
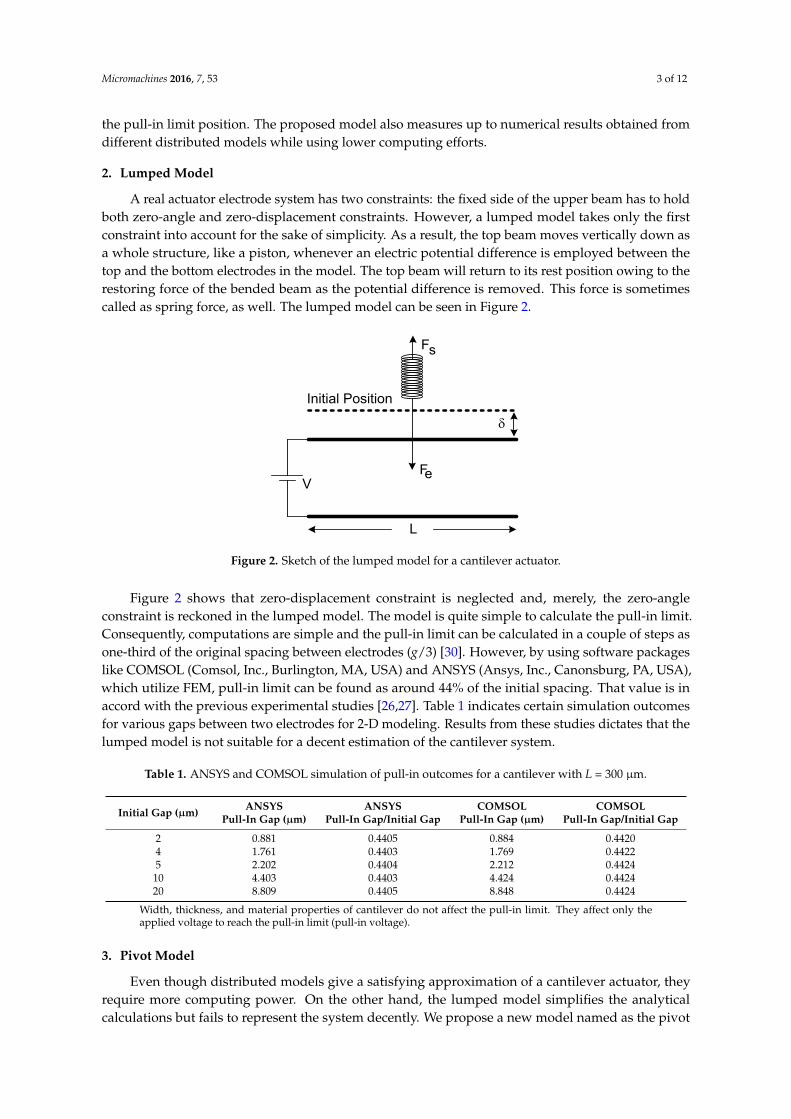
A real actuator electrode system has two constraints: the fixed side of the upper beam has to holdboth zero-angle and zero-displacement constraints. However, a lumped model takes only the firstconstraint into account for the sake of simplicity. As a result, the top beam moves vertically down asa whole structure, like a piston, whenever an electric potential difference is employed between thetop and the bottom electrodes in the model. The top beam will return to its rest position owing to therestoring force of the bended beam as the potential difference is removed. This force is sometimescalled as spring force, as well. The lumped model can be seen in Figure 2.
Micromachines 2016, 7, 53 3 of 12
the pull-in limit position. The proposed model also measures up to numerical results obtained from different distributed models while using lower computing efforts.
2. Lumped Model
A real actuator electrode system has two constraints: the fixed side of the upper beam has to hold both zero-angle and zero-displacement constraints. However, a lumped model takes only the first constraint into account for the sake of simplicity. As a result, the top beam moves vertically down as a whole structure, like a piston, whenever an electric potential difference is employed between the top and the bottom electrodes in the model. The top beam will return to its rest position owing to the restoring force of the bended beam as the potential difference is removed. This force is sometimes called as spring force, as well. The lumped model can be seen in Figure 2.
L
VF
F
e
s
Initial Position
δ
Figure 2. Sketch of the lumped model for a cantilever actuator.
Figure 2 shows that zero-displacement constraint is neglected and, merely, the zero-angle constraint is reckoned in the lumped model. The model is quite simple to calculate the pull-in limit. Consequently, computations are simple and the pull-in limit can be calculated in a couple of steps as one-third of the original spacing between electrodes (g/3) [30]. However, by using software packages like COMSOL (Comsol, Inc., Burlington, MA, USA) and ANSYS (Ansys, Inc., Canonsburg, PA, USA), which utilize FEM, pull-in limit can be found as around 44% of the initial spacing. That value is in accord with the previous experimental studies [26,27]. Table 1 indicates certain simulation outcomes for various gaps between two electrodes for 2-D modeling. Results from these studies dictates that the lumped model is not suitable for a decent estimation of the cantilever system.
Table 1. ANSYS and COMSOL simulation of pull-in outcomes for a cantilever with L = 300 µm.
Initial Gap (µm) ANSYS
Pull-in Gap (µm) ANSYS
Pull-in Gap/Initial Gap COMSOL
Pull-in Gap (µm) COMSOL
Pull-in Gap/Initial Gap 2 0.881 0.4405 0.884 0.4420 4 1.761 0.4403 1.769 0.4422 5 2.202 0.4404 2.212 0.4424 10 4.403 0.4403 4.424 0.4424 20 8.809 0.4405 8.848 0.4424
Width, thickness, and material properties of cantilever do not affect the pull-in limit. They affect only the applied voltage to reach the pull-in limit (pull-in voltage).
3. Pivot Model
Even though distributed models give a satisfying approximation of a cantilever actuator, they require more computing power. On the other hand, the lumped model simplifies the analytical calculations but fails to represent the system decently. We propose a new model named as the pivot
Figure 2. Sketch of the lumped model for a cantilever actuator.
Figure 2 shows that zero-displacement constraint is neglected and, merely, the zero-angleconstraint is reckoned in the lumped model. The model is quite simple to calculate the pull-in limit.Consequently, computations are simple and the pull-in limit can be calculated in a couple of steps asone-third of the original spacing between electrodes (g/3) [30]. However, by using software packageslike COMSOL (Comsol, Inc., Burlington, MA, USA) and ANSYS (Ansys, Inc., Canonsburg, PA, USA),which utilize FEM, pull-in limit can be found as around 44% of the initial spacing. That value is inaccord with the previous experimental studies [26,27]. Table 1 indicates certain simulation outcomesfor various gaps between two electrodes for 2-D modeling. Results from these studies dictates that thelumped model is not suitable for a decent estimation of the cantilever system.
Table 1. ANSYS and COMSOL simulation of pull-in outcomes for a cantilever with L = 300 µm.
Initial Gap (µm) ANSYSPull-In Gap (µm)
ANSYSPull-In Gap/Initial Gap
COMSOLPull-In Gap (µm)
COMSOLPull-In Gap/Initial Gap
2 0.881 0.4405 0.884 0.44204 1.761 0.4403 1.769 0.44225 2.202 0.4404 2.212 0.4424
10 4.403 0.4403 4.424 0.442420 8.809 0.4405 8.848 0.4424
Width, thickness, and material properties of cantilever do not affect the pull-in limit. They affect only theapplied voltage to reach the pull-in limit (pull-in voltage).
3. Pivot Model
Even though distributed models give a satisfying approximation of a cantilever actuator, theyrequire more computing power. On the other hand, the lumped model simplifies the analyticalcalculations but fails to represent the system decently. We propose a new model named as the pivot

Micromachines 2016, 7, 53 4 of 12
model in order to get a good estimation of the system without requiring substantial computing power.In the proposed model, one end of the top beam is pivoted, so it is fixed to its original position, andthe opposite end is entirely free to rotate linearly around this fixed pivoted end. Consequently, thetop electrode was presumed as a non-flexible stick, like a rigid body. The non-bendable movementof top electrode can be examined clearly in Figure 3. These are reasonable assumptions when smallangle bending is considered. The gap, g, between the electrodes is very small when compared to thelength of electrodes, L, for a typical cantilever actuator structure used for extensively-preferred MEMSdevices. Hereby, it is also reasonable to presume that δ << L.
Micromachines 2016, 7, 53 4 of 12
model in order to get a good estimation of the system without requiring substantial computing power. In the proposed model, one end of the top beam is pivoted, so it is fixed to its original position, and the opposite end is entirely free to rotate linearly around this fixed pivoted end. Consequently, the top electrode was presumed as a non-flexible stick, like a rigid body. The non-bendable movement of top electrode can be examined clearly in Figure 3. These are reasonable assumptions when small angle bending is considered. The gap, g, between the electrodes is very small when compared to the length of electrodes, L, for a typical cantilever actuator structure used for extensively-preferred MEMS devices. Hereby, it is also reasonable to presume that δ << L.
L
V
δ
Pivot
Cg
Figure 3. Pivot model for a cantilever actuator (not scaled).
Previously, we studied bisection model before the pivot model [31,32]. The model was dividing the top beam into two sections. The first section was free to rotate linearly around a point, named as the pivot, whose location was chosen by a trial and error method, and the second section was not moving at all and fastened to the fixed end. It was very successful, like the pivot model, when compared to simulation outcomes and earlier experimental results carried out by other researchers. However, that model was a little bit complex when compared to the current model.
We also proposed an inversely-designed model for fixed-fixed electrostatic actuators [33]. In this case, the structure was divided into three sections symmetrically by four pivot points, two of them are at the ends of the upper electrode and the other two were chosen by a trial and error method again. The model can estimate the pull-in limit position successfully and percentage errors of the model are within 2% when compared with simulation results.
The pivot model gives not only a simple analytical model but also a very good approximation of a cantilever system. There is no displacement at the pivoted side of the upper electrode. Thus, the model only takes the zero-displacement constraint into account and omits the zero-angle constraint. In this instance, calculations are a little arduous, yet straightforward. Fringing field capacitances due to beam width and beam thickness are not included, and only the parallel plate capacitance value is considered in the model for the sake of simplicity. Hence, for a δ displacement from the rest position of the upper electrode, capacitor value of the system can be computed as:
εδ δ
= −
0wL gC lng
(1)
where ε0 and w are permittivity of free space and width of the cantilever, respectively. Details of the capacitance calculation can be found in [31,32]. So, the electrostatic force becomes:
( )
( )
−+ −
= −
20
22e
gg lngwLV
Fg
δδ δε
δ δ (2)
However, this force term gives the total electrostatic force which is distributed and non-uniform throughout the upper electrode surface. It is very troublesome to demonstrate it in a plain formula.
Figure 3. Pivot model for a cantilever actuator (not scaled).
Previously, we studied bisection model before the pivot model [31,32]. The model was dividingthe top beam into two sections. The first section was free to rotate linearly around a point, named as thepivot, whose location was chosen by a trial and error method, and the second section was not movingat all and fastened to the fixed end. It was very successful, like the pivot model, when compared tosimulation outcomes and earlier experimental results carried out by other researchers. However, thatmodel was a little bit complex when compared to the current model.
We also proposed an inversely-designed model for fixed-fixed electrostatic actuators [33]. In thiscase, the structure was divided into three sections symmetrically by four pivot points, two of them areat the ends of the upper electrode and the other two were chosen by a trial and error method again.The model can estimate the pull-in limit position successfully and percentage errors of the model arewithin 2% when compared with simulation results.
The pivot model gives not only a simple analytical model but also a very good approximation ofa cantilever system. There is no displacement at the pivoted side of the upper electrode. Thus, themodel only takes the zero-displacement constraint into account and omits the zero-angle constraint.In this instance, calculations are a little arduous, yet straightforward. Fringing field capacitances dueto beam width and beam thickness are not included, and only the parallel plate capacitance value isconsidered in the model for the sake of simplicity. Hence, for a δ displacement from the rest position ofthe upper electrode, capacitor value of the system can be computed as:
C “ε0wL
δlnˆ
gg´ δ
˙
(1)
where ε0 and w are permittivity of free space and width of the cantilever, respectively. Details of thecapacitance calculation can be found in [31,32]. So, the electrostatic force becomes:
Fe “ε0wLV2
2
»
—
—
–
δ` pg´ δq lnˆ
g´ δ
g
˙
δ2 pg´ δq
fi
ffi
ffi
fl
(2)
However, this force term gives the total electrostatic force which is distributed and non-uniformthroughout the upper electrode surface. It is very troublesome to demonstrate it in a plain formula.

Micromachines 2016, 7, 53 5 of 12
Hence, it can be replaced with a representative equivalent single-force term. In order to find theposition of the pull-in limit, the representative equivalent single-force term can be temporarily locatedat a random point, initially, since the location of the force will not shift the pull-in limit position.Consequently, both electrostatic and restoring force terms were placed arbitrarily, like in Figure 4.
Micromachines 2016, 7, 53 5 of 12
Hence, it can be replaced with a representative equivalent single-force term. In order to find the position of the pull-in limit, the representative equivalent single-force term can be temporarily located at a random point, initially, since the location of the force will not shift the pull-in limit position. Consequently, both electrostatic and restoring force terms were placed arbitrarily, like in Figure 4.
L
VF
F
e
s
L2
δδ2
Pivot
Figure 4. Representative equivalent forces were sited arbitrarily.
Their exact locations are going to be calculated in later steps to establish a relation between the voltage difference and the maximum displacement of the upper electrode. The restoring force is:
δ=
2sF k
(3)
where k is elastic constant of the spring and δ is the displacement of the free tip of upper electrode. Since the system is at equilibrium, the overall moment has to be zero around the pivot point. Thus, for small-angle approximation, it can be written by using Equations (2) and (3) as:
( )
( )
δ δδδ ε
δ δ
− − − = −
20 22
gln gg
k wL Vg
(4)
and potential difference term can be get from Equation (4) as:
( )
( )
− = − − −
12
3
02
k gV
gwL ln gg
δ δ
ε δ δδ
(5)
The position is named as the pull-in limit and can be found when the derivative of the potential difference is taken with respect to δ and is equated to zero [21]. The upper electrode will collapse towards onto bottom electrode after this point. Therefore:
Figure 4. Representative equivalent forces were sited arbitrarily.
Their exact locations are going to be calculated in later steps to establish a relation between thevoltage difference and the maximum displacement of the upper electrode. The restoring force is:
Fs “δ
2k (3)
where k is elastic constant of the spring and δ is the displacement of the free tip of upper electrode.Since the system is at equilibrium, the overall moment has to be zero around the pivot point. Thus, forsmall-angle approximation, it can be written by using Equations (2) and (3) as:
δ
2k “ ε0wL
»
—
—
–
δ´ lnˆ
gg´ δ
˙
pg´ δq
δ2 pg´ δq
fi
ffi
ffi
fl
V2 (4)
and potential difference term can be get from Equation (4) as:
V “
»
—
—
–
kδ3 pg´ δq
2ε0wLˆ
δ´ lnˆ
gg´ δ
˙
pg´ δq
˙
fi
ffi
ffi
fl
12
(5)
The position is named as the pull-in limit and can be found when the derivative of the potentialdifference is taken with respect to δ and is equated to zero [21]. The upper electrode will collapsetowards onto bottom electrode after this point. Therefore:
dVdδ“ ´
d
kδ
2ε0wL pg´ δq
»
—
—
—
—
—
—
–
4δ2 ´ 3gδ``
3δ2 ´ 6gδ` 3g2˘ lnˆ
gg´ δ
˙
„
δ´ lnˆ
gg´ δ
˙
pg´ δq
32
fi
ffi
ffi
ffi
ffi
ffi
ffi
fl
“ 0 (6)
Micromachines 2016, 7, 53 6 of 12
Getting an analytical solution to Equation (6) is inconvenient. Hence, a computational numericalsolution has been achieved as:
δMAX “ 0.4404g (7)
This outcome is well-matched to the measured values given in an experimental study [26] andfrom ANSYS and COMSOL simulations which are shown in Table 1.
If we chose the system forces at different locations at the beginning, we would have exactly thesame result since only the term in square root would be changed which is not affecting the root ofEquation (6). Although arbitrary positioning of the system forces gives us a correct value of the pull-inlimit, it cannot establish any relation between the displacement and the voltage difference between theelectrodes. Thus, the system forces have to be emplaced at their exact locations.
4. Positioning the Forces
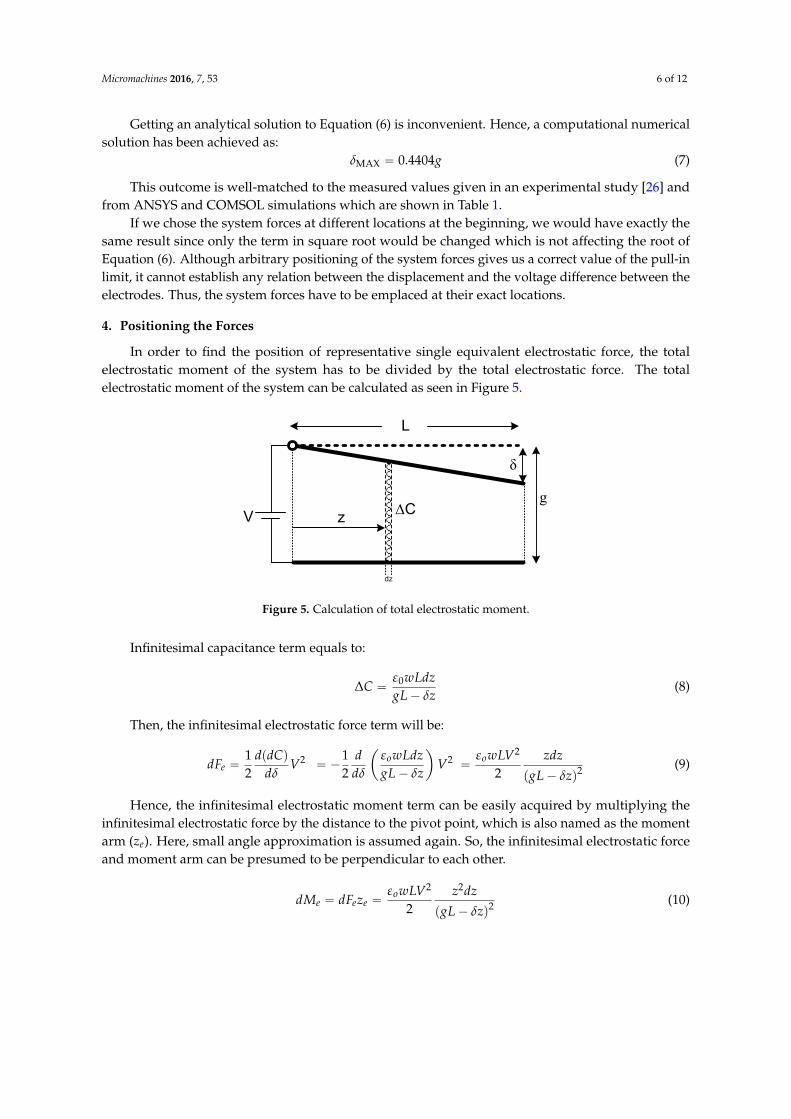
In order to find the position of representative single equivalent electrostatic force, the totalelectrostatic moment of the system has to be divided by the total electrostatic force. The totalelectrostatic moment of the system can be calculated as seen in Figure 5.
Micromachines 2016, 7, 53 6 of 12
( )( )
( )
δ δ δ δδδ
δ ε δδ δ
δ
− + − + − = − =
− − − −
2 2 2
30 2
4 3 3 6 30
2
gg g g lngdV k
d wL ggln g
g
(6)
Getting an analytical solution to Equation (6) is inconvenient. Hence, a computational numerical solution has been achieved as:
δ =MAX 0.4404g (7)
This outcome is well-matched to the measured values given in an experimental study [26] and from ANSYS and COMSOL simulations which are shown in Table 1.
If we chose the system forces at different locations at the beginning, we would have exactly the same result since only the term in square root would be changed which is not affecting the root of Equation (6). Although arbitrary positioning of the system forces gives us a correct value of the pull-in limit, it cannot establish any relation between the displacement and the voltage difference between the electrodes. Thus, the system forces have to be emplaced at their exact locations.
4. Positioning the Forces
In order to find the position of representative single equivalent electrostatic force, the total electrostatic moment of the system has to be divided by the total electrostatic force. The total electrostatic moment of the system can be calculated as seen in Figure 5.
L
V ∆C
δ
dz
zg
Figure 5. Calculation of total electrostatic moment.
Infinitesimal capacitance term equals to:
∆ =−
0wLdzC
gL zε
δ (8)
Then, the infinitesimal electrostatic force term will be:
( )
= = − = − −
22 2
2
1 ( ) 1 2 2 2
o oe
wLdz wLVd dC d zdzdF V Vd d gL z gL z
ε εδ δ δ δ
(9)
Hence, the infinitesimal electrostatic moment term can be easily acquired by multiplying the infinitesimal electrostatic force by the distance to the pivot point, which is also named as the moment arm (ze). Here, small angle approximation is assumed again. So, the infinitesimal electrostatic force and moment arm can be presumed to be perpendicular to each other.
Figure 5. Calculation of total electrostatic moment.
Infinitesimal capacitance term equals to:
∆C “ε0wLdzgL´ δz
(8)
Then, the infinitesimal electrostatic force term will be:
dFe “12
dpdCqdδ
V2 “ ´12
ddδ
ˆ
εowLdzgL´ δz
˙
V2 “εowLV2
2zdz
pgL´ δzq2(9)
Hence, the infinitesimal electrostatic moment term can be easily acquired by multiplying theinfinitesimal electrostatic force by the distance to the pivot point, which is also named as the momentarm (ze). Here, small angle approximation is assumed again. So, the infinitesimal electrostatic forceand moment arm can be presumed to be perpendicular to each other.
dMe “ dFeze “εowLV2
2z2dz
pgL´ δzq2(10)

Micromachines 2016, 7, 53 7 of 12
In order to calculate total electrostatic moment of the structure, one needs to take the integralthrough the whole length of the upper beam:
Me “εowLV2
2
Lż
z“0
z2dzpgL´ δzq2
“εowL2V2
2
»
—
—
–
2gδ´ δ2 ` 2g pg´ δq lnˆ
g´ δ
g
˙
δ3 pg´ δq
fi
ffi
ffi
fl
(11)
The total distributed electrostatic moment was calculated from distributed electrostatic forceterms. When a distributed electrostatic force term is replaced by a representative equivalent singleforce term, the total moment can also be written as:
Me “ Feze (12)
where ze is the position of replacement of single electrostatic force Fe. When Equations (11) and (12)are solved simultaneously, we get:
ze “
L„
2gδ´ δ2 ` 2g pg´ δq lnˆ
g´ δ
g
˙
δ
„
δ` pg´ δq lnˆ
g´ δ
g
˙ (13)
At the pull-in limit case, δ = 0.4404g. When δ is substituted in Equation (13), ze can be obtained via:
ze “ 0.73L (14)
The stiffness restoring force is, similarly, a distributed force. Likewise, it can be replaced with asingle equivalent restoring force, as well. By using a small angle assumption, the spring force term canbe found via:
Fs “ kδ (15)
where k is stiffness constant which can be obtained for a cantilever beam as [34]:
k “23
Ewˆ
tL
˙3(16)
Since the cantilever actuator is at equilibrium, net torque about the pivot point has to be zero.Therefore, the electrostatic moment term has to be equal to restoring term.
zsFs “ 0.73LFe (17)
where zs is the position of replacement single restoring force. Thus, the location of single equivalentrestoring force can be found numerically:
zs “ 0.62L (18)
Final semblance of the pivot model can be seen in Figure 6 with representative equivalent forceswere put to their exact places. At the beginning of the model, these forces were placed intuitively.Therefore, it could not establish a good connection between the displacement of the free-end of theupper electrode and the applied voltage since the locations of the forces were not exact.
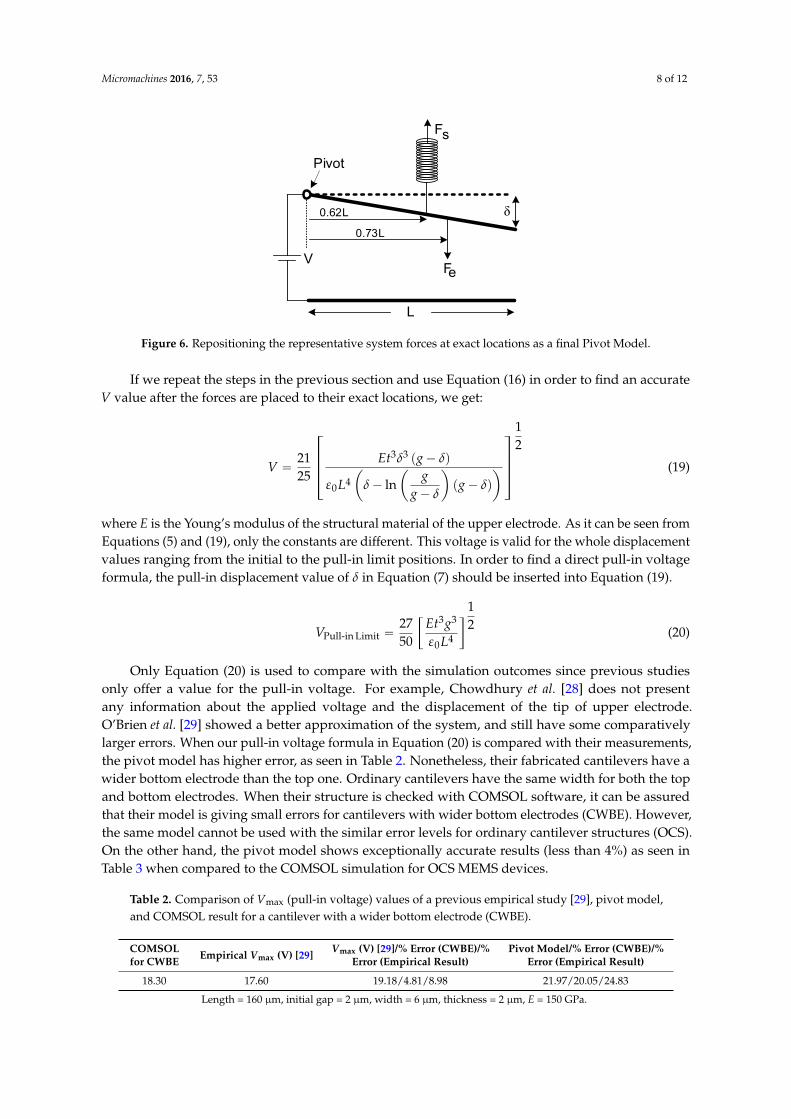
Micromachines 2016, 7, 53 8 of 12Micromachines 2016, 7, 53 8 of 12
L
V
Fs
0.62L δ
Pivot
Fe
0.73L
Figure 6. Repositioning the representative system forces at exact locations as a final Pivot Model.
If we repeat the steps in the previous section and use Equation (16) in order to find an accurate V value after the forces are placed to their exact locations, we get:
( )
( )
12
3 3
40
2125
Et gV
gL ln gg
ε
δ δ
δ δδ
− = − − −
(19)
where E is the Young’s modulus of the structural material of the upper electrode. As it can be seen from Equations (5) and (19), only the constants are different. This voltage is valid for the whole displacement values ranging from the initial to the pull-in limit positions. In order to find a direct pull-in voltage formula, the pull-in displacement value of δ in Equation (7) should be inserted into Equation (19).
ε
=
13 2
Pull-in Lim
3
it 4050
27 ELgt
V (20)
Only Equation (20) is used to compare with the simulation outcomes since previous studies only offer a value for the pull-in voltage. For example, Chowdhury et al. [28] does not present any information about the applied voltage and the displacement of the tip of upper electrode. O’Brien et al. [29] showed a better approximation of the system, and still have some comparatively larger errors. When our pull-in voltage formula in Equation (20) is compared with their measurements, the pivot model has higher error, as seen in Table 2. Nonetheless, their fabricated cantilevers have a wider bottom electrode than the top one. Ordinary cantilevers have the same width for both the top and bottom electrodes. When their structure is checked with COMSOL software, it can be assured that their model is giving small errors for cantilevers with wider bottom electrodes (CWBE). However, the same model cannot be used with the similar error levels for ordinary cantilever structures (OCS). On the other hand, the pivot model shows exceptionally accurate results (less than 4%) as seen in Table 3 when compared to the COMSOL simulation for OCS MEMS devices.
Table 2. Comparison of Vmax (pull-in voltage) values of a previous empirical study [29], pivot model, and COMSOL result for a cantilever with a wider bottom electrode (CWBE).
COMSOL for CWBE Empirical Vmax (V) [29]
Vmax (V) [29]/% Error (CWBE)/ %Error (Empirical Result)
Pivot Model/% Error (CWBE)/ %Error (Empirical Result)
18.30 17.60 19.18/4.81/8.98 21.97/20.05/24.83 Length = 160 µm, initial gap = 2 µm, width = 6 µm, thickness = 2 µm, E = 150 GPa.
Figure 6. Repositioning the representative system forces at exact locations as a final Pivot Model.
If we repeat the steps in the previous section and use Equation (16) in order to find an accurateV value after the forces are placed to their exact locations, we get:
V “2125
»
—
—
–
Et3δ3 pg´ δq
ε0L4ˆ
δ´ lnˆ
gg´ δ
˙
pg´ δq
˙
fi
ffi
ffi
fl
12
(19)
where E is the Young’s modulus of the structural material of the upper electrode. As it can be seen fromEquations (5) and (19), only the constants are different. This voltage is valid for the whole displacementvalues ranging from the initial to the pull-in limit positions. In order to find a direct pull-in voltageformula, the pull-in displacement value of δ in Equation (7) should be inserted into Equation (19).
VPull-in Limit “2750
„
Et3g3
ε0L4
12 (20)
Only Equation (20) is used to compare with the simulation outcomes since previous studiesonly offer a value for the pull-in voltage. For example, Chowdhury et al. [28] does not presentany information about the applied voltage and the displacement of the tip of upper electrode.O’Brien et al. [29] showed a better approximation of the system, and still have some comparativelylarger errors. When our pull-in voltage formula in Equation (20) is compared with their measurements,the pivot model has higher error, as seen in Table 2. Nonetheless, their fabricated cantilevers have awider bottom electrode than the top one. Ordinary cantilevers have the same width for both the topand bottom electrodes. When their structure is checked with COMSOL software, it can be assuredthat their model is giving small errors for cantilevers with wider bottom electrodes (CWBE). However,the same model cannot be used with the similar error levels for ordinary cantilever structures (OCS).On the other hand, the pivot model shows exceptionally accurate results (less than 4%) as seen inTable 3 when compared to the COMSOL simulation for OCS MEMS devices.
Table 2. Comparison of Vmax (pull-in voltage) values of a previous empirical study [29], pivot model,and COMSOL result for a cantilever with a wider bottom electrode (CWBE).
COMSOLfor CWBE Empirical Vmax (V) [29] Vmax (V) [29]/% Error (CWBE)/%
Error (Empirical Result)Pivot Model/% Error (CWBE)/%
Error (Empirical Result)
18.30 17.60 19.18/4.81/8.98 21.97/20.05/24.83
Length = 160 µm, initial gap = 2 µm, width = 6 µm, thickness = 2 µm, E = 150 GPa.

Micromachines 2016, 7, 53 9 of 12
Table 3. Comparison of Vmax (pull-in voltage) values of a previous empirical study [29], pivot model,and COMSOL result for an Ordinary Cantilever Structure (OCS).
COMSOL Vmax (V) [29]/% Error Pivot Model/% Error
21.17 19.18/9.40 21.97/3.78
Length = 160 µm, initial gap = 2 µm, width = 6 µm, thickness = 2 µm, E = 150 GPa.
It can be easily seen from Tables 2 and 3 that their empirical result is compatible with the CWBEsimulation rather than OCS simulation outcome since they fabricated the cantilevers with a widerbottom electrode structure. Since the bottom electrode is very wide, a fringing effect plays an importantrole in getting a smaller pull-in voltage value when compared with OCS.
Polysilicon is the material typically used for manufacturing micro-fabricated devices due to itsease of fabrication and good performance on micro-devices [35,36]. The average value of Young’smodulus of polysilicon which is deposited by low pressure chemical vapor deposition (LPCVD)method was measured as 170 GPa [37] and this value is used in all simulations demonstrated in thispaper, except in Tables 2 and 3.
Tables 4 and 5 demonstrate the comparison of ANSYS and COMSOL simulation outcomes andresults calculated from the pivot model (from Equation (19)) and percentage errors. All percentageerrors are less than 3.5% when compared with both ANSYS and COMSOL results.
Table 4. Comparison of Vmax (pull-in voltage) values for various lengths.
CantileverLength (µm)
Vmax (V)Pivot Model
Vmax (V)(ANSYS)
% Error of the Modelwith Respect to ANSYS
Vmax (V)(COMSOL)
% Error of the Modelwith Respectto COMSOL
150 26.619 27.341 2.712 27.070 1.694200 14.973 15.418 2.972 15.240 1.783250 9.583 9.899 3.298 9.760 1.847300 6.655 6.828 2.600 6.780 1.878400 3.743 3.860 3.126 3.820 2.057500 2.396 2.472 3.172 2.450 2.254
Initial Gap = 2 µm, width = 50 µm, thickness = 2 µm, E = 170 GPa.
Table 5. Applied voltage differences for various displacements of the free-end of the upper electrode.
Displacement(µm) and (δ/g)
Voltage (V)Pivot Model
Voltage (V)(ANSYS)
% Error of theModel with
Respect to ANSYS
Voltage (V)(COMSOL)
% Error of theModel with Respect
to COMSOL
0.05829 (2.91%) 9.797 10.0 2.075 9.85 0.5440.1386 (6.93%) 14.689 15.0 2.119 14.78 0.621
0.2714 (13.57%) 19.574 20.0 2.178 19.72 0.7470.5165 (25.83%) 24.431 25.0 2.328 24.68 1.0180.6028 (30.14%) 25.387 26.0 2.414 25.70 1.2330.7419 (37.10%) 26.324 27.0 2.566 26.69 1.3890.7654 (38.27%) 26.417 27.1 2.586 26.80 1.4500.7963 (39.82%) 26.512 27.2 2.597 26.91 1.5030.8146 (40.73%) 26.553 27.25 2.624 26.97 1.5690.8808 (44.04%) 26.619 27.341 2.712 27.07 1.694
Length = 150 µm, initial gap = 2 µm, width = 50 µm, thickness = 2 µm, E = 170 GPa.
Table 6 shows comparison of previous experimental results, distributed model results [26,27],pivot model outcomes, and percent errors, with respect to previous experimental measurements.Percentage errors gets even better (less than 2%) for real measurements. They also reported that thepull-in voltage is at a level of 68.5 V. When Equation (20) is used, that value can be found as 68.1 V,which is a remarkably close value with an error of 0.6%. Since the pivot model is utilized at the pull-inlimit case, the percentage error becomes smaller when getting closer to the pull-in limit which can
Micromachines 2016, 7, 53 10 of 12
be evidently seen in Table 6. To make the comparison more clear, ANSYS simulation outcomes arealso appended.
Table 6. Comparison of end gap displacement for different voltage values.
Voltage (V) Experimental(µm) [26]
Distributed Model(µm) [26]/(Error)
GDQM (µm)[27]/(Error)
Pivot Model(µm)/(Error) ANSYS (µm)
20 90.5 90.2/(0.3%) 90.2/(0.3%) 90.3/(0.2%) 90.440 84.6 84.3/(0.4%) 84.1/(0.6%) 84.7/(0.1%) 85.160 70.0 71.5/(2.1%) 69.1/(1.3%) 71.3/(1.9%) 73.265 64.0 67.2/(5.0%) 59.6/(6.9%) 64.1/(0.2%) 67.667 59.0 65.0/(10.2%) - 59.1/(0.2%) 64.5
Errors are with respect to experimental results. E = 156 GPa, L = 20 mm, w = 5 mm, t = 57 µm, g = 92 µm.
5. Discussion and Conclusions
In this work, a model which gives the pull-in limit displacement for a cantilever actuator around 44%of the initial gap is presented. It achieves a significant consistency with results from software (ANSYSand COMSOL) simulations, distributed model [26], and previous experimental measurements [26,27]. Inaddition, the proposed model demonstrates a good connection between the voltage difference and thedisplacements extent from the initial to the pull-in limit positions. This is a contribution where someprevious studies [28,29] lack. The pivot model delivers values which are conformable to those computedfrom FEM software (ANSYS and COMSOL) simulations. All of the percentage errors are within 4%, thelargest percentage error is 3.78% and it can be seen in Table 3. When compared with lumped model, pivotmodel delivers an improved value for the pull-in limit. Additionally, in comparison to former distributedmodels which give relatively small errors with more computational power, the pivot model delivers anuncomplicated formula which gives small errors with a little computational capacity. Furthermore, themodel gives satisfying estimations for the applied voltage for desired displacements. When compared toprevious experimental measurement results, the pivot model can be found to be substantially successful,as well. Percentage errors of the pivot model are comparable when the displacement is close to therest position, and delivers even better results when the displacement comes closer to the pull-in limit.The most prominent advantage of the pivot model is delivering a satisfying estimation of the systemwith a simple formula. Demanded voltage difference for both desired displacement and pull-in limitposition can be calculated effortlessly rather than utilizing numerical distributed methods, which aretime consuming and require more computing power.
Although the pivot model is remarkably accurate, particularly around the pull-in limit position,it has some limitations since it neglects some physical constraints for the sake of getting an effortlessformula. Firstly, the fringing effect was not taken into account in the proposed model. If two parallelplates forming a capacitor, like in the cantilever case, the electric field does not end abruptly at theboundary of the beams. There are some fields outside the electrodes that curve from one beam to theother and this induces the real capacitance to be different than what it is calculated ideally.
Secondly, the model also assumes that the upper beam is a rigid body. Hence, the length of theelectrode is constant and non-bending even at the boundary of the pull-in limit position. Therefore,it also assumes that the formation of both transverse and axial stresses would not be possible even inthe full bending situation.
Thirdly, the formula is successful for exclusively-long electrodes where (L ě 5w) since the modelignores the shear stress near the fixed end of the upper electrode. In addition, the model is successfulfor wide beams (w ě 5t) [28,38]. This can be clearly seen in Tables 4 and 5.
Fourthly, the formula delivers very small errors for the ordinary cantilever structures (OCS) whichhave matching top and bottom electrode dimensions. However, it is not successful for cantilevers withwider bottom electrodes (CWBE).
Lastly, the model disregards any atmospheric loading on the upper beam. Hence, the cantileveroperates in vacuum.
Micromachines 2016, 7, 53 11 of 12
Acknowledgments: Authors would like to thank Ahmet Naci Mete for his helpful feedback during the preparationof this manuscript.
Author Contributions: C.A. and A.Y. conceived and designed the analytical model together; C.A. performed thesimulations, prepared most of the data; C.A. and A.Y. analyzed the data; A.Y. wrote the paper; C.A. contributed towriting the paper. Both authors are responsible for the concept of the paper, all the results presented and scientificaspects. The authors have read and approved the final published manuscript.
Conflicts of Interest: The authors declare no conflict of interest.
References
1. Wang, Y.-T.; Hu, T.-C.; Tong, C.-J.; Lin, M.-T. Novel full range vacuum pressure sensing technique usingfree decay of trapezoid micro-cantilever beam deflected by electrostatic force. Microsyst. Technol. 2012, 18,1903–1908. [CrossRef]
2. Lindley, R.E.; Parkes, A.M.; Keen, K.A.; Mcnaghten, E.D.; Orr-Ewing, A.J. A sensitivity comparison of threephotoacoustic cells containing a single microphone, a differential dual microphone or a cantilever pressuresensor. Appl. Phys. B 2007, 86, 707–713. [CrossRef]
3. Lee, H.-C.; Park, J.-H.; Park, Y.-H. Development of shunt type ohmic RF MEMS switches actuated bypiezoelectric cantilever. Sens. Actuators A Phys. 2007, 136, 282–290. [CrossRef]
4. Zhang, Y.-H.; Ding, G.; Shun, X.; Gu, D.; Cai, B.; Lai, Z. Preparing of a high speed bistable electromagneticRF MEMS switch. Sens. Actuators A Phys. 2007, 134, 532–537. [CrossRef]
5. Hah, D.; Yoon, E. A Low-Voltage Actuated Micromachined Microwave Switch Using Torsion Springs andLeverage. IEEE Trans. Microw. Theory Technol. 2000, 48, 2540–2545.
6. Chang, C.; Chang, P. Innovative micromachined microwave switch with very low insertion loss.Sens. Actuators A Phys. 2000, 79, 71–75. [CrossRef]
7. Ozaki, Y.; Ohyama, T.; Yasuda, T.; Shimoyama, I. An Air Flow Sensor Modeled on Wind Receptor Hairs ofInsects. In Proceedings of the 13th Annual International Conference on Micro Electro Mechanical Systems,Miyazaki, Japan, 23–27 January 2000; pp. 531–536.
8. Wang, Y.-H.; Lee, C.-Y. A MEMS-based air flow sensor with a free-standing micro-cantilever structure.Sensors 2007, 7, 2389–2401. [CrossRef]
9. Barth, S.; Koch, H.; Kittel, A.; Peinke, J.; Burgold, J.; Wurnus, H. Laser-Cantilever-Anemometer: A new highresolution sensor for air and liquid flow. Rev. Sci. Instrum. 2005, 76, 75110–75116. [CrossRef]
10. Kamusuki, S.; Fujii, M.; Takekoshi, T.; Tezuka, C.; Atobe, M. A high resolution, electrostatically-drivencommercial inkjet head. In Proceedings of the 13th Annual International Conference on Micro ElectroMechanical Systems, Miyazaki, Japan, 23–27 January 2000; pp. 793–798.
11. Bietsch, A.; Zhang, J.; Hegner, M.; Lang, H.P.; Gerber, C. Rapid functionalization of cantilever array sensorsby inkjet printing. Nanotechnology 2004, 15, 873–780. [CrossRef]
12. Kaisei, K.; Kobayashi, K.; Matsushige, K.; Yamada, H. Fabrication of ionic liquid thin film by nano-inkjetprinting method using atomic force microscope cantilever tip. Ultramicroscopy 2010, 110, 733–736. [CrossRef][PubMed]
13. Rogers, B.; Manning, L.; Jones, M.; Sulchek, T.; Murray, K.; Beneschott, B.; Adams, J.D.; Hu, Z.; Thundat, T.;Cavazos, H.; et al. Mercury vapor detection with a self-sensing, resonating piezoelectric cantilever.Rev. Sci. Instrum. 2003, 74, 4899–4901. [CrossRef]
14. Lavrik, N.V.; Sepaniak, M.J.; Datskos, P.G. Cantilever transducers as a platform for chemical and biologicalsensors. Rev. Sci. Instrum. 2004, 75, 2229–2251. [CrossRef]
15. Sharma, H.; Mutharasan, R. Rapid and sensitive immune detection of Listeria monocytogenes in milk usinga novel piezoelectric cantilever sensor. Biosens. Bioelectron. 2013, 45, 158–162. [CrossRef] [PubMed]
16. Saadon, S.B.; Sidek, O.B.; Hamad, O.S. Vibration-based MEMS piezoelectric energy harvesters usingcantilever beams. Optoelectron. Adv. Mater. Rapid Commun. 2010, 4, 1219–1224.
17. Shen, D.; Park, J.-H.; Ajitsaria, J.; Choe, S.-Y.; Wikle III, H.C.; Kim, D.J. The design, fabrication andevaluation of a MEMS PZT cantilever with an integrated Si proof mass for vibration energy harvesting.J. Micromech. Microeng. 2008, 18, 55017. [CrossRef]
18. Yu, H.; Zhou, J.; Deng, L.; Wen, Z. A Vibration-Based MEMS Piezoelectric Energy Harvester and PowerConditioning Circuit. Sensors 2014, 14, 3323–3341. [CrossRef] [PubMed]
Micromachines 2016, 7, 53 12 of 12
19. Dequesnes, M.; Rotkin, S.V.; Aluru, N.R. Calculation of pull-in voltages for carbon-nanotube-basednanoelectromechanical swithes. Nanotechnology 2002, 13, 120–131. [CrossRef]
20. Seeger, J.I.; Boser, B.E. Dynamics and Control of Parallel-Plate Actuators Beyond the Electrostatic Instability.In Proceedings of the 10th International Conference on Solid-State Sensors and Actuators, Sendai, Japan, 7–9June 1999; pp. 474–477.
21. Nielson, G.N.; Barbastathis, G. Dynamic Pull-in of Parallel-Plate and Torsional Electrostatic MEMS Actuators.J. Microelectromech. Syst. 2006, 15, 811–821. [CrossRef]
22. Pamidighantam, S.; Puers, R.; Baert, K.; Tilmans, H.A. Pull-in voltage analysis of electrostatically actuatedbeam structures with fixed–fixed and fixed–free end conditions. J. Micromech. Microeng. 2002, 12, 458–464.[CrossRef]
23. Mol, L.; Rocha, L.A.; Cretu, E.; Wolffenbuttel, R.F. Full-Gap Positioning of Parallel-Plate Electrostatic MEMSUsing On-Off Control. In Proceedings of the IEEE International Symposium on Industrial Electronics, Vigo,Spain, 4–7 June 2007; pp. 1464–1468.
24. Chowdhury, S.; Ahmadi, M.; Miller, W.C. Pull-in Voltage Study of Electrostatically Actuated Fixed-FixedBeams Using a VLSI On-Chip Interconnect Capacitance Model. J. Microelectromech. Syst. 2006, 15, 639–651.[CrossRef]
25. Owusu, K.O.; Lewis, F.L. Solving the Pull-in Instability Problem of Electrostatic Microactuators UsingNonlinear Control Techniques. In Proceedings of the 2nd IEEE International Conference on Nano/MicroEngineered and Molecular Systems, Bangkok, Thailand, 16–19 January 2007; pp. 1190–1195.
26. Hu, Y.C.; Chang, C.M.; Huang, S.C. Some design considerations on the electrostatically actuatedmicrostructures. Sens. Actuators A Phys. 2004, 112, 155–161. [CrossRef]
27. Sadeghian, H.; Rezazadeh, G.; Osterberg, P.M. Application of the Generalized Differential QuadratureMethod to the Study of Pull-in Phenomena of MEMs Switches. J. Microelectromech. Syst. 2007, 16, 1334–1340.[CrossRef]
28. Chowdhury, S.; Ahmadi, M.; Miller, W.C. A Closed-Form Model for the Pull-in Voltage of ElectrostaticallyActuated Cantilever Beams. J. Micromech. Microeng. 2005, 15, 756–763. [CrossRef]
29. O’Brien, G.J.; Monk, D.J.; Lin, L. MEMS Cantilever Beam Electrostatic Pull-in Model. Proc. SPIE 2001, 4593,31–34.
30. Nathanson, H.C.; Nevel, W.E.; Wickstrom, R.A.; Davis, J.R., Jr. The resonant gate transistor. IEEE Trans.Electron. Devices 1967, 14, 117–133. [CrossRef]
31. Yildiz, A.; Ak, C.; Canbolat, H. New Approach to Pull-In Limit and Position Control of Electrostatic CantileverWithin the Pull-in Limit. In Electrostatics; Canbolat, H., Ed.; Intech: Rijeka, Croatia, 2012; pp. 139–150.
32. Ak, C. Position Control of Electrostatic Actuators. Master’s Thesis, Mersin University, Mersin, Turkey, 2008.33. Ak, C.; Yildiz, A. An Inversely Designed Model for Calculating Pull-In Limit and Position of Electrostatic
Fixed-Fixed Beam Actuators. Math. Probl. Eng. 2014, 2014, 391942. [CrossRef]34. Saha, S.C.; Hanke, U.; Jensen, G.U.; Saether, T. Modeling of spring constant and pull-down voltage of
non-uniform RF MEMS cantilever. In Proceedings of the 2006 IEEE International Behavioral Modeling andSimulation Workshop, San Jose, CA, USA, 14–15 September 2006; pp. 56–60.
35. Ozdemir, S.; Akhtar, S.; Gunal, O.E.; Khater, M.E.; Saritas, R.; Abdel-Rahman, E.M.; Yavuz, M. Measuring theQuality Factor in MEMS Devices. Micromachines 2015, 6, 1935–1945. [CrossRef]
36. Palevicius, P.; Ragulskis, M.; Palevicius, A.; Ostasevicius, V. Applicability of Time-Averaged Holographyfor Micro-Electro-Mechanical System Performing Non-Linear Oscillations. Sensors 2014, 14, 1805–1821.[CrossRef] [PubMed]
37. Sharpe, W.N., Jr.; Yuan, B.; Vaidyanathan, R.; Edward, R.L. Measurements of Young’s modulus, Poisson’sratio, and tensile strength of polysilicon. In Proceedings of the 10th Annual International Workshop onMicro Electro Mechanical Systems, Nagoya, Japan, 26–30 January 1997; pp. 424–429.
38. Osterberg, P.M.; Senturia, S.D. M-Test: A Test Chip for MEMS Material Property Measurement UsingElectrostatically Actuated Test Structures. J. Microelectromech. Syst. 1997, 6, 107–118. [CrossRef]
© 2016 by the authors; licensee MDPI, Basel, Switzerland. This article is an open accessarticle distributed under the terms and conditions of the Creative Commons by Attribution(CC-BY) license (http://creativecommons.org/licenses/by/4.0/).