Embed Size (px)
Citation preview

277 Technology Parkway • Auburn, AL 36830
NCAT Report 92-05
A NATIONAL STUDY OF RUTTINGIN HOT MIX (HMA) PAVEMENTS
By
Elton R. BrownStephen A. Cross
February 1992
Paper presented at the 1992 Annual Meeting of the Association ofAsphalt Paving Technologists held in Charleston, SC (February1992)
A NATIONAL STUDY OF RUTTING IN HOT MIX ASPHALT (HMA)PAVEMENTS
By
Elton R. BrownDirector
National Center for Asphalt TechnologyAuburn University, Alabama
Stephen A. CrossUniversity of Kansas
NCAT Report 92-05
February 1992

i
DISCLAIMER
The contents of this report reflect the views of the authors who are solely responsible forthe facts and the accuracy of the data presented herein. The contents do not necessarily reflectthe official views and policies of the National Center for Asphalt Technology of AuburnUniversity. This report does not constitute a standard, specification, or regulation.
Brown & Cross
1
A NATIONAL STUDY OF RUTTING IN HOT MIX ASPHALT (HMA) PAVEMENTS
Elton R. Brown and Stephen A. Cross
INTRODUCTION
Background
In recent years several states have experienced an increase in the amount and severity ofpermanent deformation in their hot mix asphalt (HMA) pavements. This increase in permanentdeformation, or rutting, has been attributed to the increase in truck tire pressures, axle loads, andvolume of traffic.
The current 1986 AASHTO Guide for Design of Pavement Structures is based on 18,000 poundaxle loads and tire contact pressures of 75 to 80 psi. Recent studies (1, 2) have shown that trucktire inflation pressures have increased substantially above the 70 to 80 psi. Hudson and Seed (3)have shown truck tire pressures to be as high as 140 psi. In the past the quality of the HMA nearthe surface was sufficient to withstand the stresses induced by the lower tire pressures. However,the increase in tire pressures means that the HMA nearest the pavement surface is underincreasingly high stresses and is more susceptible to rutting. The best technology must be used indesigning and constructing these mixtures to insure that they resist the increased tire pressures.
Concern for rutting and high truck tire pressures led to a National Symposium on the subject in1987 (4). The conclusions drawn from this symposium were that the higher truck tire pressuresand increased truck weights have led to an increase in rutting. The participants also believed thatrutting could be minimized with more attention to the selection of materials, mix design andconstruction.
Several field studies have been undertaken in the last 10 years to try to identify materialproperties and or design parameters that relate to rutting. Several of these studies were large inscope and involved extensive field sampling and lab testing. Ford (5) in Arkansas and Kandhal,et.al (6) in Pennsylvania evaluated over thirty pavement sites in each state to determine thematerial characteristics that related to rutting. Two smaller studies of premature rutting by Parkerand Brown (7), and Huber and Heiman (8) contained data from ten to fifteen pavement sites.Several other case histories have been reported on premature rutting where one or twopavements were analyzed.
Objective
The objectives of this study are to identify the material properties, mix design parameters andconstruction procedures that affect rutting and to provide information necessary to produceHMA mixtures that will perform satisfactorily and to provide information to identify those mixeswith a tendency to rut under today’s heavy traffic loadings.

Brown & Cross
2
Scope
The NCAT rutting study was initiated in 1987 to evaluate pavements from all areas of the UnitedStates encompassing various climatic regions, containing aggregates of differing origins andangularity, encompassing different specifying agencies and construction practices and containinga large sample size to make the results national in scope. This report is part of a larger NCATstudy (9) and is the conclusion of a preliminary study reported in 1989 (10).
Forty-two pavements were sampled from fourteen states (Figure 1) across the United States. Rutdepth measurements were made across each pavement to quantify the amount of ruttingoccurring at each site. The mix design information, construction records and traffic counts werealso obtained. A detailed laboratory testing program was performed on samples of the asphaltmixture from these rutted and good performing pavements. The data were analyzed to determinematerial and mixture properties and to identify procedures that are necessary for construction ofrut resistant HMA pavements.
Test Plan
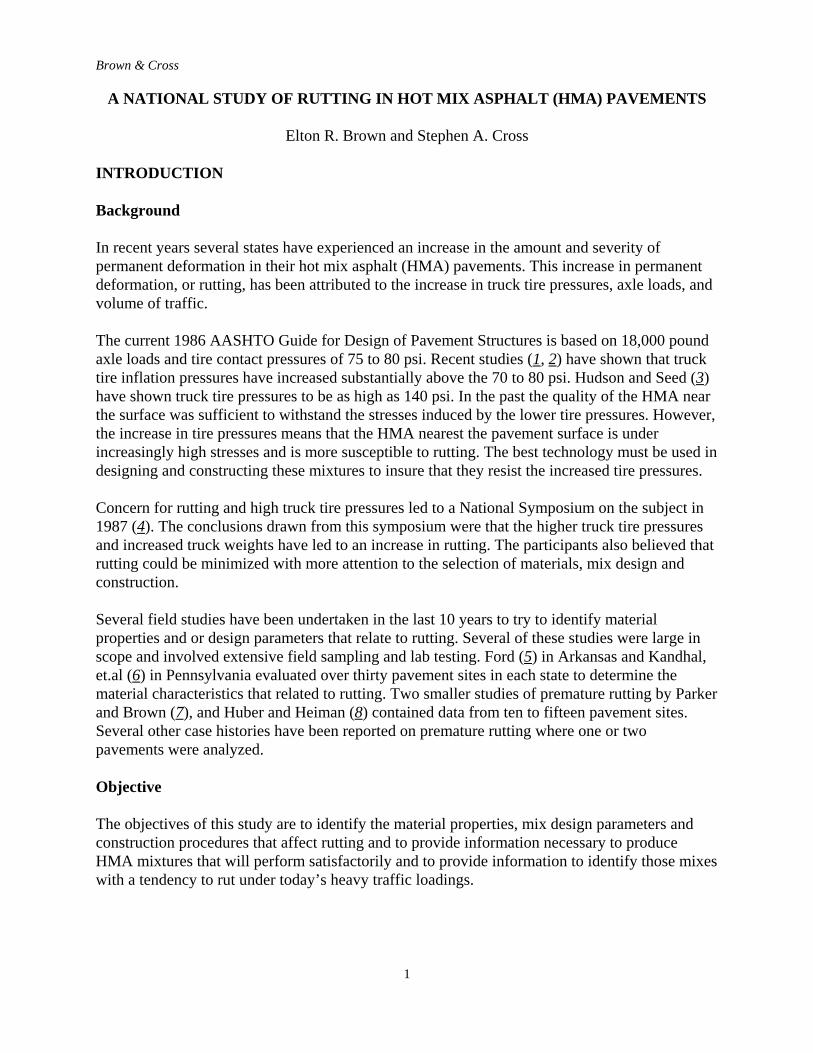
The overall test plan for the rutting study is shown in Figure 2. The plan of laboratory tests forthe cores is shown in Figure 3. The field testing consisted of obtaining 6-inch diameter cores,making rut depth measurements, and viewing the pavement layers in a trench cut across the testlane. In general, 6-inch diameter cores were obtained on 1 foot intervals across the traffic lane ateach site.
Figure 1. States Participating in Rutting Study

Brown & Cross
3
Rut depth measurements were obtained using a 12 foot elevated straightedge to establish ahorizontal reference line. The distance from the straightedge to the pavement surface was thenrecorded to the nearest 1/16 inch at l-foot internals over the proposed core locations.
Tests were conducted in the laboratory to characterize the material and mixture properties. The6-inch diameter cores were first measured to determine the thickness of each layer of each core.Next, the cores were sawed into their respective pavement layers and the bulk specific gravity(ASTM D2726) determined for each layer. Two cores were used to determine the maximumtheoretical specific gravity according to ASTM D2041. The two cores were extracted todetermine the asphalt cement content (ASTM D2172) and the gradation of the mineral aggregate(ASTM Cl 17 and C136). The extracted aggregate was further examined to determine thenumber of crushed faces for the coarse aggregate (retained on the No.4 sieve) and the fineaggregate (passing No.4 and retained on No.30 sieves). The angularity of the fine aggregate(passing No.4 sieve) was determined using the National Aggregate Associations UncompactedVoids Test, Method A (11). The uncompacted void content and the time in seconds for theaggregate to fill the container were determined. The results of the effects of the aggregateproperties on rutting have been previously reported by the authors (12).
The asphalt cement was recovered from the extracted residue (ASTM D1856) and the absoluteand kinematic viscosity (ASTM D2171 and D2170), and penetration (ASTM D5) determined.The penetration was determined at both 77°F (100g, 5 seconds) and 40°F (200g, 60 seconds).The specific gravity of the asphalt cement was determined in accordance with ASTM D70.
Figure 2. Overall Test Plan
Brown & Cross
4
Figure 3. Laboratory Test Plan for 6-Inch Cores

Brown & Cross
5
The remainder of the 6-inch diameter cores were heated, broken up and combined by layers andrecompacted utilizing two compactive efforts. The compactive efforts were 75 blows per sidewith the manual Marshall hammer (standard compactive effort) and 300 revolutions, 120 psi, and1 degree angle with the Gyratory Testing Machine (GTM). Triplicate samples were made at eachcompactive effort if sufficient material was available. The samples were then tested for unitweight, voids in total mix (VTM), voids in mineral aggregate (W), voids filled (W), Marshallstability and flow. The GTM parameters of gyratory shear index (GSI), gyratory elasto-plasticityindex (GEPI) and measured shear strength were also recorded for each GTM compacted samplein accordance with ASTM D3387.
SUMMARY OF TEST RESULTS
General Description of Test Sites
Nine of the 42 sites were original construction that had not been overlaid at the time of sampling.These pavements typically consisted of three or more layers of HMA over a granular base orsubbase. Fourteen of the sites consisted of overlays of HMA pavements and typically consistedof two layers of HMA. Nineteen of the sites consisted of overlays of concrete pavementsconsisting of two or three layers of HMA with the bottom layer being either a base mix or a thinleveling mix.
Most of the test sections were located on level tangents of 4-lane divided highways. Four of thesites (Sites 1, 19, 21 and 25) were located near intersections and the pavements were subjected tostatic loadings and braking and acceleration forces of tires. Open graded friction courses (OGFC)were found at the surface at sites 2, 3, 5, 18 and 20. The lack of sufficient thickness of the OGFCprevented complete testing of this mixture for the five sites. Two sites (Sites 25 and 37) weresampled and tested but not included in the analysis. Site 25 was located in an area of lanewidening and the pavement was not of consistent cross-section across the width of the pavement.Site 37 had experienced extensive maintenance treatments and no test information was availableon the upper 3 to 4 inches of the pavement.
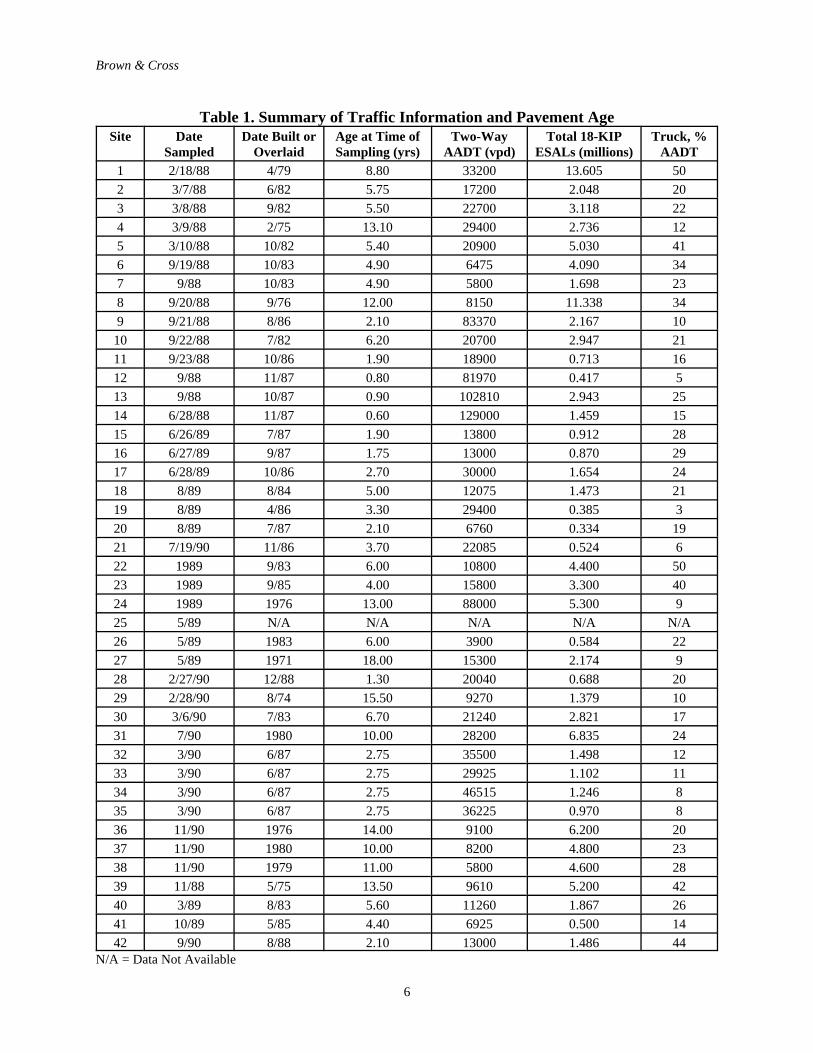
Some moisture damage was visually observed in cores from several sites. Moisture damage wasthe primary mode of distress in two sites (site 3 and 18) and was evident in four other sites (sites2, 25, 27 and 38). The moisture damaged sites were included in the analysis of the data becausein most cases the rutting had occurred in the layers above the stripping. A description of each testsite can be found in the NCAT Report 91-8 (9). The traffic data and dates sampled are shown inTable 1.
Rut Depth Measurements
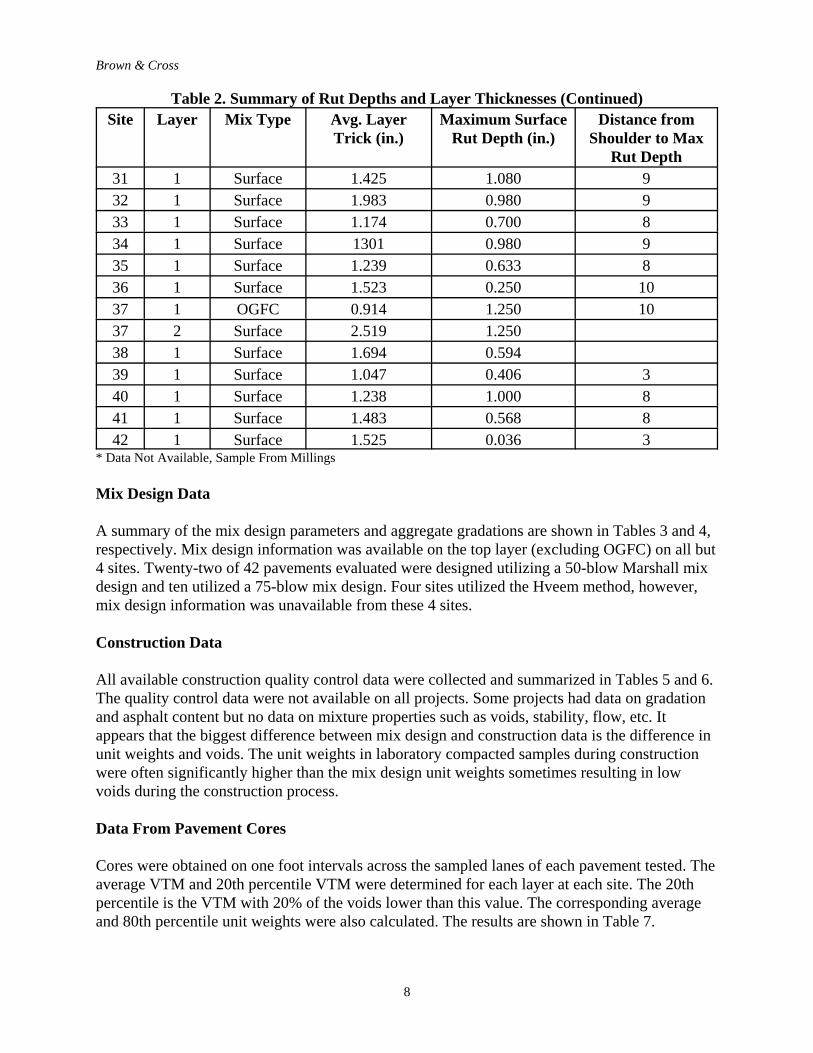
By obtaining rut depth measurements at core locations the pavement cross section could beestablished. From these data the maximum rut depth at the surface was determined by measuringthe vertical distance between a straight line connecting high points on opposite sides of the rutand the low point on the pavement surface near the middle of the rut. The distance from thecenterline to the maximum rut depth was also recorded. The average thickness of each pavementlayer was determined by averaging the thickness of all cores taken transversely across thepavement. The data for the top two layers is shown in Table 2.
Brown & Cross
6
Table 1. Summary of Traffic Information and Pavement AgeSite Date
SampledDate Built or
OverlaidAge at Time ofSampling (yrs)
Two-WayAADT (vpd)
Total 18-KIPESALs (millions)
Truck, %AADT
1 2/18/88 4/79 8.80 33200 13.605 502 3/7/88 6/82 5.75 17200 2.048 203 3/8/88 9/82 5.50 22700 3.118 224 3/9/88 2/75 13.10 29400 2.736 125 3/10/88 10/82 5.40 20900 5.030 416 9/19/88 10/83 4.90 6475 4.090 347 9/88 10/83 4.90 5800 1.698 238 9/20/88 9/76 12.00 8150 11.338 349 9/21/88 8/86 2.10 83370 2.167 1010 9/22/88 7/82 6.20 20700 2.947 2111 9/23/88 10/86 1.90 18900 0.713 1612 9/88 11/87 0.80 81970 0.417 513 9/88 10/87 0.90 102810 2.943 2514 6/28/88 11/87 0.60 129000 1.459 1515 6/26/89 7/87 1.90 13800 0.912 2816 6/27/89 9/87 1.75 13000 0.870 2917 6/28/89 10/86 2.70 30000 1.654 2418 8/89 8/84 5.00 12075 1.473 2119 8/89 4/86 3.30 29400 0.385 320 8/89 7/87 2.10 6760 0.334 1921 7/19/90 11/86 3.70 22085 0.524 622 1989 9/83 6.00 10800 4.400 5023 1989 9/85 4.00 15800 3.300 4024 1989 1976 13.00 88000 5.300 925 5/89 N/A N/A N/A N/A N/A26 5/89 1983 6.00 3900 0.584 2227 5/89 1971 18.00 15300 2.174 928 2/27/90 12/88 1.30 20040 0.688 2029 2/28/90 8/74 15.50 9270 1.379 1030 3/6/90 7/83 6.70 21240 2.821 1731 7/90 1980 10.00 28200 6.835 2432 3/90 6/87 2.75 35500 1.498 1233 3/90 6/87 2.75 29925 1.102 1134 3/90 6/87 2.75 46515 1.246 835 3/90 6/87 2.75 36225 0.970 836 11/90 1976 14.00 9100 6.200 2037 11/90 1980 10.00 8200 4.800 2338 11/90 1979 11.00 5800 4.600 2839 11/88 5/75 13.50 9610 5.200 4240 3/89 8/83 5.60 11260 1.867 2641 10/89 5/85 4.40 6925 0.500 1442 9/90 8/88 2.10 13000 1.486 44
N/A = Data Not Available

Brown & Cross
7
Table 2. Summary of Rut Depths and Layer ThicknessesSite Layer Mix Type Avg Layer
Trick (in)Maximum Surface
Rut Depth (in)Distance from
Shoulder to MaxRut Depth
1 1 Surface 2.432 1.500 32 1 OGFC 0.800 0.896 92 2 Surface 1.275 0.8963 1 OGFC 0.693 0.375 43 2 Surface 1.568 03754 1 Surface 1.182 0.250 95 1 OGFC 0.768 0.625 35 2 Surface 1.205 0.6256 1 Surface 1.427 0.575 47 1 Surface 1.571 0.344 48 1 Surface 1.250 0.400 49 1 Surface * 1.000 *10 1 Surface 0.796 0.125 411 1 Surface 1.097 0.550 1012 1 Surface 1.721 1.450 913 1 Surface 1.596 1.656 314 1 Surface 2.500 1.480 315 1 Surface 1.490 0.094 416 1 Surface 1.415 0.547 417 1 Surface 1.205 0.463 418 1 OGFC 0.858 0.200 318 2 Surface 1.790 0.20019 1 Surface 1.528 0.390 819 2 Surface 1.722 0-39020 1 OGFC 0.841 0.317 920 2 Surface 1.409 0.31721 1 Surface 1.403 1.370 922 1 Surface 2.038 0.500 323 1 Surface 1.421 0.586 424 1 Surface 1.275 0.315 425 1 Surface 2.615 0.540 826 1 Surface 0.938 0.540 327 1 Surface 1.950 0.336 328 1 Surface 1.614 0.300 929 1 Surface 1.284 0.513 330 1 Surface 1.148 0.325 3
Brown & Cross
8
Table 2. Summary of Rut Depths and Layer Thicknesses (Continued)Site Layer Mix Type Avg. Layer
Trick (in.)Maximum Surface
Rut Depth (in.)Distance from
Shoulder to MaxRut Depth
31 1 Surface 1.425 1.080 932 1 Surface 1.983 0.980 933 1 Surface 1.174 0.700 834 1 Surface 1301 0.980 935 1 Surface 1.239 0.633 836 1 Surface 1.523 0.250 1037 1 OGFC 0.914 1.250 1037 2 Surface 2.519 1.25038 1 Surface 1.694 0.59439 1 Surface 1.047 0.406 340 1 Surface 1.238 1.000 841 1 Surface 1.483 0.568 842 1 Surface 1.525 0.036 3
* Data Not Available, Sample From Millings
Mix Design Data
A summary of the mix design parameters and aggregate gradations are shown in Tables 3 and 4,respectively. Mix design information was available on the top layer (excluding OGFC) on all but4 sites. Twenty-two of 42 pavements evaluated were designed utilizing a 50-blow Marshall mixdesign and ten utilized a 75-blow mix design. Four sites utilized the Hveem method, however,mix design information was unavailable from these 4 sites.
Construction Data
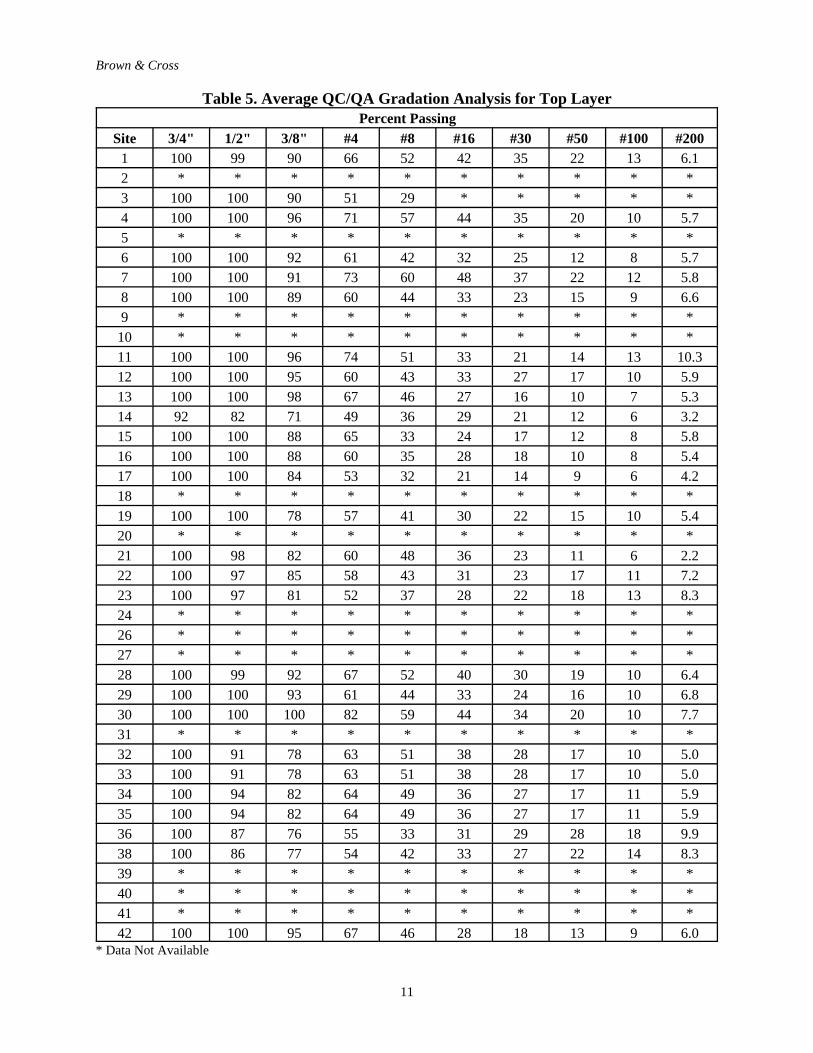
All available construction quality control data were collected and summarized in Tables 5 and 6.The quality control data were not available on all projects. Some projects had data on gradationand asphalt content but no data on mixture properties such as voids, stability, flow, etc. Itappears that the biggest difference between mix design and construction data is the difference inunit weights and voids. The unit weights in laboratory compacted samples during constructionwere often significantly higher than the mix design unit weights sometimes resulting in lowvoids during the construction process.
Data From Pavement Cores
Cores were obtained on one foot intervals across the sampled lanes of each pavement tested. Theaverage VTM and 20th percentile VTM were determined for each layer at each site. The 20thpercentile is the VTM with 20% of the voids lower than this value. The corresponding averageand 80th percentile unit weights were also calculated. The results are shown in Table 7.

Brown & Cross
9
Table 3. Summary of Mix Design Properties for Top LayerSite AC
(%)VTM(%)
VMA(%)
VF(%)
UnitWeight
(pcf)
Marshall No. BlowsSide
AsphaltCementGradeStab.
(Lbs)Flow (.01
in)1 63 5.9 19.5 69.8 141.7 1596 11.0 50 85-1002 * * * * * * * * *3 4.5 6.7 16.7 59.8 142.8 1250 * 50 AC-204 6.0 5.4 18.9 71.8 144.4 2440 10.0 50 AC-205 * * * * * * * * *6 4.8 4.2 15.4 72.7 146.3 2420 8.0 50 AC-207 5.0 4.1 15.7 73.9 147.2 2155 8.0 50 AC-208 4.8 5.4 16.8 67.8 147.4 2075 8.0 50 AC-209 7.2 4.7 22.5 79.1 142.9 * * 50 85-100
10 7.0 73 22.1 67.0 135.4 * * 50 85-10011 6.5 4.1 18.6 78.0 142.7 * * 50 120-15012 6.5 3.0 16.3 81.3 144.3 2322 10.2 75 AC-2013 6.4 3.1 16.4 81.3 148.9 2347 12.0 75 AC-2014 5.0 3.0 15.2 80.1 156.2 2051 10.2 75 AC-2015 7.2 4.8 15.5 69.0 140.4 2875 8.0 75 AC-2016 7.2 4.8 15.5 69.0 140.4 2875 8.0 75 AC-2017 6.2 6.5 15.2 59.2 140.4 2875 7.5 75 AC-2018 * * * * * * * * *19 6.4 3.5 15.8 77.8 146.3 1846 11.0 50 85-10020 * * * * * * * * *21 6.3 4.0 17.1 76.0 145.5 1470 10.4 50 AC-2022 5.8 2.6 163 84.0 152.6 1900 9.0 50 85-10023 5.3 3.5 15.9 78.0 150.8 1995 8.5 50 85-10024 6.7 2.1 18.8 88.8 159.9 2530 15.0 50 *26 * * * * * * * * *27 * * * * * * * * *28 6.0 4.0 15.8 74.7 143.3 2120 12.0 75 AC-3029 5.0 3.2 14.7 78.0 147.5 1600 7.0 75 AC-2030 7.3 4.4 20.5 78.6 141.6 * * 75 AC-3031 * * * * * * * * *32 5.5 3.2 16.4 80.2 152.4 1878 10.3 50 AC-1033 5.5 3.2 16.4 80.2 152.4 1878 10.3 50 AC-1034 5.9 3.0 16.4 81.8 145.8 2040 11-3 50 AC-1035 5.9 3.0 16.4 81.8 145.8 2040 11-3 50 AC-1036 6.0 * * * * * * 50 AC-1038 6.3 * * * * * * 50 AC-1039 * * * * * * * * *40 6.0 * * * 143.1 * * 50 AC-2041 5.9 * * * 148.5 2491 * 50 AC-2042 6.1 4.0 16.3 75.7 148.9 2700 10.0 75 AC-20
* = Data Not Available

Brown & Cross
10
Table 4. Summary of Mix Design Aggregate Gradations For Top LayerPercent Passing
Site 1" 3/4" 1/2" 3/8" #4 #8 #16 #30 #50 # 100 #2001 100 100 97 91 66 54 43 35 22 13 5.32 * * * * * * * * * * *3 100 100 98 88 48 30 * * * * *4 100 100 98 90 68 56 40 29 18 11 6.05 * * * * * * * * * * *6 100 100 99 90 60 44 34 25 10 7 5.67 100 100 99 89 70 58 48 36 18 8 6.08 100 100 99 88 60 45 36 23 13 8 5.89 100 100 100 97 72 56 37 21 11 6 2.0
10 100 100 100 99 73 63 49 33 19 10 2.011 100 100 100 96 71 53 40 24 16 11 8.012 100 100 100 92 62 42 31 25 17 9 5.013 100 100 100 92 65 45 26 16 10 9 5.014 99 92 82 72 51 37 29 20 11 7 4.015 100 100 100 98 55 32 20 13 9 7 5.316 100 100 100 98 55 32 20 13 9 7 5.317 100 100 100 97 51 30 21 14 8 5 3.618 * * * * * * * * * * *19 100 100 88 78 55 38 27 21 14 10 6.22021 100 100 99 84 60 47 35 25 11 6 2.122 100 100 97 84 55 42 30 23 19 11 7.623 100 100 97 81 51 37 28 22 18 12 7.924 100 100 100 100 99 80 54 36 26 20 15.226 * * * * * * * * * * *27 * * * * * * * * * * *28 100 100 100 92 62 43 32 24 13 7 6.029 100 100 100 93 60 45 34 25 16 10 5.030 100 100 100 100 83 62 46 34 20 11 7.431 * * * * * * * * * * *32 100 100 92 80 65 53 39 30 19 11 5.733 100 100 92 80 65 53 39 30 19 11 5.734 100 100 94 85 67 52 39 30 19 11 5.635 100 100 94 85 67 52 39 30 19 11 5.636 100 100 84 75 52 33 30 28 27 17 10.038 100 100 83 72 50 39 30 24 19 13 8.039 * * * * * * * * * * *40 100 100 100 86 63 58 33 23 15 7 4.041 100 100 100 88 72 50 34 24 15 9 5.042 100 100 100 95 70 47 28 18 12 8 5.0
* = Data Not Available
Brown & Cross
11
Table 5. Average QC/QA Gradation Analysis for Top LayerPercent Passing
Site 3/4" 1/2" 3/8" #4 #8 #16 #30 #50 #100 #2001 100 99 90 66 52 42 35 22 13 6.12 * * * * * * * * * *3 100 100 90 51 29 * * * * *4 100 100 96 71 57 44 35 20 10 5.75 * * * * * * * * * *6 100 100 92 61 42 32 25 12 8 5.77 100 100 91 73 60 48 37 22 12 5.88 100 100 89 60 44 33 23 15 9 6.69 * * * * * * * * * *10 * * * * * * * * * *11 100 100 96 74 51 33 21 14 13 10.312 100 100 95 60 43 33 27 17 10 5.913 100 100 98 67 46 27 16 10 7 5.314 92 82 71 49 36 29 21 12 6 3.215 100 100 88 65 33 24 17 12 8 5.816 100 100 88 60 35 28 18 10 8 5.417 100 100 84 53 32 21 14 9 6 4.218 * * * * * * * * * *19 100 100 78 57 41 30 22 15 10 5.420 * * * * * * * * * *21 100 98 82 60 48 36 23 11 6 2.222 100 97 85 58 43 31 23 17 11 7.223 100 97 81 52 37 28 22 18 13 8.324 * * * * * * * * * *26 * * * * * * * * * *27 * * * * * * * * * *28 100 99 92 67 52 40 30 19 10 6.429 100 100 93 61 44 33 24 16 10 6.830 100 100 100 82 59 44 34 20 10 7.731 * * * * * * * * * *32 100 91 78 63 51 38 28 17 10 5.033 100 91 78 63 51 38 28 17 10 5.034 100 94 82 64 49 36 27 17 11 5.935 100 94 82 64 49 36 27 17 11 5.936 100 87 76 55 33 31 29 28 18 9.938 100 86 77 54 42 33 27 22 14 8.339 * * * * * * * * * *40 * * * * * * * * * *41 * * * * * * * * * *42 100 100 95 67 46 28 18 13 9 6.0
* Data Not Available

Brown & Cross
12
Table 6. Average QC/QA Testing for Top Layer Mix PropertiesSite In-Place Lab Compacted
AsphaltContent
(%)
VoidsTotal Mix
(%)
UnitWeight
(pcf)
VoidsTotal Mix
(%)
UnitWeight
(pcf)
Marshall
Stab. (lbs.) Flow (0.01in)
1 6.4 * * * * * *2 * * * * * * *3 4.7 * * * * * *4 6.1 * * * * * *5 * * * * * * *6 5.2 8.0 141.6 5.0 146.4 * *7 5.2 6.9 142.2 4.0 146.8 * *8 4.8 * * * * * *9 * * * * * * *
10 * * * * * * *11 5.5 * * 2.3 148.0 2247 *12 6.4 4.7 141.4 * * * *13 6.1 6.1 143.8 * * * *14 * * * 2.8 156.2 2051 1015 7.8 5.0 142.6 2.8 145.9 * *16 7.4 4.8 143.0 2.2 146.8 * *17 6.7 5.7 140.3 * * * *18 * * * * * * *19 6.3 6.7 143.0 2.4 149.2 2006 1220 * * * * * * *21 6.5 5.1 145.6 4.4 145.9 1645 1022 5.5 5.5 148.7 * * * *23 5.1 5.9 147.2 * * * *24 * * * * * * *26 * * * * * * *27 * * * * * * *28 5.7 * * 3.6 143.7 1944 *29 5.0 7.7 140.5 4.2 145.9 2383 1030 * * * 5.5 139.9 1604 *31 * * * * * * *32 5.5 3.2 151.8 3.9 150.7 2114 1433 5.5 2.7 151.9 2.8 151.8 2270 1234 5.4 1.8 150.1 2.1 149.7 2093 1135 5.4 1.7 150.3 2.9 148.5 2394 1236 6.2 * * * * * *38 5.9 * * * * * *39 * * * * * * *40 * * * * * * *41 * * * * * * *42 6.1 * 143.1 * * * *
* Data Not Available

Brown & Cross
13
Table 7. Summary of Voids and Unit Weights From Top Layer of In-Place CoresSite 20th Pcntl
VTM (%)Average
VTM (%)MinimumVTM (%)
80th PcntlUnit Weight
(pcf)
AverageUnit Weight
(pcf)
MaximumUnit
Weight(pcf)
1 0.4 1.1 0.0 151.0 149.9 151.62 * * * 138.2 135.7 141.63 11.3 11.9 11.0 138.3 137.4 138.74 3.1 4.3 2.7 147.1 145.3 147.65 * * * * * *6 4.6 5.4 3.7 146.0 144.7 147.37 2.2 3.2 2.1 148.9 147.3 149.08 2.1 3.2 1.7 151.4 149.7 152.09 + + + + + +
10 5.1 6.1 4.6 141.0 139.5 141.811 2.7 4.1 2.0 147.7 145.6 148.812 1.3 1.9 1.2 146.2 145.3 146.313 3.5 4.9 2.3 148.7 146.6 150.514 1.5 2.9 1.0 157.2 154.9 157.915 5.5 7.2 5.5 141.2 138.7 141.816 3.5 4.1 3.0 144.8 143.9 145.617 4.0 6.0 3.5 142.7 139.8 143.518 14.6 15.9 13.2 129.1 127.2 131.419 0.9 1.4 0.1 151.9 151.1 153.120 12.3 12.8 11.9 133.2 132.4 133.721 2.2 2.8 1.8 149.5 148.7 150.122 1.5 2.0 1.0 156.3 155.4 157.023 1.8 2.7 1.2 153.1 151.6 153.924 1.4 2.8 1.3 161.1 158.8 161.226 3.2 5.7 2.5 141.4 137.7 142.427 8.2 8.5 7.7 144.2 143.7 145.028 3.5 4.2 3.1 143.9 142.9 144.629 2.6 3.7 1.6 147.0 145.4 148.630 1.3 2.0 0.9 144.6 143.5 145.331 1.1 3.3 0.8 150.8 147.5 151.332 3.2 3.7 2.9 154.8 148.8 152.333 2.3 3.3 1.6 152.3 150.7 153.434 1.4 1.7 1.2 150.2 149.8 150.435 1.6 1.9 1.4 150.4 150.0 150.736 1.4 1.6 1.4 146.9 146.6 147.038 0.8 1.6 0.6 148.4 147.2 148.639 4.6 5.9 4.4 141.6 139.7 141.940 1.4 2.5 0.9 148.0 146.3 148.741 0.9 1.2 0.6 149.2 148.7 149.642 5.1 5.9 4.7 146.9 145.7 147.5
* Not Enough Material to Test; + Data Not Available, Sample From Millings

Brown & Cross
14
The distance from the centerline to the maximum rut depth was reported in Table 2. It can beseen that the minimum VTM did not always occur in the wheel path and the variation in VTMacross the wheel path could be quite large. The 20th percentile VTM was calculated to estimatethe VTM in the wheel path because utilizing minimum VTM seemed too severe in somelocations and utilizing the average VTM seemed too conservative. Kandhal et.al. (6) reportedthat the 20th percentile VTM across the pavement was a good approximation of the void contentin the wheel path.
The asphalt cement was recovered from the extracted residue and the properties determined. Theproperties evaluated were absolute and kinematic viscosity, penetration at 77 and 40°F andspecific gravity. The results are shown in Table 8.
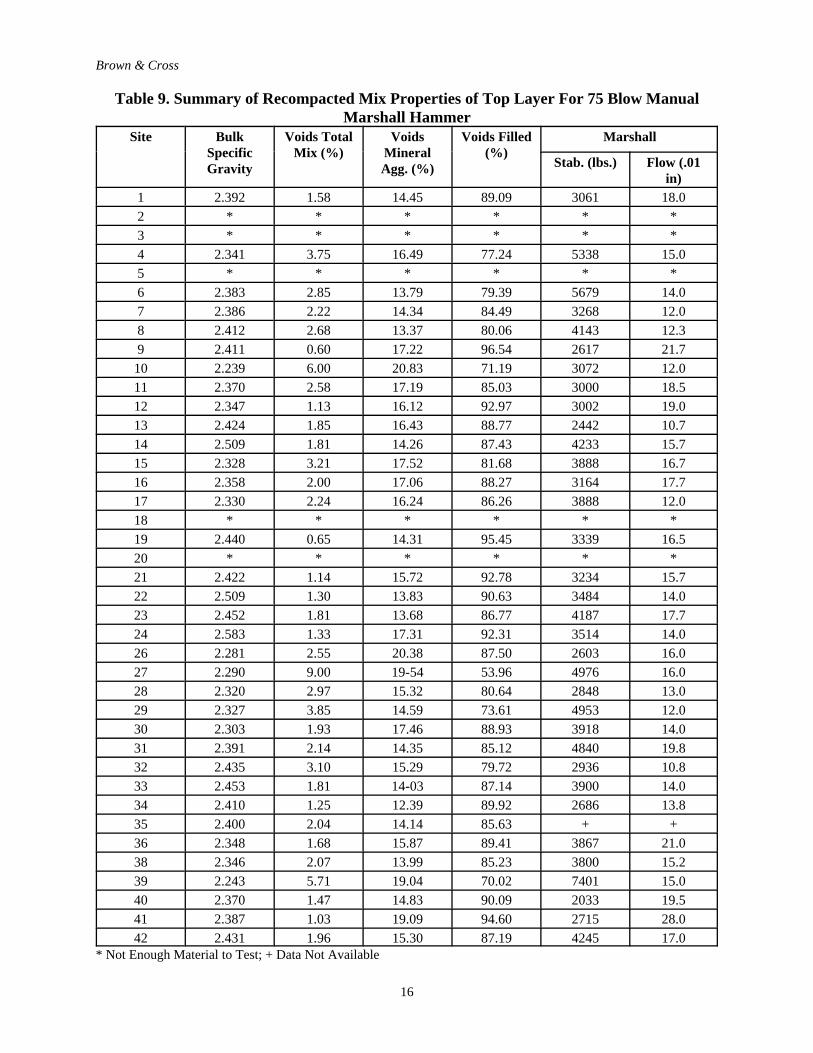
Recompacted Mix Properties
The recompacted properties of unit weight, VTM, VMA, VFA, Marshall stability and flow weredetermined for samples compacted with the manual Marshall hammer and the GTM. Parametersincluding GSI, GEPI and shear stress were measured for the GTM compacted samples. Theresults for the manual Marshall samples are shown in Table 9 and for the GTM samples in Table10.
ANALYSIS OF DATA
The general procedure for analysis of the data consisted of performing a linear correlationanalysis to determine if the dependent variable rut dept was significantly correlated to theindependent variables. If significant correlations were found, the relationship was furtherinvestigated using regression analysis. The results presented are limited to the top pavementlayer. The relationships found for the second layer are included in the NCAT Report 98-1 (9).The relationships for the second pavement layer were not as strong as for the corresponding firstlayer.
Outliers were often encountered that did not fit the relationship. An outlier was defined as anypoint that fell outside the 95% confidence limits of the regression equation. If a plausibleexplanation existed, the data point was identified as an outlier and the analysis performedwithout the data point.
Evaluation of Rut Depth Data
Each of the 42 pavements were selected by State DOT personnel as either good or rutted basedon a subjective analysis of the rut depth and the age of the pavement. From the data it wasdecided to represent rate of rutting as the maximum rut depth at the surface in inches divided bythe square root of the total traffic in ESALs. A linear relationship for rate of rutting was found toprovide high estimates for older pavements, a log function was found to provide low estimatesfor older pavements, and the square root function appeared to fit all the data better. The chosenexpression for rate of rutting agrees with rates of rutting utilized in other work (6, 7).

Brown & Cross
15
Table 8. Properties of Asphalt Cement Recovered From Top LayerSite Viscosity Penetration Specific
GravityAsphaltCement
AsphaltContent
(%)275°F (cSt) 140°F(poise)
77°F 100g 5sec (.1 mm)
40°F 200g60 sec (.1
mm)1 577 3325 57 26 1.061 5.712 * * * * * *3 * * * * * *4 491 4878 so 29 1.029 5.605 * * * * * *6 1173 29427 21 9 1.0:7 4.817 695 8699 29 19 1.040 5.288 633 6097 46 26 1.010 4.489 428 3387 36 20 1.024 7.06
10 566 9663 34 27 1.025 6.7911 548 4598 46 25 1.025 6.3212 1308 8728 27 34 1.023 6.5313 1159 7737 38 38 1.025 6.1714 548 3591 57 24 1.037 5.1515 788 13383 35 29 1.030 6-3316 591 4637 88 30 1.030 6.5817 563 5430 36 22 1.030 6.1918 648 5867 51 34 1.042 4.3119 341 1990 41 19 1.020 5.7120 312 2347 38 24 1.010 5.5621 649 7710 39 33 1.022 6.1622 570 6146 40 21 1.050 5.2523 576 5328 40 22 1.031 4.9924 454 3987 35 18 1.019 63126 609 6515 28 14 1.035 8.0927 10215 79042 26 12 1.045 4.8128 724 7336 35 22 1.046 5.5729 911 9853 23 17 1.036 4.7830 696 7134 39 27 1.032 6.%31 745 8067 24 17 1.036 5.2932 277 910 75 28 1.077 53933 275 602 118 38 1.033 5.1534 281 1043 86 40 1.074 4.9635 344 1826 150+ 150+ 1.043 5.2636 348 1635 76 30 1.009 5.8338 385 2407 66 46 1.019 5.4539 1524 50112 21 11 1.060 6.3040 777 7746 40 25 1.047 5.9041 542 3892 63 39 1.031 7.8042 + + 8378 37 + + 1.030 5.65
* Not Enough Material to Test; + + Data Not Available
Brown & Cross
16
Table 9. Summary of Recompacted Mix Properties of Top Layer For 75 Blow ManualMarshall Hammer
Site BulkSpecificGravity
Voids TotalMix (%)
VoidsMineralAgg. (%)
Voids Filled(%)
Marshall
Stab. (lbs.) Flow (.01in)
1 2.392 1.58 14.45 89.09 3061 18.02 * * * * * *3 * * * * * *4 2.341 3.75 16.49 77.24 5338 15.05 * * * * * *6 2.383 2.85 13.79 79.39 5679 14.07 2.386 2.22 14.34 84.49 3268 12.08 2.412 2.68 13.37 80.06 4143 12.39 2.411 0.60 17.22 96.54 2617 21.7
10 2.239 6.00 20.83 71.19 3072 12.011 2.370 2.58 17.19 85.03 3000 18.512 2.347 1.13 16.12 92.97 3002 19.013 2.424 1.85 16.43 88.77 2442 10.714 2.509 1.81 14.26 87.43 4233 15.715 2.328 3.21 17.52 81.68 3888 16.716 2.358 2.00 17.06 88.27 3164 17.717 2.330 2.24 16.24 86.26 3888 12.018 * * * * * *19 2.440 0.65 14.31 95.45 3339 16.520 * * * * * *21 2.422 1.14 15.72 92.78 3234 15.722 2.509 1.30 13.83 90.63 3484 14.023 2.452 1.81 13.68 86.77 4187 17.724 2.583 1.33 17.31 92.31 3514 14.026 2.281 2.55 20.38 87.50 2603 16.027 2.290 9.00 19-54 53.96 4976 16.028 2.320 2.97 15.32 80.64 2848 13.029 2.327 3.85 14.59 73.61 4953 12.030 2.303 1.93 17.46 88.93 3918 14.031 2.391 2.14 14.35 85.12 4840 19.832 2.435 3.10 15.29 79.72 2936 10.833 2.453 1.81 14-03 87.14 3900 14.034 2.410 1.25 12.39 89.92 2686 13.835 2.400 2.04 14.14 85.63 + +36 2.348 1.68 15.87 89.41 3867 21.038 2.346 2.07 13.99 85.23 3800 15.239 2.243 5.71 19.04 70.02 7401 15.040 2.370 1.47 14.83 90.09 2033 19.541 2.387 1.03 19.09 94.60 2715 28.042 2.431 1.96 15.30 87.19 4245 17.0
* Not Enough Material to Test; + Data Not Available

Brown & Cross
17
Table 10. Summary of Top Layer GTM Recompacted Mix Properties for GTM, 300Revolutions, 120 psi, 1 Degree Angle
Site BulkSpecificGravity
VTM(%)
VMA(%)
VF (%) Marshall GSI GEPI ShearStrength (psi)Stab.
(lbs.)Flow
(.01 in)1 2.421 0.4 13.4 97.1 1635 27.0 1.61 2.10 3.12 * * * * * * * * *3 * * * * * * * * *4 2.361 2.9 15.8 81.4 4563 16.0 1.04 1.20 47.15 * * * * * * * * *6 2.378 2.9 13.8 793 4593 14.7 1.08 1.25 42.67 2.388 2.1 14.2 85.2 2M9 113 1.04 130 38.88 2.422 23 13.1 82.1 2999 11.7 1.07 1.22 3639 2.414 0.6 17.2 96.5 2175 21.7 1.69 1.28 26.6
10 2.245 5.7 20.6 72.2 2508 12.5 1.00 1.15 41.711 2.374 2.4 17.1 85.7 2788 16.5 1.37 1.2S 41312 2.351 1.0 16.0 93.9 2670 21.0 1.63 1.27 12.013 2.423 1.9 16.5 88.5 2252 13.7 1.43 1.25 29.514 2.502 2.1 14.5 85.7 3647 15.0 1.29 1.20 34.315 2.339 2.7 17.1 84.0 3544 21.3 1.28 1.13 38.416 2.369 1.5 16.7 90.8 3081 18.7 1.40 1.17 32-317 2.333 2.1 16.1 87.0 3165 13.5 1.20 1.15 36.818 2.180 10.5 19.5 46.3 1290 12.0 1.00 1.10 50.219 2.428 1.1 14.7 92.5 2973 14.3 1.36 1.06 24.120 2.199 9.6 21.7 55.9 1259 14.0 1.00 1.18 50-321 2.432 0.7 15.4 953 2627 13.0 1.50 1.20 25.522 2.508 1.3 13.9 90.6 2875 14.7 1.47 1.15 38.523 2.456 1.7 13.5 87.8 3155 18.0 1.41 1.18 41.924 2.571 1.8 17.7 89.6 3326 14.7 1.53 1.15 25.926 2.263 33 21.0 84.2 2333 16.7 1.00 1.08 35.827 2.279 9.5 20.0 52.6 5220 19.0 0.93 1.03 52.728 2.336 23 14.7 84.5 2458 13.3 1.10 1.20 34.129 2.347 3.0 13.8 78.4 3208 12.3 1.02 1.20 42.930 2.304 1.9 17.4 89.2 2868 13.5 1.09 1.20 38.231 2359 3.5 15.5 77.8 4141 16.8 1.12 1.20 36.732 2.436 3.1 15.3 79.7 3040 11.0 1.04 1.27 34.033 2.459 1.8 14.0 87.2 3602 12.8 1.14 1.25 29.534 2.418 1.1 12.3 90.9 2190 11.3 1.29 1.22 31.135 2.401 2.0 14.1 85.8 + + 1.11 1.21 28.636 2365 1.0 15.3 93.6 2828 27.3 1.53 1.28 17.338 2.319 3.2 15.0 79.2 2700 19.8 1.63 1.18 23.139 2.248 5.5 18.9 70.8 5304 11.5 1.00 1.2 52.440 2.367 1.6 14.9 89.4 1845 17.5 1.39 1.35 30.141 2.379 1.4 19.4 93.0 2257 24.5 1.80 1.35 25.742 2.415 2.6 15.9 83.5 3293 18.5 1.33 1.05 33.5
* Not Enough Material to Test; + Data Not Available

Brown & Cross
18
Rut depth measurements were obtained for each of the pavements evaluated and the maximumrut depths are shown in Table 2. The measured rut depths ranged from a low of 0.04 inches atsite 42 to a high of 1.65 inches at site 13. The maximum rut depth on a pavement identified asgood performing by the states was 0.51 inches and the minimum rut depth for a rutted pavementwas 0.30 inches. There was overlap in the rut depth measurements between observed good andrutted pavements and a single rut depth could not be identified as delineating between good andrutted.
Evaluation of Rut Depth Data
Each of the 42 pavements were selected by State DOT personnel as either good or rutted basedon a subjective analysis of the rut depth and the age of the pavement. From the data it wasdecided to represent rate of rutting as the maximum rut depth at the surface in inches divided bythe square root of the total traffic in ESALs. A linear relationship for rate of rutting was found toprovide high estimates for older pavements, a log function was found to provide low estimatesfor older pavements, and the square root function appeared to fit all the data better. The chosenexpression for rate of rutting agrees with rates of rutting utilized in other work (6, 7).
Rut depth measurements were obtained for each of the pavements evaluated and the maximumrut depths are shown in Table 2. The measured rut depths ranged from a low of 0.04 inches atsite 42 to a high of 1.65 inches at site 13. The maximum rut depth on a pavement identified asgood performing by the states was 0.51 inches and the minimum rut depth for a rutted pavementwas 0.30 inches. There was overlap in the rut depth measurements between observed good andrutted pavements and a single rut depth could not be identified as delineating between good andrutted.
Figure 4 shows the rate of rutting for the 30 sites having the lowest rate of rutting and the ratinggiven each pavement by the various participating states. The separation between good and ruttedpavements when rated subjectively appears to occur between 0.00020 and 0.00025 inches persquare root ESALS. Only one of the good pavements had a rate of rutting greater than 0.00023and two of the rutted pavements had a rate lower than 0.00023. Site 3 was one of the ruttedpavements with a rate of rutting higher than 0.00023, however, the primary mode of distress atthis site was raveling, caused by stripping, and not rutting. Therefore 0.00023 inches of rut depthper square root ESALS was identified as delineating between good and rutted pavements. Thisrate of rutting agrees closely with that identified by Kandhal et.al. (6) and Parker and Brown (7)in field studies of rutted pavements.
Location of Rutting
An attempt was made to quantify where in the pavement structure the rutting was occurring.When possible, trench cuts were made and the rutted pavements examined. From visualobservations it was determined that the majority of the rutting was occurring in the top 3 to 4inches of the pavements. In every case but one the amount of rutting in the base course wasinsufficient to measure.

Brown & Cross
19
Mix Design Parameters
The mix design parameters evaluated were asphalt content, voids total mix (VTM), voids in themineral aggregate (VMA), voids filled with asphalt cement (VFA), and Marshall stability andflow (Tables 3 and 4). Ten of the sites utilized a 75-blow Marshall mix design for the surfacemix and 22 of the sites used 50-blow Marshall mixes.
Table 11 shows the correlation coefficients for the rate of rutting and the mix design propertiesof the top layer. The table shows the correlation coefficients for both 50 and 75 blow mixestogether and separately. None of the mix properties evaluated had a good correlation with rate ofrutting.
Table 11. Summary of Correlations for Mix Design Variables Correlation with Rate of Rutting
All 50 Blow 75 BlowVariable R-Value n R-Value n R-Value n
Voids Total Mix -0.36 27 -0.30 18 -0.55 10Voids Mineral Aggregate -0.16 27 -0.13 18 -0.12 10Voids Filled Asphalt 0.32 27 0.27 18 0.48 10Marshall Stability -0.30 24 -0.35 16 -0.29 9Marshall Flow 0.14 23 -0.15 14 0.28 9
Figure 4. Subjective Performance Rating vs. Rate of Rutting

Brown & Cross
20
Stronger relationships were found between mix properties and rate of rutting when only the 75-blow mixes were evaluated. The best relationships were found between mix design VTM andmix design VFA. The relationship between VTM and rate of rutting has an R-square of 0.30 forall the data and 0.66 for the 75-blow mixes. The relationship is shown in Figure 5. There was norelationship found for the 50-blow mixes and that was expected since a 50 blow compactiveeffort is not sufficient for heavy duty pavements. Figure 6 shows the relationship between mixdesign VFA and rate of rutting (R2 = 0.23) for 75-blow mixes.
All of the pavements evaluated were carrying heavy truck traffic and as previously reported (13)should have been designed utilizing a 75-blow mix. Utilizing a 50-blow mix design would allowfor excessive asphalt content therefore causing the voids in-place to be too low afterdensification by traffic. Most states participating in this study have increased their mix designcompactive effort to 75 blows.
Table 12 shows the means and standard deviations for the mix design parameters compared toperformance. The data shows that good performing pavements had higher design VTM, higherVMA, lower VFA, and higher stability. This information is provided to show trends inperformance and these numbers in Table 12 should not be used to set specification requirements.
Figure 5. Mix Design Voids Total Mix vs. Rate of Rutting

Brown & Cross
21
Table 12. Summary of Mix Design Parameters Compared to PerformanceGood Rutted
Variable Mean Std. Dev. Mean Std. Dev.Voids Total Mix (%) 5.01 1.62 3.83 1.02Voids Mineral Aggregate 18.20 2.28 16.58 1.79Voids Filled (%) 72.31 8.78 76.85 5.79Marshall Stability (lbs) 2311 586 2100 387Marshall Flow (0.01 in) 10.2 2.86 9.7 1.49
These correlations developed for mix design properties have little practical meaning since mixproperties produced during plant production likely deviate from mix design properties.Nevertheless these relationships were developed to determine if a relationship exists betweenmix design properties and rutting and the results do follow the expected trend.
Figure 6. 75-Blow Mix Design Voids Filled with Asphaltvs. Rate of Rutting

Brown & Cross
22
Construction Data
The quality control or construction data summarized in Tables 5 and 6 show that someconstruction data were available for 32 of the 42 sites. The construction data represent the mixproperties immediately after construction prior to densification by traffic. For analysis, the datawas separated into three areas. These three areas are data from pavement cores, lab compacteddata from plant produced material and asphalt content and gradation analysis. Data frompavement cores consisted of voids total mix and unit weight to check initial compaction.Properties measured for lab compacted samples consisted of voids total mix, unit weight, andMarshall stability and flow. Lab compacted samples are used to evaluate and verify the mixdesign “as produced.”
One of the most important observations that was made with regards to construction testing is thelack of data. Construction history data from asphalt cores was available from 20 of 42 sites,however this data is incomplete for many of the sites.
Probably the most important test that can be conducted during QC/QA is to compact plantproduced material in the laboratory and to evaluate the air voids of these laboratory compactedsamples. Satisfactory compactive effort must be used for this test. Only 13 of 42 sites (31%)utilized laboratory compacted samples as a part of QA/QC procedures. Verification of mixtureproperties from laboratory compacted samples during construction is essential to ensure that asatisfactory pavement is constructed. More states are beginning to compact samples in thelaboratory during construction due to work performed by the FHWA field laboratory and due toincreased awareness by state DOTs. Measurement of the VTM in laboratory compacted mixturesis the most important test that can be conducted to evaluate expected performance.
Correlation coefficients for the construction mix properties, lab compacted mix properties, andrate of rutting for all sites were determined. The correlations were not highly significant becauseof the low number of 75-blow projects and insufficient data for some mix properties andtherefore the results are not presented here.
Mix Design Compactive Effort
Design of asphalt mixtures by the Marshall method is based on the assumption that thelaboratory compacted test samples will have a density approximately equal to the density of themixture in service after several years of traffic. Selection of the proper compaction level duringthe mix design phase is critical for proper pavement performance. If the mix design compactiveeffort is too low, excessive asphalt contents will be designed and rutting could develop as aresult of low in-place air voids due to a higher density in-place after traffic than achieved in themix design.
To evaluate the adequacy of the mix design compactive effort the mix design unit weights werecompared to the in-place unit weight. If the mix design compactive effort is adequate the unitweight in-place after traffic should be similar to the mix design unit weight.
Twenty-two of the layer 1 mixes were 50-blow mixes and 10 were 75-blow mixes. Figure 7shows the difference in pounds between the in-place unit weight and the mix design unit weight

Brown & Cross
23
for the 50-blow mixes. The in-place unit weight exceeded the mix design unit weight in 18 of 22sites or 82% of the time. Only four sites were below the mix design unit weight. Fifteen sitesexceeded the mix design unit weight by over 2 pounds per cubic foot (approximately onestandard deviation). Only five of 20 sites had in-place unit weight within plus or minus 2 poundsof the 50-blow mix design unit weight.
Figure 7. Difference in Pounds Between 80th Percentile In-Place Unit Weight andMix Design Unit Weight for 50-Blow Marshall Mix Designs

Brown & Cross
24
The 75-blow mixes are shown in Figure 8. Seven of 10 sites were over the mix design unitweight, but only three of ten by over 2 pounds per cubic foot. Seven of 10 sites were within plusor minus 2 pounds per cubic foot of the mix design unit weight.
All of the pavements evaluated carried high volumes of heavy truck traffic. Neither the 50-blownor 75-blow mixes had in-place weights within 2 pounds of the mix design unit weight in everycase. However, the 75-blow mixes had a much higher percentage within 2 pounds (70%) than the50-blow mixes (25%). It is obvious from these data that 50 blows per side is not an adequatecompactive effort for mixes subjected to heavy truck traffic and that mixes subjected to heavytruck traffic should be designed using 75-blow compactive effort.
Figure 8. Difference in Pounds Between 80th Percentile In-Place UnitWeight and Mix Design Unit Weight for 75-Blow Marshall Mix Designs
Brown & Cross
25
Data From Recompacted Samples
There is always a difference in the properties of a mix during mix design and during plantproduction. This difference at least partially accounts for the poor correlations between mixdesign parameters and performance. By evaluating the aggregate, asphalt content and gradationfrom cores and mix properties from recompacted material, the material and volumetric propertiesof the mix “as-placed” can be estimated. Ideally this information should be obtained during mixproduction but this information was generally not available. The estimated mixture and materialsproperties can then be utilized to determine the mixture properties that affect rutting.
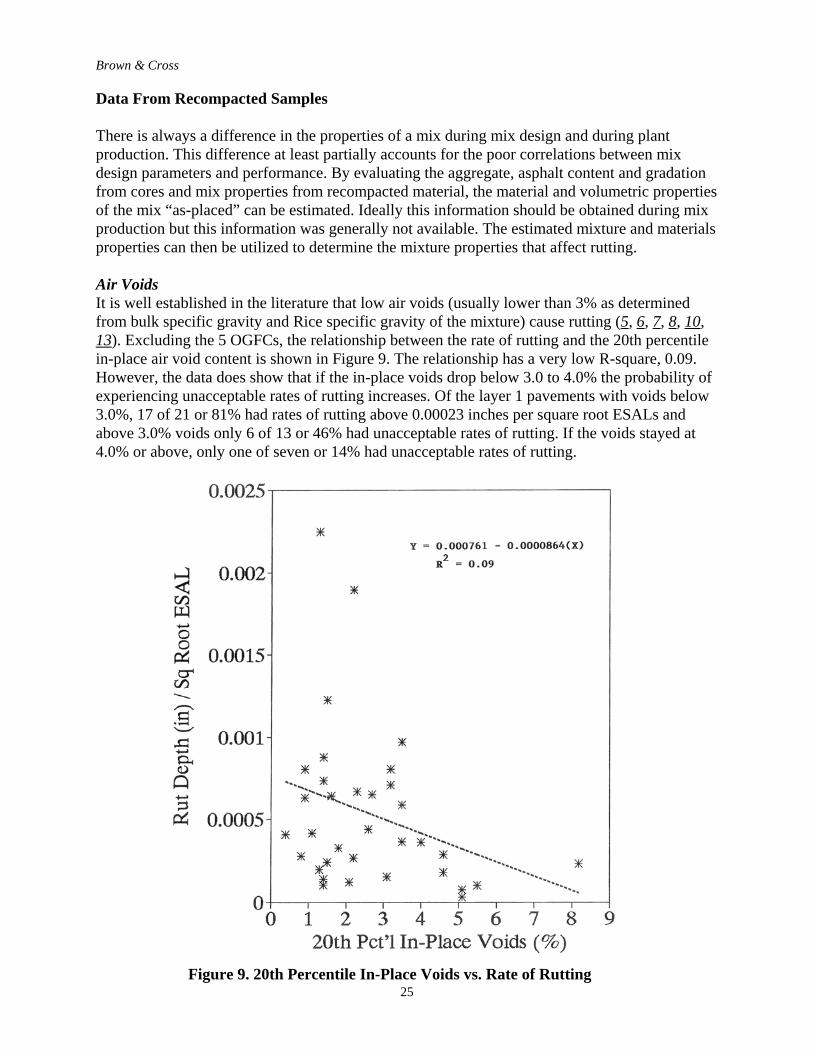
Air VoidsIt is well established in the literature that low air voids (usually lower than 3% as determinedfrom bulk specific gravity and Rice specific gravity of the mixture) cause rutting (5, 6, 7, 8, 10,13). Excluding the 5 OGFCs, the relationship between the rate of rutting and the 20th percentilein-place air void content is shown in Figure 9. The relationship has a very low R-square, 0.09.However, the data does show that if the in-place voids drop below 3.0 to 4.0% the probability ofexperiencing unacceptable rates of rutting increases. Of the layer 1 pavements with voids below3.0%, 17 of 21 or 81% had rates of rutting above 0.00023 inches per square root ESALs andabove 3.0% voids only 6 of 13 or 46% had unacceptable rates of rutting. If the voids stayed at4.0% or above, only one of seven or 14% had unacceptable rates of rutting.
Figure 9. 20th Percentile In-Place Voids vs. Rate of Rutting
Brown & Cross
26
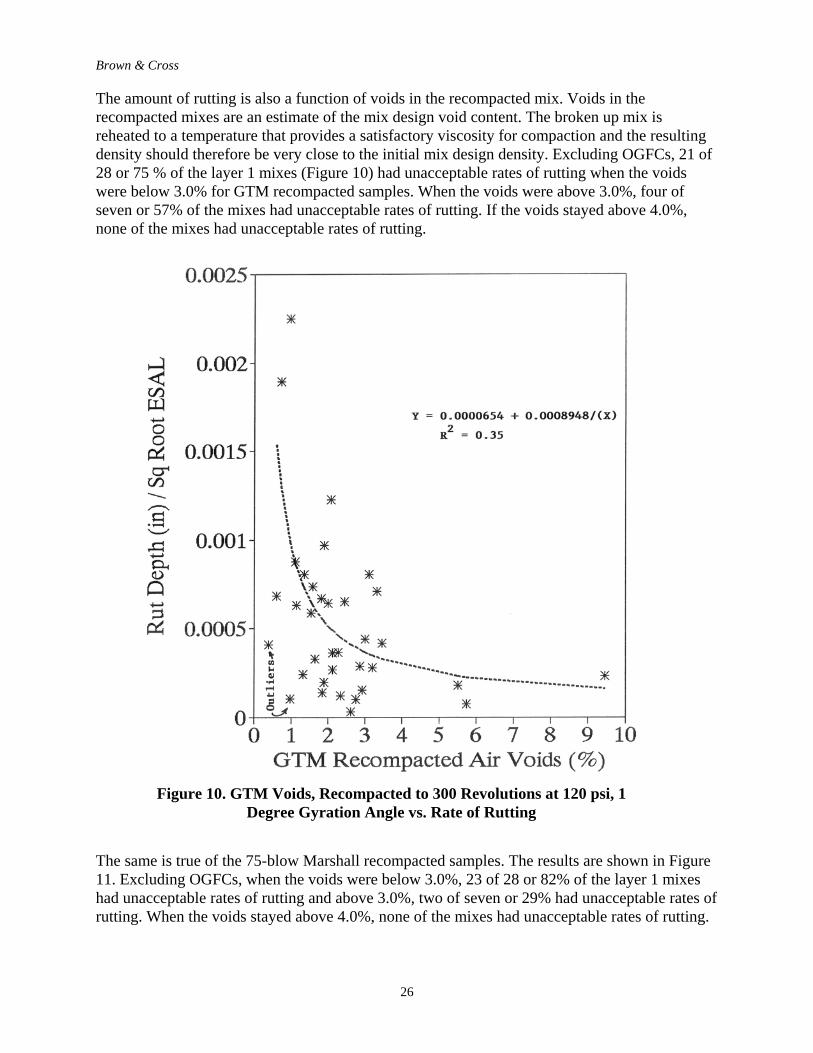
The amount of rutting is also a function of voids in the recompacted mix. Voids in therecompacted mixes are an estimate of the mix design void content. The broken up mix isreheated to a temperature that provides a satisfactory viscosity for compaction and the resultingdensity should therefore be very close to the initial mix design density. Excluding OGFCs, 21 of28 or 75 % of the layer 1 mixes (Figure 10) had unacceptable rates of rutting when the voidswere below 3.0% for GTM recompacted samples. When the voids were above 3.0%, four ofseven or 57% of the mixes had unacceptable rates of rutting. If the voids stayed above 4.0%,none of the mixes had unacceptable rates of rutting.
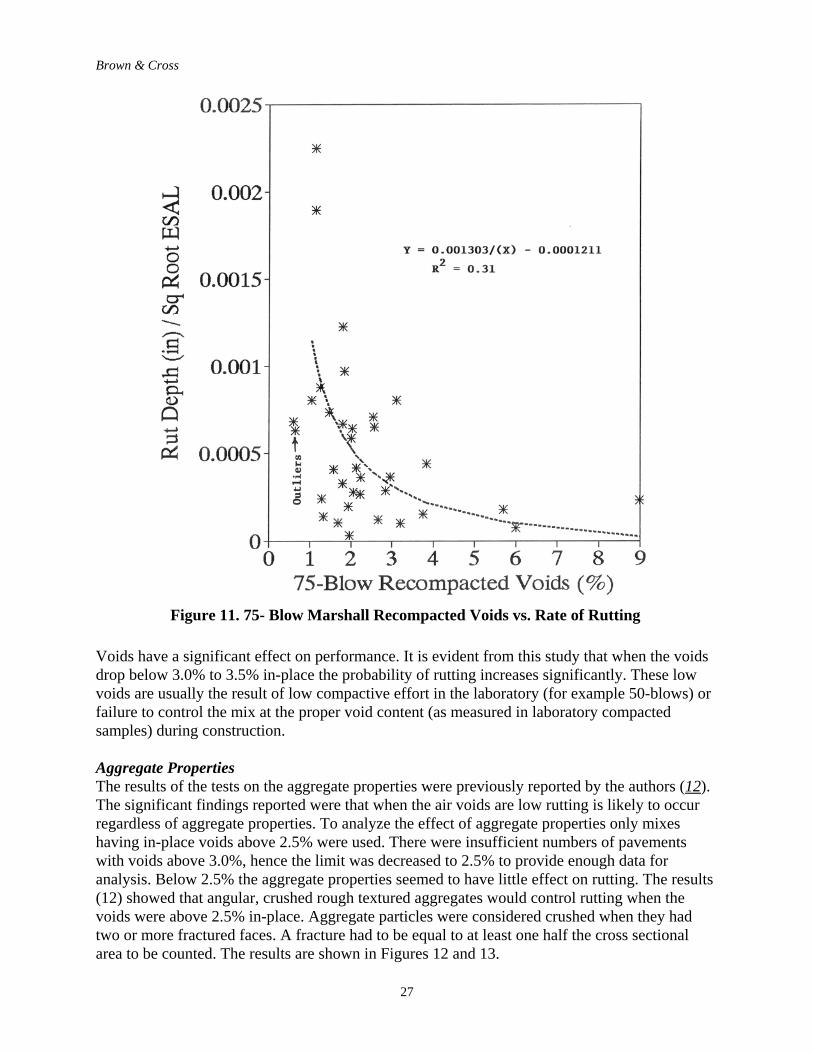
The same is true of the 75-blow Marshall recompacted samples. The results are shown in Figure11. Excluding OGFCs, when the voids were below 3.0%, 23 of 28 or 82% of the layer 1 mixeshad unacceptable rates of rutting and above 3.0%, two of seven or 29% had unacceptable rates ofrutting. When the voids stayed above 4.0%, none of the mixes had unacceptable rates of rutting.
Figure 10. GTM Voids, Recompacted to 300 Revolutions at 120 psi, 1Degree Gyration Angle vs. Rate of Rutting
Brown & Cross
27
Voids have a significant effect on performance. It is evident from this study that when the voidsdrop below 3.0% to 3.5% in-place the probability of rutting increases significantly. These lowvoids are usually the result of low compactive effort in the laboratory (for example 50-blows) orfailure to control the mix at the proper void content (as measured in laboratory compactedsamples) during construction.
Aggregate PropertiesThe results of the tests on the aggregate properties were previously reported by the authors (12).The significant findings reported were that when the air voids are low rutting is likely to occurregardless of aggregate properties. To analyze the effect of aggregate properties only mixeshaving in-place voids above 2.5% were used. There were insufficient numbers of pavementswith voids above 3.0%, hence the limit was decreased to 2.5% to provide enough data foranalysis. Below 2.5% the aggregate properties seemed to have little effect on rutting. The results(12) showed that angular, crushed rough textured aggregates would control rutting when thevoids were above 2.5% in-place. Aggregate particles were considered crushed when they hadtwo or more fractured faces. A fracture had to be equal to at least one half the cross sectionalarea to be counted. The results are shown in Figures 12 and 13.
Figure 11. 75- Blow Marshall Recompacted Voids vs. Rate of Rutting

Brown & Cross
28
Asphalt Cement PropertiesThe asphalt cements were recovered from the in-place cores to determine their properties. Theasphalt cement properties evaluated were viscosity at 140 and 275°F, penetration at 77 and 40°Fand asphalt content. The results of the correlation analysis are shown in Table 13.
None of the asphalt cement properties alone had a good correlation with rate of rutting. Thecorrelation improved when only those mixes with more than 2.5% in-place voids were analyzed.The best correlation with rutting was for penetration at 77°F with mixes above 2.5% voids in-place. So it appears that aggregate properties are important for controlling rutting but asphaltcement properties are not so important. The amount of asphalt cement, however, is extremelyimportant.
Figure 12. Coarse Aggregate (Plus No. 4) Two or More CrushedFaces vs. Rate of Rutting for Mixes with 20th Percentile In-Place
Voids Greater Than 2.5 Percent

Brown & Cross
29
Table 13. Summary of Correlations for Recovered Asphalt CementCorrelation with Rate of Rutting
All >25% VTMVariable R-Value n R-Value n
Viscosity 275°F -0.09 34 -0.22 14Viscosity 140°F -0.19 35 -0.34 15Penetration 77°F 0.09 35 0.39 15Penetration 40°F 0.35 33 0.35 14
Figure 13. NAA Uncompacted Voids vs. Rate of Rutting for Mixeswith 20th Percentile In-Place Voids Greater Than 2.5 Percent

Brown & Cross
30
Correlations with Recompacted Samples
Samples of the mixes were recompacted on both the GTM and with 75-blows per side with themanual Marshall hammer. The results of the correlation analysis for mix properties using bothcompactive efforts are shown in Table 14.
Table 14. Summary of GTM and 75-Blow MarshallGTM 75-Blow
Variable R-Value n R-Value nVoids Total Mix -0.36 35 -0.37 35Voids Mineral Agg. -0.08 35 -0.09 35Voids Filled Asphalt 0.40 35 0.41 35Marshall Stability -0.31 34 -0.39 34Marshall Flow 0.01 34 0.18 34GSI 0.36 35 N/A N/AGEPI 0.09 35 N/A N/AShear Strength -0.43 35 N/A N/A
N/A = Not Applicable
The GTM mix parameters of shear strength and GSI had higher correlations with rutting than thenormal Marshall design parameters of stability and flow. The best relationship found with ruttingwas GTM shear strength. The relationship is shown in Figure 14 and has an R-square of 0.52. Asthe shear strength decreases the rate of rutting increases. The relationship between GSI and rateof rutting is shown in Figure 15. The relationship has an R-square of 0.13 which is not high forprediction of rut depth but shows that as the GSI or plasticity of the mix increases the rate ofrutting increases.
The Marshall recompacted mix properties did not correlate well with rate of rutting. Thecorrelation coefficients are shown in Table 14. This data shows that VTM and VF are the besttwo mixture properties determined as part of the Marshall test that correlate with rutting.
Table 15 shows the means of the GTM recompacted parameters compared with performance.The results show that mixes with higher recompacted voids, higher stability, higher GTM shearstrength and higher VMA perform better. Mixes with lower voids filled and lower GEPI performbetter. It is likely that the high stability for good performing mixes was caused by the high voidsand increased oxidation and hence using stability of aged pavements to predict rutting is likely tobe misleading.
Table 16 shows the means of the Marshall recompacted parameters compared with performance.The results show that mixes with higher recompacted voids, higher VMA and higher stabilityperform better. Mixes with lower voids filled also perform better. Again, the measured highstability for good performing mixes was caused by the high voids and high rate of oxidation andcannot be used to predict rutting because the Marshall stability values from laboratorycompacted samples during construction will be lower than that for aged mixes.

Brown & Cross
31
Figure 15. GTM Recompacted Gyratory Shear Index (GSI)vs. Rate of Rutting
Figure 14. GTM Recompacted Shear Strength vs. Rateof Rutting

Brown & Cross
32
Table 15. Summary of GTM and 75-Blow Marshall RecompactedGTM 75-Blow
Variable Mean Std. Dev. Mean Std. Dev.Voids Total Mix Good 4.68 3.42 3.76 2.46
Rutted 1.92 0.88 1.92 0.78Voids Mineral Aggregate Good 17.74 2.51 17.23 2.18
Rutted 15.32 1.92 15.32 1.82Voids Filled Asphalt (%) Good 75.10 15.75 79.20 11.69
Rutted 87.44 5.68 87.32 5.31Marshall Stability (lbs) Good 3250 1302 4436 1230
Rutted 2846 690 3413 878Marshall Flow (0.01 in) Good 16.0 4.77 15.3 2.61
Rutted 16.2 4.21 16.1 3.95GSI Good 1.15 0.21 N/A N/A
Rutted 1.32 0.23GEPI Good 1.16 0.07 N/A N/A
Rutted 1.25 0.19Shear Strength (psi) Good 38.35 11.14 N/A N/A
Rutted 31.16 9.31N/A = Not Applicable
Table 16.
Rutting Models
From the information presented it is evident that there is no one parameter that can predict therate of rutting with any high degree of confidence. Therefore, it would be helpful if a modelcould be developed utilizing material parameters that would be available to the designer thatcould predict rutting.
The available data was investigated to determine if three to four independent variables could beused to predict rutting. The parameters selected for inclusion in the data base were mixproperties, aggregate gradation, aggregate properties, and asphalt cement properties that hadpreviously shown some correlation with rutting.
75-Blow Marshall ModelThe best multiple variable model determined for the 75-blow Marshall, aggregate and asphaltcement parameters contained the variables recompacted voids and NAA uncompacted voids.Sites 12, 13, 14 and 21 appear to be outliers. Utilizing them as such, the relationship has an R-square of 0.54 and is shown in Figure 16. The equation has the following form:

Brown & Cross
33
Where,P = Predicted Rate of Rutting (in./Square Root ESALs)NAA = NAA Uncompacted Voids, Method A, %, (individual test result)VTM = Marshall Recompacted Voids, %, (average of three samples)
GTM ModelThe best multiple variable model that could be found for the GTM, aggregate and asphalt cementparameters contained the variables GTM recompacted voids, GTM shear strength and NAAuncompacted void content. Sites 1 and 36 were identified as outliers for voids and shear strengthand utilizing them as such, the relationship has an R-square of 0.64 and is shown in Figure 17.Site 36 is identified on the plot as an outlier, however, site 1 which had a predicted rate of ruttingof over 0.008, is not shown on the plot. The equation has the following form:
Figure 16. Predicted Rate of Rutting (P) vs. Actual Rate of Ruttingfrom 75-Blow Marshall Recompacted Voids (VTM) and NAA
Uncompacted Voids (NAA)

Brown & Cross
34
Where,P = Predicted Rate of Rutting (in./Square Root ESALs)NAA = NAA Uncompacted Voids, Method A, % (individual test result)VTM = GTM Recompacted Voids, % (average of three samples)S = Shear Stress to Produce 1 Degree Angle, psi (average of three samples)
The above analysis shows that the GTM parameters can do a better job of predicting rutting thanthe Marshall parameters.
Aggregate ModelIt was previously shown by the authors (12) that when the in-place voids of the mix droppedbelow 2.5%, the aggregate properties had little effect on rate of rutting. Therefore, to determinethe effect aggregate properties had on rutting, it was necessary to evaluate mixes with high air
Figure 17. Predicted Rate of Rutting (P) vs. Actual Rate of Ruttingfrom GTM Recompacted Voids (VTM), GTM Shear Strength at 300
Revolutions (S), and NAA Uncompacted Voids (NAA)

Brown & Cross
35
voids. Based on all of the data the best method to control rutting is to insure quality of coarse andfine aggregate and to keep the voids above a minimum value. The best model reported by theauthors (12) for predicting rate of rutting from aggregate properties when the in-place voids weregreater than 2.5% included the percent of aggregate with 2 or more crushed faces for coarseaggregate (plus No. 4) and NAA Uncompacted voids. The plot is shown in Figure 18. Site 13appears as an outlier. Utilizing site 13 as such, the relationship has an R-square of 0.72. Therelationship has the following form:
P = 0.0031515- 0.0000035(CF) - 0.0005968 (NAA)
where,P = Predicted Rate of Rutting (in./square root ESALs)CF = Percent of Coarse Aggregate with 2 or more crushed faces (individual testresult)NAA = NAA Uncompacted Voids, Method A, % (individual test result)
Figure 18. Predicted Rate of Rutting (P) vs. Actual Rate of Rutting forPercent Coarse Aggregate with Two or More Crushed Faces (CF), and
NAA Uncompacted Voids (NAA) with In-Place VTM Greater Than2.5%
Brown & Cross
36
Model Combining Layer 1 and Layer 2 PropertiesAll of the above models have used the properties from the top layer to predict the rate of rutting.It is obvious that the properties from the second layer and lower layers in the pavement structureaffect the amount of rutting and this was seen in many of the trenches. An attempt was made tocombine the properties of the first two layers to predict rutting. Several models were attemptedincluding averaging the properties of the two layers, using a weighted average based on theaverage shearing stress in each layer, and entering each property of each layer separately. Theanalysis was unsuccessful in developing a more statistically significant model than the modelsdeveloped utilizing the material properties of the top layer only.
CONCLUSIONS
Based on the data obtained in this study the following conclusions are warranted.1. Sixty-nine percent of the pavements evaluated that were designed with the Marshall
method utilized a 50-blow compactive effort. This resulted in high asphalt contentand led to low in-place voids after traffic and subsequently rutting.
2. Construction quality control documentation was not adequate for the paving projectsstudied herein. Thirty-three percent of the sites had no construction history available.Only 38% of the sites utilized laboratory compacted samples of the asphalt mixturesfrom the mixing plant during construction to verify that the air voids were within anacceptable range. Fifty-three percent of the sites that measured voids in laboratorycompacted samples had voids less than 3%.
3. Most of the rutting observed from trench cuts of rutted pavements occurred in the top3-4 inches of the HMA. Hence, high quality mixtures should be required in the toptwo layers.
4. In-place air void contents above approximately 3.0% are needed to decrease theprobability of premature rutting throughout the life of the pavement. In-place air voidcontents below approximately 3.0% greatly increase the probability of prematurerutting. The asphalt mixture must be placed with a void content significantly above3.0% (usually 5-7%) using a reasonably high compactive effort to insure that thevoids in the mix stay above 3.0% during traffic.
5. The shear strength of the recompacted mix as indicated by the GTM roller pressurehad the best correlation with rutting of any single factor.
6. If the in-place air voids are above 2.5% the angularity of the aggregate as measuredby percent of coarse aggregate (plus No.4) with 2 or more crushed faces and NAAUncompacted Voids for the fine aggregate (passing No.4) are highly correlated torate of rutting.
7. The properties of the asphalt cements extracted from the mixtures are not closelyrelated to rutting. The amount of asphalt cement is of primary importance but theproperties of the asphalt cement are of secondary importance.
8. A rate of rutting of 0.00023 inches per square root ESALS delineated between goodand rutted pavements for the pavements evaluated.
9. Rutting on high volume roadways can be prevented if angular coarse and fineaggregates are used and if the air voids in the mixture do not fall belowapproximately 3.0%.

Brown & Cross
37
RECOMMENDATIONS
Based on the data obtained in this study the following recommendations are made.1. Pavements for heavy truck trafficked pavements should be designed utilizing a 75-
blow manual Marshall mix design or equivalent and the optimum asphalt cementcontent selected to give 4.0% VTM if the Marshall method is used.
2. Pavements and mix design compactive effort should be evaluated to ensure that themix design unit weight is approximately equal to the in-place density after at leasttwo to three years of traffic. If not the mix design compactive effort should bemodified.
3. The aggregate gradation deviates from the mix design during the constructionprocess. Therefore, samples of the asphalt mixtures from the mixing plant should becompacted in the laboratory, utilizing the proper compactive effort, duringconstruction to verify that the air voids are within an acceptable range. If the air voidsare not within an acceptable range adjustments to the mix should be made.
4. Mixtures for heavy truck trafficked pavements are best evaluated on the GTM at 300revolutions, 1 degree gyration angle and 120 psi to determine the susceptibility forrutting.
5. Pavements should be designed with rough textured angular aggregates to minimizerutting. Aggregate properties should be selected based on the model shown to providedesired performance.

Brown & Cross
38
REFERENCES
1. Middleton, D.R., F.L. Roberts, and T. Chira-Chavala, “Measurements and Analysis ofTruck Tire Pressures on Texas Highways,” Transportation Research Record 1070,Transportation Research Board, Washington, D.C., 1986, pp. 1-8.
2. Kim,O. and C.A.Bell, “Measurement and Analysis of Truck Tire Pressures inOregon,’Transportation Research Record 1207, Transportation Research Board,Washington, D.C., 1988, pp. 100-110.
3. Hudson,S.W and S.B. Seeds, “Evaluation of Increased Pavement Loading and TirePressures,” Transportation Research Record 1207, Transportation Research Board,Washington, D.C., 1988, pp. 197-206.
4. ____________, “Proceedings, A Symposium/Workshop on High Pressure Truck Tires,”American Association of State Highway and Transportation Officials and FederalHighway Administration, Austin, Texas, February 1987.
5. Ford, Miller C., “Development of a Rational Mix Design Method for Asphalt Bases andCharacteristics of Arkansas Asphalt Mixtures,” FHWA Report No. FHWA/AR-85/004,Arkansas Highway and Transportation Department, July 1985.
6. Kandhal, Prithvi, Stephen A. Cross, and E.R. Brown, “Evaluation of BituminousPavements for High Pressure Truck Tires,” FHWA Report No. FHWA-PA-90-008+87-01, Pennsylvania Department of Transportation, December 1990.
7. Parker, Frazier and E.R. Brown, “Effects of Aggregate Properties on Flexible PavementRutting in Alabama,” Effects of Aggregate and Mineral Fillers on Asphalt Performance,ASTM STP 1147, Richard C. Meininger, Ed., American Society for Testing andMaterials, Philadelphia, PA 1992.
8. Huber, G.A. and G.H. Heiman, “Effects of Asphalt Concrete Parameter on RuttingPerformance: A Field Investigation,” Proceedings, Association of Asphalt PavingTechnologists, Volume 56, 1987, pp. 33-61.
9. Cross, Stephen A. and E. Ray Brown, “A National Study of Rutting in AsphaltPavements,” NCAT Draft Report No. 91-8, National Center for Asphalt Technology,Auburn University, Alabama, 1991.
10. Brown, E.R. and Stephen A. Cross, “A Study of In-Place Rutting of Asphalt Pavements,”Proceedings, The Association of Asphalt Paving Technologists, Volume 59, 1990.
11. Meininger, Richard C., “Proposed Method of Test for Particle Shape and Texture of FineAggregate Using Uncompacted Void Content,” The National Aggregate Association,Silver Springs, MD, March 1989.
12. Cross, Stephen A. and E.R. Brown, “Selection of Aggregate Properties to MinimizeRutting of Heavy Duty Pavements,” Effects of Aggregate and Mineral Fillers on AsphaltPerformance, ASTM STP 1147, Richard C. Meininger, Ed., American Society forTesting and Materials, Philadelphia, PA 1992.
13. Brown, E.R. and Stephen A. Cross, “Comparison of Laboratory and Field Density ofAsphalt Mixtures,” TRR 1300, Transportation Research Board, Washington, D.C., 1991.