Embed Size (px)
Citation preview

A Model of Intention to Use Mobile
Government Services
Hamed Ahmed Saud Al-Busaidi
School of Management and Information Systems,
Faculty of Business and Law, Victoria University
Submitted in fulfilment of the requirements of the degree
of Doctor of Philosophy
June 2012

ii
Abstract
The aim of this research was to develop and validate a model which was designed to be useful
for many countries considering delivery of mobile government (m-Government) services as the
literature had not revealed any comprehensive model that is specifically used in the m-
Government services context. The existence of this gap encouraged this research to empirically
test and validate the combination of the Diffusion of Innovations (DOI) model and the
Technology Acceptance Model (TAM) as well as external variables including Perceived
Security, Perceived Trustworthiness, Perceived Enjoyment and Personal Innovativeness.
Therefore, in order to fill the gap, this research developed a validated Model with relevant
hypotheses which was tested for its predictive value.
Two stages of data collection were used in this research; firstly large scale survey
questionnaires for the quantitative stage and secondly semi-structured interviews for the
qualitative stage. The former were used to test the model and confirm the hypotheses, whereas
the latter were used to elaborate findings from the survey questionnaires and provide further
confirmation for the research model and hypotheses. The data were gathered from Oman and
specifically Muscat the capital as the researcher is from Oman and could easily have access to
relevant data. The advanced technique of Structural Equation Modeling (SEM) was used for
the data analysis.
The key finding of this research is that Personal Innovativeness is considered to be the most
influential variable on the Intention to Use, whereas, Perceived Ease of Use is the least
significant variable. Overall, amongst the nine variables tested against the Intention to Use m-
Government services, only five variables were found to be significant and therefore these five
variables were incorporated in the Intention to Use proposed model. These variables were
Personal Innovativeness, Compatibility, Perceived Trustworthiness, Observability and
Perceived Enjoyment.

iii
Student Declaration
“I, Hamed Al-Busaidi, declare that the PhD thesis entitled ‘A Model of Intention to Use
Mobile Government Services’ is no more than 100,000 words in length including quotes and
exclusive of tables, figures, appendices, bibliography, references and footnotes. This thesis
contains no material that has been submitted previously, in whole or in part, for the award of
any other academic degree or diploma. Except where otherwise indicated, this thesis is my own
work”.
Signature Date: 29 June 2012

iv
Acknowledgments
Thanks be to God for everything
I would like to dedicate this thesis to my beloved country, Oman and His Majesty Sultan
Qaboos bin Said, The Sultan of Oman
I would like to express my sincere appreciation to my eldest brother (Al-Sayyid Mohammed bin
Ahmed Al-busaidi) for his motivation and encouragement
I would like to express my warmest gratitude to my supervisor Associate Professor Geoff
Sandy for his tremendous guidance, motivation and continuous support. Without him this
research would have not been achievable
I would like to express my deepest thanks to my beloved mother, my beloved wife, my two little
angels Alhoor and Hutham, my grandmother (who encouraged me to start this thesis but did
not live long enough to see it finished), my sisters and family for their motivation and
encouragement
I would like to express my sincere appreciation to my employer (Diwan of Royal Court) for
sponsoring my postgraduate education (Masters and PhD)
I would like to thank my Co-supervisor Professor Michael McGrath and my External
Supervisor Dr.Hafedh Alshihi for their kind guidance and assistance
I would like to thank my PhD friends in Australia, Oman and the United Kingdom for their
motivation throughout the PhD journey
I would like to thank Dr.Rod Turner and Dr.Yousef Alhinai for their kind assistance with the
Data Analysis part using PLS application and Ms.Tina Jeggo in the Faculty of Business and
Law for her kind assistance and support to make this research move as smoothly as possible
God bless you all

v
List of Publications
ALBUSAIDI, H. & ALSHIHI, H. M-Government Initiatives in Oman: Technology
Acceptance and Dissemination. In: KUSHCHU, I., ed. mLife 2009: Exploring the influence of
mobile technologies on life 2009 Barcelona, Spain. mGCI Mobile Government Consortium
International.

vi
Table of Contents
Abstract ....................................................................................................................................... ii
Student Declaration .................................................................................................................. iii
Acknowledgments ..................................................................................................................... iv
List of Publications ..................................................................................................................... v
Table of Contents ...................................................................................................................... vi
List of Figures ........................................................................................................................... xii
List of Tables ........................................................................................................................... xiii
Definitions of Terms and Acronyms ...................................................................................... xiv
CHAPTER 1. ................................................................................................................ 1
RESEARCH PURPOSE AND RESEARCH OUTCOMES ........................................... 1
1.1. Research Purpose ........................................................................................................... 1
1.2. Research Aims and Questions ....................................................................................... 2
1.3. Contribution to Knowledge ........................................................................................... 3
1.3.1. Contribution to Theory ............................................................................................. 3
1.3.2. Contribution to Practice ........................................................................................... 4
1.4. Research Method ............................................................................................................ 5
1.5. Research Outcomes ........................................................................................................ 6
1.6. Thesis Structure ............................................................................................................. 7
CHAPTER 2. ................................................................................................................ 8
MOBILE GOVERNMENT THEORY AND PRACTICE ................................................. 8
2.1. Introduction .................................................................................................................... 8
2.2. Mobile Government ....................................................................................................... 8
2.2.1. Definition ............................................................................................................... 12

vii
2.2.2. Applications and Classifications ............................................................................ 13
2.2.3. Enabling Technologies ........................................................................................... 15
2.2.4. Drivers and Barriers ............................................................................................... 16
2.3. M-Government Worldwide ......................................................................................... 20
2.3.1. Developed Countries .............................................................................................. 21
2.3.2. Developing Countries ............................................................................................. 25
2.4. Diffusion of Innovations (DOI) ................................................................................... 28
2.5. Technology Acceptance Model (TAM) ....................................................................... 38
2.6. External Variables ........................................................................................................ 41
2.7. Summary ....................................................................................................................... 42
CHAPTER 3. .............................................................................................................. 43
A MODEL OF INTENTION TO USE MOBILE GOVERNMENT SERVICES .............. 43
3.1. Introduction .................................................................................................................. 43
3.2. Research Model ............................................................................................................ 44
3.2.1. Relative Advantage ................................................................................................ 46
3.2.2. Compatibility .......................................................................................................... 47
3.2.3. Complexity/Perceived Ease of Use ........................................................................ 48
3.2.4. Trialability .............................................................................................................. 49
3.2.5. Observability .......................................................................................................... 49
3.2.6. Intention to Use ...................................................................................................... 50
3.3. Perceived Trustworthiness .......................................................................................... 51
3.4. Perceived Security ........................................................................................................ 52
3.5. Perceived Enjoyment ................................................................................................... 53
3.6. Personal Innovativeness ............................................................................................... 54
3.7. Demographics ............................................................................................................... 55
3.8. Summary ....................................................................................................................... 58
viii
CHAPTER 4. .............................................................................................................. 59
RESEARCH METHOD AND REALISATION ............................................................. 59
4.1. Introduction .................................................................................................................. 59
4.2. Research Aims and Expected Outcomes .................................................................... 59
4.3. Research Paradigm ...................................................................................................... 61
4.4. Research Design ........................................................................................................... 68
4.5. Case Study: Oman Overview ...................................................................................... 72
4.5.1. Geography and Regions ......................................................................................... 73
4.5.2. Population .............................................................................................................. 74
4.5.3. Oman Economic Background ................................................................................ 74
4.5.4. Oman: ICT Sector .................................................................................................. 76
4.6. Data Collection ............................................................................................................. 78
4.6.1. Survey Design ........................................................................................................ 79
4.6.2. Survey Sample ....................................................................................................... 85
4.6.3. Survey Pilot Study ................................................................................................. 88
4.6.4. Interview Design .................................................................................................... 91
4.6.5. Interviewee Selection ............................................................................................. 91
4.6.6. Interview Pilot Study ............................................................................................. 93
4.7. Validity and Reliability ................................................................................................ 94
4.7.1. Content Validity ..................................................................................................... 94
4.7.2. Construct Validity .................................................................................................. 95
4.7.3. Reliability ............................................................................................................... 96
4.7.4. External Validity .................................................................................................... 96
4.8. Data Analysis ................................................................................................................ 97
4.8.1. Survey analysis ...................................................................................................... 97
4.8.2. Interview analysis .................................................................................................. 99

ix
4.9. Ethical Considerations ............................................................................................... 102
4.10. Summary ..................................................................................................................... 103
CHAPTER 5. VALIDATION OF THE RESEARCH MODEL .................................... 105
5.1. Introduction ................................................................................................................ 105
5.2. Analysis of Demographic Characteristics ................................................................ 105
5.2.1. Gender .................................................................................................................. 105
5.2.2. Age ....................................................................................................................... 108
5.2.3. Education .............................................................................................................. 111
5.3. Distribution of Latent Variables ............................................................................... 113
5.4. Construct Specification Accuracy ............................................................................. 114
5.5. Measurement Model ................................................................................................... 117
5.5.1. Convergent Validity ............................................................................................. 118
5.5.2. Discriminant Validity ........................................................................................... 119
5.6. Structural Model ........................................................................................................ 121
5.6.1. Confirmation of Hypotheses ................................................................................ 123
5.7. Summary ..................................................................................................................... 126
CHAPTER 6. ............................................................................................................ 127
DISCUSSION OF FINDINGS ................................................................................... 127
6.1. Introduction ................................................................................................................ 127
6.2. Key findings of survey ................................................................................................ 127
6.2.1. The impact of Relative Advantage on Intention to Use ....................................... 128
6.2.2. The impact of Compatibility on Intention to Use ................................................. 130
6.2.3. The impact of Perceived Ease of Use on Intention to Use ................................... 132
6.2.4. The impact of Trialability on Intention to Use ..................................................... 133
6.2.5. The impact of Observability on Intention to Use ................................................. 134
6.2.6. The impact of Perceived Trustworthiness on Intention to Use ............................ 135

x
6.2.7. The impact of Perceived Security on Intention to Use ........................................ 136
6.2.8. The impact of Perceived Enjoyment on Intention to Use .................................... 137
6.2.9. The impact of Personal Innovativeness on Intention to Use ................................ 138
6.3. Key findings of Demographic Variables .................................................................. 138
6.3.1. The Influence of Demographic Variables on Relative Advantage ...................... 139
6.3.2. The Influence of Demographic Variables on Compatibility ................................ 140
6.3.3. The Influence of Demographic Variables on Perceived Ease of Use .................. 141
6.3.4. The Influence of Demographic Variables on Trialability .................................... 141
6.3.5. The Influence of Demographic Variables on Observability ................................ 142
6.3.6. The Influence of Demographic Variables on Perceived Trustworthiness ........... 142
6.3.7. The Influence of Demographic Variables on Perceived Security ........................ 143
6.3.8. The Influence of Demographic Variables on Perceived Enjoyment .................... 143
9.3.6. The Influence of Demographic Variables on Personal Innovativeness ............... 144
6.4. Key Findings of Interviews ........................................................................................ 144
6.4.1. The impact of Relative Advantage on Intention to Use ....................................... 145
6.4.2. The impact of Perceived Ease of Use on Intention to Use ................................... 147
6.4.3. The impact of Trialability on Intention to Use .................................................... 150
6.4.4. The impact of Perceived Security on Intention to Use ........................................ 152
6.5. Model Refinement ...................................................................................................... 153
6.6. Summary ..................................................................................................................... 156
CHAPTER 7. ............................................................................................................ 157
CONCLUSION AND FUTURE RESEARCH ............................................................ 157
7.1. Introduction ................................................................................................................ 157
7.2. Implications ................................................................................................................ 157
7.2.1. Theoretical implications ....................................................................................... 158
7.2.2. Practical implications ........................................................................................... 160

xi
7.3. Limitations and future research directions .............................................................. 162
REFERENCES ......................................................................................................... 164
APPENDIX A: PLAIN LANGUAGE STATEMENT – QUESTIONNAIRE ................. 184
APPENDIX B: QUESTIONNAIRE INSTRUMENT ................................................... 186
APPENDIX C: DATE ANALYSIS FOR QUESTIONNAIRE ..................................... 193
APPENDIX D: PLAIN LANGUAGE STATEMENT - INTERVIEWS ......................... 200
APPENDIX E: CONSENT FORM FOR PARTICIPANTS INVOLVED IN RESEARCH ................................................................................................................................. 202
APPENDIX F: INTERVIEW QUESTIONS (GUIDELINE) ......................................... 205
APPENDIX G: CONSTRUCT SPECIFICATION ACCURACY ................................. 208

xii
List of Figures
Figure 2.1 A Model of five stages in the innovation-decision process 30
Figure 3.1 A conceptual model used in this study 45
Figure 4.1 Sequential Explanatory Designs 67
Figure 4.2 Research Design used in this Research 70
Figure 4.3 The data analysis approach used in the qualitative method 101
Figure 5.1 Sample distribution by gender 106
Figure 5.2 Sample distributions by age (years) 109
Figure 5.3 Sample distribution by educational level 111
Figure 5.4 A simplified representation of how reflective and formative
constructs are drawn in structural equation modeling
115
Figure 5.5 Measurement Model 117
Figure 5.6 The bootstrapping results 123
Figure 6.1 The proposed model of Intention to Use m-Government
services
155

xiii
List of Tables
Table 2.1 Key Global Telecom Indicators for the World Telecommunication Service
Sector in 2010
20
Table 2.2 Mobile Government Services in Oman 27
Table 2.3 Comparison of Adoption and Diffusion Models 34
Table 2.4 Studies utilizing Rogers’s DOI Measurement Attributes 37
Table 4.1 Main Differences between Positivism and Interpretivism 63
Table 4.2 Advantages of Mixed Method Approaches 65
Table 4.3 Main Differences between quantitative and qualitative approaches 71
Table 4.4 Fixed and Mobile Sectors 78
Table 4.5 An example of the 5-point Likert scale 81
Table 4.6 An example of nominal scale multiple-choice format 82
Table 4.7 Measures for constructs used in this study 84
Table 4.8 Seven stages in selection of research sample 85
Table 4.9 Profile of Participants 93
Table 4.10 The candidates for the Pilot Test 94
Table 5.1 The relationship between all variables within gender groups 107
Table 5.2 The relationship between all variables within age groups 110
Table 5.3 The relationship between all variables and educational level 112
Table 5.4 The un-standardised PLS scores of all variables in the research model 113
Table 5.5 Decision rules to identify formative- vs. Reflective-indicator constructs 116
Table 5.6 Convergent Validity of Constructs 118
Table 5.7 The loadings of each item with each latent variable 120
Table 5.8 Correlations among constructs and the square root of AVEs 121
Table 5.9 Variance R2 square for dependent variables 122
Table 5.10 Hypotheses confirmation results 124
Table 6.1 Ranking order of the most predictive values on the intention to use 154
xiv
Definitions of Terms and Acronyms
AVE Average Variance Extracted. This is a measure of the shared or common variance in
a Latent Variable (LV), which is the amount of variance that is captured by the LV
in relation to the amount of variance due to its measurement error (Fornell &
Larcker 1981).
Beta Value (β) Beta is a quantitative measure of the volatility (riskiness) of a given share.
Bootstrapping
Analysis
This is a computer-based method for assigning measures of accuracy to sample
estimates (Efron & Tibshirani 1994).
CR Composite reliability is a measure of the internal consistency of the indicators,
depicting the extent to which they indicate the common latent construct (Hair,
Anderson, Tatham & Black 1998).
CT Complexity refers to ‘the degree to which the users perceive an innovation relatively
difficult to understand and use’ (Rogers 2003, p.16).
COM Compatibility is ‘the degree to which an innovation is perceived by users as
consistent with their existing values, past experiences, and the needs of potential
adopters’ (Rogers 2003, p.15).
DOI Diffusion of Innovations is a theory that seeks to explain how, why, and at what rate
new ideas and technology spread through cultures.
GPRS General Packet Radio Service.
GDP Gross Domestic Product.
ITA Information Technology Authority. This is responsible for implementing national IT
infrastructure projects and supervising all projects related to implementation of the
Digital Oman Strategy while providing professional leadership to various other e-
Governance initiatives of the Sultanate of Oman.
ITTS Information Technology Technical Secretariat.
Latent
Variables
Variables or constructs that are not directly observed, for instance, preferences,
attitudes, behavioural intentions and personality traits.
NITC National Information Technology Committee.
Nawras The second internet and mobile service provider in Oman.
NVivo The NVivo program is used for the analysis of both unstructured and semi structured
interviews in qualitative research.
xv
Nomological
Method
It is a method that is used for formative models in order assures the validity of
constructs (Jarvis et al 2003).
OmanTel Oman Telecommunication, the first official internet and mobile service provider in
Oman.
OBSV Observability is ‘the degree to which the results of an innovation are visible to others
and how easily the benefits can be communicated to others (Rogers 2003, p.16).
PENJ Perceived Enjoyment is ‘the extent to which the activity of using a certain
technology is perceived as being enjoyable in its own right, apart from any
performance consequences that may be anticipated ‘(Davis, Bagozzi &
Warshaw1992, p.1113).
Positivism Positivism is a philosophy, which suggests that a single reality exists, which is
objectively measurable, inherently understandable and outcome oriented (Kuhn
1996).
PEOU Perceived Ease of Use is ‘the degree to which a person believes that using a
particular system would be free from effort’ (Davis 1989, p.320).
PINOV Personal Innovativeness is ‘the degree to which an individual or other unit of
adoption is relatively earlier in adopting new ideas than other members of a social
system‘(Rogers 2003, p.22).
PCI Perceived Characteristics of Innovations. These include, Relative Advantage,
Compatibility, Complexity, Trailability and Observability.
PTT Perceived Trustworthiness is defined, as ‘the perception of confidence in the
electronic marketer’s reliability and integrity’ (Bélanger, Janine, & Wanda 2002,
p.252).
PDAs Personal Digital Assistant, also known as Personal Data Assistance that works as a
personal information manager.
PLS Partial Least Squares is sometimes called ‘component-based SEM’. It is a predictive
technique, which can handle many independent variables, even when predictors
display multicollinearity.
RA Relative Advantage is ‘the degree to which an innovation is perceived by users as
better than the idea it supersedes’ and can be measured in terms of economic and
social factors’ (Rogers 2003, p.15).
SPSS Statistical Package for the Social Sciences. This is a computer program used for
survey authoring and deployment, data mining, text analytics, statistical analysis,

xvi
and collaboration and deployment (batch and automated scoring services).
SEM Structural Equation Modeling is a technique for analysing data that is confirmatory
in nature and where the variables interact simultaneously with each other (Kelloway
1998).
T-Statistics A ratio of the departure of an estimated parameter from its notional value and its
standard error used in hypothesis testing.
TRA Telecommunication Regulatory Authority. This is responsible for the provision and
promotion of telecommunication services in Oman.
TRI Trialability is degree to which an innovation may be experimented with prior to
adoption (Rogers 2003, p.16).
Wi-Fi Wireless Fidelity is a local area network that utilizes high frequency radio signals in
order to transmit and receive data over distances.
WAP Wireless Application Protocol.
1
Chapter 1.
Research purpose and Research Outcomes
1.1. Research Purpose
Mobile Government is the application of new mobile technologies in developing
countries, in contrast to western countries where it has existed for a relatively long time.
It aims to improve the quality of life. However, despite the essence of technology being
to make people’s lives easier, new mobile technologies are not always accepted,
especially in developing countries. This may be due to poor education, the high cost of
technology, its complexity of use, or its incompatibility with values and beliefs.
Therefore, in order to overcome these barriers, governments in developing countries
need to implement mobile services that are seen to be directly in accordance with their
citizens’ needs.
The purpose of this research is to develop and validate a model of intention to use
mobile government (m-Government) services as the literature has not revealed any
comprehensive model that is specifically used for m-Government services. The existence
of this gap in the adoption and intention to use m-Government services context
encouraged this research to empirically test and validate the combination of the
Diffusion of Innovations (DOI) model and the Technology Acceptance Model (TAM) as
well as external variables including Perceived Security, Perceived Trustworthiness,
Perceived Enjoyment and Personal Innovativeness. These variables were then
synthesised into a conceptual model and then the model is tested for its predictive value.
Therefore, in order to fill the gap, this research develops a validated model with relevant
hypotheses. This is to define what factors influence/impact on the intention to use m-
2
Government services. The proposed model of this research is intended to be a useful
model for many countries considering delivery of m-Government services in order to
explain the factors that influence/impact the intention to use m-Government services.
The proposed model will contribute to the existing knowledge because it incorporates
many unexplored dimensions that influence/impact the intention to use m-Government
services. The decision makers who are involved in m-Government services projects need
research that can assist the provision of relevant guidelines for implementation of
comprehensive m-Government services. Based on knowledge gained from this research,
the decision makers will better understand the challenges they will face in the
implementation of m-Government services and the implementation of these services will
be more effective.
1.2. Research Aims and Questions
The major aim of this research is to develop and validate a model, which is designed to
be useful for many countries considering delivery of m-Government services, which can
assist any decision makers who are involved in m-Government services projects to better
understand the factors influencing the intention to use m-Government services. This
study uses models of DOI and TAM as well as external variables including Perceived
Security, Perceived Trustworthiness, Perceived Enjoyment and Personal Innovativeness
in order to test its applicability in the context of the intention to use m-Government
services. Specifically, the research aims to:
Examine the factors influencing the intention to use m-Government services;
Examine the perceived characteristics of m-Government services as perceived by
users and non-users, including relative advantage, compatibility, complexity,
trialability, and observability;
Examine the perceived trustworthiness, perceived security, personal
innovativeness and perceived enjoyment of m-Government services as perceived
by users and non-users towards their intention to use; and

3
Examine the influence of demographic variables including, gender, age and
education, of users and non-users in their intention to use m-Government
services.
Accordingly, the following research questions are identified:
What are the critical adoption factors to the use of m-Government services?
How could these factors influence intention to use m-Government services?
To answer the previous research questions, several related questions are recognized as
follows:
How could DOI and TAM models contribute to the development of a model of
intention to use m-Government services?
What are the other factors that contribute to the intention to use m-Government
services?
How do demographics variables influence intention to use m-Government
services?
1.3. Contribution to Knowledge
The proposed study will contribute to knowledge through the application and testing of
the applicability of an important diffusion of innovations’ theory. The theory is based on
the seminal work of Rogers’ Diffusion of Innovations and tested for its predictive values
of intention to use m-Government services. The study will be the first to present an
integrated model of Diffusion of Innovations (DOI) and Technology Acceptance Model
(TAM) as well as external variables including perceived trustworthiness, perceived
security, personal innovativeness and perceived enjoyment into one single model.
1.3.1. Contribution to Theory
Theoretically, this study examines the applicability of the DOI model, TAM model as
well as external variables including perceived trustworthiness, perceived security,

4
personal innovativeness and perceived enjoyment in order to determine the most
predictive variable in explaining the impact of intention to use m-Government services.
It therefore the feedback from this research provides more insights to the researchers to
determine the most important variable if any that will influence the intention to use m-
Government services. In addition, testing the characteristics of the individual (e.g.
personal innovativeness) will assist researchers in the field of m-Government services to
better understand the characteristics of individuals who are more willing to use m-
Government services. Further, external variables have been derived from the literature
that seem to be critical variables in the adoption of m-Government services and these
will be used in this study as an extension of Rogers’ model. Ultimately a newly
developed model of Intention to Use m-Government services has been produced where
future m-Government services can be tested. This model is believed to be the first
adoption model in this domain which combines factors from seminal works (DOI and
TAM) and technology specific factors drawn from the literature.
1.3.2. Contribution to Practice
In practical terms, this study will assist the decision makers who are involved in m-
Government projects in general and mobile service providers in particular to better
understand the applicability of these variables of the DOI model and implement m-
Government services successfully. In addition, the study will assist other stakeholders in
the m-Government services field to better understand and implement m-Government
applications in order to realize the benefits of m-Government services and fulfil the
needs of citizens. The findings of the study provide insights to future and current m-
Government adopters where initiatives can be evaluated. The case study was based on a
leading m-Government service which has won several international awards and
recognition. Accordingly, m-Government adopters may treat it as a benchmark/best
practice for future initiatives.

5
1.4. Research Method
The data collection technique utilized in this study is the mixed method technique. It has
the advantage that one approach builds on the results from the other, which in turn
provides strength to the findings and further confirmation of the hypotheses. Thus, two
stages for data collection were used in this research; firstly large scale survey
questionnaires for the quantitative stage and secondly semi-structured interviews for the
qualitative stage. The former were used to test the model and confirm the hypotheses,
whereas the latter were used to elaborate findings from the survey questionnaires and
provide further confirmation for the research model and hypotheses. The data were
gathered from Oman and specifically Muscat, the capital, as the researcher is from Oman
and had easy access to relevant data and had knowledge and familiarity with the system.
For testing the model and hypotheses, the advanced technique of Structural Equation
Modeling (SEM) was used for the data analysis.
The most common and earliest m-Government service being utilized in Oman is the
Mobile Parking Service. This m-Government service has attracted international
recognition through several international awards (Muscat Municipality, 2009) and hence,
was selected as an exemplar for m-Government. Further, Oman happened to be one of
the early adopters of this service where this service has first been introduced. Oman has
experienced this service for a quite long time which makes it suitable to provide better
understanding of the service. The Mobile Parking Service enables motorists to reserve
and pay for car parking using their mobile phones by messaging their vehicle's plate
number and the intended duration to a predefined number. This service is the first to be
implemented as an m-Government service in Oman and is being used only in the capital
Muscat. Although the DOI theory has been applied and adapted in various domains, such
as internet use and e-business adoption (Rogers, 1995; Zhu and Kraemer, 2005), the
scope of this study is to investigate the use of this m-Government service from the
citizens’ perspective only; business units and government units are outside this scope.
In addition, m-Government services in Oman are provided to all people and no
distinction is made between nationals and non-nationals in terms of service provision or

6
government aims. However, there is a government policy strategy of Omanisation. This
program intends to replace expatriates with trained Omani personnel. Thus, the data that
will be gathered in this study will only focus on nationals. A more detailed discussion
regarding the Research Method can be found in Chapter 4.
1.5. Research Outcomes
The study aims to investigate the factors affecting the intention to use m-Government
services. Accordingly, it produces the following:
A validated model of the intention to use m-Government services. This is the
major expected outcome of this research as it is anticipated it will assist the
decision makers in the government who are involved in m-Government projects
in introducing and implementing m-Government services throughout their
countries with some considerations of the important predictive values;
The strongest and weakest predictive value that will influence/impact on the
intention to use m-Government services;
A comparison between males and females and their relationships with all the
measured variables including relative advantage, compatibility, complexity,
trialability, and observability, perceived trustworthiness, perceived security,
personal innovativeness and perceived enjoyment;
A comparison between young and old citizens and their relationships with all the
measured variables including relative advantage, compatibility, complexity,
trialability, and observability, perceived trustworthiness, perceived security,
personal innovativeness and perceived enjoyment; and
A comparison between highly-educated and less-educated citizens and their
relationships with all the measured variables including relative advantage,
compatibility, complexity, trialability, and observability, perceived
trustworthiness, perceived security, personal innovativeness and perceived
enjoyment.
7
1.6. Thesis Structure
This thesis is divided into seven chapters as follows:
Chapter One: This chapter presents the introduction, which provides the research
purpose, the research aims and their significance, the research contribution to knowledge,
the research method, the research outcomes, and the structure of this thesis.
Chapter Two: This chapter reviews the relevant literature in order to establish the
conceptual context of this research and identify the gap that this study fills. It includes
an overview of the nature of mobile government as well as overview of adoption theories
including the DOI, TAM.
Chapter Three: This chapter introduces the research model used as a basis for
understanding the factors influencing the intention to use m-Government services as well
as the proposed hypotheses.
Chapter Four: This chapter introduces the research method used to collect the required
data, which involves mixed methods; the quantitative study (questionnaire) followed by
the qualitative study (interviews) as well as the case study used in this research. The data
collection, an analysis of both the quantitative and the qualitative data and the findings
from both sets of data are also discussed.
Chapter Five: This chapter presents the validation of the research model. This includes
the data analysis of the data collected in Chapter 4.
Chapter Six: This chapter presents the results and discussion of both the quantitative
and qualitative data that were collected from Chapter 4 and analysed in Chapter 5.
Chapter Seven: This chapter draws a conclusion and discusses the limitations of the
research and suggestions for future research. It also presents a summary of the
objectives, activities and main findings of this study, as well as the contributions to
theory that this study makes.

8
Chapter 2.
Mobile Government Theory and Practice
2.1. Introduction
This chapter aims to explain the major concepts and issues around m-Government
dissemination and implementation. It begins with a general overview about m-
Government in Section 2.2; this includes its connection to e-Government and discusses
the definitions of m-Government followed by a description of applications and
classifications, m-Government enabling technologies, adoption and dissemination and
the drivers and barriers of m-Government services. Section 2.3 presents examples of
leading m-Government applications/services from around the world. Then, in Section 2.4
a critical review and empirical work of the DOI model is provided followed by an
overview of the TAM model in Section 2.5.
2.2. Mobile Government
There is some argument about whether there is a substantial difference between e-
Government and m-Government. Several scholars as Kushchu (2007) believe m-
Government subsumes e-Government. In other words, m-Government and e-
Government are not two separate entities. This is because e-Government includes the
usage of all technologies in order to deliver services to citizens as well as to improve the
activities of government whereas m-Government is an extension to e-Government which
is limited to the use of mobile technologies (e.g. mobile phones, Personal Digital
Assistance (PDAs), Wireless Fidelity (Wi-Fi) enabled devices, Bluetooth, wireless
networks in delivering services). Further, m-Government is considered a better option

9
compared to e-Government in delivering services and public information to citizens.
This is because it is available anywhere, anytime and from any internet enabled device
(Lallana, 2008). According to Kushchu (2007), m-Government is an extension of e-
Government which allows it to provide new mobile services. M-Government mainly
deals with mobility in the context of delivering m-Government services but not primarily
with mobile technologies.
Further, e-Government is the applications of Information and Communication
Technology (ICT) by government agencies with the aim of enhancing information or
services delivery to citizens. It provides services to citizens through wired network such
as the internet, and fixed telephones. The internet nowadays has become the cheapest and
most effective channel that is being utilized by governments in order to deliver
information and communication services to citizens. However, in order to make use of a
certain type of government service (e.g. exam notification) resources such as a computer,
telephone, and internet connection are required which may not be available to citizens.
Nevertheless, the existence of advanced technology such as wireless mobile
communication infrastructure is pushing governments to utilize this technology in order
to better deliver its service to citizens anywhere and anytime with satisfaction.
Furthermore, due to the increase of wide wireless coverage in rural and remote areas, the
penetration of mobile phones in developing countries is higher than landline.
Kushchu (2007) also argues that m-Government is the application of new mobile
technologies in developing countries, in contrast to western countries where it has
existed for a relatively long time. It aims to improve the quality of life. However, despite
the essence of technology being to make people’s lives easier, new mobile technologies
are not always accepted, especially in developing countries. This may be due to poor
education, the high cost of technology, its complexity of use, or its incompatibility with
values and beliefs. Therefore, in order to overcome these barriers, governments in
developing countries need to implement mobile services that are seen to be directly in
accordance with their citizens’ needs (Kushchu, 2007). As Sandy and McMillan (2005)
argue, m-Government uses Information and Communication Technologies (ICTs) to
10
improve the activities of public sector organizations and provide ‘anytime’ and
‘anywhere’ services to both citizens and public officials. They point out that the
availability of technology such as pocket PCs, tablets, handheld terminals, Short
Message Services (SMS), Personal Digital Assistants (PDAs), and mobile or cellular
phones, offers the public many benefits. These include increased channels for services’
interactions, and instant updates to information and data - hence increasing the
productivity of public servants in particular.
Notably, governments in the developing countries are expanding the infrastructure of
mobile networks at a fast pace in order to provide m-Government services to citizens
anywhere and anytime, although m-Government services in the developing countries are
still in their infancy and have not been exploited (Mengistu, Zo, & Rho, 2009).
However, due to the increase of wide wireless coverage in rural and remote areas, the
penetration of mobile phones in developing countries is higher than landline and is
considered the best manner to reach citizens in remote areas of rural regions through the
implementation of m-Government services (Kushchu & Kuscu, 2003; Wireless
Intelligence, 2005). Furthermore, in cases of natural disaster such as a cyclone or flood
causing billions of dollars of damage to landline and mobile network infrastructure
(Hossan, Chowdhury & Kushchu, 2005), m-Government services can rapidly provide
safety warnings to remote areas before the disasters occur (Kushchu & Kuscu, 2003).
In 2000, the former Prime Minister of the UK, Blair stated that new digital channels
could be used to deliver better quality services to citizens in the United Kingdom (UK).
These channels would be available 24 hours a day and would be faster and more
convenient thus stimulating the market for e-Commerce by encouraging the widespread
adoption of technologies and creating new business opportunities (Blair 2000). Blair has
pointed that in order to achieve this aim and deliver better quality services to the citizens
anytime and everywhere, a new digital channel should be utilized. This new digital
channel operates using wireless devices, such as Pagers, Personal Digital Assistant
(PDA), and Cellular phone (Antovski & Gusev, 2005).
11
Tozsa and Budai (2005) argue that accessibility anywhere and anytime is the great
advantage of m-Government applications and has the potential to make the
administration more productive and efficient. They also state that the Short Message
Service (SMS) is an important tool for m-Government as it is one of the best ways to
reach a vast number of citizens in a short time. Further, Heeks and Lallana (2004) argue
that in addition to improving the delivery of information and services to citizens, m-
Government applications increase the productivity and effectiveness of public servants.
According to Carroll (2005), Success of e-government requires active engagement by
both government and its citizens. ‘A greater challenge may be achieving acceptance and
widespread, persistent use of e-government by citizens‘(p.79). Carroll in 2006 suggests
that the principle drivers (success factors) of m-Government services are to increase the
efficiency, effectiveness and availability of such services anytime and anywhere (Carroll,
2006). Further, the success of mobile government depends mostly on the number of its
users; the citizens (Kushchu, 2007). However, a less visible issue influencing the success
of m-Government applications is that the citizens’ needs to access public sector services
via mobile technology are being overlooked (Carroll, 2005). Although much research has
focused on e/m-Government technologies, less attention has been paid to what citizens
actually need. In this situation, one of the aims on this study is to fill the gap by focusing
on the needs citizens in terms of m-Government services. This is done through utilizing
the Diffusion of Innovations Model (DOI) and Version 1 of the Technology Acceptance
Model (TAM) developed by Davis (1989) as well as other variables that seem to be
important such as perceived trustworthiness, perceived security, perceived enjoyment
and personal innovativeness in order to assist their government in achieving the
successful implementation of m-Government services (see Chapter 3). In addition, it
aims to understand the users of m-Government services in order to assist the government
to smooth the introduction of m-Government services. The scope of this study is to
investigate the use of these m-Government services from the citizens’ perspective only;
Government to Citizen (G2C). The business units, Government to Business (G2B) and
government units, Government-to-Government (G2G) are beyond the scope of this
study.

12
It is clear from the argument above that e-Government differs from m-Government; the
former provides services to the citizens, business, and governments through wired
network with interactive and intelligent web applications, whereas the latter uses
wireless devices as cellular phones, PDAs, and pagers to communicate with the relevant
parties.
2.2.1. Definition
Mobile Government is defined as a ’strategy and its implementation involving the
utilization of all kinds of wireless and mobile technology, services, applications, and
devices for improving benefits to the parties involved in e-Government including
citizens, businesses, and all government units‘ (Kushchu, 2007, p.3). This definition
places core ICT components such as the mobile network as imperative factors that would
enhance the utilisation of m-Government services. Additionally, Moon describes m-
Government as ’government’s effort to provide information and services to public
employees, citizens, business, and non-profit organizations through wireless
communication networks and mobile devices such as pagers, PDAs, cellular phones and
their supporting system’ (Moon, 2004). Other authors have also described e/m-
Government as:
Electronic government (eGovernment) refers to the provision of government
services through the use of information and communication technologies (ICTs).
Mobile government (mGovernment) can be seen as a subset of eGovernment; it
refers to the provision of government services via wireless technologies, anywhere,
anytime, employing a diversity of mobile devices (El-Kiki, Lawrence & Steele,
2005, p.1).
This is in agreement with Kushchu’s definition that the use of wireless devices would
enhance the utilisation of m-Government services and m-Government can be seen as the
way future governments deliver government services to citizens, companies and within
government institutions via wireless devices anytime and anywhere.
Previous authors have described m-Government in a broad and general view. For
instance, Rossel, Finger and Misuraca, (2006) state that ’m-Government developed as a

13
natural spin-off expression of e-Government in the wake of a generic technological
deployment (the supporting ‘mobile’ systems) and its societal evolution (being mobile as
a must)’ (p.79). This is in agreement with Tozsa and Budai (2005), who argue that
accessibility anywhere and anytime is the great advantage of m-Government applications
which makes the administration more productive and efficient.
On the other hand, Rainer and Cegielski define mobility as the users’ ability to be
reached anytime and anywhere (Rainer & Cegielski, 2011). This is true in the m-
Government domain and hence the ‘m’ prefix. It should be noted that the term ‘mobile’
and the ‘wireless’ could be used interchangeably in this domain because m-Government
relies heavily on wireless infrastructure.
In this research we acknowledge the widespread use of modern mobile devices (smart
phones and tablet PCs) and the obsolescence of some older wireless devices (pagers and
PDAs) in defining m-Government as follows: ’the utilization of a diversity of modern
mobile devices (e.g. Cellular Phones, Tablet PCs, Laptops) in order to provide
information and services anytime and anywhere to citizens, businesses, government
units, and non-profit organizations to gain benefits such as cost reduction, greater work
efficiency, effectiveness, and faster access to public services’.
2.2.2. Applications and Classifications
Similarly to e-Government, m-Government operates on four different applications. These
applications are as follows:
Mobile Government to Government (mG2G), referring to the interaction between
governmental agencies;
Mobile Government to Business (mG2B), referring to the interaction between
government and private sectors;
Mobile Government to Employee (mG2E), referring to the interaction between
government and its employees; and

14
Mobile Government to Citizen (mG2C), referring to the interaction between
government and citizens (Heeks & Lallana, 2004).
The most developed level that is being operated globally is mobile Government to
Citizen (mG2C) (Ntaliani, Costopoulou & Karetsos 2008). Therefore, as mentioned
earlier, the scope of this study is only to investigate the use of this kind of m-
Government services from the citizens’ perspective mobile Government to Citizen
(mG2C); the business units (mG2B) and government units (mG2G) are outside this
scope. Heeks and Lallana (2004) argue that in addition to improving the delivery of
information and services to citizens, m-Government applications increase the
productivity and effectiveness of public servants. According to Trimi and Sheng (2008),
m-Government is classified into three classifications. These three classifications are as
follows:
Informational: one-way transmission where government sends alerts,
notifications or broadcasting to users via emails or SMS (Push services);
Transactional: two-way transmissions of information from government to users
and vice versa, where users are able to interact with m-Government systems such
as online procurement and payments (Pull services); and
Operational: where all the internal governmental operations occur by enabling
the government employees to access the required information from remote
locations via their mobile devices.
The use of mobile technologies differentiates m-Government from e-Government. There
are many other factors to distinguish m-Government from e-Government in terms of
accessibility and availability, better precision and personalization in targeting users and
delivering information. These factors are as follows:
Pull services in terms of accessibility and availability:
15
m-Government improves the adoption of online services by citizens through the
accessibility and availability of information anytime and anywhere;
As mobile devices are designed to be portable and handy, the application can be
designed to provide instant information to users (e.g. send warnings during
emergencies); and
Users usually keep their mobiles on, so they can receive Short Message Services
(SMS) anytime and anywhere, which is different from a personal computer.
Therefore, this is different from e-Government applications.
Push services in terms of better precision and personalization in targeting users and
delivering information:
Mobile devices are designed to be used by a single user unlike a personal
computer, which can be shared by different users. Thus, there is better precision
and personalization in targeting the same user anytime through their mobile
device; and
M-Government increases the adoption of online services by reaching its citizens
through a more personal, familiar, and friendly device (Kushchu, 2007).
In order for citizens to utilize all mobile government services, enabling technologies
must be used which are discussed in detail in the next Sub-Section (2.2.3).
2.2.3. Enabling Technologies
There is a greater range of enabling technologies, other than those directly impacting on
m-Government, are excluded from the scope of this research. According to Trifonova
and Ronchetti (2006), a mobile device can be any small and portable device that can be
handled everywhere and at anytime. Mobile devices would be the best technology
channel that can achieve delivery of governmental services and support users’ mobility.
Enabling technology channels that are used in m-Government must be able to deliver
governmental services to citizens and support citizens’ mobility. Trimi and Sheng (2008)

16
have categorized the enabling technologies for m-Government services into the
following categories:
Personal Digital Assistant (PDA): this is a small handheld device which contains
some personal computer and telephone capabilities, for instance, calendar,
multimedia, voice recorder and the ability to get connected to the internet in order
to check emails or for browsing;
Cellular Phones: Previously, cellular phones had limited functionalities, for
instance, voice and short text messages only. Nowadays, these devices have more
advanced functionalities such as third generation (3G) and more network
connectivity which enable the user to connect to the internet and send emails and
browse;
Smart phones: These devices include both PDAs and cellular phones
functionalities that can be used for text messages and voice communication,
sending emails, browsing the internet and multimedia; and
Tablet PCs or Slates such as iPads and the like. These have transformed the way
people interact with PCs and are triggering higher adoption in the mobile
commerce/government world (Fenn, 2010).
Naturally there are several drivers and barriers during the introduction and implantation
of m-Government services that the governments and service providers might face. These
are discussed in detail in the following sub-section (2.2.4).
2.2.4. Drivers and Barriers
Kushchu (2007) has identified some prerequisites and recommendations that would
assist in implementing m-Government services. They are as follows:
Decentralization for local m-Government diffusion;
Central government support to local projects in order to promote standardization;
Soft skills, in particular leadership and communication;

17
Skills enhancement on the job rather than formal training;
Horizontal organizations and bottom-up approaches, but with strong commitment
of top management; and
Early involvement of people both internal and external (Kushchu 2007).
Khare, Dixit and Chaudhary (2011) have also identified several drivers in order to assist
developing countries to shift from e-Government to m-Government services. These
drivers are as follows:
High penetration rate of mobile users in developing countries enables them to use
of m-Government services;
Increasing number of people using mobiles to connect to the internet via Wireless
Application Protocol (WAP) services provided over General packet radio service
(GPRS);
Mobile phones networks/coverage is easier to lay down to reach remote areas
where it is difficult for the infrastructure for the internet to be implemented.
Therefore people who live in the rural areas are able to access m-Government
services via mobile phones;
Mobile phones are mostly affordable and this due to the low cost compared to the
internet technology;
Mobile phones are simple to use and this will encourage many people to adopt
mobile phones devices easily; and
m-Government would extend the operations of e-Government to some new areas
like e-Democracy, e-participation, e-voting and other forms of communication
between the citizen and the government.
As Ghyasi in 2009 argues that the Governments can begin implementing m-Government
services in three different stages. Firstly, in order for the governments to reach the
citizens anywhere and anytime to warn them about such events as earthquake, fire,
floods, etc, the governments should develop m-services that can be pushed to citizens.

18
These types of m-services are informational services, which are government to citizen
(mG2C). Secondly, citizens can interact with government services in order to encourage
them to enhance democracy and bring accountability. These types of m-Government
services are transactional or pull services (mG2C and vice versa). Finally, citizens can
interact with government using more advanced applications such as payment
transactions, bills and inquiries. Therefore, mobile phones are not only meant for making
calls but also as an identification card, payment wallet, driving license, and health
insurance (Ghyasi, 2009). Other driving factors will affect the citizens attitude towards
m-Government such as their socio-economic characteristics, income, education level,
age, gender, and language difference (Kushchu 2007).
As mentioned above, if citizens can use m-Government services easily, then a vast
number of citizens will adopt those m-Government services. Therefore, governments
should consider ease-of-use when providing m-Government services to citizens. M-
Government services should be provided in many different forms like video and voice
communication in order to increase people’s perception of using m-Government services
because the main driver for the success of m-Government services is user acceptance
(Kushchu, 2007). Kushchu and Kuscu (2003) have also argued that the level of mobile
device penetration is considered a key driver for m-Government and ubiquitous access is
somehow being overlooked as a side acquisition. In addition, Campbell (2005) claims
that young people consider mobile phones as their most important possessions, and this
is an agreement with Mitra and Rana, (2001) who argue that young people seem to
understand technology better than older people.
When it comes to mobile commerce activities, many people hesitate to buy/pay online
because they do not trust mobile phones or the internet and they are worried that their
credit card details will be stolen. However, the Perceived Security of m-payment using
mobile phones is greater than the wired systems (Antovski & Gusev, 2003). In addition,
most citizens are very concerned about privacy and Perceived Security when using m-
Government services. They fear that their mobile phone numbers will be traced when
they send inquires to the government. Therefore, the government should gain the

19
citizens’ trust and insure that their information is secure and will not be disclosed to any
third party by any means. A wireless network is still considered vulnerable because the
signal is sent through microwave or radio signals. Consequently, there is an opportunity
for any external attacker to intercept the information (Antovski & Gusev, 2003).
According to El-Kiki, Lawrence and Steele, (2005) there are many challenges and
opportunities in adopting and using wireless technologies. These could be political,
cultural, structural, social, legal and administrative and would represent pressures and
challenges to the government. The decision makers who are involved in wireless
technology projects should deal with these challenges and opportunities by identifying
the type of challenge, determining the risk and responding accordingly. If the
government does not have a plan for the identified risk, this may lead to the failure of the
government’s projects. Therefore, in order to mitigate risks and have a proper
government response, a management framework has to be developed and implemented
(El-Kiki, Lawrence & Steele, 2005).
In 2004, Moon has also identified some barriers that would slow the adoption of m-
Government services. These barriers are security, interoperability, privacy, the high cost
of implementing mobile technologies, and a lack of resources. He stated that a wireless
network is more vulnerable and unstable than a wired network (Moon 2004). Many
people still hesitate to use m-Government applications due to a lack of trust in
technology, which has a negative effect on the rate of adoption. This is in agreement with
previous researchers who argue that Perceived Security and privacy are the most
important issues affecting the adoption of m-Government services (Chang & Kannan,
2008). They have also added that various studies have included trust in broader adoption
models, for instance the Technology Acceptance Model and the Diffusion of Innovations
theory. However, few have focused exclusively on the implications of trust on e-
government adoption (Change & Kannan, 2008). According to Bélanger, Hiller & Smith
(2002, p.252) trustworthiness is ’the perception of confidence in the electronic
marketer’s reliability and integrity‘.

20
In order to implement successful m-Government services, government agencies should
first understand the citizen’s requirements. This will make their performance more
effective in delivering better services to their citizens. This is an agreement with John
Alford who argues that ’Agencies may find that they need certain things from service-
recipients – such as information, co-operation, compliance and co-production – which
are crucial for effective organizational performance (Alford, 2002, p.2). Mobile
government in the developing countries is still in its infancy, although globally mobile
government services have been available for quite a long time. Therefore, the developing
countries should consider shifting to mobile government in order to step forward into the
digital era. Examples of leading m-Government services globally including in the
developing countries are discussed in the next Section (2.3).
2.3. M-Government Worldwide
In 2010, The International Telecommunication Union (ITU) reports that the growth of
mobile phone is increasing in the developing countries. India and china have the highest
penetration rate of mobile phones; for instance, in 2010, new 300 million subscribers
were recorded in these two counties (ITU, 2010). Table 2.1 shows the Key Global
Telecom Indicators for the World Telecommunication Service Sector in 2010.
Global Developed
nations
Developing
nations
Africa Arab
States
Asia &
Pacific
Europe The
Americas
Mobile cellular
subscriptions
(millions)
5,282 1,436 3,846 333 282 2,649 741 880
Per 100 people 76.2% 116.1% 67.6% 41.4% 79.4% 67.8% 120.0% 94.1%
Fixed telephone lines
(millions)
1,197 506 691 13 33 549 249 262
Per 100 people 17.3% 40.9% 12.1% 1.6% 9.4% 14.0% 40.3% 28.1%
Table 2.1 Key Global Telecom Indicators for the World Telecommunication
Service Sector in 2010
Source: International Telecommunication Union (October 2010)

21
2.3.1. Developed Countries
In Australia, in particular in the Sydney Region of New South Wales (NSW), the MGM
Wireless Company provides SMS and other mobile services that may benefit parents and
students. These mobile services offer the school administrator or teachers appropriate
privileges to be able to use the web services of the school in order to provide alerts to
parents (e.g. important school event reminders, late breaking school news and attendance
and safety related matters). In addition, in Australia there is the Fire-watch SMS based
service, which is a system that sends SMS alerts to citizens whenever there is a fire
within fifteen kilometres (Rannu, Saksing & Mahlakõiv, 2010).
In the United States of America (USA), m-Government projects have increased at a fast
pace. For instance, ‘My Mobile Virginia’ is the first m-Government application to be
implemented in the USA by the government of Virginia State. Therefore, Virginia has
been the leader in implementing m-Government applications in the States. In the USA,
this application was the first wireless state portal being utilized via mobile and wireless
devices provided by the government. It provides plenty of m-services such as
information about emergency weather conditions, legislative information, lobbyist lists,
election notices, tax-related information, and tourism information. The US government is
also utilizing text messages to communicate with their citizens, such as on street cleaning
schedules. In addition, in Iowa the Parking Day Text Service sends messages to their
citizens to remind them to shift their cars, which will help drivers to avoid getting tickets.
Another wireless application, which was introduced in July 2001 by the US government
in California State, was ‘My California on the Go’. This m-Government service allows
the citizens to receive instant updates on energy warnings, traffic jams, state lottery
results, and press releases from the governor’s office. In addition to these applications,
the Global Positioning System (GPS) was introduced in Seattle to assist commuters to
save driving time. This m-Government service provides instant updates to drivers about
traffic slowdowns, traffic lights, and traffic flows (Trimi & Sheng, 2008). Besides these
services, the United States Government has launched seventeen new mobile applications
throughout the country (Gahran, 2010).

22
One of the leading countries globally in m-Government services is Estonia, where the
mobile penetration exceeds 100 per cent. The government in Estonia has adopted a
powerful and convenient way in order to provide information and communication from
government and office, which is the SMS tool (Rannu, Saksing & Mahlakõiv, 2010).
According to a KPMG (a global network of professional firms providing Audit, Tax and
Advisory services) survey in 2009, in Central and East Europe, Estonia is considered the
most advanced mobile payments (m-payment) market (KPMG, 2009). In addition, the
M-parking service is considered a very useful and popular service in Estonia since its
introduction in 2000 (Rannu, Saksing & Mahlakõiv, 2010). According to Rain and
Maarja (2005), as of December 2005, the following mobile services are available in
Estonia in particular in Tartu, which is considered the leading city in Estonia in
introducing m-services. These services are as follows:
Mobile Parking: This application enables clients in Estonia to pay for parking
using their mobile phone;
Mobile Bus Ticket: This application also enables clients to pay for bus tickets
using their mobile phone;
T-number: T-number is a service that permits individuals to receive information
on tourism in Tartu via their mobile phone;
Mobile Payment: individuals use their Mobile phone in order to make a payment
when buying any products or services such as in shops or restaurants, etc;
Tartu city short code 1789: this service allows citizens to send information to the
city about traffic lights or street lamps, damaged traffic signs, and stolen park-
benches etc;
M-neighborhood watch: The Police control centre sends SMS notifications to all
taxis and drivers, Perceived Security companies, and other people on issues such
as missing persons, stolen cars that require watchful eyes; and
M-library: Tartu City library sends notifications about waiting lists to the readers’
mobile phones who want to borrow a book, movie or audiotape that is currently
not available.

23
In Canada, the Canadian government has also introduced a project called ’Government
of Canada Wireless Portal‘. This project allows the citizens to get access to government
information via their mobile devices. The m-Government services introduced in this
project include; members of the parliament contact information, border wait time,
economic indicators, passport services, and Canadian government news releases. Further,
Canadian police officers are using mobile devices in order to issue tickets, access
databases, access the record-management system, and check vehicle registrations and
license tags (Trimi & Sheng, 2008).
Europe is considered to be more advanced in terms of m-technology. This is because the
penetration rate of mobile phones has increased swiftly during the period 2004 to 2007
from 90 per cent to 100per cent (Trimi & Sheng, 2008). They also added that the wide
acceptance of m-technology has expedited the acceptance of m-government services. For
instance, citizens in London who have subscribed with the London Police Department
can receive SMS about Perceived Security threats and emergency alerts from the London
Police Department. In addition, bus drivers who subscribed with Bus Operator Metroline
can receive SMS about their timelines to speed up or slow down and maintain an even
interval between buses. They receive this SMS from the Bus Operator Metroline where
they send SMS to the bus drivers after monitoring the status and location of buses via a
mobile tracking system.
In Austria, the parking inspectors use a portable device that connects to the central
parking database to check whether the driver has paid for the parking slot or not (Trimi
& Sheng, 2008). Sweden also is considered to be one of the leading countries in the
world with regard to m-technology because the penetration of mobile phones in Sweden
is extremely high with over 95 per cent of the population owning a mobile phone. Many
m-government services are available throughout the country. For instance there are SMS
applications for city job postings in Stockholm, a mobile parking fee payments system, a
government inspector service, tax services, mobile healthcare providers, and MapMate as
a wireless map system, among others (Ostberg 2003).

24
In Finland, the Finnish telecommunication firm Sonera has developed advanced
application that has the ability to turn any mobile phone into an identity. Since every
mobile phone has a unique Subscriber Identification Module (SIM) card code, personal
identification can be fixed in the card code in the SIM and thus make it the same as the
current paper passport system. In addition to the electronic passport instead of a paper
passport, the citizens in Finland can make secure transactions over mobile phones (Trimi
& Sheng, 2008).
In Japan, people are able to receive information from the Vehicle Information and
Communication System (VICS) about services such as traffic congestion, roadwork, car
accidents, availability of parking lots, and weather information. M-Government in Japan
is considered to be an old-fashioned term, and now the government’s strategy is to move
ahead with u(ubiquitous)-Japan to connect everyone and everything, anytime, anywhere
(Trimi & Sheng, 2008).
In Korea, there is a project called ‘M-police’. This project enables the police officers to
retrieve information on missing vehicles, driver’s licenses, vehicles’ histories, and
pictures of suspects via mobile devices. Therefore, it will assist them to find suspects and
missing cars very quickly. In Anyang City, parking inspectors are using PDAs and small
printers to collect information and then print receipts on the spot. In Uijeongbu and
Kunsan Cities, the m-local Tax Management System enables officers to access
information on car taxes, obtain data on delinquent taxes, and immediately transfer data
to the local tax database (Jeong & Kim, 2003).
In Singapore, the government aims to increase the dissemination of m-services provided
to the public. Currently, individuals and businesses are able to get access to a wide range
of government information and services via their mobile devices. These mobile
government services are available anytime, anywhere via mobile phone and are
discussed below (Singapore Government, 2008):

25
CPF (Central Provident Fund) board members are able to view their CPF account
information on using their mobile phones. For instance, they can check their
Account Balances, Contribution History, Property, and Investment;
HPB (Health Promotion Board) Mobile Portal – individuals can get health
information and travel tips;
CPF e-Appointment SMS Alert – people can receive an SMS from the hospital
one day before their appointment if they have provided the hospitals with their
mobile phone number;
Police Crime Alerts Service: The police centre sends notifications to people who
have already subscribed with the following Singapore Telcos (M1 and SingTel
only) to receive notifications on crimes that have occurred in the neighbourhood
via SMS; and
Supreme Court Mobile Information Service – people can request information on
trials and hearings before judges and registrars through their SMS.
Further, citizens in Singapore are able to receive text messages from government
agencies regarding parking ticket reminders, national service obligations, and passport
renewal notifications (Trimi & Sheng, 2008).
It is clear that the advantages of implementing m-Government services in all countries
and the ability to deliver integrated services from a single point, create opportunities and
co-operation between governments, the private sector, and individuals. Therefore, these
m-services projects reduce administrative problems on a global scale.
2.3.2. Developing Countries
In Asia there were 1.1 billion mobile subscribers in 2007. Therefore, Asian countries
have a high potential with regard to m-technology. For instance, some of the highest
rates of mobile phone usage in the world are amongst the industrialized countries in the
Asian region, such as Japan, South Korea, Hong Kong, Taiwan, and Singapore.
26
In the Philippines Ghayasi and Kushchu (2004), have also discussed the following
mobile services, which have been launched:
TXT CSC: This service allows citizens to send complaints to government
agencies, in particular the Civil Service Commission (CSC) in the Philippines in
order to increase the efficiency and speed of service delivery (Lallana, 2004).
Reporting Criminal Offences: citizens and police officers can send SMS to the
relevant authorities about any criminal offences in order for authorities to take
action.
In Dubai, in 2003 the Dubai Government introduced its SMS services. These are Push
SMS services that are accessible for driving license renewals, traffic jam information,
health card renewals and trade license renewals. In addition, there are Pull services
available in Dubai. These include flight information, the payment of traffic fines and
information pertaining to trade license status. Further, in September 2005, Dubai
government launched the mobile portal which is a single point for accessing all public
services. This has assisted the Dubai government and the citizens to reduce the
complexity and delays of routine procedures. In addition, the advantage of the single
point portal is that it allows individuals to access visa information, police services, such
as traffic fine enquiries and payments, and obtain prayer timings as well as searching for
hotels, checking arrivals and departures from Dubai airport and obtaining entertainment
information and financial services data (Ewan, 2006). Another, important application
introduced by the Dubai government is m-Dirham. This application or service allows
people to deposit money in a third party financial institution in order to be able to use it
for paying different municipal services (Ewan, 2006).
In Jordan, the Jordanian government started to plan seriously for e-government when the
Program Management Office was established under the Ministry of Information and
Communication Technology. However, within one year, the Jordanian government was
able to accomplish 13 e-government initiatives and 30 separate related projects. These
included the development of an e-government operations centre linking several

27
ministries to a secure government network and email. In addition, it built many online
services such as company registration and income tax filing (Samer & Mohammed,
2008).
In Oman, His Majesty Sultan of Oman has a long-term vision of Oman to encourage the
Omani government to move forward rapidly in terms of ICT provision. An Information
Technology Authority (ITA) was created in 2006 by a Royal Decree to plan for and
oversee national ICT projects (ITA, 2010). These projects include the implementation of
e/m-Government services throughout the entire country of Oman. According to the
(ITA) in 2010, Oman's e-government strategy was unveiled on May 7th
2003, followed
by several modernizing projects aimed to enhance the ICT sector and improve digital
awareness and capacity (ITA, 2010). Table 2.2 below summarizes all mobile
Government services in Oman. They are as follows:
m-Government
Services
Description Target Audience Operator Source
Apply Job Ministry of
Civil Service
This is a Push and Pull SMS service
for candidates who are searching for
a job.
Job Seekers Oman
mobile,
Nawras
Ministry of
Civil Service,
2006
Mobile Parking
Service
This is a Push and Pull SMS Service
to send a request to Muscat
Municipality to reserve a car parking
using Short message Service.
Citizens/residents Oman
mobile,
Nawras
Muscat
Municipality,
2007
SMS Exam Grades This is a Push and Pull SMS to
request the final exam grades.
Students Oman
mobile,
Nawras
Ministry of
Higher
Education, 2007
Jawab SMS Service
This is a Push and Pull SMS services
to notify subscribers of completion of
transactions, their cost and any other
important information needed.
Citizens/residents Oman
mobile,
Nawras
Ministry of
Manpower,
2010
SMS Violation
Enquiry
This is a Push and Pull SMS to
enquire about traffic offences by
sending SMS.
Citizens/residents Oman
mobile,
Nawras
Royal Oman
Police, 2010
SMS Tender
Announcement
Notification Service
This is a Push and Pull SMS to
receive SMS about announcements of
new tenders, award of tenders and
tender amendment notifications to
unsuccessful applicants.
Citizens/residents Oman
mobile,
Nawras
Tender board
Oman, 2004
SMS Telephone
Regulatory Authority
(TRA)
This is a Push and Pull SMS to
inform customers about whether their
transaction is ready to be collected or
not complete.
Citizens/residents Oman
mobile,
Nawras
Telephone
Regulatory
Authority, 2009
Table 2.2 Mobile Government Services in Oman

28
Many organizations both private and public have decided to open new mobile channels
and provide mobile services to communicate with their clients anywhere at any time.
These services are categorized into two groups - Push and Pull. The former is where
clients receive notifications from organizations about specific events, and the latter is
where clients have more privileges in receiving, responding, and / or initiating services
with organizations.
According to the latest United Nations (UN) e-Government readiness report published in
(2008), the Oman e-readiness rank has improved by 28 points to reach the 84th
position
in 2008 from 112th
position in 2005 (UN, 2008). This indicator shows good progress and
the commitment of the Omani government in driving improvements to the ICT sector
although when compared to other GCC countries (Bahrain, Kuwait, Qatar, Saudi Arabia,
and UAE), it lags behind them all. In addition, in 2011 among 138 countries, Oman was
in the 41st position in the Networked Readiness Index (NRI). The Networked Readiness
Index (NRI) examines how well the countries are prepared to use ICT effectively (Global
Information Technology Report, 2011). It can be noticed when compared to previous
years Oman has witnessed a great development in ICT provision.
2.4. Diffusion of Innovations (DOI)
’This study applies Rogers’ Diffusion of Innovations theory as a base model because it is
well established and has been extensively used in research on information technology
diffusion (Prescott & Conger, 1995; Braak & Tearle, 2007; Choudhury & Karahanna,
2008; and Conrad, 2009). In addition, this theory fits well with peoples’ understanding of
the adoption of technology (Conrad, 2009), particularly in the context of developing
countries (Prescott & Conger, 1995). Further, the Diffusion of Innovations theory is one
of the earliest technology adoption theories used in Information System (IS) research
(Rogers 1995). Additionally, when it comes to both the organisational and individual
levels, Rogers is considered the only innovation scholar to pose diffusion theories
(Conrad, 2009).

29
This study uses Diffusion of Innovations (DOI) as the main model in order to test its
applicability in the context of the adoption of m-Government services. It uses the first
three stages of DOI model; Knowledge, Persuasion, and Decision (Rogers 2003).
However, in examining Mobile Parking Services, the remaining two stages,
Implementation and Confirmation, will be left for future investigation. This is because
the former occurs when an individual actually puts an innovation in use (Rogers 2003). It
means until the implementation stage, the innovation-decision process goes through a
thinking process whether an individual decide to adopt an innovation or rejects it. Hence,
this study aims to determine the factors that affect the individuals’ intention to use
Mobile Parking Service. Those individuals may be users or non-users of Mobile Parking
service. It means they are still in the thinking process of innovation-decision process
whether to decide to adopt the Mobile Parking Service or rejects it. Rogers (2003) also
states that in the innovation- decision process a decision of individual to adopt or reject a
new idea is usually not the terminal stage. For instance, Mason in 1962 found that:
Oregon farmers he studied sought information after they had decided to adopt,
as well as before. At the confirmation stage the individual seeks reinforcement
for the innovation-decision already made, and may reverse this decision if
exposed to conflicting messages about the innovation. At the confirmation stage,
the individual seeks to avoid a state of dissonance or to reduce it if it occurs
(Rogers 2003, p.189).
The decision stage is defined by Rogers as ’the process through which an individual or
other decision making unit passes from first knowledge of an innovation, to forming an
attitude toward the innovation, to a decision to adopt or reject, to implementation of the
new idea, and to confirmation of this decision‘(Rogers 2003, p.168). This process
consists of the following five stages as shown in Figure 2.1.

30
Figure 4.1 A model of five stages in the innovation decision process
Figure 2.1 A Model of five stages in the innovation-decision process
Source: Rogers (2003)
Knowledge- individuals become familiar with the innovation’s
functionality. The type of communication involved in this stage is
mainly mass media communication;
Persuasion- individuals form favorable or unfavorable attitudes toward
the innovation. This type of communication mainly involves
interpersonal media communication;
Decision- individuals make a decision to either decide to adopt or reject
an innovation;
Implementation- individuals adopt an innovation and put it into use; and
Confirmation- individuals may reverse their decision to adopt an
innovation if they are exposed to a conflicting message (Rogers 2003).

31
Rogers in 2003 describes diffusion as ’the process in which an innovation is
communicated through certain channels over time among the members of a social
system‘(p.5). Based on this definition, diffusion consists of four elements. These are as
follows:
Innovation - an idea, practice, or object perceived as new by an individual or
other unit of adoption;
Communication channels - sending message from one individual to another using
two types of channels (interpersonal and mass media). In the developing
countries the interpersonal channel has been found to be more efficient than the
mass media channel;
Time - an important element in the rate of adoption and personal innovativeness
of the diffusion innovation process; and
Social System - a set of interrelated units engaged in joint problem solving to
accomplish a common goal (Rogers 2003).
The literature on the Information System Context has highlighted other well-known
models. These models include the Theory of Reasoned Action (TRA) developed by
Fishbein and Ajzen in the 1970s (Fishbein & Ajzen 1975), the Technology Acceptance
Model (TAM) developed by Davis and Bagozzi in the 1980s (Bagozzi & Fornell, 1982;
Davis, 1989), and the Actor Network Theory (ANT) developed by Callon, Latour, and
Law in the 1980s (Latour, 2005). Table 2.3 below shows a comparison of more well-
known adoption and diffusion models:

32
No. Name Author(s) Main Independent Constructs/Factors Beliefs Use Originating Area Remarks
1 Diffusion of
Innovations
(DOI)
Rogers
1962, 1983,
1995, and
2003
Perceived
characteristics of
innovations
1. Relative
advantage
2. Compatibility
3. Complexity
4. Triability
5. Observability
Characteristics of the
Decision-Making Unit
1. Socioeconomic
Characteristics
2. Personality
variables
3. Communication
Behaviour
1- Describe the
innovation-decision
process.
2- Adoption of new
technology up until
now.
3-Implementation
Success or
Technology
Adoption
Anthropology/
Sociology/
Education/
Communication/
Marketing and
Management /
Geography/
Economics
2
Theory of
Reasoned
Action (TRA)
Ajzen and
Fishbein
1980.
1-Attitude toward behaviour (ATB):
previous attitude of a person toward
performing that behaviour.
2- Subjective norm (SN): is the social
pressure exerted on the person or the
decision maker to perform the behaviour.
1- Beliefs and
evaluation of
behavioural
outcomes.
2- Normative Beliefs
& Motivation to
comply
1- Use in many
fields and is widely
used in academia
and business today
(Magee 2002).
2- IS researchers
often use this
theory to study the
determinants of IT
innovation usage
behaviour (Han
2003).
3- Behavioural
intention,
Behaviour
Social psychology
3
Theory of
Planned
Behaviour
(TPB)
Ajzen 1985 1-Attitude toward the specific behaviour
(ATSB).
2- Subjective norms (SN).
3- Perceived behavioural control (PCB)
(Ajzen 1991)
1-Behavioural beliefs
2-Normative beliefs
3-Control beliefs
1-Use in many
fields and is widely
used in academia
and business today
(Magee 2002).
2- IS researchers
often use this
theory to study the
determinants of IT
innovation usage
behaviour (Han
2003).
3- Behavioural
intention.
Social psychology The Theory of Planned Behaviour
(TPB) is proposed as an extension of the
Theory of Reasoned Action (TRA)

33
4 Social
Cognitive
Theory (SCT)
Bandura
1986
1- Personal factors in the form of cognition,
affect, and biological events,
2- behaviour, and
3- environmental influences that create
interactions.
1-Bandura,
emphasize that
cognition plays a
critical role in
people's capability
to construct reality,
self-regulate,
encode information,
and perform
behaviours.
2- Learning,
Change in behavior.
Psychology
5 Technology
Acceptance
Model (TAM).
Davis 1989 1- Attitude Toward Behaviour (ATB) 1- Perceived
usefulness (PU).
2- Perceived ease of
use (PEOU).
1-Use to explain or
predict individual
behaviours across a
broad range of end
user computing
technologies and
user groups (Davis
et al., 1989).
2- Behavioral
intention to use,
System usage
Information
Systems,
Technology
Adoption
1-The Technology Acceptance Model
(TAM) was developed from (TRA) by
Davis.
2- TAM does not include the influence
of social and control factors on
behaviour but those factors have been
found to have a significant influence on
IT usage behaviour (Mathieson 1991;
Moore & Benbasat 1991; Taylor &
Todd 1995; Thompson et al. (1991).
3-According to Bagozzi et al (1992),
TAM has strong behavioural elements it
assumes that when someone forms an
intention to act, they will be free to act
without limitation. In the real world
there will be many constraints, such as
limited ability, time constraints,
environmental or organisational limits,
or unconscious habits which will limit
the freedom to act.

34
Table 2.3 Comparison of Adoption and Diffusion Models
Source: Adapted from AlHadidi (2010)
6
Decomposed
Theory of
Planned
Behaviour
(DTPB)
Taylor and
Todd (1995)
1-Attitude toward behaviour (ATB)
2-Subjective norms (SN)
3- Perceived behavioural control (PBC)
1- Perceived
usefulness (PU).
2- Perceived ease of
use (PEOU)
3- Compatibility
4- Peers of the user
5- Superiors of the
user influence
6-(PBC) was
decomposed to:
1- Self efficacy
2- Technology and
Resource facilitating
conditions.
Uses for
Understanding
Information
Technology usage:
a test of competing
Models. (Taylor &
Todd 1995).
Social psychology
This model more completely explores
the dimensions of attitude belief,
subjective norm (i.e., social influence)
and perceived behavioural control by
decomposing them into specific belief
dimensions (Taylor & Todd 1995).
7
Task-
Technology Fit
(TTF) Model
Goodhue
(1988,
1995)
1- Task Characteristics
2- Individual Characteristics
3- Individual Systems and Services
1- Higher degrees of
“fit” lead to higher
performance and
expectations of
consequences of use
Goodhue (1988,
1995)
1-Uses to measure
IS success
(Goodhue, 1995).
2- Individual
performance,
System utilization
Information
Systems
According to Dishaw and Strong
(1998), TTF is also related to models of
user attitudes and behaviors toward IT
and its use, e.g., technology acceptance
model (TAM) (Davis et al., 1989) and
the theory of reasoned action (TRA)
(Ajzen & Fishbein, 1980).
8 Technology
Acceptance
Model 2
(TAM2)
Venkatesh
and Davis
2000
1- Perceived usefulness (PU).
2- Perceived ease of use (PEOU).
Social influence
processes (subjective
norm, voluntariness,
and image) and
cognitive instrumental
processes (job
relevance, output
quality, result
demonstrability, and
perceived ease of use)
significantly
influenced user
acceptance
(Venkatesh & Davis
2000).
First use it in
Management
Sciences in 2000.
Venkatesh and
Davis (2000)
Information
Systems,
Technology
Adoption

35
It is obvious that these models have been utilised in various studies in terms of mobile
phones, technologies, IT innovations, and services. However, the literature in the context
of m-Government services has not revealed any studies of a single model that combine
the Diffusion of Innovations Model (DOI) and the Technology Acceptance Model
(TAM) as well as Perceived Trustworthiness, Perceived Security, Perceived Enjoyment,
and Personal Innovativeness. The existence of this gap in the literature about the
adoption and intention to use m-Government services encouraged this research to
empirically test the combination of these models (DOI and TAM) as well as external
variables including Perceived Security, Perceived Trustworthiness, Perceived Enjoyment
and Personal Innovativeness in order to determine the factors that influence the intention
to use m-Government services. Therefore, in order to fill the gap, this research develops
a validated model with relevant hypotheses. The proposed model of this research is
meant to be useful for many countries considering delivery of m-Government services in
order to explain the factors that affect the intention to use m-Government services. It is
believed that the proposed model will contribute to the existing knowledge because it
incorporates many unexplored dimensions that influence the intention to use m-
Government services.
Rogers (2003) believes that any innovation is required to go through an innovation
decision process, in which an individual or other decision-making unit passes through
five stages as shown in Figure 2.1. Again, these five stages are: 1) first knowledge of an
innovation; 2) forming an attitude towards the innovation; 3) making a decision to either
adopt or reject the innovation; 4) implementing the innovation; and 5) confirming the
adoption of the innovation. Rogers also defines personal innovativeness as ’the degree to
which an individual or other unit of adoption is relatively earlier in adopting new ideas
than other members of a social system‘. He also classifies the members of a social
system in terms of their personal innovativeness into five categories: innovators; early
adopters; early majority; late majority; and laggards. The relative speed by which an
innovation is adopted by these members is called ‘rate of adoption’.

36
In short, Rogers’ theory describes the adoption and diffusion of innovations from four
broad perspectives. These four broad perspectives are:
The diffusion process seeks to understand the spread of innovations in terms of
the speed at which an innovation spreads within the population;
The adopter categorization seeks to understand the socio demographic
characteristics of population segments;
The innovation decision process seeks to understand how people adopt/reject and
re-invent innovations; and
The perceived attributes of innovations seek to understand the characteristics of
innovation itself in terms of relative advantage, compatibility, complexity,
trialability, and observability.
On the other hand, some previous researchers have criticized DOI theory; for instance,
they have argued that there is a lack of clear consistent results (Downs & Mohr, 1976;
Rogers, 2003; Tornatzky & Fleisher, 1990; Tornatzky & Klein, 1982; Van De Ven &
Rogers, 1988; Van de Ven & Angle., 1989). Further, although a large amount of research
on the DOI theory has been conducted across several disciplines, the challenge occurs in
the complex, context-sensitive nature of the diffusion phenomenon itself. Specifically, in
order to fully understand innovation, a careful attention to the personal, organizational,
technological, and environmental contexts is essential (Tornatzky & Fleischer, 1990).
Moreover, Dunphy and Herbig, (1995) state that there have been two main issues of
criticisms of DOI theory as follows:
There is a lack of process orientation. Research for instance do not track the
individual’s decision process over time, however, it tend to look only at the
moment of adoption; and
There is pro-innovation bias, which believes that all innovation is attractive.
As mentioned earlier in the research model (Figure 2.1) that the perceived attribute of an
innovation derived from Rogers Diffusion of Innovation theory will be utilized in this
study. Further, as shown above in the table 2.4, that several studies have included

37
Rogers’ five attributes of innovation in the diffusion of innovations context. These
perceived attributes are Relative Advantage, Compatibility, Complexity, Trialability and
Observability. They will be used in this study because they have essential influence on
the adoption of an innovation. This is because these five attributes explain (from 49 to
87) of the variance in the Rate of Adoption of innovations at the organizational level
(Rogers 2003). Table 2.4 below shows several studies utilizing Rogers’s DOI
Measurement attributes.
Table 2.4 Studies utilizing Rogers’s DOI Measurement Attributes
Source: Adapted from Conrad (2009)

38
2.5. Technology Acceptance Model (TAM)
In addition to using Rogers’ Diffusion of Innovations model, this study also uses the
TAM for the dependent variable, the ’Intention to Use‘, as the TAM model is considered
one of the most influential and most widely employed in the models in Information
System (IS) Literature in terms of predicting Intention to Use technologies (Conrad,
2009). Conrad also argues that TAM replaces the TRA’s attitude measures with two
technology acceptance measures (Perceived Ease of Use and Usefulness). Thus, in the
literature the TAM is considered the most influential extension of Ajzen and Fishbein’s
(1980) Theory of Reasoned Action (TRA).
Version 1 of the Technology Acceptance Model (TAM) developed by Davis (1989 is an
information systems theory that models how users approach, understand, and utilize an
innovation. In addition, as mentioned earlier that TAM includes two important variables.
These variables are as follows: Perceived Usefulness (PU) and Perceived Ease of Use
(PEOU); the former is ‘The degree to which a person believes that using a particular
system would enhance his or her job performance’; whereas the latter is ‘The degree to
which a person believes that using a particular system would be free from effort’ (Davis,
1989, p.320). Further, there is an overlap between some of the variables in the TAM and
Rogers' perceived attributes, which provides a chance for incorporation. There are
similarities with Rogers's Perceived Relative Advantage and Complexity with TAM's PU
and PEOU respectively. Again, in this study, PEOU will be incorporated with Rogers'
Model because this construct is well measured using the instrument scale developed by
Davis, 1989; Moore and Benbasat, 1991.
Research related to the TAM has shown well-validated measures of ‘Intention to Use’
that can be used to evaluate the intention toward adopting a new technology or an
innovation among individuals rather than using ‘Rate of Adoption’ measures. This is
because the Rate of Adoption construct requires longitudinal measurement and a
comparison sample (Conrad, 2009). In addition, Rate of Adoption is basically used to
predict the timing of adoption across a large number of individuals, thus it is not suitable
as an individual level measure of intention to use new technology (Conrad, 2009).

39
Therefore, for the purpose of this study, the construct ‘Intention to Use’ will be used as
key dependent variable to measure individuals’ intention to use mobile government
services instead of ‘Rate of Adoption’.
In the literature, the TAM is considered the most influential extension of Ajzen and
Fishbein’s (1980) Theory of Reasoned Action (TRA). Furthermore, the TAM has been
constantly studied by researchers and has been expanded several times. For instance,
Venkatesh and Davis have acknowledged that the TAM had some restrictions in
providing the reasons why a person would perceive a given system useful (Venkatesh &
Davis, 2000). Therefore, they proposed an additional variable which could be added as
an antecedent to the perceived usefulness variable in the TAM. For that reason, they
proposed a new model of the TAM called TAM 2 (Venkatesh & Davis, 2000) . In
addition, Venkatesh and Bala have upgraded TAM 2 to TAM 3 (Venkatesh & Bala,
2008).
Several scholars have made assumptions about the TAM. For instance, Davis argues that
the usage of a particular technology is voluntary (Davis, 1989). Further, given adequate
time and awareness about a particular behavioral activity, an individual’s stated
preference to perform the activity (i.e. behavioral intention) will in fact closely resemble
the way they do behave when the behavior is under a person’s volitional control (Ajzen
& Fishbein, 1980). Additionally, the TAM has strong behavioral elements assuming that
when individuals form an intention to act, they will be free to act without limitation,
whereas in the real world there will be several restrictions, such as limited ability, time
constraints, environmental or organizational limits, or unconscious habits that will limit
the freedom to act (Bagozzi, 1992).
The TAM2 was first introduced in Management Science in the research paper titled, ‘A
Theoretical Extension of the Technology Acceptance Model: Four Longitudinal Field
Studies’ (Venkatesh & Davis 2000). They developed TAM 2 for several reasons. For
instance, it was to include additional key determinants of the TAM that explain perceived
usefulness and usage intentions in terms of social influence and cognitive instrumental
40
processes and it was to understand how the effects of these determinants change with
increasing user experience over time with the target system (Venkatesh & Davis, 2000).
Many scholars have recommended the integration of the TAM with other theories (e.g.
DOI) in order to cope with swift changes in IS/IT, and improve specificity and
explanatory power (Carter & Belanger, 2005; Legris, Ingham, & Colerette, 2003).
Researchers argue that the constructs that are included in the TAM are considered to be
essentially a subset of perceived innovation characteristics; accordingly, the integration
of these two theories may well offer an even better model than either standing alone (Wu
& Wang, 2005; Chen, Gillenson, & Sherrell, 2002). This is in line with previous scholars
who have integrated these two theories and have achieved good results (Sigala, Airey,
Jones, & Lockwood, 2000; Chen et al, 2002). Additionally, in order to examine the
explanatory power of the TAM many scholars have conducted empirical studies and
accomplished relatively consistent results on the acceptance behavior of IT end users
(Igbaria, Zinatelli, Cragg, & Cavaye, 1997; Venkatesh & Davis, 2000; Horton, Buck,
Waterson, & Clegg, 2001). Therefore, in predicting the individual acceptance of
numerous systems, the TAM is believed to be valid (Chin & Todd, 1995; Segars &
Grover, 1993).
Although several studies have confirmed the strength of the TAM model, several
researchers have criticized the TAM’s theory. For instance, they have argued that TAM
has become a well known theory because it has been cited in most of the research that
deals with user acceptance of technology (Lee, Kizar, & Larson, 2003). However, less
attention has been given to the real problem of technology acceptance since TAM may
have attracted more easy and quick research, (Lee, Kizar, & Larson, 2003). Further,
Chuttur argues that criticisms of the TAM model fall into three categories; 1) the
methodology used for testing the TAM model, 2) the variables and relationships that
exist within the TAM model, and 3) the core theoretical foundation underlying the TAM
model (Chuttur, 2009). In addition, others suggest that ‘TAM has diverted researchers’
attention away from other important research issues and has created an illusion of
progress in knowledge accumulation’ (Benbasat & Barki, 2007). Moreover, several
41
researchers have attempted to expand TAM with the intention of adjusting it to the
frequently altering IT environments which has lead to confusion (Benbasat & Barki,
2007) Moreover, several researchers have attempted to expand the TAM with the
intention of adjusting it to the frequently altering IT environments which has lead to
confusion (Benbasat & Barki, 2007).
In short, this research uses DOI and TAM because they are important theories in guiding
understanding of adoption, acceptance and rejection of new technology (Davis, 1989;
Davis, Bagozzi, & Warshaw, 1992; Venkatesh et al., 2003; Ziamou, 2002). In addition,
these theories are used for research on acceptance, adoption and innovation-decision
process of both organisations and individuals (Gallivan, 2001). Also, they have strong
supporting methodological apparatus that makes them popular and accepted widely by
scholars (Venkatesh et al., 2003). Hitherto, several studies have successfully
incorporated DOI into TAM in order to investigate users’ technology acceptance
behavior (Hardgrave, Davis, & Riemenschneider, 2003; Wu & Wang, 2005; Chang &
Tung, 2008). However, few have attempted to examine all DOI perceived characteristics
with the integration of TAM. For that reason, this has encouraged this research to
empirically test and validate the combination (DOI) model and the (TAM) model as well
as external variables including Perceived Security, Perceived Trustworthiness, Perceived
Enjoyment and Personal Innovativeness. These variables were then synthesised into a
conceptual model and then the model was tested for its predictive value.
2.6. External Variables
Along with DOI and TAM models this study also integrates constructs such as Perceived
Trustworthiness, Perceived Security, Perceived Enjoyment and Personal Innovativeness.
Until now the literature has not revealed any studies that incorporate these constructs in
the DOI and TAM. For instance, Carter and Bélanger (2005) integrated constructs from
TAM and DOI models as well as Web Trust model in order to form a comprehensive
model of factors that impact citizen adoption of e-Government initiatives. The outcome
of their study indicates that Perceived Ease of Use, Compatibility and Trustworthiness

42
are significant predictors of citizens’ intention to use an e-Government service. Further,
Sally and Indrit (2007) added Perceived Enjoyment, Perceived Security and Personal
Innovativeness with TAM model in order to explain mobile service adoption behavior.
They also state that ‘The enjoyment that is perceived to be derived by using mobile
services is, therefore, expected to affect attitude and intention of users to adopt
them‘(Sally & Indrit, 2007, p.66). In addition, other scholars argue that mobile services
that offer enjoyment more broadly are more likely to be adopted by people than those
that do not (Fang et al. 2005).
2.7. Summary
In order to provide a background to the present study, this chapter has described m-
Government and the differences between m-Government and e-Government. The
definition of m-Government adopted in this research is also presented followed by m-
Government services and the enabling technologies. It has also described the critical
issues relating to m-Government including drivers, inhibitors, and adoption issues.
Further, it has discussed m-Government worldwide including in developing countries.
The main advantage of m-Government is that it provides services anytime and anywhere
to citizens through mobile devices including mobile phones, PDAs and other wireless
technology. A critical review and empirical work of the DOI model and the TAM model
is also provided in this Chapter.

43
Chapter 3.
A Model of Intention to Use Mobile Government Services
3.1. Introduction
Chapter 2 established the context of this research through reviewing the comprehensive
literature on m-Government as well as a critical review of the DOI and TAM models.
This included the factors that affect the intention to use m-Government services. This
chapter introduces the research model used as a basis for understanding the factors
influencing the intention to use m-Government services as well as the proposed
hypotheses. The independent factors used in this study are based on Roger’s Diffusion of
Innovations (DOI) theory. These factors include relative advantage, compatibility,
complexity, trialability and observability towards the intention to use ‘dependent
variable‘. The intention to use construct was derived from the Technology Acceptance
Model (TAM) theory, with the addition of the variables of age, gender, and education.
The important factors of personal innovativeness, perceived trustworthiness, perceived
security and perceived enjoyment derived from the literature are also included in the
proposed research model in this study (see Figure 3.1 in Section 3.2).
In order to fulfil the aims of this study, linkages between variables in the model are
drawn and justified in order to lead to the proposition of relevant hypotheses that are
used to test each variable in the research model. Examination of these variables and
incorporating them into the proposed model of this study is expected to provide valuable
insights into the adoption of m-Government services by individuals. This chapter starts
with Section 3.2, the proposed research model, including a description of the perceived
attributes of innovations in the DOI model. Again, these perceived attributes are relative
advantage, compatibility, complexity, trialability and observability followed by the

44
‘intention to use’ construct since this construct will also be incorporated in the proposed
model. After that, the other variables that will be used in the research model which
include perceived security, perceived trustworthiness, personal innovativeness, perceived
enjoyment, demographics are also discussed.
3.2. Research Model
This study applies Rogers’ Diffusion of Innovations theory as a base model because it is
well established and has been extensively used in research on information technology
diffusion (Prescott & Conger, 1995; Braak & Tearle, 2007; Choudhury & Karahanna,
2008; and Conrad, 2009). In addition, this theory fits well with peoples’ understanding of
the adoption of technology (Conrad, 2009), particularly in the context of developing
countries (Prescott & Conger 1995). Further, the Diffusion of Innovations theory is one
of the earliest technology adoption theories used in Information System (IS) research
(Rogers 1995). Additionally, when it comes to both the organisational and individual
levels, Rogers is considered the only innovation scholar to pose diffusion theories
(Conrad, 2009).
While TAM and DOI models have substantial explanatory power, TAM is considered
low in descriptive richness that enables researchers to draw conclusion (Plouffe, Hulland
& Vandenbosch, 2001). Furthermore, Srite (2006), Kimery and Amirkhalkhali (2007)
explained a comparison of variance for both DOI and TAM. They indicate that DOI
model is more reliable across countries. This is because the findings of thesis two studies
indicate that the perceived characteristics of innovations (PCI) in DOI model yields
consistent variance explained across cultures (Srite, 2006; Kimery & Amirkhalkhali
2007).

45
Gender
Age
Education
Personal
Innovativeness
Relative
Advantage
Compatibility
Perceived Ease
of Use
Trialability
Observability
Perceived
Trustworthines
Perceived
Security
Perceived
Enjoyment
Intention to use
m-Government
services
Impact
Impact
Impact
Impact
Impact
Impact
Impact
Impact
Impact
Influence
Figure 3.1 A conceptual model used in this study
The main constructs of the research model as shown in Figure 3.1 are:
The dependent variable referred to as Intention to Use;
Independent variables that may impact on Intention to Use (Relative Advantage ,
Compatibility, Perceived Ease of Use, Trialability, Observability, Perceived
Trustworthiness, Perceived Security, Perceived Enjoyment and Personal
Innovativeness); and
Independent variables that may have differing influences on the independent
variables depending on the characteristics of each person (Gender, Age and
Educational attainment).

46
People represented in the sample including male/female; young/old; students/employees;
educated and less-educated. The justification for these constructs in the research model is
discussed in detail in the following sections as well as the development of related
relevant hypotheses.
These perceived attributes of innovations will be utilized in this study as independent
variables. In addition to these variables, as mentioned previously, the literature has
highlighted important variables that should also be integrated into the model in this
study. These variables are perceived trustworthiness, perceived security, personal
innovativeness and perceived enjoyment. These variables were chosen because they
appear to be the most commonly used variables in the literature in the context of
information systems research and specifically in the research on the adoption and
diffusion of innovations.
More details about the variables used in this study are discussed in the following
subsections.
3.2.1. Relative Advantage
Relative advantage is defined by Rogers (2003) as ’the degree to which an innovation is
perceived by users as better than the idea it supersedes’ (p.15) and can be measured in
terms of economic and social factors. In addition, Rogers argued that in order for citizens
to use an innovation, they should perceive the innovation as beneficial (Rogers 2003). He
added that scholars have found this variable to be one of the strongest predictors of an
innovation’s rate of adoption. This is an agreement with Trinkle (2001), who argues that
citizens would adopt mobile services more quickly if the government were more
responsive and informed in providing such advantageous services to them. Therefore, in
order for citizens to adopt such an innovation, they need to see the beneficial value of
this innovation.
In the context of different innovations and different consumers, Relative Advantage can
be seen differently (Mattila, Karjaluoto & Pento, 2003). For instance, Lichtenstein and

47
Williamson,(2006) argue that the consumer considers that the perceived relative
advantages of Internet banking, for example, outweigh the perceived risks and costs
when compared with other forms of banking. Sarel and Marmorstein (2003) stated that
when the relative advantage of any innovation is low, marketers must make efforts to
increase the perceived value of the benefits.
The potential users, for instance, need to consider various variables such as the degree of
risk, economic profitability, the savings in time and effort, etc. For example, the Mobile
Parking Service allows citizens to reserve and pay their parking fees via their mobile
phones on the spot instead of going to the counter or coin machine. This service also
saves them time, and enables them to pay more quickly and easily, giving them with
advantage of time and convenience. Conrad (2009) also argued that the characteristics of
the potential users could affect which specific subdivision of Relative Advantage is the
most significant. He also added that despite the type of technological innovation,
Relative Advantage has a positive effect and is considered to be the most gereralizable
amongst Rogers’ five attributes. Therefore, based on these benefits, the following
hypothesis is proposed:
H1: Higher levels of perceived relative advantage will be positively related to higher
levels of intention to use m-Government services.
3.2.2. Compatibility
Compatibility refers to the degree to which an innovation is perceived by users as
consistent with their existing values, past experiences, and the needs of potential adopters
(Rogers 2003, p.15). Moreover, high level of compatibility of innovation increases the
diffusion’s intention to use. This is because an innovation that seems to be incompatible
with the values and norms of a social system will not be adopted as swiftly as an
innovation that is compatible (Rogers 2003). This aspect is considered one of the most
relevant constructs in the context of adoption research (Tornatzky & Klein 1982). This is
an agreement with Carter and Bélanger (2005) who found that compatibility is a
significant indicator in predicting citizens’ intention to use e-Government services. In

48
addition, previous studies by Sarel and Marmorstein show that compatibility appears to
have a significant impact on willingness to adopt an innovation (Sarel & Marmorstein
2004). Therefore, following these arguments, if the new idea gives meaning or is more
familiar to the individuals they will be more willing to adopt the innovation since it
appears to be compatible with their lifestyle. Therefore, the following hypothesis is
proposed:
H2: Higher levels of perceived compatibility will be positively related to higher levels
of intention to use m-Government services.
3.2.3. Complexity/Perceived Ease of Use
Rogers’ (2003, p.16) construct of Complexity refers to the degree to which the users
perceive an innovation is relatively difficult to understand and use. This means that new
ideas that are easy and simple to use and understand are adopted more swiftly than
innovations that require the development of new skills and understanding (Rogers 2003).
This is similar to the Perceived Ease of Use (PEOU) construct in the TAM. It is also in
agreement with previous studies of Tan and Teo (2000), who state that the more
complex, and the greater the skill and effort needed for adopting the innovation, the less
likely it is to be adopted. Agarwal and Prasad (1997) have also argued that individuals
perceive the complexity of an innovation differently. For instance, the perception of
complexity involved in using Mobile Parking Service via a mobile channel varies for
different individuals, depending on their experience of using Mobile Parking Service. In
this study, PEOU will be incorporated with Rogers' Model because this construct has
been well measured using the instrument scale developed by Moore and Benbasat,
(1991). Hence, this leads to the following hypothesis:
H3: Higher levels of perceived ease of use will be positively related to higher levels of
intention to use m-Government services.
49
3.2.4. Trialability
Trialability is the degree to which an innovation may be experimented with prior to
adoption (Rogers 2003, p.16). If individuals have the chance to try the innovation prior
to adopting it, they will feel more comfortable about using it and more likely to adopt it
quickly. In addition, if an innovation is trialable, it will provide the individual with more
confidence and less uncertainty towards their intention to use (Rogers 2003). This is an
agreement with Gerrard and Cunningham (2003) who argue that experimenting with the
innovation can persuade individuals that their mistakes can be resolved, therefore
providing a more predictable situation and providing greater confidence in the use of the
innovation. Therefore, having a chance to try the innovation will increase its intention to
use. Hence, the following hypothesis is proposed:
H4: Higher levels of perceived trialability will be positively related to higher levels of
intention to use m-Government services.
3.2.5. Observability
Observability is the ‘degree to which the results of an innovation are visible to others’
and how easily the benefits can be communicated to others (Rogers 2003, p.16).
According to Moore and Benbasat (1991), observability incorporates two specifically
different dimensions, Result demonstrability and Visibility. The former refers to the
outcomes of using the innovation, while the latter is the observability of the innovation
itself. The results of using some innovations are easy to observe and visible to
individuals, thus, they will be more likely to adopt them more quickly and easily. For
example, the results of using Mobile Parking Service are observable and visible to
individuals, so this system would be diffused faster than an innovation that is not so
visible. This is why Rogers states that there is a positive relation between observability
and adoption. Hence, the following hypothesis is proposed:
H5: Higher levels of perceived observability will be positively related to higher levels of
intention to use m-Government services.

50
3.2.6. Intention to Use
The Perceived Characteristics of Innovation (PCI) variables, external variables and
demographic variables lead to the final stage of determining individuals’ intentions to
use m-Government services. This includes both users and non-users - the former being
people who are using m-government services, and the latter being people who have not
yet used m-government services. Non-users need to make the decision to either adopt the
service or reject it. Users may either continue or discontinue with the service. The
Intention to Use construct was derived from the Technology Acceptance Model (TAM).
Fishbein and Ajzen (1975), argue that behavioral intention can be seen as a guide of how
hard people are willing to try to perform a particular behavior. Consequently Davis
(1989) has extended the Intention to Use definition to include the intention to use
technology. Armitage and Christian (2003) argue that behavioral intentions are defined
as an individual’s decision to follow a course of action. Nysveen, Pedersen, and
Thorbjørnsen, (2005) have also extended the definition of Intention to Use in the context
of the adoption of mobile services.
In common with the present study, several authors including Tan and Teo (2000), Black
et al. (2001), Polatoglu and Ekin (2001), and Al-Sabbagh and Molla (2004) have used
Rogers' independent variables as influencing the dependent variable of Intention to Use,
rather than Rate of Adoption in the DOI. This is because ’the rate of adoption is usually
measured by the length of time required for a certain percentage of the members of a
system to adopt an innovation‘(Rogers 2003, p.23). Further, the Rate of Adoption
variable is not appropriate as individual-level of Willingness to Use new technology at
the beginning of its introduction (Conrad, 2009). However, this research gathers data
from Oman and in particular Muscat within short time period. Further, m- Government
services in Oman are only in an early stage of development. Therefore, because of the
length of time issue, this study will measure ‘Intention to Use’ as a dependent variable
rather than ‘Rate of Adoption’.
In addition, the literature has revealed important variables that will be incorporated in the
proposed model of this study. With the addition of the variables of age, gender,

51
educational attainment and personal innovativeness (Rogers 2003; Agarwal & Prasad
1997), the important variables of perceived trustworthiness (Bélanger & Carter 2008; Li,
Hess & Valacich, 2008), perceived security (Fang et al. 2007) and perceived enjoyment
(Hong et al. 2008) derived from literature were also included in the proposed research
model of this study. These variables of perceived security, personal innovativeness,
perceived enjoyment and perceived trustworthiness are discussed in the following
sections.
3.3. Perceived Trustworthiness
Along with DOI variables that impact on citizens’ intention to use m-Government
services; Perceived Trustworthiness is also an important variable, Bélanger, Janine, and
Wanda (2002) define trustworthiness as ‘the perception of confidence in the electronic
marketer’s reliability and integrity’ (p.252). This is because citizens must have
confidence in order to increase their Intention to Use m-Government services. This is in
accordance with a report by the Hart-Teeter National Survey of the General Accounting
Office GAO (2001) finding that Americans believe that e-Government may enhance the
way government operates, but they fear about sharing private information with the
government through the internet, fearing that the data will be altered and their privacy
diminished (GAO, 2001). It can be explained that these fears delay the Intention to Use
e-Government and m-Government services. According to Palvia, (2009) trust has a
significant effect on participation intention through usage attitude. Further, Wei et al.
(2009) found that there is there is a strong positive relationship between trust and the m-
Commerce adoption.
Lack of trust in online transactions has been acknowledged by Bélanger and Carter
(2008); Horst, Kuttschreuter and Gutteling (2007) as one of the main barriers in the
adoption of e-Government services. This is because uncertainties and risks usually occur
when conducting such transactions online (Bélanger & Carter, 2008). Therefore, in order
to insure the creditability of online services, the governments should always establish
trust (Warkentin et al., 2002). This is an agreement with several authors who argue that

52
one of the critical factors in the adoption of e-Government services is trust (Warkentin
al., 2002; Horst, Kuttschreuter and Gutteling (2007); Bélanger & Carter, 2008; &West,
2008). For instance, when users are performing administrative transactions or accessing
information via governmental portals, they expect the online information to be reliable,
updated and accurate. For this reason, it is expected that trust would play an important
role in increasing the adoption of online services (Bélanger & Carter, 2008). This is in
line with West (2008) who argues that ’Visible statements outlining how a site insures
visitors’ privacy and Perceived Security are valuable assets for encouraging people to use
e-Government services and information‘ (p.9). Therefore, the perception of
trustworthiness could also impact citizens’ intention to use m-Government services in
general and Mobile Parking Service in particular. Hence, the following hypothesis is
proposed:
H7: Higher levels of Trust in m-Government services will be positively related to higher
levels of intention to use.
3.4. Perceived Security
The emergence of m-Government services has raised various issues, among which is
security. This is one of the technical barriers to m-Government diffusion, according to
Al-Khamayseh et al (2006a); the Perceived Security of m-government services is
considered the hallmark of a successful initiative. Smith and Jamieson (2006)
acknowledge the main issues related with Information System Perceived Security in e-
Government as being: Training, Management Support, Budget, Cost, Resources and
Awareness. Although not all of these issues are applicable to all
governments/organizations, in respect of information security Perceived Security they
could appear to be important to a large number of organizations as key drivers or key
inhibitors.
Many people still hesitate to use m-Government services due to their lack of trust in
technology, which in turn negatively influences their intentions. This is in agreement

53
with Chang and Kannan (2002) who argue that Perceived Security and privacy are the
most important issues affecting the adoption of m-Government services. Al-Sabbagh and
Molla (2004) found that besides Trust (as mentioned earlier) Perceived Security is a
major inhibitor of internet banking adoption in Oman. Previous researchers also found
that Perceived Security is a significant inhibitor in the adoption of mobile services (Fang,
Brzezinski & Xu, 2005). These findings indicate that Perceived Security could play a
vital role in Mobile Parking Service dissemination.
In many countries, citizens are concerned about Perceived Security in m-Government
services. For instance, Antovski and Gusev (2005) pointed out that when people SMS
inquiries to government entities, they fear that their mobile phone numbers may be traced
or sold to third parties. Furthermore, wireless networks are vulnerable when compared to
wired networks, because they use public airwaves to send signals that allow outsiders to
intercept and steal significant data as well as tamper with files. Therefore, in order for the
government to encourage mobile users to use their m-Government services, they must
assure them that their privacy is protected and their data will not be sold to third parties.
On this basis, Perceived Security of m-Government services has been deemed as a vital
issue to assess and investigate. Hence, the following hypothesis is proposed:
H8: Higher levels of Perceived Security in m-Government services will be positively
related to higher levels of Intention to Use.
3.5. Perceived Enjoyment
This study includes another variable that could play an important role on intention to use
m-Government services. This variable is Perceived Enjoyment, which is ’the extent to
which the activity of using a certain technology is perceived as being enjoyable in its
own right, apart from any performance consequences that may be anticipated‘(Davis,
Bagozzi & Warshaw, 1992, p.435). Previous studies (Davis, Bagozzi & Warshaw, 1992;
& Kulviwat et al., 2007) argue that perceived enjoyment or fun is a critical factor driving
technology adoption. Another study of mobile advertising via SMS also indicates that

54
consumers are more likely to accept mobile advertising when the campaign is fun or
interesting (Randolph et al. 2005). These findings indicate that creating a fun and
enjoyable situation may assist in creating favorable consumer perceptions contributing to
the usage of innovative technologies, especially for personalized services like mobile
data services. Those individuals who have experienced enjoyment from using mobile
data services are more likely to develop a positive attitude toward continued usage of
such services.
Previous studies by Davis, Bagozzi & Warshaw, (1992) found that Perceived Enjoyment
significantly influences intentions to use technology. Similarly previous studies including
that of Anckar and D’lncau (2002), suggest that Perceived Enjoyment is one of the most
significant factors in individual desire and users usually access their mobile services
from anywhere and anytime in order to pass the time enjoyably.
Perceived Enjoyment may be seen as positively influencing users’ attitudes towards
individuals’ intentions to use mobile services. Hence, enjoyable mobile services are
likely to be adopted more swiftly than those which are not (Fang et al. 2007). These
findings indicate that if the innovation is perceived as enjoyable, it is more likely to form
a positive perception and be adopted easily. Thus, on this basis it is expected that
Perceived Enjoyment may also increase users’ intention to use m-Government services.
Hence, the following hypothesis is proposed:
H9: Higher levels of perceived enjoyment in m-Government services will be positively
related to higher levels of intention to use.
3.6. Personal Innovativeness
Rogers (2003) defines personal innovativeness as ’the degree to which an individual or
other unit of adoption is relatively earlier in adopting new ideas than other members of a
social system‘(p.22). Personal innovativeness or technology readiness could also be
identified as the risk-taking propensity existing in certain individuals (Massey, Khatri &
Ramesh, 2005). According to Agarwal and Prasad (1997), individuals with higher

55
personal innovativeness are more likely to form a positive attitude towards using the
innovation than those with less personal innovativeness. Thus, the personality variable
will determine traits in terms of innovativeness of the individual towards the innovation.
Rogers also in 2003 has indicated general socio-economic predictors of personal
innovativeness. For instance, age is not considered a factor for personal innovativeness,
whereas, education and literacy are considered essential predictors for personal
innovativeness.
The Diffusion of Innovations theory takes account of the fact that individuals have
differing predilections towards acting innovatively. Rogers (2003) acknowledged that
some people are able to manage high levels of uncertainty and respond more positively.
Agarwal and Prasad (1997), argued the same, and explained this tendency as personal
innovativeness, noting that it indicated the risk-taking propensity existing in some
individuals and not in others. Furthermore, the extent of a person’s innovativeness that
influences his or her intention to adopt is determined by whether there is no prior
perception of ease of use or perceived usefulness because of little knowledge about the
innovation. The construct of personal innovativeness is vital to a research study of
individual behavior toward innovations (Rogers 2003). Furthermore, this variable will
assist in recognizing individuals who are expected to adopt innovations in information
technology before others (Agarwal & Prasad, 1997). Hence, the following hypothesis is
proposed:
H6: Higher levels of personal innovativeness will be positively related to higher levels of
intention to use m-Government services
3.7. Demographics
The importance of the variables in the propose model is expected to differ for people
characteristics such as gender, age, and education. They provide guidelines to mobile
service marketers and developers in understanding different demographics, thus,

56
providing insights affecting segmentation strategies (Nysveen, Pedersen & Thorbjørnsen,
2005).
Researchers including Bouwman et al. (2008) suggest that demographic variables are
vital to investigation in the mobile services context. Therefore, as demographic variables
are critical to the understanding of the intention to use m-Government services, they
might be vital in determining how individuals make decisions to use m-Government
services. Further, Venkatesh, Morris & Ackerman (2000) and Rogers (2003) investigated
gender and age differences in the context of the adoption of new technology, and found
that there are no significant gender and age differences in the determinants of technology
use. Agarwal and Prasad (1997) have argued that levels of education influence
willingness to adopt technology and Rogers (2003) found that more educated people are
more likely to start using an innovation than less educated. Further, Al-busaidi and
Olfman (2005) argue that culture is vital in the implementation and adoption of ICT-
based systems such as mobile services. If these systems fail, this could be due to some
cultural factors.
Additionally, Alshihi (2006) argue that a government official revealed that female users
are more likely to use e-Government in Oman because it is more convenient for them. He
justifies this because of the conservative value system in Oman where women prefer not
to go out in public alone. Although females in Oman are equally treated as males (e.g.
females in Oman can drive, have the right to vote, holding high positions in the country as
Ministers, Undersecretaries, Member of Parliament, Ambassadors, etc), some cultural
challenges might still affect the adoption of the m-Government service.
Further, several studies (Venkatesh & Morris, 2000; Chen & Wellman, 2004; MacGregor
& Vrazalic, 2006; Laukkanen & Pasanen, 2008) conducted in ‘Western cultures’ indicate
that males are more likely to adopt e-services than females. However, in Saudi Arabia
this might not be the case with females more likely to adopt e-services than males
(Siddiqui, 2008). This is because the culture of the Saudi Arabia can be described as
conservative. Rogers (2003) also argues that the adopter of a new technology is usually
having an appropriate level of education than the non-adopter. This is an agreement with

57
many researchers as Madden and Savage (2000), Dobbins et al. (2002), Mason and
Hacker (2003), Choudrie and Dwivedi (2005) and Marchionni & Ritchie (2007) who
concluded that adopters are usually have a good level of education. Thus, the following
hypotheses are proposed:
H10: Gender will influence the intention to use m-Government services
H11: Age will not influence the intention to use m-Government services
H12: Education will positively influence the intention to use m-Government services
On the other hand, some variables that seemed to be important, such as cost, digital
divide and popularity were not seen as feasible within the focus of the study and
therefore they have not been included in the research model. This is because most m-
Government services are provided to citizens for free (Push services) or at minimal cost
(Pull services) Further, mobile phones and SMS technology are very popular with users.
Recent statistics show that the number of mobile users exceeds the total population in
Oman and this phenomenon is reflected worldwide (TRA–Oman, 2011). Therefore
digital divide and popularity have little effect on m-Government as oppose to e-
Government.
In conclusion it is apparent from the literature that all DOI variables such as relative
advantage, compatibility, complexity, trialability and observability as well as others
derived from literature including perceived trustworthiness, perceived security, personal
innovativeness and perceived enjoyment constitute major issues to be confronted by the
governments and mobile service providers when introducing new mobile government
services. However, the application of Rogers’ Diffusion of Innovations (DOI) and the
Technology Acceptance Model (TAM) will assist the governments to enhance the
political context in terms of leadership support of m-Government services and to
understand the factors that affect the intention to use m-Government services.

58
3.8. Summary
The use of the well-recognized theory of Diffusion of Innovations (DOI) incorporated
with the Technology Acceptance Model (TAM) and with the addition of the variables of
Perceived Trustworthiness, Perceived Security, Personal Innovativeness and Perceived
Enjoyment derived from the literature as a basis for a new model was discussed. The
incorporation of Rogers’ theory with other variables has resulted in an integrative
research model of intention to use m-Government services and the proposition of a
number of hypotheses. The justifications for the constructs of the research model were
discussed in detail as well as the development of related hypotheses. The following
chapter, Chapter 4: Research Method and Realisation, provides the research method used
to examine the proposed research model empirically and confirm the hypotheses
presented in Chapter 3. Chapter 4 also presents in detail the empirical phase of the
research that uses a mixed approach of quantitative surveys and qualitative semi -
structured interviews.

59
Chapter 4.
Research Method and Realisation
4.1. Introduction
This chapter presents the research method used to validate a model of intention to use m-
Government services as presented in Chapter 3. The method is to confirm or otherwise
the hypotheses of the model and hence the extent of its predictive value. This chapter
consists of the following sections. The first Section 4.1 presents the Introduction
followed by the second Section 4.2 which introduces the research aims and the expected
research outcomes. The basic research approach and why it is appropriate to this research
is described in Section 4.3. The research design is described in Section 4.4, and the case
study used in this research is presented in Section 4.5. Section 4.6 describes the data
collection technique used in this study. It describes in detail the approach used, including
the measurement of variables, questionnaire design and content, pilot study, sample
population and size, interview design, interviewee selection, and this is followed by a
discussion of its validity and reliability in Section 4.7. After that, Section 4.8 describes
the data analysis of the quantitative date and the qualitative data. Finally, the chapter
concludes with Section 4.9 Ethical Considerations and Section 4.10 the Summary of this
chapter.
4.2. Research Aims and Expected Outcomes
The primary aim of this research was to develop and validate a model of intention to use
m-Government services. This was achieved by testing the validity of an adapted model.
This adapted model was based on the well-known theory of Diffusion of Innovations
(DOI) and the Technology Acceptance Model (TAM) as well as other important
variables revealed by the literature including perceived trustworthiness, perceived
60
security, perceived enjoyment and personal innovativeness. It was investigated within the
Omani context and specifically the Muscat urban environment. Specifically, this research
aimed to examine:
The impact of perceived characteristics of m-Government services on intention to
use m-Government services as perceived by users and non-users. These perceived
characteristics include relative advantage, compatibility, complexity, trialability,
and observability, perceived trustworthiness, perceived security, personal
innovativeness and perceived enjoyment;
The influence of demographic variables including gender, age and educational
attainment of users and non-users on the perceived characteristics of m-
Government services;
The relationships between young and old people in terms of all measured
variables including relative advantage, compatibility, complexity, trialability, and
observability, perceived trustworthiness, perceived security, personal
innovativeness and perceived enjoyment;
The relationships between males and females in terms of all measured variables
including relative advantage, compatibility, complexity, trialability, and
observability, perceived trustworthiness, perceived security, personal
innovativeness and perceived enjoyment; and
The relationships between highly-educated and less-educated people in terms of
all measured variables including relative advantage, compatibility, complexity,
trialability, and observability, perceived trustworthiness, perceived security,
personal innovativeness and perceived enjoyment.
As mentioned above, this research aimed to address the factors influencing the intention
to use m-Government services. Therefore, it has produced the following research
outcomes:
A validated model of the intention to use m-Government services. This is the
major expected outcome of this research as it is anticipated to assist the

61
governments, decision makers, mobile service providers and stakeholders in
introducing and implementing m-Government services with some considerations
of the important predictive values;
The strongest and weakest predictive value that will impact on intention to use m-
Government services;
An understanding of a comparison between young and old people and their
relationships with all the measured variables including relative advantage,
compatibility, complexity, trialability, and observability, perceived
trustworthiness, perceived security, personal innovativeness and perceived
enjoyment;
An understanding of comparison between males and females and their
relationships with all the measured variables including relative advantage,
compatibility, complexity, trialability, observability, perceived trustworthiness,
perceived security, personal innovativeness and perceived enjoyment; and
An understanding of comparison between highly-educated and less-educated
people and their relationships with all the measured variables including relative
advantage, compatibility, complexity, trialability, and observability, perceived
trustworthiness, perceived security, personal innovativeness and perceived
enjoyment.
4.3. Research Paradigm
A research paradigm is defined as ‘a set of linked assumptions about the world which is
shared by a community of scientists investigating that world’ (Deshpande, 1983, p. 101).
As observed by Yin (2009), the research approach or paradigm is when the empirical
data is connected in a logical sequence to a study’s initial research questions to its
conclusion (Yin 2009). Therefore, this research aimed to collect data on relevant
variables from a diversity of people within a short time frame rather than over long
period as occurs in a longitudinal study. Therefore, in accordance with this shorter
period, this research adopted a cross-sectional design as most suitable for this research.

62
There are three philosophical paradigms that social researchers have long debated about
the appropriate approach to choose in order to conduct research. These are positivism,
interpretivism, and critical theory (Orlikowski & Baroudi 1992; Trauth, 2001). However,
Chua (1996); Neuman (2000); Hussey and Hussey (2003); and Creswell (2009) identify
four philosophical perspectives on research methodologies: Post-positivism/ Positivism,
Interpretivism, Advocacy and participatory, and the Pragmatic paradigm.
The Postpositivism/Positivist paradigm is more concerned with quantitative research than
qualitative research where the individual starts with a theory and collects data that will
either support or reject the hypotheses. In quantitative studies, researchers build
relationships among variables and form them into questions or hypotheses and test the
validity and reliability of these questions (Creswell 2009). Moreover, quantitative
research is about prediction, using numbers to confirm or otherwise hypotheses as well
as generalizing a sample to a large group of subjects in order for researchers to draw a
sample of individuals at random from a broader population (York, 1998).
However, the Interpretivism paradigm is more of qualitative research approach and the
aim of it is to depend heavily on the participants’ views of the case being studied. On the
other hand, qualitative research is believed to be the core of all human inquests as
previous scholars argue that it is ‘any type that produces findings not arrived at by
statistical procedures or other means of quantification’ (Strauss & Corbin 1998, p.10).
The advocacy and participatory paradigms is an approach for qualitative research
(Creswell 2009) whereas, the Pragmatic paradigm is an approach for mixed methods
research when combining both qualitative and quantitative research (Cherryholmes,
1992; Morgan, 1997; and Creswell, 2009). The value of this pragmatic paradigm is to
focus on the research problem and then use the appropriate approaches to gain
knowledge about the research problem (Creswell 2009). Table 4.1 below shows a
summary of the main differences between the two most commonly used paradigms;
positivism and interpretivism:

63
Positivism Interpretivism
Reason for the research To discover natural laws so
people can predict and control
events
To understand and describe
meaningful social action
Nature of social reality Stable pre-existing patterns or
order that can be discovered
Fluid definitions of a situation
created by human interaction
Nature of human beings Self-interested and rational
individuals who are shaped by
external forces
Social beings who create
meaning and who constantly
make sense of their worlds
Role of common sense Clearly distinct from and less
valid than science
Powerful everyday theories used
by ordinary people
Theory looks like A logical, deductive system of
interconnected definitions,
axioms, and laws
A description of how a group’s
meaning system is generated
and sustained
An explanation that is true Is logically connected to laws
and based on facts
Resonates or feels right to those
who are being studied
Good evidence Is based on precise observations
that others can repeat
Is embedded in the context of
fluid social interactions
Place for values Science is value free, and values
have no place except when
choosing a topic
Values are an integral part of
social life: no group’s values are
wrong, values only differ
Table 4.1 Main Differences between Positivism and Interpretivism
Source: Adapted from Neuman (1997:83)
Information System (IS) research can choose any one of these philosophical paradigms,
depending on the causal research epistemology (Orlikowski & Boroudi, 1992; and
Myers, 1997). Hence, the Positivist paradigm is best suited for this research as it is
specifically designed for the quantitative research approach. In addition, this research
meets the key assumptions of the Positivist paradigm identified by Phillips and Burbules
(2000), such as:
Knowledge is conjectural- absolute truth can never be found. For instance,
Researchers cannot prove a hypothesis; instead they only indicate a failure or
reject the hypothesis;

64
Research is the process of making claims and then refining some of them for
other claims. Most quantitative research starts with the test of a theory;
Data, evidence, and rational considerations shape knowledge. In practical, the
researcher collects information on instruments based on measures completed by
the participants;
Research seeks to develop relevant, true statements. In quantitative research,
researchers advance the relationships among variables and pose this in terms of
questions or hypotheses; and
Being objective is an essential aspect of competent inquiry; researchers must
examine methods and conclusions for bias. For instance, standard of validity and
reliability are important in quantitative research.
There are three types of research approach; qualitative research that aims to explore and
understand the meaning of individuals or groups of a social or human problem,
quantitative research which tests objective theories by examining the relationship among
variables which are then measured and analysed statistically; and mixed methods
research which includes both qualitative and quantitative research so that its overall
strength is greater than either qualitative and quantitative research alone. This is in
agreement with Creswell and Plano Clark (2007) who define mixed methods as follows:
’Mixed methods research is a research design with philosophical assumptions as well as
methods of inquiry’ (p.5). The advantage also of using mixed methods approach is that
the combination provides a wider and greater understanding of research problems
(Creswell 2009). In accordance with Denzin and Lincoln (2005), the proposed study uses
multiple methods for triangulation in order to secure in-depth understandings of the
phenomena in question. Table 4.2 below shows the advantages of a mixed methods
approach.
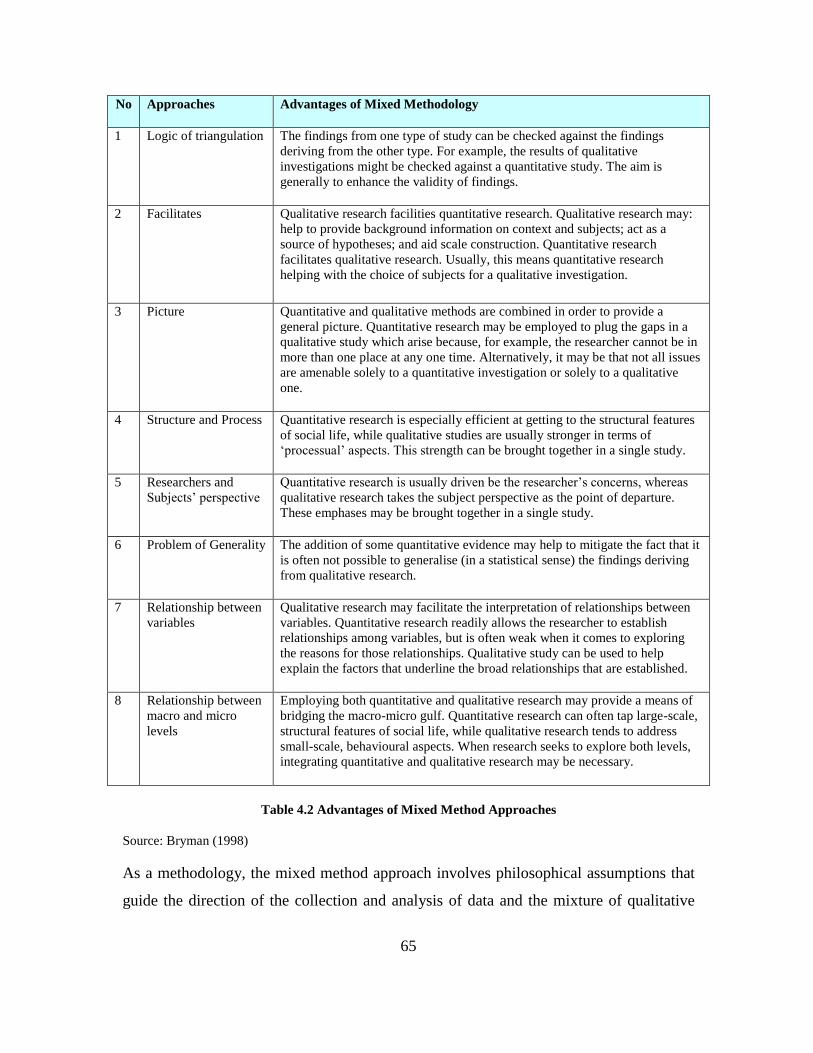
65
No Approaches Advantages of Mixed Methodology
1 Logic of triangulation The findings from one type of study can be checked against the findings
deriving from the other type. For example, the results of qualitative
investigations might be checked against a quantitative study. The aim is
generally to enhance the validity of findings.
2 Facilitates Qualitative research facilities quantitative research. Qualitative research may:
help to provide background information on context and subjects; act as a
source of hypotheses; and aid scale construction. Quantitative research
facilitates qualitative research. Usually, this means quantitative research
helping with the choice of subjects for a qualitative investigation.
3 Picture Quantitative and qualitative methods are combined in order to provide a
general picture. Quantitative research may be employed to plug the gaps in a
qualitative study which arise because, for example, the researcher cannot be in
more than one place at any one time. Alternatively, it may be that not all issues
are amenable solely to a quantitative investigation or solely to a qualitative
one.
4 Structure and Process Quantitative research is especially efficient at getting to the structural features
of social life, while qualitative studies are usually stronger in terms of
‘processual’ aspects. This strength can be brought together in a single study.
5 Researchers and
Subjects’ perspective
Quantitative research is usually driven be the researcher’s concerns, whereas
qualitative research takes the subject perspective as the point of departure.
These emphases may be brought together in a single study.
6 Problem of Generality The addition of some quantitative evidence may help to mitigate the fact that it
is often not possible to generalise (in a statistical sense) the findings deriving
from qualitative research.
7 Relationship between
variables
Qualitative research may facilitate the interpretation of relationships between
variables. Quantitative research readily allows the researcher to establish
relationships among variables, but is often weak when it comes to exploring
the reasons for those relationships. Qualitative study can be used to help
explain the factors that underline the broad relationships that are established.
8 Relationship between
macro and micro
levels
Employing both quantitative and qualitative research may provide a means of
bridging the macro-micro gulf. Quantitative research can often tap large-scale,
structural features of social life, while qualitative research tends to address
small-scale, behavioural aspects. When research seeks to explore both levels,
integrating quantitative and qualitative research may be necessary.
Table 4.2 Advantages of Mixed Method Approaches
Source: Bryman (1998)
As a methodology, the mixed method approach involves philosophical assumptions that
guide the direction of the collection and analysis of data and the mixture of qualitative

66
and quantitative data in a single study or series of studies. Its central premise is that the
use of quantitative and qualitative approaches in combination provides a better
understanding of research problems than either approach alone (Creswell 2009).
Therefore, in collecting informative data in a short time frame, the data collection
technique utilized in this study is the mixed method technique. In addition it has the
advantage that one approach builds on the results from the other, which in turn provides
strength to the findings and further confirmation of the hypotheses. Thus, two stages for
data collection were used in this research; firstly large scale survey questionnaires for the
quantitative stage and secondly semi-structured interviews for the qualitative stage. The
former were used to test the model and confirm the hypotheses, and the latter were used
to elaborate findings from the survey questionnaires and provide further confirmation for
the research model and hypotheses. According to Neuman (2006), a survey is a closed,
planned research method that is appropriate when the researcher needs to learn about
people’s thinking or opinions in regard to a precise matter.
There are three strategies underpinning the mixed methods approach that the researcher
may adopt (Creswell 2009). These three strategies are concurrent mixed methods,
transformative mixed methods, and sequential mixed methods. The first strategy is where
the researcher combines both quantitative research and qualitative research in order to
provide a comprehensive analysis of the research problem. The researcher collects both
forms of data at the same time, and then analyzes both in order to obtain the overall
results. The second strategy is transformative mixed methods; where ’the researcher uses
a theoretical lens as an overarching perspective within a design that contains both
quantitative and qualitative data’ (Creswell 2009, p.15). These two approaches do not
meet the purpose of this research as the researcher is not collecting the data at the same
time.
The third strategy is the sequential mixed methods which is ’procedures are those in
which researchers seeks to elaborate on or expand on the findings of one method with
another method‘(Creswell 2009, p.14). The procedure for the data collection in this
research started with a quantitative method. This quantitative method involved large

67
scale survey questionnaires in order to generalize results to a population and validate the
model of this research as well as confirm the hypotheses. Then a qualitative method was
used and semi-structured interviews were conducted to collect detailed views from
participants in order to elaborate and expand on the findings of quantitative method.
This research adopted a sequential explanatory strategy as it aimed to collect and analyze
the quantitative data in the first phase of the research, then collect and analyze the
qualitative data that built on the quantitative results. This strategy is useful when
unexpected or surprising findings are found in the first phase of quantitative research,
because the researcher can investigate these in more detail by conducting the second
phase of the data collection, the qualitative phase (Morse, 2000). Moreover, this strategy
is easy to implement because it is in clear separate stages which makes it easy to present
in detail and to report clearly. The quantitative data is given priority and more weight in
this strategy. The steps involved in the sequential explanatory strategy are presented
below in Figure 4.1:
qual QUAN
QUAN
Data
Collection
QUAN
Data Analysis
qual
Data
Collection
qual
Data
Analysis
Interpretation
of Entire
Analysis
“QUAN” and “qual “stand for QUANTITATIVE and
qualitative respectively.
“Capitalisation of QUAN” indicates Priority
“ ” indicates sequential form of data collection
Figure 4.1 Sequential Explanatory Designs
Source: Adapted from (Creswell 2009)

68
Figure 4.1 above shows the mixed methods sequential explanatory design, which will be
used in this research. This method consists of two different phases: quantitative followed
by qualitative (Creswell et al., 2003). In this design, the researcher first collects and
analyzes the quantitative (numeric) data. The qualitative (text) data are collected and
analyzed second in the sequence in order to assist in explaining, or elaborate on, the
quantitative results obtained in the first phase. The second, qualitative, phase builds on
the first, quantitative, phase, and the two phases are connected in the intermediate stage
of the study. The justification for this approach is that the quantitative data and their
subsequent analysis present a broad understanding of the research problem. The
qualitative data and their analysis refine and explain those statistical results by exploring
participants’ views in more depth (Rossman & Wilson, 1985; Tashakkori & Teddlie,
1998; Creswell 2009).
4.4. Research Design
As mentioned in the earlier section, this research will use the mixed methodology
approach including quantitative (survey questionnaires) and qualitative (semi-structured
interviews) methods. Figure 4.2 shows the research design used in this research:
Phase 1: This research design begins with a comprehensive literature review in order to
accomplish several purposes. These are as follows; first, gain knowledge about the
results of other studies that are closely related to this research topic. Second, identify the
research gap. Third, indentify the main variables to fill the research gap. Fourth, identify
the research theoretical grounds. Fifth, identify the measurement scale that best suits this
research in order to measure the variables. Finally, formulate the research model and
propose the relevant hypotheses.

69
Phase 2: Validate the research model and confirm or otherwise the hypotheses through
the investigation of the most appropriate research methods. The research method used in
this research is the mixed methods approach which incorporates quantitative and
qualitative research and which uses the sequential explanatory design.
The data collection techniques used in this research starts with quantitative research
followed by a qualitative research. The first stage of quantitative research strategy is
conducted by administering survey questionnaires face–to-face. The advantage of this
strategy is that the researcher can collect responses from all the completed questions
within a short period. In addition, any doubts regarding any question can be clarified on
the spot (Cavana, Delahaye, & Sekaran, 2001). Furthermore, there are several advantages
to surveys, including easy to administer, enable the researcher to verify the values,
relations and constructs of variables, provide responses that can be generalised from the
sample, provide an objective method of comparing responses over different groups, help
to confirm and quantify the results of qualitative research (Newsted, Huff & Munro,
1998), and to investigate a large number of opinions (Stroh, 2000). The survey
questionnaire in this study was written in both languages, Arabic and English, to allow
maximum responses.
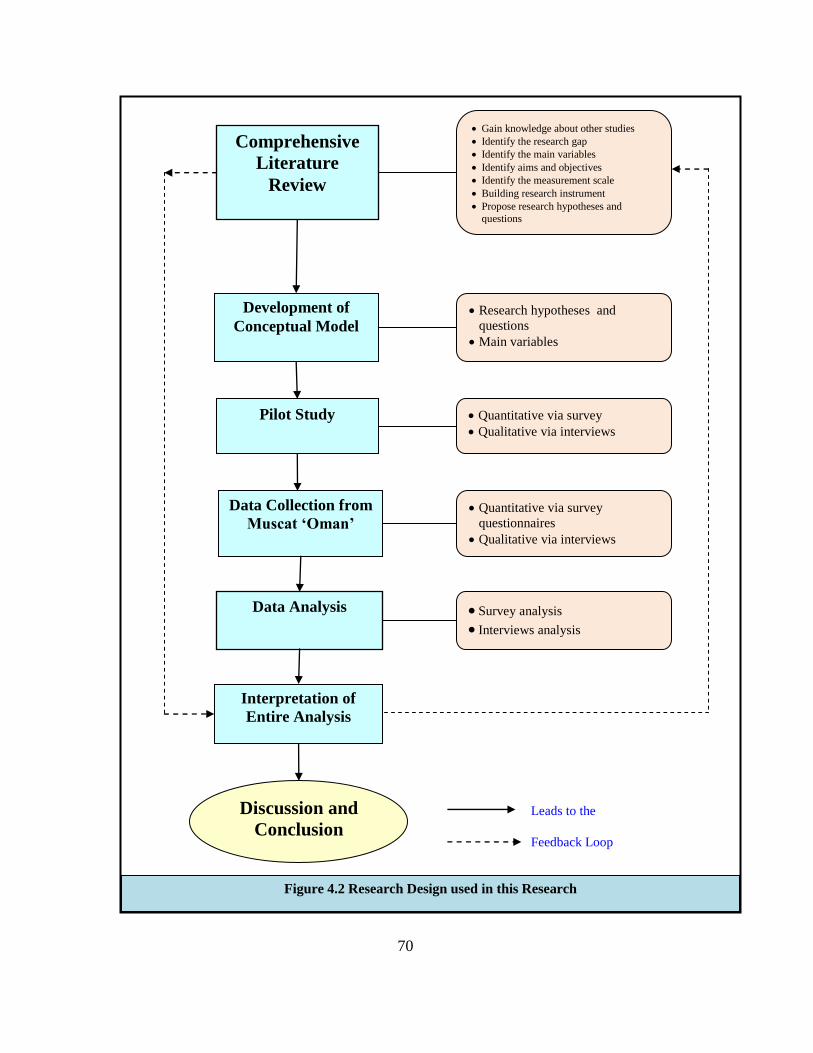
70
Comprehensive
Literature
Review
Data Collection from
Muscat ‘Oman’
Data Analysis
Figure 4.2 Research Design used in this Research
Interpretation of
Entire Analysis
Leads to the
Feedback Loop
Gain knowledge about other studies
Identify the research gap
Identify the main variables
Identify aims and objectives
Identify the measurement scale
Building research instrument
Propose research hypotheses and
questions
Development of
Conceptual Model Research hypotheses and
questions
Main variables
Pilot Study Quantitative via survey
Qualitative via interviews
Quantitative via survey
questionnaires
Qualitative via interviews
Survey analysis
Interviews analysis
Discussion and
Conclusion

71
The second stage of data collection uses a qualitative approach of semi-structured face–
to-face interviews conducted with six decision-makers involved in project planning for
the m-Government services. This is in accordance with Cavana (2001) who argues that
qualitative research aims to focus on the collection of rich information from a few
people. In addition, Myers (2008) defines qualitative research as an approach of inquiry
which moves from the underlying philosophical assumption to research design and data
collection. In qualitative research the intention is to focus on answering questions such as
“why,” “in what way,” and “what are the implications?” rather than “how many,” “how
often,” and “how much?” as in the case of quantitative research (Hancock 1998). To
summarise the differences between quantitative and qualitative approaches, Dey (1993)
has identified the main differences as shown in Table 4.3:
Quantitative Approach Qualitative Approach
Based on meanings derived from numbers Based on meanings expressed through words
Collecting results in numerical and standardized
data
Collecting results in non-standardized data
requiring classification into categories
Analysis conducted through the use of diagrams
and statistics
Analysis conducted through the use of
conceptualization
Table 4.3 Main Differences between quantitative and qualitative approaches
Source: Dey (1993)
As mentioned in the previous section, this research uses the sequential explanatory mixed
method approach. The purpose of this sequence explanatory strategy is to explain and
interpret quantitative findings by collecting and analysing follow-up qualitative data.
Therefore, as a first step, this research design starts with survey questionnaires and the
analysis of the data collected. Second, semi-structured interviews are conducted in order
to elaborate on findings collected from the first step and then analysed.
Phase 3: This step is the interpretation of the analyses of both quantitative and
qualitative data. This will lead to the development of the final research model of

72
intention to use mobile government services. A feedback loop will be linked to the
literature in order to amend the research model if necessary.
Phase 4: The discussion and conclusion including the limitation of the study and
recommendations for further investigation.
4.5. Case Study: Oman Overview
This research gathers data from Muscat the capital of Oman in order to validate the
proposed research model. Oman was chosen as a context of this research as the
researcher is from Oman and can easily access the relevant data. In addition, the Omani
government has recently announced its intention to implement m-Government services
throughout the entire country – hence this research is timely for Oman. The most
common m-Government service being utilized in Oman is the ‘Mobile Parking Service’
and hence it will be utilized in this study as an example of m-Government services which
is only available in the capital Muscat.
In Oman, the mobile infrastructure is nearly complete - hence m-Government services
can reach the vast majority of citizens in rural regions rapidly and at any time. As
mentioned in Chapter 2, Sandy and McMillan (2005) argue that m-Government uses
ICTs to improve the activities of public sector organizations and provide ‘anytime’ and
‘anywhere’ services to both citizens and public officials. This indicates that the ICT
sector plays an important role in m-Government services provision. In Oman, the mobile
infrastructure is nearly complete - hence m-Government services can reach the majority
of citizens in rural regions rapidly and at any time.
The Sultanate of Oman moved from a traditional country into a modern state
immediately after the accession of His Majesty Sultan Qaboos bin Said in July 1970. In
early 1970, His Majesty the Sultan of the Sultanate of Oman gave imperative
apprehension of information technology as well as the economic development. His
majesty has directed the Omani government to concentrate their intention to determine
new projects that aim to enhance the information technology, economic level in order to
73
provide an honorable livelihood for all Omani citizens (Oman Ministry of National
Economy, 1996). As a result, the people of Oman have started to benefit from extensive
free health care and education.
The Sultanate of Oman has started to open new channels to deliver better and cheaper
services to the public anytime and anywhere. These new channels usually utilize wireless
devices; such as, Personal Digital Assistant (PDAs), mobile phones, etc, and hence can
be categorized as m-Government services. It is believed that countries that have
rigorously adopted a model of intention to use m-Government services, have observed a
successful implementation of m-Government services and delivered a better quality of
m-Government services to their citizens (Al-Ruzaiqi, 2003).
4.5.1. Geography and Regions
According to the Ministry of National Economy in Oman (2011), the Sultanate of Oman
is located in the southeastern region of the Arabian Peninsula. To the west it is bordered
by the United Arab Emirates and the Kingdom of Saudi Arabia, and to the south by the
Republic of Yemen. To the north there is the Strait of Hormuz and the Arabian Sea is to
the East. The total area of the Sultanate of Oman is about (309,500) square kilometers.
Valleys and desert take up 82 per cent of the total landmass, up to 15 per cent is
mountain and only three per cent is coastal plain (Al-Rahbi, 2008). This indicates that the
large proportion of mountains and deserts in Oman may slow the introduction of e-
Government because of the difficulties in building the wired network infrastructure
throughout the country and especially in the remote areas. Nevertheless, the mobile
network infrastructure in Oman is expanding in order to cover the entire country
especially in the remote areas (TRA, 2011). Oman is a small developing country where
rural areas or remote areas do not have fixed phones in order to utilize government
services via the internet. However, the majority of people who live in remote areas do
have mobile phones, and therefore they can utilize government services via their mobile
phones.

74
4.5.2. Population
According to the latest census in 2010, Oman is a country of 3.173 million people with
36.4 per cent expatriates, a population growth rate of 2 per cent and a residential density
of 7.5 people per kilometre (Oman Ministry of National Economy, 2011). The majority
of Omani citizens including males and females are within the ages of 15 and 44. On the
other hand, the majority of expatriates are between the ages of 25 and 55. Visiting
workers from South Asia, Egypt, Jordan and the Philippines usually account for this
range of expatriate age (Alhinai, 2007). According to projections by the World Bank, by
2023 the population of Oman is expected to increase for the third time since 1970, to
more than 5 million people (World Bank, 2004).
4.5.3. Oman Economic Background
The population in Oman as discussed in the previous section indicates important
implications for economic development because of changing size and distribution of the
population. These implications can be seen in service provision and delivery in areas
such as health, education, information and communication technologies, and the labour
market (Al-Rahbi, 2008). In 2009, the Omani economy suffered a slowdown in the Gross
Domestic Product (GDP), but in 2010, the Sultanate of Oman’ GDP recorded a
remarkable recovery by increasing 23.4 per cent (Central Bank – Oman, 2010). This
remarkable increase has positively affected the share of petroleum activities in the
overall GDP from 40.6 per cent in 2009 to 46.5 per cent in 2010. During the same period
the non-petroleum activities decreased from 61.6 per cent to 55.5 per cent (Central Bank
– Oman, 2010).
According to the annual report in 2010 of the Central Bank of Oman (CBO) Oman’s
main revenue comes from oil and natural gas (Central Bank – Oman, 2010). The
country’s economic performance has improved drastically following a sharp increase in
oil prices in 2000, with Gross Domestic Product (GDP) reaching US $12.73 billion in the
first quarter of 2008, up to 42.9 percent over the same period of 2007 compared to US $
270.97 million in 1970 (Oman Ministry of National Economy, 2011). During the first

75
three quarters of 2010, the economic performance increased and reached in the high
growth rate in GDP at 28.3 per cent to US $42,559.67 million, compared to US
$33,174.57 million during 2009 (Oman Ministry of National Economy, 2011). This
increase in GDP indicates a good growth in oil and non-oil activities during this period.
This could be explained by the increase in international oil prices during the period of the
first three quarter of 2010. According to Ministry of National Economy, Oman has
witnessed outstanding and major achievements within a short time of period. These
achievements represent the foundations necessary to move into sustainable development.
Therefore, in order to for Oman to continue moving into a stable development clearly
defined objectives and long-term vision need to be established (Oman Ministry of
National Economy, 1996).
In 1996, when the Five-Year Plan was established, the Omani government initiated the
long-term strategic economic vision ‘Oman 2020’. The objectives of the ‘Oman 2020’
vision were to move towards an increased dependence on private initiative, national
labour and renewable resources that would lead to sustainable development rather than
relying on an economy dependent on government spending, primary industries, and
foreign labour (Oman Ministry of National Economy, 1996). In addition, the Omani
government aimed to increase economic development to reach an average growth rate of
7.4 per cent during the period of 2000 to 2020 (Ministry of National Economy – Oman,
1996). In addition, the Omani government aimed to diversify its national income from
the oil sector to the non-oil sector. This is because it is anticipated that the Omani
economy will no longer rely on oil by the year 2020 (Al-Rahbi, 2008).
In the previous seventh five-year development plan (2006 – 2010), Oman has witnessed
a pivotal improvement in the Information Technology (IT) sector. This was a vital era for
the information technology field in general and e-Government and m-Government in a
particular. This is because during the mentioned era, the vision of the seventh five-year
development plan (2006-2010) was to upgrade the Information Technology (IT) sector
through the implementation of the national strategy for Oman’s digital society (Al-hinai,
2007). According to the Oman Digital Society Report, 2007 published by the
76
Information Technology Authority (ITA), this is achieved by focusing on establishing
the basis of ‘e-’ and ‘m-’ government infrastructure as well as expanding the research
and development field in order to incorporate most sectors of the national economy (ITA,
2007). The next Sub-Section discusses the ICT scene in Oman in more detail.
4.5.4. Oman: ICT Sector
In Oman, the Telecommunication Regulatory Authority (TRA) is responsible for the
provision and promotion of telecommunication services throughout the country (TRA –
Oman, 2011). The Council of Ministries made this decision as part of government policy
for the promotion of ICT development in 1998. During the same year, the National
Information Technology Committee (NITC) was set up to manage the development of
the Sultanate’s ICT sector to promote e-Government initiatives and the NITC set up the
Information Technology Task Force (ITTF). According to the Economic and Social
Council for Western Asia (ESCWA) in 2007, this (ITTF) is a technical action group
consisting of representatives of experienced departments and bodies (ESCWA, 2007). In
2002, the National IT strategy was launched followed by a plan of action to be
implemented by the IT Technical Secretariat (ITTS) (Al-Hinai, 2007). It can be said that
the first major step for the Sultanate of Oman plans was to introduce e-Government and
create a digital society. Al-Hinai (2007) states, it ‘depends on how well the society is
being transformed to move towards being a digital society; and on the successful
implementation of the ICT infrastructure and the associated Tele-communication
projects’ (p.150).
The mobile infrastructure in Oman is still in its infancy but it is progressing at a rapid
pace. Currently, there are two mobile services operators in Oman, Omantel and Nawras.
The former was the first official internet service provider. It provides the country’s fixed-
line and Internet services (Al-Hinai 2007). The latter, was also granted a Class 1 license
for fixed lines and broadband in 2005 (TRA, 2011). In addition to these competitors the
mobile market in Oman expanded by launching five re-sellers of mobile services in
2009. These five re-sellers are Renna, Friendi, Injaz, Samatel and Mazoon. In 2010,

77
Samatel was granted a Class 1 license in order to compete with Omantel and Nawras
(TRA, 2011).
Al-Badi & AlShihi (2007) point out that mobile penetration in Oman is higher than
internet penetration. Further, Al-Badi & AlShihi argue that prepaid mobile services and
Short Message Service (SMS) have become very popular in Oman since their
introduction in 2001. According to Omantel (2007), which is one of the two national
mobile carriers, ’The number of SMS exchanged between Oman Mobile subscribers
recorded 4.6m per day ….. In other words, the monthly load is approximately 140m
SMS, including customers roaming abroad‘(Omantel, 2007). Additionally, the total
number of SMS sent by both Omantel and Nawras operators reached 991.269 million
during the period July to September 2008 (TRA 2009). This indicates that Omani
citizens depend heavily on mobile phones and SMS in particular. This will encourage the
Omani government to introduce more mobile government services in order to reach a
vast number of people in Oman anywhere and anytime.
According to the Ministry of National Economy –Oman (2007), in November 2007 there
were 2,369,741 mobile telephone subscribers, whereas the number of internet subscribers
was only 68,710. However, according to the telecommunication regulatory authority
(TRA) in Oman by January 2009 the penetration of mobile telephone and internet had
increased to 3,265,356 mobile subscribers and 120,192 internet subscribers (TRA 2009).
The high-level penetration of mobile subscriptions provides a great potential for Oman to
successfully utilize and implement m-Government services to complement the current e-
Government offerings.
On the other hand, the annual report of the Telecommunication Regulatory Authority
(TRA) in 2009 revealed that the number of fixed telephone lines on 31st December 2009
stood at 299,826, a decrease of 1.6 per cent compared with the previous year of 2008. In
addition, the penetration rates of fixed lines showed a declining trend dropping from 11
per cent in 2005 to 10.5 per cent in 2009 (TRA, 2009).

78
In addition, the annual report of Telecommunication Regulatory Authority (TRA) in
2009 showed that at the end of 2009 the number of internet users in Oman was 1,236,658
that included 453,183 fixed internet users and 783,475 mobile internet users (i.e. using
internet service through their mobile devices via 3G). This indicates an increase in the
number of internet users over the years that can be explained by the growth in private
sectors and public sectors, as well as the various e-Government initiatives.
Table 4.4 Fixed and Mobile Sectors
Source: TRA (2011)
As of Table 4.4, the total telephone lines and total mobile subscribers have slowed down
during the first quarter of 2011. During this period, the total telephone lines records
273,123 lines that is less than by 3.06 per cent when compared to the previous year of
2010, which shows 281,755 lines.
4.6. Data Collection
This section provides a detailed description of the first data collection approach used in
this research including the quantitative method, the survey questionnaire design, the

79
population and sample, the survey instrument, validity and reliability, the variables in
this research, and the pilot study. Quantitative research is defined as empirical research
where the data are in the shape of numbers (Punch 2005). In addition, Hancock (1998)
argued, a quantitative research is when collecting measurable information about a topic.
In the social sciences, there are some well-known examples of quantitative methods as
survey methods and laboratory experiments (Myers 2008).
4.6.1. Survey Design
The questionnaire was defined by Zikmund (2003) as a communication medium for data
collection that includes a set of written questions for the participants to answer, hence,
the design of the questionnaire is considered one of the vital stages in the survey process.
Therefore, in order to obtain a good design three important aspects should be considered
(Cavana, Delahaye, & Sekaran, 2001). Firstly, the questions should be written simply
and clearly. Secondly, the order and the form of the written questions should be designed
in a way that creates interest and keeps the participants involved. Finally, the formulation
of each question should be carefully phrased so that the responses are easy to code and
interpret.
Following the guidelines mentioned above, the survey questionnaire aimed to collect the
relevant data for this study and test each hypothesis. Therefore, in order to guarantee a
high rate of responses the survey questionnaire used in this study used clear and simple
wording and was written in both English and Arabic. Furthermore, the questions began
by measuring the Perceived Enjoyment variable, which is aimed at creating interest to
encourage respondents to enjoy and complete the questionnaire. The survey
questionnaire consisted of two parts: Part A included the demographics of respondents;
Part B included questions asking respondents about their intention to use m-Government
services.
The survey questionnaire is shown in Appendices A and B. The former consists of a
plain language statement (that describes to participants the research objectives, the
questionnaire format and content, approximate completion time, confidentiality

80
provisions for information collected, and contact information. Appendix B presents the
final questionnaire instrument, and consists of the following two parts:
Part A: Firstly, the Mobile Parking Service is explained and the process of using this
service is described in detail. The respondent then asked to provide demographic
information including age, gender, citizenship and the level of educational attainment as
well as whether he/she has previously been a user of Mobile Parking Service or not.
Those who have used Mobile Parking Service are then asked where he/she gained this
information (communication channel). For non-users respondents were asked which
communication channel would convince him/her to adopt Mobile Parking Service. These
questions were included to gain a clear picture of the sample of respondents in order to
evaluate the scope to which the outcome of the survey can be generalized. The question
format used in (Part A) is a nominal scale in a multiple choice format for the
demographic information, with a blank space provided for answers that were not listed.
Furthermore, brief additional instructions were provided to assist respondents to
complete the questionnaire.
Part B: Firstly, m-Government is defined. Following this, the questions began by
measuring the Perceived Enjoyment (PENJ) variable, which is aimed to express feelings
towards using m-Government services in general and the Mobile Parking Service in
particular, to determine whether the service is enjoyable and fun. Following this,
questions related to the following variables were as follows:
Personal Innovativeness (PINOV) to measure willingness to use the Mobile
Parking Service;
Perceived Security (PSEC) to measure the extent of belief that using an Mobile
Parking Service is secure;
Perceived Trustworthiness (PTT) to measure the extent of trust in using a
mobile phone for Mobile Parking Service;

81
Relative Advantage (RA) to measure the extent to which Mobile Parking
Service is beneficial when compared to the traditional method of ticket machine
or coins;
Compatibility (COM) to measure the extent to which Mobile Parking Service
could fit in with their lifestyle;
Perceived Ease of Use (PEOU) to measure the extent to which Mobile Parking
Service could be easy to use and not require a lot of mental effort and not be
frustrating;
Trialability (TRI) to measure the extent of belief to which would be better to try
Mobile Parking Service for free before deciding to adopt it;
Observability (OBSV) to measure the extent to which users could communicate
with others about the results of using Mobile Parking Service; and
Intention to use (INT) to express their intention towards using new m-
Government services in the future.
The measurement scale for each construct PENJ, PINOV, PTT, PSEC, RA, COM,
PEOU, TRI, OBSV, and INT used a 5-point Likert scale ranging from 1 (strongly
disagree) to 5 (strongly agree). Table 4.5 below shows an example of the 5-point Likert
scale used in this research questionnaire:
1. I believe using SMS parking is fun
أعتقد بأن استخدام خدمة حجز المواقف عن .1
طريق الرسائل القصيرة ممتعة
Strongly
disagree
1
2
3
4
5
Strongly agree
Table 4.5 An example of the 5-point Likert scale
Demographic questions including Gender, Age and the level of Educational attainment
were provided in a multiple choice format as shown in the example below. Where
appropriate, a blank space to fill in was included in case the answer was not one of the
listed choices. Although the pilot tests for the questionnaire showed the suitability and
adequacy of the choices provided, brief additional instructions were provided throughout
the questionnaire to assist respondents to complete it.

82
2. Please indicate your highest completed level of
education
الرجاء تحديد المستوى التعليمي. 2
Primary
إعدادي
Secondary
ثانوي
Undergraduate degree
جامعي
Post-graduate degree
دراسات عليا
Other (Please specify)
(الرجاء التحديد)أخرى -------------
Table 4.6 An example of nominal scale multiple-choice format
Using the adapted Rogers’ Diffusion of Innovations’ model as a basis, measurements in
this study include the following independent variables: RA, COM, PEOU, TRI, OBSV,
as well as other variables derived from the literature including PENJ, PINOV, PTT and
PSEC. The dependent variable (INT) towards using m-Government services is derived
from the TAM (see Chapter 3).
A critical literature review of a reliable and validated existing measurement scale was
conducted in order to make the final decision about the most suitable measure for each of
these variables. The appropriateness of existing measures was evaluated against the
context, scope and objectives of the variables in this study. The wording of the original
scale was modified to suit this study without affecting the scale itself.

83
Construct Measures used Source
Relative Advantag
( RA)
I believe the use of SMS parking Service enables me to pay parking fees more quickly than other methods (e.g. using Coins, Ticket
machine)
I believe the use of SMS parking Service enables to pay the parking fees in an easier way compared to other methods (e.g. using Coins,
Ticket machine).
I believe the use of SMS parking Service is more efficient than using other alternative ways (e.g. using Coins, Ticket machine).
I believe the use of SMS parking Service saves me time compared to the other ways (using Coins, Ticket machine)
I believe the use of SMS parking Service increases my productivity
(Moore and Benbasat
1991)
Compatibility
(COM)
I believe the use of SMS parking Service is compatible with my lifestyle.
I believe the use of SMS parking fits well with the way I like to pay for other services
I believe the use of SMS parking Service is completely compatible with how I like to do things
I believe the use of SMS parking would fit well with the way I like to pay for parking fees
(Moore and Benbasat
1991)
Perceived Ease of Use
(PEOU)
I believe the use of SMS parking service is clear and understandable
I believe the use of SMS parking service is easy
I believe learning to use SMS parking service is easy for me
I believe the use of SMS parking service does not require a lot of mental effort
I believe the use of SMS parking service is not frustrating
(Davis 1989; Moore and
Benbasat 1991)
Trialability
(TRI)
I believe before deciding whether to use the SMS parking service, it will be better to try it out by the user for free
I believe it is better to use SMS parking service on a trial basis for long enough time to see what it could do
I believe I would not have to spend a lot of effort to try SMS parking service
I believe it would be better for the service provider to experiment the SMS parking service as necessary to check its effectiveness
(Moore and Benbasat
1991)
Observability
(OBSV)
I believe I would have no difficulty telling others about the results of using SMS parking service
I believe I could communicate to others the consequences of using SMS parking service
I believe I would have no difficulty explaining why using SMS parking service may or may not be beneficial
I believe the instructions of how to use SMS parking service is available and visible in many places
(Moore and Benbasat
1991)
Perceived Enjoyment
(PENJ)
I believe using SMS parking service is fun
I believe using SMS parking service is useful
(Davis et al. 1992; and
(Hong et al. 2008)

84
I believe using SMS parking service is a wise decision
Personal Innovativeness
(PINOV)
I like to explore new Mobile-Government services
Among my peers, I am usually the first to try out new Mobile-government services
In general, I am interested in trying out new Mobile-government services
(Rogers 2003; Agarwal
& Prasad 1997)
Perceived
Trustworthiness
(PTT)
I believe I trust the ability of a Mobile to protect my privacy when using SMS parking service
I believe that I'm adequately protected by law in Oman from problems that could be caused when using SMS parking service
I believe I trust the SMS parking and it could be the best option to pay for parking fees
(Bélanger & Carter
2008; Li, Hess &
Valacich, 2008)
Perceived Security
(PSEC)
I believe using SMS parking service is financially secure
I believe I'm not worried about the security when using SMS parking service
I believe the mobile has enough safeguards to make me feel comfortable using it to interact with the SMS parking service
(Fang et al. 2007)
Intention to Use
(INT)
I would use the SMS parking Service frequently
I would use the SMS parking Service whenever possible
I intend to use the SMS parking Service in the future
I would like to use new Mobile-government services in the future
(Davis et al. 1989;
Venkatesh et al. 2003)
Table 4.7 Measures for constructs used in this study

85
4.6.2. Survey Sample
The sample design and size are essential in order to provide a representative sample
(Cavana, Delahaye, & Sekaran, 2001; Zikmund 2003). Therefore, it is imperative for the
researcher to guarantee that the chosen sample design and size are correct in order to
ensure that this chosen sample represents the population (Creswell 2009). Using a very
large number of participants in a survey can be costly and time consuming as most social
science studies have stated. Hence, in choosing an efficient and reasonable sample, this
study has adapted the seven staged sampling procedure developed by Zikmund (2003)
which was refined to suit this study. The seven stage sampling procedure is shown in
Table 4.8.
Stage Process Selection of this research
1 Define target population Omani citizens who are drivers and who are 18 or above and
who live in Muscat Region
2 Select a population frame 42,288 drivers in Muscat Region
3 Determine sampling design Probability/ Stratified Random Sampling
4 Plan for select sampling units Plan for sample size selection, accuracy, time resources and
right analysis
5 Determine sample size Survey of 300 questionnaires
6 Select sampling units Mobile Parking Service users/non-users
7 Conduct fieldwork Distributed in Muscat municipality in Oman (The developer of
Mobile Parking Service)
Table 4.8 Seven stages in selection of research sample
Source: Adapted from Zikmund (2003)
Stage 1: Since the source from which the researcher is to collect the data is the
population, the researcher has to select the target population correctly and carefully. The
Mobile Parking Service, which was developed by Muscat Municipality in Oman, is
currently operating in the capital region of Muscat. Thus, this study focuses on Omani
citizens/users and non-users who are 18 years old and above. This sample was chosen

86
because the official age for applying for a driving licence in Oman is 18. Hence, these
people most probably have a driving license, and are most likely to have used Mobile
Parking Service (users). However, those who do not hold a driving licence and
presumably have not used Mobile Parking Service (non-users) are also of interest to this
study as it useful to understand their perception towards their intention to use this
service.
Stage 2: The second stage is to select the population frame, which includes a list of
elements in the population from which a sample of study will be identified (Cavana,
Delahaye, & Sekaran, 2001). Therefore, to collect the required data, the chosen sample
was obtained from the Omani Ministry of National Economy. This reported that the total
population of those who are 18 years old and above in the Muscat region was
approximately 124,954 and of these, 42,288 was drivers (Ministry of National Economy
– Oman, 2010).
Stage 3: This stage is to determine the sampling design. The sampling design as defined
by Zikmund (2003) and Creswell (2009) is an approach which is used to choose the units
of analysis. The unit of analysis refers to the individual case or group of cases that the
researcher needs to convey something about when the study is over and is, for that
reason, the focus of all data collection efforts (Teddlie & Tashakkori, 2009).
There are two groups of sampling procedures in the human sciences; the probability
sampling technique and the purposive sampling technique. The former is mainly used in
quantitative studies and is defined as when a quite great amount of units are randomly
selected from a population where probability inclusion for every member of the
population is determinable (Teddlie & Tashakkori, 2009). However, the latter is used in
qualitative studies and is defined as when units are selected based on purposes connected
with answering a research study’s questions (Teddlie & Tashakkori, 2009).
Since this research uses the mixed methods approach which includes quantitative and
qualitative methods, it will use both techniques, probability and purposive. There are
three types of sampling underpinning the probability sampling technique. Firstly, random

87
sampling is defined where every sampling unit in an obviously defined population has an
equal probability of being included in the sample (Teddlie & Tashakkori, 2009).
Secondly, stratified sampling where the researcher divides the population into subgroups
so that each unit belongs to a single group (e.g. male or female) and then selects units
from those groups. Finally cluster sampling where the sampling units are considered to
be groups within the population (e.g. neighborhood, hospitals, and schools) (Teddlie &
Tashakkori, 2009).This research aimed to compare subgroups in the population in order
to draw a representative sample. In this regard, the best technique for this research is
stratified random sampling as it enables the researcher to obtain various subgroups (e.g.
male, females, age, and education level attainment) of a representative population. The
sample is broken into subgroups through the stratified technique described above. These
subgroups include the following; 1) Male/Female, 2) Old/Young, and 3) Highly-
Educated/Less-Educated.
Stage 4: To plan for the selection of sampling units. In order to approach Mobile Parking
Service users/non-users, a formal letter was initiated from my employer Diwan of Royal
Court (Royal Palace) to Muscat Municipality (the developer of Mobile Parking Service),
to approach Mobile Parking Service users/non-users and distribute the survey
questionnaire.
Stage 5: The sample size as defined by Teddlie and Tashakkori, (2009) is to select units
of analysis (e.g. people, groups) in a way that will represent the population and enable
the researcher to answer the research questions.
There are various ways to determine the sample size. In this research, three methods
were considered suitable for this research. Firstly, Roscoe (1975) suggests that the most
suitable size for social research is to select a sample size larger than 30 and less than 500.
Secondly, Cavana, Delahaye, and Sekaran, (2001) state that the appropriate sample size
should be 10 times or more than the number of both independent and dependent variables
in the study. Finally, Harris and Schaubroeck (1990) suggest a minimum sample size of
200 to guarantee robust structural equation modeling. Accordingly, this research has
considered the three methods mentioned above and hence the sample size of this research

88
was determined to be 300 survey questionnaires. The first reason for selecting this
sample was because the sample size of this research (300) was more than 30 and less
than 500, secondly this research included 10 variables (9 independent and 1 dependent)
and the sample size of this research (300) was 30 times as large as the total number of
variables in this study. Finally, the sample size of this research (300) was larger than 200
and the analysis technique used in this research was structural equation modeling (SEM)
(see Section 4.8).
Stage 6: This stage determines the sampling units. The method for targeting the
sampling units was detailed in Stage 4. At the researcher’s request, the survey
questionnaires were distributed specifically to:
Two private banks (25 questionnaires to each bank);
Two government ministries (25 questionnaires to each ministry);
One school for males (25 questionnaires);
One school for females (25 questionnaires);
Sultan Qaboos University (100 questionnaires; 50 for students and 50 for
employees); and finally
Fifty questionnaires were distributed to people who about to park their car in the
parking where Mobile Parking Service is used.
The above list included respondents with a large variety of characteristics such as age,
gender, educational attainment and included employees in both private and government
sectors to give the results generalisability.
Stage 7: This final stage involves the data collection and fieldwork.
4.6.3. Survey Pilot Study
Ticehurst and Veal (2000) argue that conducting a pilot study is crucial in order to
achieve several aims, for instance, testing questionnaire wording, testing question
sequencing, testing questionnaires layout, gaining familiarity with respondents, testing

89
fieldwork arrangements (if required), training and testing fieldworkers (if required),
estimating response rate, and estimating interview or questionnaire completion time. A
pilot test is essential to any researcher because it allows the researcher to check the
reliability of the data to be collected as well as the validity of the questions. This is
because the design of a questionnaire is crucial in obtaining the required information
(Saunders, Lewis, & Thornhill, 2009). In order to ensure that the final formulation is as
clear as possible, it is imperative to undertake various type of pilot test, since as Bell
(2005) stressed, although the time is short it is recommended to provide the questionnaire
a trial run as much as possible. Teijlingen et al. (2001) identify several different reasons
for conducting pilot studies. They are as follows:
Developing and testing adequacy of research instruments;
Assessing the feasibility of a (full-scale) study/survey;
Designing a research protocol;
Assessing whether the research protocol is realistic and workable;
Establishing whether the sampling frame and technique are effective;
Assessing the likely success of proposed recruitment approaches;
Identifying logistical problems which might occur using proposed methods;
Estimating variability in outcomes to help determining sample size;
Collecting preliminary data;
Determining what resources (finance, staff) are needed for a planned study;
Assessing the proposed data analysis techniques to uncover potential problems;
Developing a research question and research plan;
Training a researcher in as many elements of the research process as possible;
Convincing funding bodies that the research team is competent and
knowledgeable;
Convincing funding bodies that the main study is feasible and worth funding; and
Convincing other stakeholders that the main study is worth supporting.
The procedure for the pilot study was as follows (Peat, Mellis, & Williams, 2002):

90
Administer the questionnaire to pilot subjects in precisely the same manner as it
will be administered in the main study;
Ask the subjects for feedback to identify ambiguities and difficult questions;
Record the time taken to complete the questionnaire and decide whether it is
reasonable;
Discard all unnecessary, difficult or ambiguous questions;
Assess whether each question gives an adequate range of responses;
Establish that replies can be interpreted in terms of the information that is
required;
Check that all questions are answered;
Re-word or re-scale any questions that are not answered as expected; and
Shorten, revise and, if possible, pilot again.
The pilot study size may range from 25 to 100 subjects (Schindler & Cooper 1998).
Consequently, prior to distribution of the questionnaires, a pilot study was conducted in
two segments of the Omani population who possessed a driving licence: employees from
the public sector, and university students. These two segments were chosen deliberately
because the researcher had easy access to participants through official contacts in the
Diwan of Royal Court (Royal Palace) and Sultan Qaboos University. The aim was to test
the survey instrument and check the content validity, run a preliminary analysis, and
examine the initial results against the study’s main objectives. The structure of the
questionnaire was designed to target both users and non-users. It was divided into
background information about the participants and had sections devoted to each of the
above-mentioned variables. These were treated as composite variables using sets of
statements and Likert scales to determine users' perceptions agreements with each
variable. As the Mobile Parking Service is available only in the capital region of Muscat,
participants were chosen from this area. Fifty surveys were distributed randomly (30 to
employees and 20 to students), and thirty seven were collected (74 per cent response
rate).

91
4.6.4. Interview Design
This section provides a detailed description of the qualitative data collection. The
findings derived from the quantitative approach enabled further investigation and follow-
up study in order to provide further confirmation for the model and hypotheses.
Therefore, the second stage of data collection used in this study, was qualitative semi-
structured interviews. The interviews in this study aimed to elaborate on the findings
from the quantitative data. As stated by Cavana (2001), the interview provides a unique
chance to reveal in-depth information from an individual.
The design of interviews starts with a general description of the study as well as the aims
and objectives. Afterwards, each participant was asked about general information about
demographics include gender, age, organisation and position details, and education level.
Next, general questions were asked that related to the demographic variables and their
affect on intention to use mobile government services. These include gender age, and
education followed by more specific questions. These include perceived security, relative
advantage, perceived ease of use, and trailability and their impact on intention to use m-
Government services (Appendix F presents a list semi- structured interview questions).
During the interviews, the researcher has avoided to make any reference to the results
received from the quantitative analysis in order to avoid any bias that could affect the
interviewee’s opinion.
4.6.5. Interviewee Selection
Kotulick and Clark (2004) have suggested that when excellent rapport and trust are
established with the interviewee, there is a better focus on the topic, enabling the
researcher to elicit information that is more relevant. Semi-structured interviews were
conducted with six government officials to determine why some hypotheses were not
confirmed. The non-confirmed hypotheses that needed to be further investigated were
Relative Advantage, Complexity/Perceived Ease of Use, Trialability, and Perceived
Security. Participants were selected according to their rank and involvement in making
decisions pertaining to m-government adoption in their organizations. All were

92
considered a good representation of the decision makers who are involved in m-
Government projects in Oman. These participants were from diverse government entities
including Muscat Municipality, Ministry of Manpower, Information Technology
Authority, Royal Court Affairs and Ministry of Higher Education. These government
entities have implemented a variety of well known m-Government services for the entire
population. In addition, these participants were considered to be well-educated and fully
involved in m-Government projects at the higher executive levels. Therefore, the insight
gained from the interviews provides a greater understanding of the concepts that this
research examines.
Interviews were conducted with six decision-makers who are involved with m-
Government services in Oman in accordance with the ethics requirements of Victoria
University. Before the interviews were recorded on tape or in notes (depending on
respondents’ preferences), a plain language statement explaining the purpose of this
research was giving (see Appendix E). In addition participants were assured that their
responses would remain confidential (see Appendix F). These six decision-makers were:
Head of the m-Government services sector at the Information Technology
Authority (ITA)-responsible for e and m-Government projects in Oman;
The General Director of Information Technology at Muscat Municipality -
responsible for Mobile Parking Service;
The Project Leader of Mobile Parking Service at Muscat Municipality;
Director of Information Technology at Ministry of Manpower- responsible for
mobile services’ projects;
Director of Information Technology at Ministry of Education- responsible for
mobile services’ projects; and
Director of Information Technology at Royal Court Affairs Ministry- responsible
for mobile services’ projects.
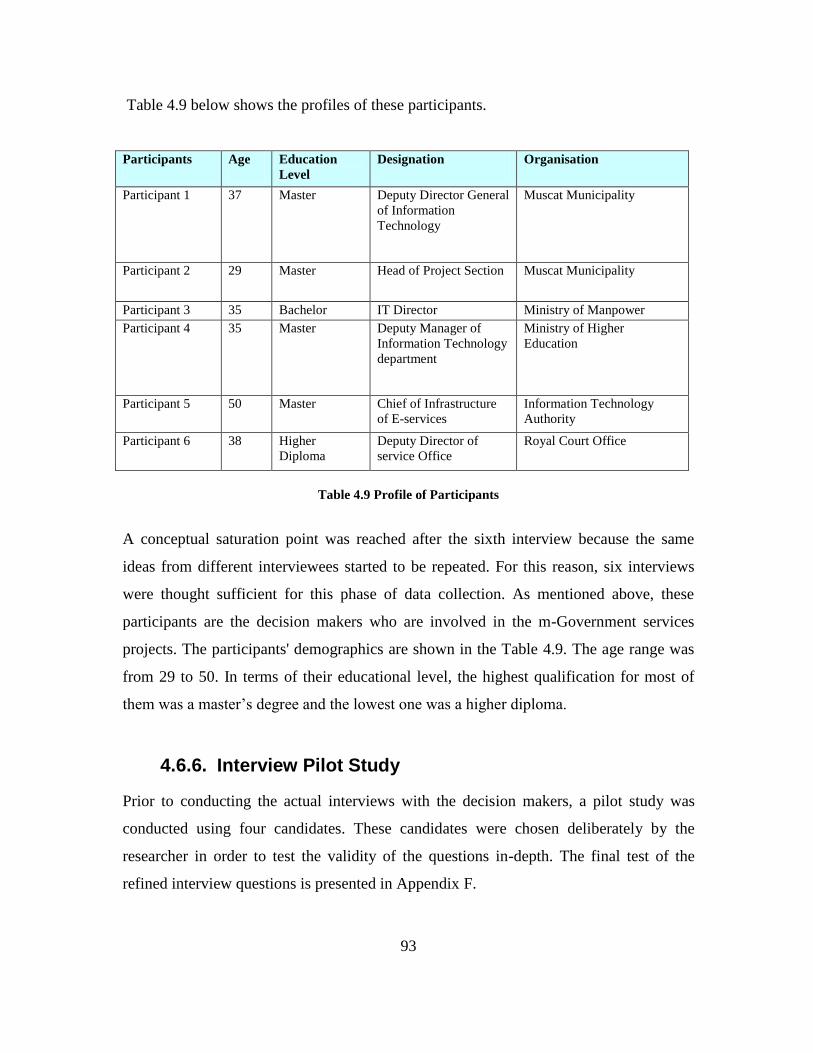
93
Table 4.9 below shows the profiles of these participants.
Participants Age Education
Level
Designation Organisation
Participant 1 37 Master Deputy Director General
of Information
Technology
Muscat Municipality
Participant 2 29 Master Head of Project Section Muscat Municipality
Participant 3 35 Bachelor IT Director Ministry of Manpower
Participant 4 35 Master Deputy Manager of
Information Technology
department
Ministry of Higher
Education
Participant 5 50 Master Chief of Infrastructure
of E-services
Information Technology
Authority
Participant 6 38 Higher
Diploma
Deputy Director of
service Office
Royal Court Office
Table 4.9 Profile of Participants
A conceptual saturation point was reached after the sixth interview because the same
ideas from different interviewees started to be repeated. For this reason, six interviews
were thought sufficient for this phase of data collection. As mentioned above, these
participants are the decision makers who are involved in the m-Government services
projects. The participants' demographics are shown in the Table 4.9. The age range was
from 29 to 50. In terms of their educational level, the highest qualification for most of
them was a master’s degree and the lowest one was a higher diploma.
4.6.6. Interview Pilot Study
Prior to conducting the actual interviews with the decision makers, a pilot study was
conducted using four candidates. These candidates were chosen deliberately by the
researcher in order to test the validity of the questions in-depth. The final test of the
refined interview questions is presented in Appendix F.
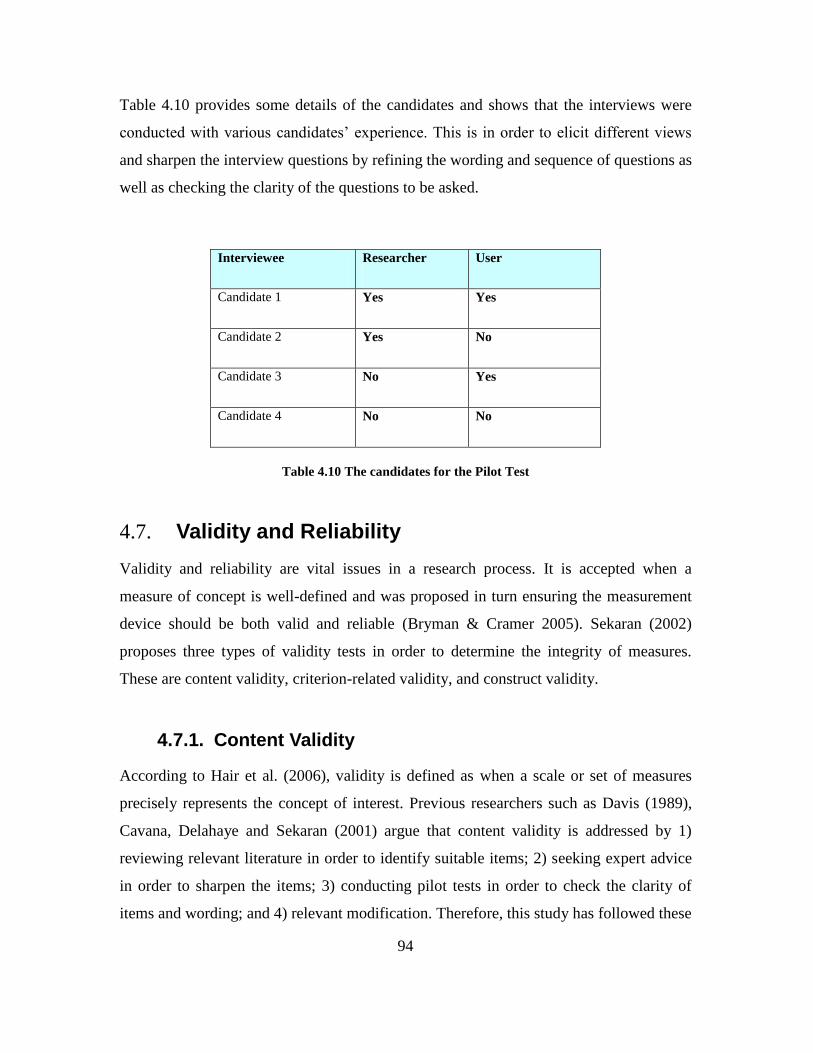
94
Table 4.10 provides some details of the candidates and shows that the interviews were
conducted with various candidates’ experience. This is in order to elicit different views
and sharpen the interview questions by refining the wording and sequence of questions as
well as checking the clarity of the questions to be asked.
Interviewee Researcher User
Candidate 1 Yes Yes
Candidate 2 Yes No
Candidate 3 No Yes
Candidate 4 No No
Table 4.10 The candidates for the Pilot Test
4.7. Validity and Reliability
Validity and reliability are vital issues in a research process. It is accepted when a
measure of concept is well-defined and was proposed in turn ensuring the measurement
device should be both valid and reliable (Bryman & Cramer 2005). Sekaran (2002)
proposes three types of validity tests in order to determine the integrity of measures.
These are content validity, criterion-related validity, and construct validity.
4.7.1. Content Validity
According to Hair et al. (2006), validity is defined as when a scale or set of measures
precisely represents the concept of interest. Previous researchers such as Davis (1989),
Cavana, Delahaye and Sekaran (2001) argue that content validity is addressed by 1)
reviewing relevant literature in order to identify suitable items; 2) seeking expert advice
in order to sharpen the items; 3) conducting pilot tests in order to check the clarity of
items and wording; and 4) relevant modification. Therefore, this study has followed these

95
steps, starting with the following. Firstly, the researcher reviewed the relevant literature
in order to obtain a suitable and validated existed instrument that will be used in this
research. Secondly, four PhD researchers were consulted to provide their judgment on
the questionnaires and specifically the items in it. Thirdly, a pilot study was conducted
by distributing fifty surveys 30 to employees and 20 to students, in order to check the
clarity of items and the wording without modifying the original scale. Finally, some
relevant modifications were made to the instrument according to the feedback in order to
ensure the content validity of the instrument such as a reduction in the number of
questions from 48 to 34 to remove questions that seemed to be vague, the addition of
some definitions at the beginning about m-Government and Mobile Parking Service and
the restatement of some questions that seemed to be repetitive to ensure greater
readability and clarity.
4.7.2. Construct Validity
Construct validity is directly related to the questions that the instrument is measuring.
There are two forms of construct validity that seem to be accepted widely, convergent,
and discriminate validity (Churchill & Iacobucci 2009). The former is where indicators
of a specific construct covers or share a high proportion of variance in common (Hair et
al.2006). The latter is when the measures among different constructs have a low
correlation (Zikmund 2003). This research ascertained the validity of the questions
during the development of the instrument. In addition, the variables to be measured in
this research were obtained from the well-known theories of Rogers’ Diffusion of
Innovations (DOI) as well as the Technology Accepted Model (TAM) and others from
existing scales derived from the literature. These variables have been measured by
previous researchers and have been confirmed as having construct validity. Thus,
questions that have been confirmed as valid by previous researchers have been adapted to
suit this research and the wording amended as necessary without affecting the original
scale.

96
4.7.3. Reliability
The research might produce inaccurate results and negate the acceptance or rejection of
hypotheses if reliability and validity are not checked (Creswell 2009). Consequently,
reliability and validity are two vital characteristics of questionnaire items in a good
measurement instrument (Cavana, Delahaye, & Sekaran, 2001; Zikmund 2003;
Cresswell 2009). Reliability is imperative but not an essential provision for validity
(Cavana, Delahaye, & Sekaran, 2001). For instance, a test may not be valid but may be
reliable. On the other hand, a test must be valid in order to be a reliable. According to
Zikmund (2003), reliability is a measure where similar outcomes are achieved over time
and across conditions. Pallant (2005) agrees that reliability tests the consistency and
stability of a measurement instrument.
Litwin (1995) suggests that there are four different methods to measure reliability 1) test-
retest; 2) intra-observer; 3) inter-observer and; 4) internal consistency. This research
utilizes internal consistency, as it is more suitable than the others. In order to measure
internal consistency or reliability, Cronbach’s alpha will be used, and the commonly
accepted rule of thumb is that the result should be 0.8 and above (Litwin 1995; Malhotra
& Birks 2000; & Bryman 2007). Chapter 5 provides more details about the results from
Cronbach’s alpha.
4.7.4. External Validity
This study has adapted the seven staged sampling procedure developed by Zikmund
(2003) as mentioned before. Table 4.8 describes the chosen sample of population in
relation to Zikmund’s seven stages. The sample clearly reflects the general population in
Oman. Therefore, outcomes reached in this study can be generalised to the rest of the
population. Having said that, caution has to be taken as the sample and the mobile
service (Mobile Parking) is specific to the capital area, Muscat. However, as the Omani
context has no unique factors in terms of m-Government services, the model proposed in
this research will be useful for many countries considering delivery of m-Government

97
services in order to explain the factors that influence/impact the intention to use m-
Government services and it will contribute to the existing knowledge.
4.8. Data Analysis
In the second semester of 2009, about 300 questionnaires were distributed and 253
responses were collected. Among these 253 responses, 7 responses were discarded due to
large proportions of the questionnaires not being answered. Therefore, 246 responses
were deemed to be usable which is about (82 per cent response rate).
4.8.1. Survey analysis
The research model introduced in the previous Chapter three consists of 9 independent
variables and 1 dependent variable. These variables need to be analysed using an
appropriate analysis tool. Therefore, for this study different tools were used for the data
analysis. First, the Statistical Package for the Social Sciences (SPSS) version 16 was
used to organize the data that had been collected. Second, all the data were divided into
segments, i.e. males, females, young and old people, users of the Mobile Parking
Service, non-users of the Mobile Parking Service, highly educated, and less educated
people. These segments were then transformed into Excel spreadsheet. However, for
testing the model and hypotheses, the advanced technique of Structural Equation
Modeling (SEM) was used (see Chapter 5). For analysing results of variables in
particular latent constructs that have multiple dimensions in order to allow assessment of
measurement properties and theoretical (structural) relationship, SEM is considered a
powerful second-generation multivariate technique to meet this purpose (Hoyle 1995;
Kline 2005; & Maruyama 1997). This study adopts Partial Least Squares (PLS) path
modeling which is a division of SEM, and widely employed in information systems and
marketing research. In addition, this PLS path modeling was chosen it is considered
more appropriate for predictive and exploratory research (Azwadi, 2010). Further, PLS
supports both formative and reflective variables (Thompson, Barclay, & Higgins, 1995;
Chin, 1998) and can support exploratory and confirmatory research, whereas, other

98
methods as LISERL and Amos can only support reflective constructs (Gefen, Straub, &
Boudreau, 2000).
The software used for PLS path modeling is called SmartPLS 2.0 tool developed by
(Ringle, Wende & Will 2005). According to Bagozzi and Fornell (1982), the second-
generation data analysis technique of SEM provides more benefits than the traditional
first generation statistical tools such as ANOVA and MANOVA. In addition, Gefen,
Straub, and Boudreau, (2000) argue that using the SEM technique allows the researcher
to run a systematic and comprehensive analysis in order to test the interconnected
variables and their items with only one single run, whereas the first generation tools can
only analyze one layer of linkages between variables at a time. Further, there are four
advantages of using the SEM technique as proposed by Bryman (2006). They are as
follows:
SEM takes mainly a confirmatory approach rather than an exploratory approach
to the data analysis;
SEM provides clear estimates of errors variance parameters;
Data analysis using SEM procedures determines both unobserved (e.g. latent) as
well as observed variables; and
SEM methodology has several crucial features such as modeling multivariate
relations, and estimating point and/or interval indirect effects.
Because of these advantages the SEM, technique was considered the most appropriate for
this research in order to test the research model against the data. Using SEM method, the
data analysis for the survey questionnaires go through several steps. These are as follows
(for more details see Chapter 5):
Distribution of Latent Variables: The aim is to present a broad picture of the
respondent’s evaluation of each perception or variable in the research model and
understand more about the characteristics of the sample;
Construct Specification Accuracy: This is to distinguish between the relationship
of measures and latent constructs in order to avoid misspecification;
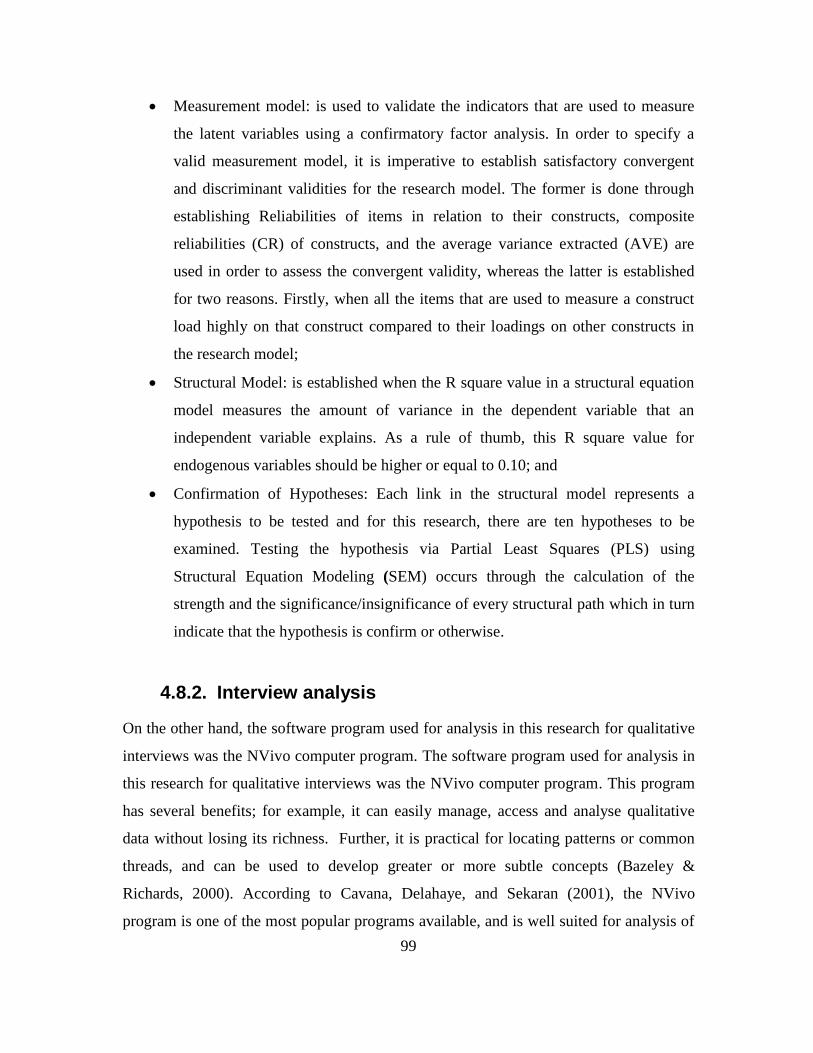
99
Measurement model: is used to validate the indicators that are used to measure
the latent variables using a confirmatory factor analysis. In order to specify a
valid measurement model, it is imperative to establish satisfactory convergent
and discriminant validities for the research model. The former is done through
establishing Reliabilities of items in relation to their constructs, composite
reliabilities (CR) of constructs, and the average variance extracted (AVE) are
used in order to assess the convergent validity, whereas the latter is established
for two reasons. Firstly, when all the items that are used to measure a construct
load highly on that construct compared to their loadings on other constructs in
the research model;
Structural Model: is established when the R square value in a structural equation
model measures the amount of variance in the dependent variable that an
independent variable explains. As a rule of thumb, this R square value for
endogenous variables should be higher or equal to 0.10; and
Confirmation of Hypotheses: Each link in the structural model represents a
hypothesis to be tested and for this research, there are ten hypotheses to be
examined. Testing the hypothesis via Partial Least Squares (PLS) using
Structural Equation Modeling (SEM) occurs through the calculation of the
strength and the significance/insignificance of every structural path which in turn
indicate that the hypothesis is confirm or otherwise.
4.8.2. Interview analysis
On the other hand, the software program used for analysis in this research for qualitative
interviews was the NVivo computer program. The software program used for analysis in
this research for qualitative interviews was the NVivo computer program. This program
has several benefits; for example, it can easily manage, access and analyse qualitative
data without losing its richness. Further, it is practical for locating patterns or common
threads, and can be used to develop greater or more subtle concepts (Bazeley &
Richards, 2000). According to Cavana, Delahaye, and Sekaran (2001), the NVivo
program is one of the most popular programs available, and is well suited for analysis of

100
both unstructured and semi- structured interviews in qualitative research. Furthermore,
this program is practical for small numbers of interviews where discussions are recorded.
As mentioned in Section 4.6, the decision makers involved with m-Government projects
were interviewed using a semi-structured format. The decision makers were asked
whether they wanted to have the interview recorded on tape or whether they preferred the
researcher to take notes. In addition, they were asked whether they preferred to use
Arabic or English during the interviews. All of them agreed to recorded interviews in
English.
Figure 4.3 shows the data analysis approach used in the qualitative method adapted from
Creswell (2009) followed in this research building from bottom to top.
Step 1. Organizing and preparing the data for analysis. This involves transcribing
the semi-structured interviews;
Step 2. Reading all data in order to obtain a general sense of data as well as an
understanding of the general ideas of the participants' views;
Step 3. Coding of the data. This step involves organizing and categorizing all data
into segments;
Step 4. Generating themes for all the data to prepare for the analysis;
Step 5. Interrelating all themes in order to provide a discussion of themes in the
qualitative narrative; and
Step 6. Interpreting the meaning of themes, and learning from the data analysis
process.

101
Coding the Data
Interpreting the Meaning of Themes
Themes
Raw Data (Transcripts)
Reading Through All Data
Interrelating Themes
Organizing and Preparing for Data Analysis
Validating the Accuracy of
the Information
Figure 4.3 The data analysis approach used in the qualitative method
Source: adapted from Creswell (2009)
The coding process was done using the guidelines recommended by Tesch (1990).
These guidelines are as follows:
The researcher carefully read all the transcriptions in order to get a sense of
the whole data;
The researcher went through the first interview. This was the most interesting
interview because this participant was fully involved with the Mobile
Parking Service (the example of m-Government services used in this
research). Then, several questions were noted; for instance, ‘What is this
about?’ and ‘What does this mean?’;

102
After completing the above task for the remaining participants, a list of
themes was made and these themes were then grouped into similar topics.
Those topics were abbreviated as codes and were written next to the
appropriate segments of the text;
Those topics were then turned into categories by grouping the topics that
related to each other;
The final decision on the appropriate abbreviation for each category was
made; and
The data was then ready for the preliminary analysis.
4.9. Ethical Considerations
Academic and professional researchers should always consider ethics as an important
part of their research (Creswell 2009). This research complied with Victoria University’s
Code of Research Ethics. All participants were informed that their participation was
voluntary to avoid potential risks. They were then briefed verbally about the aims of the
project and the measures to ensure confidentiality. This information was also provided in
the invitation letter or cover sheet. If they were willing to participate, they were provided
with a consent form (See Appendix E) (Interviewees only). They were asked to set a time
of their choice for the interview. In accordance with the ethics requirements of Victoria
University, prior to being either be recorded on tape or in notes (depending on
respondents’ preferences), participants were assured that their responses would remain
confidential. The University Human Research Ethics Committee’s contact number and
mail address was provided in the cover sheet or the invitation letter (See Appendix E).
Participants were asked to keep the letter or the cover sheet so that they could contact the
committee if they had any queries or complaints about the study or the way they were
approached.
Interviewees were contacted through the Diwan of Royal Court to arrange the place,
date, time of the interviews and confirm their willingness to take part in this important
stage of data collection. Prior to this date the researcher contacted the offices of the

103
decision makers (their secretaries or office directors) to inform and provide them with an
official invitation letter explaining the aims of the study, and a list of questions to be
asked during the interview.
In order to ensure confidentiality, participants’ names and identity will be kept
confidential and will not be revealed in any publications as a result of this study. Data
analysis reports will be written in a general format that will not enable the participants to
be identified. The questionnaires were designed in a way that will ensure anonymity of
the participant and participants were advised not to write any information that might
reveal their identity. Participants were also advised of the confidentiality procedure in the
cover letter or sheet provided to them before their involvement.
Mobile Parking Service users and non-users were approached through an intermediary
and it was stressed to them that participation was voluntary. In addition, the consent form
(See Appendix E) made it clear that subjects were free to decline or participate. The
intermediary in this case was from Muscat Municipality (the developer of Mobile
Parking Service) who distributed the questionnaires to users and non-users on behalf of
the researcher. After that, follow-up contacts were made to these users via Muscat
Municipality to ensure the delivery of the survey and ensure their understanding of the
questions and cooperation. The researcher then gathered all completed survey
questionnaires from the Muscat Municipality.
4.10. Summary
This chapter described the research method used to examine and validate the research
model and confirm the hypotheses. It provided a detailed description of the empirical
phase of the research that used a mixed methodology approach of quantitative surveys
and qualitative interviews to investigate the impact of perceived characteristics of
innovation towards intention to use m-Government services. These included relative
advantage, compatibility, complexity/ perceived ease of use, trialability and
observability, as well as factors of perceived trustworthiness, perceived security, personal

104
innovativeness and perceived enjoyment derived from the literature. Furthermore, this
chapter presented the influence of age, gender and level of educational attainment on the
perceived characteristics towards intention to use m-Government services. These factors
were investigated from a user/non-user perspective in the developing country of Oman.
This chapter also provided a general overview of m-Government services in the Oman
ICT sector as well as its e-government/m-government vision, strategy and initiatives. In
addition, it has described where m-government (as defined in Chapter 2) fits in this
evolving sector of ICT. The ethical requirements for this research were also discussed in
this chapter. The next chapter, Chapter 5, analyses the data required for the validation of
the research model.

105
Chapter 5. Validation of the Research Model
5.1. Introduction
As Chapter 4 described the research method used to validate a model of intention to
use m-Government services, this chapter provides the validation of the research
model. This chapter is organized as follows. The next Section 5.2 presents the
analysis and results relevant to the demographic characteristics including gender,
age, and education. The distribution of latent variables is discussed in Section 5.3.
In Section 5.4 the constructs specification accuracy and decision rules to identify
formative versus reflective constructs are presented. The measurement model is
described in Section 5.5 and this includes convergent validity, reliabilities of items
in each scale, composite reliabilities of constructs, average variance extracted, and
discriminant validity. The structural model including confirmed or otherwise
hypotheses is presented in Section 5.6 followed by the summary of this chapter in
Section 5.7.
5.2. Analysis of Demographic Characteristics
This section presents the demographic characteristics used in this research. These
demographic variables are gender, age, and education.
5.2.1. Gender
As shown in Figure 5.1, the 246 respondents included 87 females (35 per cent) and 159
males (65 per cent). The figure also shows that the percentage of males is higher than
females. This could be explained by the fact that the survey was distributed in many

106
places without intending to target a specific group and therefore there was no control
over the number of males versus females.
Figure 5.1 Sample distribution by gender
The relationship between gender groups (males and females) and all the variables in the
research model, including PENJ, PINOV, PTT, PSEC, RA, COM, PEOU, TRI, OBSV,
and Intention to use Mobile Parking Services (INT) are shown in Table 5.1.
This analysis shows that there is a positive relationship between Intention to Use and
Compatibility, Perceived Ease of Use, Perceived Trustworthiness and Personal
Innovativeness in the male group. Among these variables, Compatibility was found to be
the most influential factor for men in terms of their intention to use the Mobile Parking
Service as the T-value of 4.10 is greater than 1.96 and the P value is less than 0.001,
which indicates a significant positive path. This is in line with Tornatzky and Klein
(1982) who argue that compatibility is one of the most significant variables in the context
of adoption research.
65%
35%
Male
Female

107
Gender Females Males
Path Significant at
(T > 1.96) (P
< 0.05)
Path Weight Beta
Values ( β )
Significant at
(T > 1.96) (P
< 0.05)
Path Weight
Beta Values
( β )
RA > INT T(0.42<1.96)
P(0.67>0.05)
0.06 T(0.32<1.96)
P(0.75>0.05)
-0.03
CT > INT T(0.84<1.96)
P(0.40>0.05)
0.09 T(4.10>1.96)
P(0.000<0.001)
0.32***
PEOU > INT T(0.46<1.96)
P(0.65>0.05)
-0.05 T(0.21<1.96)
P(0.83>0.05)
0.02
TRI > INT T(0.91<1.96)
P(0.37>0.05)
0.07 T(0.97<1.96)
P(0.33>0.05)
0.08
OBSV > INT T(0.91<1.96)
P(0.36>0.05)
0.12 T(2.91>1.96)
P(0.00<0.05)
0.19**
PTT > INT T(1.26<1.96)
P(0.21>0.05)
0.19 T(2.88>1.96)
P(0.00<0.05)
0.25**
PSEC > INT T(0.27<1.96)
P(0.79>0.05)
-0.03 T(0.81<1.96)
P(0.42>0.05)
-0.07
PENJ > INT T(1.64<1.96)
P(0.10>0.05)
0.19 T(1.66<1.96)
P(0.09>0.05)
0.14
PINOV > INT T(2.78>1.96)
P(0.00<0.05)
0.31** T(2.23>1.96)
P(0.03<0.05)
0.15**
Table 5.1the relationship between all variables within gender groups
*significant at p < 0.1
**significant at p < 0.05
***significant at p < 0.01
Consequently, the Compatibility for males has a stronger impact on their intention to use
the Mobile Parking Service compared to females. The different perceptions of
compatibility between the two groups could be explained by the culture in Oman. For
example, in Oman, Omani males usually support females financially, thus it is expected
that when they invest their money in such services it is compatible with their life style
and fits well with their daily routine. On the other hand, because most females are
supported by the males in the family, they might be less concerned about monetary
investment in such services.

108
Conversely, Personal Innovativeness is the most influential factor for females in terms of
their intention to use the Mobile Parking Service (T-value= 2.78 > 1.96, P=0.03 < 0.05).
This result indicates a positive strength of relationship between personal innovativeness
and the intention to use Mobile Parking Service for the female group. It can be observed
from the analysis that individuals have differing predilections towards acting
innovatively. The results in Table 5.1 which indicate that females are more positive than
males in their perception of the Mobile Parking Service in terms of Perceived Ease of
Use and Relative Advantage.
Concisely, Personal Innovativeness for females has a stronger impact on their Intention
to Use compared to males. Generally, this could be explained by the fact that previously
females in Oman were not treated equally to males and there was a distinction when it
came to finding suitable work. However, nowadays, females in Oman are generally
treated equally to males particularly in the work environment. For instance, when it
comes to appreciation, or giving a reward, this is based on achievement alone and not on
gender. In addition, giving females an opportunity to work in the same environment with
males encourages them to challenge males in many fields; hence because they are
competing with males, they are more likely to explore innovations.
5.2.2. Age
Figure 5.2 shows four age groups. These groups are as follows:
18- 28 years comprise 61 per cent of the sample;
29- 39 years comprise 31 per cent of the sample;
40- 50 years comprise 7 per cent of the sample; and
51-61 years comprise 1 per cent of the sample.

109
Figure 5.2 Sample distributions by age (years)
Figure 6.2 Sample distributions
For easier analysis and readability, the sample can be categorised into two age groups;
younger (18-39) and older (40-61). This categorization can assist the researcher to see
how the relationships between different variables behave within each of these age
groups. According to the T-statistics (7.04 greater than 1.96) and the (P-value 0.000 less
than 0.001) Personal Innovativeness is the most influential factor for the older group (40-
61) in terms of their Intention to Use the Mobile Parking Service.
These results show that personal innovativeness for the older group has a stronger impact
on their intention to use the Mobile Parking Service compared to the younger group. This
could be explained because this older group was born before 1970. The country’s current
Sultan Qaboos began his reign in the 1970 and since then Oman has moved into the
modern era. It can be said that Oman saw a rapid growth in technology in the second half
of the twentieth century with the thirst for knowledge of this age group (40 - 61), a great
deal of awareness was focused on information and communications technologies and
there was a high penetration of the Internet, mobile phones and m-Government services.
Therefore this age group appreciates the value of such innovations more than the
younger groups who see such innovations as routine and do not see the value of them.
18-28
149
61%
29-39
77
31%
40-50
18
7%
51-61
2
1%
18-28
29-39
40-50
51-61
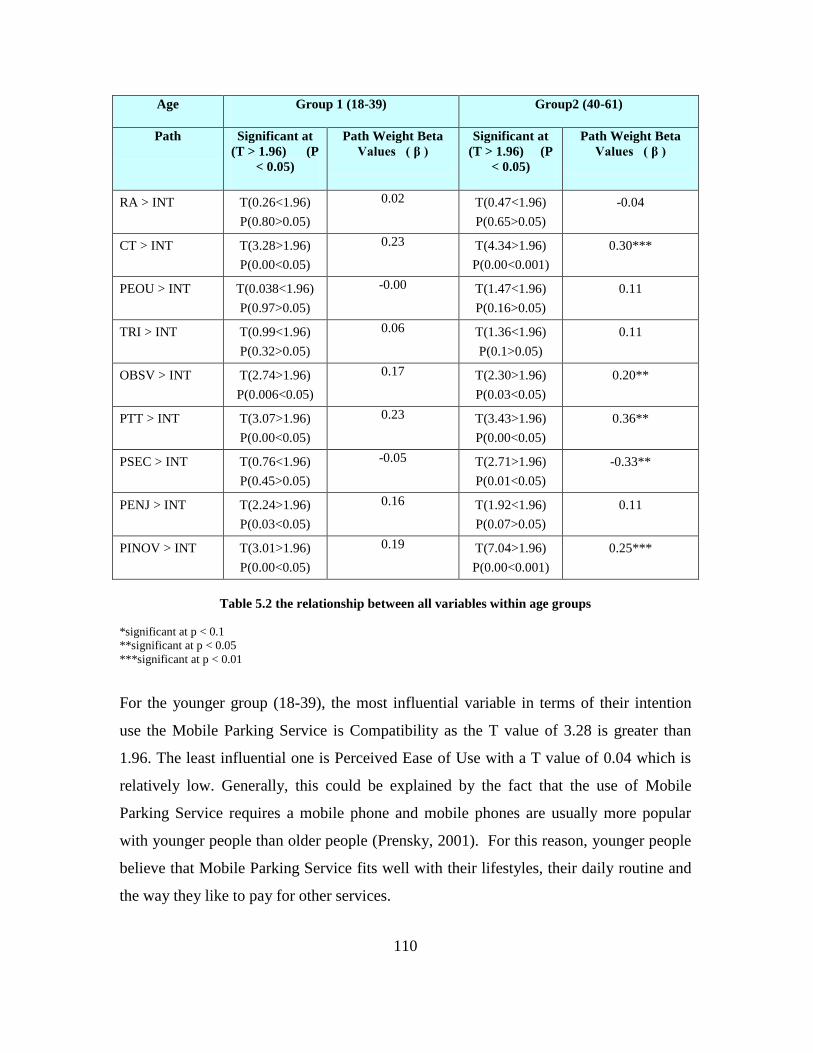
110
Age Group 1 (18-39) Group2 (40-61)
Path Significant at
(T > 1.96) (P
< 0.05)
Path Weight Beta
Values ( β )
Significant at
(T > 1.96) (P
< 0.05)
Path Weight Beta
Values ( β )
RA > INT T(0.26<1.96)
P(0.80>0.05)
0.02 T(0.47<1.96)
P(0.65>0.05)
-0.04
CT > INT T(3.28>1.96)
P(0.00<0.05)
0.23 T(4.34>1.96)
P(0.00<0.001)
0.30***
PEOU > INT T(0.038<1.96)
P(0.97>0.05)
-0.00 T(1.47<1.96)
P(0.16>0.05)
0.11
TRI > INT T(0.99<1.96)
P(0.32>0.05)
0.06 T(1.36<1.96)
P(0.1>0.05)
0.11
OBSV > INT T(2.74>1.96)
P(0.006<0.05)
0.17 T(2.30>1.96)
P(0.03<0.05)
0.20**
PTT > INT T(3.07>1.96)
P(0.00<0.05)
0.23 T(3.43>1.96)
P(0.00<0.05)
0.36**
PSEC > INT T(0.76<1.96)
P(0.45>0.05)
-0.05 T(2.71>1.96)
P(0.01<0.05)
-0.33**
PENJ > INT T(2.24>1.96)
P(0.03<0.05)
0.16 T(1.92<1.96)
P(0.07>0.05)
0.11
PINOV > INT T(3.01>1.96)
P(0.00<0.05)
0.19 T(7.04>1.96)
P(0.00<0.001)
0.25***
Table 5.2 the relationship between all variables within age groups
*significant at p < 0.1
**significant at p < 0.05
***significant at p < 0.01
For the younger group (18-39), the most influential variable in terms of their intention
use the Mobile Parking Service is Compatibility as the T value of 3.28 is greater than
1.96. The least influential one is Perceived Ease of Use with a T value of 0.04 which is
relatively low. Generally, this could be explained by the fact that the use of Mobile
Parking Service requires a mobile phone and mobile phones are usually more popular
with younger people than older people (Prensky, 2001). For this reason, younger people
believe that Mobile Parking Service fits well with their lifestyles, their daily routine and
the way they like to pay for other services.
111
5.2.3. Education
Figure 5.3 below shows the four main educational level groups. These groups are
Primary (3 per cent), Secondary (34 per cent), Undergraduate (50 per cent), Postgraduate
(11 per cent) and other (2 per cent). As the figure shows, the majority of the respondents
are undergraduates and therefore, the sample in this study can be considered as generally
well-educated.
Figure 5.3 Sample distribution by educational level
These groups can be categorised further into two groups (see Table 5.3):
Group 1: primary and secondary; and
Group 2: undergraduate and postgraduate.
Primary 8
3%
Secondary 85
34% Undergraduate
123 50%
Postgraduate 26
11%
Other 4
2%
Primary
Secondary
Undergraduate
Postgraduate
Other

112
Education Group 1
( Primary and Secondary)
Group 2
(Undergraduate and
Postgraduate)
Path Significant at
(T > 1.96)
(P < 0.05)
Path Weight
Beta Values
( β )
Significant at
(T > 1.96)
(P < 0.05)
Path Weight
Beta Values
( β )
RA > INT T(2.15>1.96)
P(0.03<0.05)
0.30** T(1.43<1.96)
P(0.16>0.05)
-0.11
CT > INT T(2.00>1.96)
P(0.048<0.05)
0.18** T(3.32>1.96)
P(0.001<0.05)
0.29**
PEOU > INT T(0.21<1.96)
P(0.833>0.05)
0.024 T(0.28<1.96)
P(0.78>0.05)
-0.03
TRI > INT T(0.23<1.96)
P(0.82>0.05)
0.022 T(1.18<1.96)
P(0.24>0.05)
0.08
OBSV > INT T(0.87<1.96)
P(0.38>0.05)
0.11 T(2.92>1.96)
P(0.004<0.05)
0.20**
PTT > INT T(1.70<1.96)
P(0.09>0.05)
0.21 T(2.59>1.96)
P(0.01<0.05)
0.26**
PSEC > INT T(1.10<1.96)
P(0.27>0.05)
-0.11 T(0.53<1.96)
P(0.60>0.05)
-0.05
PENJ > INT T(0.31<1.96)
P(0.75>0.05)
0.04 T(2.55>1.96)
P(0.01<0.05)
0.20**
PINOV > INT T(1.95<1.96)
P(0.05)
0.20 T(3.71>1.96)
P(0.000<0.001)
0.22***
Table 5.3 The relationship between all variables and educational level
*significant at p < 0.1
**significant at p < 0.05
***significant at p < 0.01
bles and educational level
It can be seen from the Table 5.3 that the most influential variable on the Intention to Use
m-Government services for Group 1 (Primary and Secondary) is Relative Advantage as
the T-statistic value is 2.15 (greater than 1.96), whereas Compatibility has a stronger
impact for Group 2 (Undergraduate and Postgraduate) in terms of their intention to use
Mobile Parking Service (T-statistic 3.32 greater than 1.96). This could be explained by
the fact that the less educated people in Group 1 usually utilize traditional ways to pay
for other services. For this reason, utilizing Mobile Parking Service is new to them and
they could appreciate the benefits (Relative Advantage) more than educated people who

113
have already been exposed to many m-Government services and who might not realize
the advantages of using Mobile Parking Service. This is because it is a routine thing for
them and is already compatible with their lifestyle.
5.3. Distribution of Latent Variables
This section provides the distribution of various variables in the research model. The aim
is to present a broad picture of the respondent’s evaluation of each perception or variable
in the research model and understand more about the characteristics of the sample. Table
5.4 shows the statistical distribution (minimum, maximum, mean and standard deviation)
of the scores of various variables.
Variable N Minimum Maximum Mean Std.
Deviation
Relative Advantage (RA) 246 1.00 5.00 4.00 0.90
Compatibility (COM) 246 1.00 5.00 3.77 0.87
Perceived Ease of Use (PEOU) 246 1.00 5.00 3.97 0.91
Trialability (TRI) 246 1.00 5.00 4.03 0.93
Observability (OBSV) 246 1.00 5.00 3.71 0.81
Perceived Trustworthiness (PTT) 246 1.00 5.00 3.65 0.95
Perceived Security (PSEC) 246 1.00 5.00 3.54 0.94
Perceived Enjoyment (PENJ) 246 1.00 5.00 3.84 0.95
Personal Innovativeness (PINOV) 246 1.00 5.00 3.78 0.85
Intention to Use (INT) 246 1.00 5.00 3.91 0.86
Table 5.4 The un-standardised PLS scores of all variables in the research model
Note: Based on a Likert scale from 1 (strongly disagree) to 5 (strongly agree).
The minimum and maximum scores are based on a 5-Point Likert scale from 1 (strongly
disagree) to 5 (strongly agree). The mean scores represent the average of scores of the
whole sample (246 respondents) on every scale in the questionnaire including: RA,

114
COM, PEOU, TRI, OBSV, PTT, PSEC, PENJ, PINOV, and Intention to use Mobile
Parking Service (INT).
The respondents in this sample generally have above-average scores (Mean score greater
than 3) for their Intention to Use Mobile Parking Service. This indicates a positive
attitude towards their Intention to Use Mobile Parking Service. In addition, most
respondents indicated that Relative Advantage (RA) (Mean = 4.00) and Trialability
(TRI) (Mean = 4.03) are highly important when it comes to their Intention to Use Mobile
Parking Service. Based on the items used to measure Relative Advantage in the
questionnaire, the high mean value for this variable indicates that individuals find that
using Mobile Parking Service enables them to pay their parking fees more quickly, more
easily and more efficiently. It also saves them time and increases their productivity more
than other methods such as using coins or ticket machines.
Additionally, the respondents generally think that the use of Mobile Parking Service is
Compatible (COM) with their life style and Easy to Use (PEOU) (Mean scores greater
than 3). In addition, the results of using the Mobile Parking Service are observable and
visible to individuals (OBSV), so it would be diffused faster than any innovation that is
not so visible. This emphasizes that the use of Mobile Parking Service is clear,
understandable and does not require excessive mental effort or cause frustration (PEOU).
Further, the respondents believe that the use of Mobile Parking Service is secure (PSEC)
and trustworthy (PTT). The high mean scores for Personal Innovativeness (PINOV) and
Perceived Enjoyment (PENJ) indicate that the respondents are highly innovative and
enjoy using Mobile Parking Service. Finally, the respondents seem to have a highly
positive attitude toward their Intention to Use (INT) Mobile Parking Service in the
future.
5.4. Construct Specification Accuracy
It is vital to distinguish between the relationship of measures and latent constructs in
order to avoid misspecification. Previous scholars indicate that misspecification issues

115
within structural equation models lead to ’serious consequences on the theoretical
conclusions drawn from the model‘(Jarvis et al. 2003, p.212). This issue is also
emphasized by Mackenzie, Podsakoff and Jarvis (2005) who argue that construct
misspecification affects the results of the structural model analysis and can lead to Type I
(confirming a hypothesis when it is in fact insignificant) and Type II errors (rejecting a
hypothesis when it is in fact significant). In the structural model, it is crucial to
distinguish between the measurement of indicators on both formative and reflective
constructs because this enables you to design or model the correct conceptual relations
between constructs and their indicators.
There are two general types of relationships between latent constructs and their measures
or indicators: formative and reflective. Formative relationships are drawn in a structural
model using arrows coming from the measures towards the main construct, whereas
reflective constructs are represented using arrows going from the main construct towards
the measures, as shown in Figure 5.4 below.
Construct
Measurement
indicators
A reflective construct
Construct
Measurement
indicators
A formative construct
Figure 5.4 A simplified representation of how reflective and formative constructs are drawn in
structural equation modeling
Source: (AlHinai Y, 2009)
The way constructs are represented in a structural model has implications for the
conceptual domain that a construct covers. For instance, if a single indicator in a
formative construct were deleted, this would affect the definition and meaning of the
construct because it will be missing part of its conceptual domain. However, in the

116
reflective construct, if an indicator or measure is removed, this would not affect the
conceptual domain because the measures or indicators are constructed in a manner that
reflects the same core meaning of the construct (MacCallum & Browne, 1993)
In order to identify whether a construct should be specified as reflective or formative, a
set of four decision rules or criteria were proposed by Jarvis et al. (2003) and adopted by,
Mackenzie, Podsakoff and Jarvis (2005), Petter, Straub and Rai (2007); and AlHinai
(2009). The summary of these decision rules are shown in Table 5.5; whereas,
justifications of the specification of each of these constructs as either formative or
reflective based on the decisions rules is mentioned (see Appendix G for more details on
Construct Specification Accuracy).
Decision Rules Formative Model Reflective Model
1. Direction of causality from construct
to measure implied by the conceptual
definition
Are the indicators (items) (a)
defining characteristics or (b)
manifestations of the construct?
Would changes in the
indicators/items cause changes in
the construct or not?
Would changes in the construct
cause changes in the indicators?
Direction of causality is from items to
construct
Indicators are defining characteristics
of the construct
Changes in the indicators should
cause changes in the construct
Changes in the construct do not cause
changes in the indicators
Direction of causality is from construct
to items
Indicators are manifestations of the
construct
Changes in the indicator should
not cause changes in the construct
Changes in the construct do cause
changes in the indicators
2. Interchangeability of the
indicators/items
Should the indicators have the
same or similar content? Do the
indicators share a common theme?
Would dropping one of the
indicators alter the conceptual
domain of the construct?
Indicators need not be interchangeable
Indicators need not have the same or
similar content/indicators need not
share a common theme
Dropping an indicator may alter the
conceptual domain of the construct
Indicators should be interchangeable
Indicators should have the same or
similar content/indicators should
share a common theme
Dropping an indicator should not
alter the conceptual domain of the
construct
3. Co-variation among the indicators
Should a change in one of the
indicators be associated with
changes in the other indicators?
Not necessary for indicators to co-vary
with each other
Not necessarily
Indicators are expected to co-vary with
each other
Yes
4. Nomo-logical net of the construct
indicators
Are the indicators/items expected
to have the same antecedents and
consequences?
Nomo-logical net for the indicators may
differ
Indicators are not required to have the
same antecedents and consequences
Nomo-logical net for the indicators
should not differ
Indicators are required to have the
same antecedents and
consequences
Table 5.5 Decision rules to identify formative- vs. reflective-indicator constructs.
Source: Jarvis et al. (2003)

117
5.5. Measurement Model
Two components are part of any Structural Equation Model (SEM); the measurement
model and the structural model (Hoyle 1995; and Kline 2005). The first, the
measurement model, is used to validate the indicators that are used to measure the latent
variables using a confirmatory factor analysis. The second is used to describe the casual
relationships between different variables in the research model (Hoyle 1995). This
Section focuses on the measurement model, whereas Section 5.6 describes the structural
model. As shown in Figure 5.5, each construct is measured by not less than three
measurement indicators because the use of three or four measurement indicators per
construct is recommended. Further, using more than five indicators will not present
acceptable SEM results (Chin, 1998). In order to specify a valid measurement model, it
is imperative to establish satisfactory convergent and discriminant validities for the
research model. The measurement model used in the PLS analysis is shown in Figure
5.5.
Figure 5.5 Measurement Model

118
5.5.1. Convergent Validity
Reliabilities of items in relation to their constructs, Composite Reliabilities (CR) of
constructs, and the Average Variance Extracted (AVE) are used in order to assess the
convergent validity (Fornell & Larcker, 1981). As a rule of thumb the minimum
acceptable Cronbach’s alpha of 0.70 (Nunnally and Bernstein1994) was used as a
benchmark for acceptable construct reliability. Table 5.6 below shows Convergent
Validity of Constructs:
Constructs No. Items Composite
Reliability (CR)
Average Variance
Extracted (AVE)
Communality
Relative
Advantage
4 0.905885 0.706679 0.706679
Compatibility 4 0.909773 0.715992 0.715992
Perceived Ease of
Use
5 0.922234 0.703513 0.703513
Trialability 4 0.870993 0.628230 0.628230
Observability 4 0.802331 0.508611 0.508611
Perceived
Enjoyment
3 0.875914 0.701884 0.701884
Personal
Innovativeness
3 0.760315 0.524789 0.524789
Perceived
Trustworthiness
3 0.869516 0.689781 0.689781
Perceived Security 3 0.872613 0.695908 0.695908
Intention to Use 4 0.870657 0.627421 0.627421
Table 5.6 Convergent Validity of Constructs
e 6.7 Convergent Validity of Constru
The item loadings from the outer measurement model were examined in order to assess
the item reliabilities. The correlation coefficients between the indicator and the latent
variable represent the item loadings. The composite reliability of all constructs exceeds
the 0.70 threshold, which is the suggested benchmark for acceptable construct reliability

119
(Hair et al. 2006). The Average Variance Extracted (AVE) of all constructs and the
communality results in the model exceed 0.50 which is the recommended threshold
(Fornell & Larcker, 1981). Table 5.6 shows that the research model in this study meets
the minimum requirements for convergent validity.
5.5.2. Discriminant Validity
Discriminant validity is established for two reasons. Firstly, when all the items that are
used to measure a construct load highly on that construct compared to their loadings on
other constructs in the research model (see Table 5.7). Secondly, if the square root of
Average Variance Extracted (AVE) for each construct is higher than its correlations with
other constructs (Chin 1998) (see Table 5.8).
Compact Ease Enjoy Innov Inten_Use Observ RA Secur Trial Trust
Comp_a 0.841666 0.544495 0.526729 0.495533 0.602453 0.495220 0.607554 0.479508 0.395768 0.503228
Comp_b 0.859915 0.540447 0.548492 0.539237 0.607079 0.469577 0.617935 0.515579 0.478049 0.518886
Comp_c 0.839015 0.557032 0.394882 0.455264 0.544649 0.428201 0.560826 0.475100 0.372096 0.513308
Comp_d 0.843900 0.563658 0.551332 0.451982 0.581673 0.500573 0.584641 0.523908 0.346774 0.531608
Ease_a 0.577253 0.822881 0.471163 0.466553 0.532870 0.608518 0.517423 0.468100 0.431337 0.555476
Ease_b 0.572853 0.868473 0.529190 0.469741 0.522571 0.553195 0.549787 0.446819 0.454813 0.479271
Ease_c 0.543291 0.834143 0.505147 0.447074 0.478496 0.521814 0.527333 0.441018 0.453822 0.472657
Ease_d 0.515876 0.821804 0.484362 0.471474 0.529707 0.553525 0.541672 0.438031 0.528234 0.504896
Ease_e 0.521713 0.845594 0.504866 0.433022 0.543003 0.559981 0.569627 0.497556 0.515678 0.476376
Enjoy_a 0.567114 0.504545 0.852814 0.525349 0.584401 0.430772 0.553380 0.402102 0.412550 0.442861
Enjoy_b 0.494020 0.503846 0.851378 0.533775 0.505781 0.404532 0.486964 0.435862 0.409687 0.439918
Enjoy_c 0.440714 0.486323 0.808402 0.483790 0.512415 0.477080 0.482267 0.385748 0.360697 0.404790
Innovat_a 0.354138 0.434630 0.523754 0.785827 0.518600 0.370783 0.477338 0.357572 0.452590 0.358878
Innovat_b 0.327522 0.168270 0.204470 0.500012 0.288842 0.224626 0.155005 0.317228 0.123182 0.259473
Innovat_c 0.560612 0.501607 0.523931 0.840733 0.540051 0.468534 0.417474 0.433589 0.445406 0.430951
Inten_a 0.580059 0.476738 0.481378 0.431104 0.762005 0.478583 0.440277 0.429362 0.260842 0.529422
Inten_b 0.594939 0.515348 0.480190 0.487833 0.816304 0.559651 0.502106 0.472415 0.492183 0.553592
Inten_c 0.496263 0.470187 0.494006 0.457010 0.804846 0.440907 0.476189 0.444196 0.412698 0.481489
Inten_d 0.518212 0.507269 0.565033 0.642208 0.784157 0.510629 0.552621 0.422020 0.509499 0.459982
Observ_a 0.523260 0.629242 0.500816 0.488866 0.578614 0.790501 0.569561 0.387107 0.525485 0.429576
Observ_b 0.379559 0.378825 0.345930 0.380454 0.404275 0.708571 0.348974 0.355409 0.434614 0.351213
Observ_c 0.372949 0.452604 0.349885 0.340389 0.466382 0.783214 0.342608 0.333209 0.455471 0.358054

120
Observ_d 0.277606 0.427419 0.232672 0.154789 0.286949 0.542269 0.170524 0.292613 0.215273 0.326820
RA_a 0.557350 0.532815 0.539888 0.459746 0.516907 0.427907 0.861818 0.498502 0.493381 0.545862
RA_b 0.561082 0.571521 0.562166 0.441419 0.507440 0.435101 0.875838 0.422704 0.511059 0.488345
RA_c 0.612820 0.511694 0.473526 0.465617 0.540810 0.418712 0.815366 0.499502 0.422544 0.547278
RA_d 0.621524 0.553955 0.466767 0.377685 0.531202 0.522364 0.807509 0.410661 0.448093 0.470871
Secur_a 0.458175 0.426017 0.432350 0.402691 0.424630 0.366980 0.448738 0.777736 0.283566 0.591845
Secur_b 0.457656 0.468384 0.400243 0.404850 0.445612 0.395506 0.449371 0.857102 0.230106 0.675104
Secur_c 0.553105 0.473545 0.392443 0.454639 0.520213 0.433015 0.468834 0.865002 0.339117 0.721439
Trial_a 0.195236 0.276922 0.228200 0.324920 0.287098 0.396598 0.262834 0.177998 0.752012 0.167434
Trial_b 0.263202 0.326416 0.284965 0.379062 0.332614 0.439988 0.335937 0.173848 0.801867 0.194890
Trial_c 0.502873 0.590720 0.451405 0.413258 0.497453 0.520655 0.565766 0.333695 0.788026 0.362565
Trial_d 0.453258 0.528287 0.464527 0.481036 0.516671 0.511292 0.522887 0.348221 0.826694 0.389344
Trust_a 0.498071 0.473102 0.422151 0.412014 0.436099 0.409216 0.473126 0.742123 0.306205 0.816768
Trust_b 0.443399 0.461103 0.356742 0.350311 0.510666 0.431775 0.455491 0.560445 0.251214 0.806496
Trust_c 0.569872 0.540816 0.487945 0.450961 0.633958 0.439189 0.584521 0.678264 0.358715 0.867062
Table 5.7 The loadings of each item with each latent variable
Reading the figures for each measurement item in each row (starting from left most
column), it can be seen that each item has the highest loading on its own construct
compared to the item's loading on other constructs. Consequently, this satisfies the
requirement for discriminant validity. Although, Innovative_b and Observ_d loadings are
quite low compared to other items in the constructs, the loadings in the other items are
still higher on their own constructs compared to other constructs. As shown in Table 5.8,
most of the items load highly on their construct exceeding the 0.60 threshold, as
recommended by Nunnally (1967).
Generally, the results ensure the discriminant validity as the loadings of measurement
items on their related construct is greater than their loadings on other constructs (Chin
1998; Gefen, Straub & Boudreau, 2000) (see Table 5.7). In addition, the square root of
AVEs for each construct is greater than its correlations with other constructs (see Table
5.8).

121
Constructs AVE Compact Ease Enjoy Innov Inten_Use Observ RA Secur Trial Trust
Compact 0.72 0.85*
Ease 0.71 0.65 0.84
Enjoy 0.70 0.60 0.64 0.84
Innov 0.52 0.57 0.54 0.61 0.72
Inten_Use 0.63 0.70 0.62 0.63 0.64 0.74
Observ 0.51 0.56 0.66 0.52 0.50 0.63 0.71
RA 0.71 0.70 0.64 0.60 0.51 0.62 0.53 0.84
Secur 0.76 0.59 0.55 0.49 0.50 0.56 0.48 0.55 0.87
Trial 0.62 0.47 0.57 0.47 0.51 0.54 0.60 0.56 0.34 0.79
Trust 0.69 0.61 0.60 0.51 0.50 0.64 0.51 0.61 0.80 0.64 0.83
Table 5.8 Correlations among constructs and the square root of AVEs
*Square Root of AVEs are root of AVEs
Having established the convergent validity and discriminant validity of the measurement
model, this will enable us to proceed further, assess the structural model and test the
research hypotheses (see Appendix C for more details on Data Analysis of
Questionnaires).
5.6. Structural Model
The R square value in a structural equation model measures the amount of variance in
the dependent variable that an independent variable explains. As a rule of thumb, this R
square value for endogenous variables should be higher or equal to 0.10 (Falk & Miller
1992). In order to explain the variance in the Intention to use (INT) m-Government
services this research aimed to examine a set of variables. Again, these variables are

122
Relative Advantage, Compatibility, Perceived Ease of Use, Trialability, Observability,
Perceived Trustworthiness, Perceived Security, Perceived Enjoyment, and Personal
Innovativeness. This can be achieved through PLS analysis by examining the (R square)
of the dependent variable Intention to Use (INT).
As shown in Table 5.9, the Personal Innovativeness variable explains (37per cent) of
total variance in the perceived enjoyment. Also, Trailability explains (36 per cent) of the
total variance in Observability and finally Perceived Security explains (64 per cent) of
the total variance in Perceived Trustworthiness. These figures add more power to the
model that this research examines since, besides to the main dependent variables; other
important variables can also be explained by some other variables in the model.
Dependent Variables R Square
Intention to Use 0.662717
Perceived Enjoyment 0.377394
Observability 0.357976
Perceived Trustworthiness 0.636523
Table 5.9 Variance R2 square for dependent variables
Together, the independent variables including Relative Advantage, Compatibility,
Perceived Ease of Use, Trialability, Observability, Perceived Trustworthiness, Perceived
Security, Perceived Enjoyment, and Personal Innovativeness explain (66 per cent) of
total variance in Intention to Use (INT). This is a respectable percentage since more than
(50 per cent) of citizens' intention to use Mobile Parking Service can be explained by
understanding these specific variables.

123
5.6.1. Confirmation of Hypotheses
Each link in the structural model represents a hypothesis to be tested and for this research
there are nine hypotheses to be examined. Testing the hypothesis via Partial Least
Squares (PLS) using Structural Equation Modeling (SEM) occurs through the calculation
of the strength and the significance/insignificance of every structural path. PLS measures
a beta value (β) which is the path weight in order to obtain the strength of each path. In
addition, through the bootstrapping analysis using T-statistics, the statistical
significance/insignificance of every hypothesis or path can be tested (see Figure 5.6).
Figure 5.6 The bootstrapping results
As mentioned earlier, the distribution of latent variables shows a general positive attitude
towards the use of Mobile Parking Service. However, when it comes to the PLS analysis
of all variables and their relationships, it shows insignificant paths in some constructs.
Table 5.10 below show the hypotheses confirmation results:

124
Path Hypotheses Significant at
(T > 1.96)
(P < 0.05)
Path
Weight
Beta
Values
( β )
Overall Results Supported?
Relative
Advantage>
Intention to use
H1 Higher levels of perceived relative advantage will be positively
related to higher levels of intention to use mobile-Government
services.
T (0.34 < 1.96)
P (0.731 > 0.05)
β (0.03) Not significant No
Compatibility >
Intention to use
H2 Higher levels of perceived compatibility will be positively
related to higher levels of intention to use mobile-Government
services.
T (3.53 > 1.96)
P (0.000 < 0.01)
β (0.23) 0.23*** Yes
Perceived ease
of use >
Intention to use
H3 Higher levels of perceived ease of use will be positively related
to higher levels of intention to use mobile-Government
services.
T (0.19 < 1.96)
P (0.85 > 0.05)
β (-0.01)
Not significant No
Trialability >
Intention to use
H4 Higher levels of perceived trialability will be positively related
to higher levels of intention to use mobile-Government
services.
T (1.24 < 1.96)
P (0.22 > 0.05)
β (0.07) Not significant No
Observability >
Intention to use
H5 Higher levels of perceived observability will be positively
related to higher levels of intention to use mobile-Government
services.
T (3.03 > 1.96)
P (0.00 < 0.05)
β (0.18)
0.18**
Yes
Perceived
Trustworthiness
> Intention to
use
H6 Higher levels of perceived trustworthiness in the mobile
Government services will be positively related to higher levels
of intention to use.
T (3.43 > 1.96)
P (0.000 < 0.01)
β (0.25)
0.25***
Yes
Perceived
Security >
Intention to use
H7 Higher levels of Perceived Security in the mobile government
services will be positively related to higher levels of intention
to use.
T (1.05 < 1.96)
P (0.29 > 0.05)
β (-0.07)
Not significant No
Perceived
Enjoyment >
Intention to use
H8 Higher levels of perceived enjoyment in the mobile
government services will be positively related to higher levels
of intention to use.
T (2.29 > 1.96)
P (0.02 < 0.05)
β (0.15) 0.15** Yes
Personal
Innovativeness >
Intention to use
H9 Higher levels of personal innovativeness in the mobile
government services will be positively related to higher levels
of intention to use.
T (3.56 > 1.96)
P (0.000 < 0.01)
β (0.19) 0.19*** Yes
Table 5.10 Hypotheses confirmation results
*significant at p < 0.1
**significant at p < 0.05
***significant at p < 0.01
125
The results of PLS analysis show some structural paths are insignificant. These
insignificant structural paths or non-confirmed hypotheses include Relative Advantage,
Perceived Ease of Use, Trialability, and Perceived Security, whereas, the remaining
structural paths indicated significant paths or confirmed hypotheses. These confirmed
hypotheses are Compatibility, Observability, Perceived Trustworthiness, Perceived
Enjoyment, and Personal Innovativeness. For instance, Compatibility has a significant
impact on Intention to use Mobile Parking Service (H2, T = 3.53 > 1.96, β = 0.23, P <
0.05). This means that the respondents find it important to use the Mobile Parking
Service instead of traditional ways to pay for parking and it also fits well with their
lifestyle, daily routine, and the way they pay for other services. In addition, Observability
has a significant impact on the intention to use Mobile Parking Service (H5, T= 3.03 >
1.96, β = 0.18, P < 0.05). This indicates that for respondents, the availability of clear
instructions on how to use the Mobile Parking Service and the fact that they have no
difficulty telling others about the service have an decisive impact on their Intention to
Use.
Moreover, the impact of Perceived Enjoyment towards the intention to use Mobile
Parking Service shows a positive and significant path (H8, T= 2.29 > 1.96, β = 0.15, P <
0.05). Furthermore, the PLS analysis results show a greater impact (p < 0.01) of Personal
Innovativeness (H9, T= 3.56 > 1.96, β = 0.19, P < 0.01) and Perceived Trustworthiness
(H6, T= 3.43 > 1.96, β = 0.25, P < 0.01) on intention to use Mobile Parking Service.
Further analyses were done (see next Chapter 6, Section 6.4) of semi-structured
interviews in order to obtain additional explanations of non-confirmed hypotheses. These
include Relative Advantage, Perceived Ease of Use, Trialability, and Perceived Security.
The findings obtained from the quantitative study were complemented by a qualitative
study using semi-structured interviews with decision makers who are involved in m-
Government projects. This was done in order to obtain further confirmation for the
model and hypotheses and to acquire some in-depth explanations of some of the
relationships/paths in the research model.

126
5.7. Summary
This chapter has provided an analysis of the data collected from the survey
questionnaires (quantitative) and the interviews (qualitative) and has provided the results
of both analyses. The demographic characteristics including gender, age, and educational
attainment level and their influences on the variables in the research model have been
discussed. Following the construct specification all constructs were found to be
reflective. The measurement model and some statistical tests including convergent
validity, reliabilities of items in each scale, composite reliabilities of constructs, average
variance extracted, and discriminant validity have also been discussed. They were found
to meet the requirement of convergent validity and discriminant validity followed by the
structural model to confirm or disconfirm the proposed hypotheses.
For the quantitative analysis, the overall results of PLS analysis showed that some
structural paths are insignificant. These insignificant structural paths or non-confirmed
hypotheses were Relative Advantage>Intention to use, Perceived Ease of Use >Intention
to use, Trialability>Intention to use, and Perceived Security>Intention to use, whereas,
the remaining structural paths have indicated significant paths or confirmed hypotheses.
These confirmed hypotheses were Compatibility>Intention to use,
Observability>Intention to use, Perceived Trustworthiness>Intention to use, Perceived
Enjoyment>Intention to use, and Personal Innovativeness>Intention to use. Further
qualitative analysis was done in order to obtain additional explanations of non-confirmed
hypotheses and different views were found from the decision makers depending on the
application. Chapter 6 presents in more detail the findings derived from both the
quantitative and qualitative analyses and discusses the results and the lessons learned.

127
Chapter 6.
Discussion of Findings
6.1. Introduction
The previous Chapter 5 discussed the validation of the research model. This chapter
discusses the findings of both the quantitative and qualitative studies. The chapter is
organized as follows. Section 6.2 presents and discusses the key findings relevant to the
variables in the original Diffusion of Innovations Model (DOI) including: relative
advantage, compatibility, perceived ease of use, trialability, observability, perceived
trustworthiness, perceived security, perceived enjoyment, and personal innovativeness.
In Section 6.3 the influence of demographic variables (gender, age, and education) is
discussed and in Section 6.4, the key findings of the interviews are presented. A refined
model of Intention to Use m-Government services based on the results of this research is
presented in Section 6.5.
6.2. Key findings of survey
This section describes the impact of the variables in the original Diffusion of Innovations
(DOI) model on the Intention to Use m-Government services. For each variable, the
discussion starts with a brief explanation about the meaning of the variable, followed by
the findings derived from the quantitative analysis. In addition, the importance of the
findings and the implications they have on the successful implementation of m-
Government services is discussed, followed by some suggestions for the decision makers
who are involved in m-Government projects on how to utilize the influence of a variable
for their advantage.

128
6.2.1. The impact of Relative Advantage on Intention to Use
In the Diffusion of Innovations theory, Rogers (2003, p.229) defined Relative Advantage
as ’the degree to which an innovation is perceived as being better than the idea it
supersedes‘(p. 229). In the context of m-Government services, Relative Advantage is a
characteristic of the Mobile Parking Service through which the user gains several
advantages. These advantages include easiness, saving time, enabling individuals to pay
parking fees more quickly and increasing their productivity as well as achieving tasks
more efficiently compared to other alternatives of paying for parking (e.g. Coins, Ticket
machine). The following hypothesis regarding citizens’ perceptions of relative advantage
was tested:
H1: Higher levels of perceived relative advantage will be positively related to higher
levels of intention to use mobile-Government services.
The Partial Least Squares (PLS) analysis of the questionnaire data (Chapter 5) revealed
that Relative Advantage did not have a direct impact on Intention to Use the Mobile
Parking Service since the relationship was insignificant as (H1, T-value= 0.34, P > 0.05).
In the context of e/m-Government services, this outcome is consistent with the previous
studies of Schaupp and Carter (2005) who argue that relative advantage was found to
have an insignificant impact on Intention to Use e-voting in the United States of
America. On the other hand, Trinkle (2001) argues that individuals would adopt mobile
services more quickly if the government were more responsive and informed in
providing such advantageous services to them. Therefore, in order for individuals to
adopt an innovation, they should see the beneficial value of this over the existing
services. This outcome means that the respondents do not see the advantages of using the
Mobile Parking Service even though it enables them to pay their parking fees more
quickly, more easily and more efficiently and with increases productivity when
compared with the other methods (e.g. using Coins, Ticket machine).
From these results, although the PLS results of quantitative analysis show an
insignificant impact of Relative Advantage on Intention to Use Mobile Parking Service,

129
the qualitative results of the decision makers shows a significant impact on Intention to
Use m-Government services. This is because a deeper analysis of the quantitative results
revealed that the majority of respondents to the questionnaire were from the age group 18
to 28. This age group constitutes 61 per cent of the whole sample of 246 questionnaires.
The Partial Least Squares (PLS) analysis of the questionnaire data (see Chapter 5)
showed that most of the respondents from this particular age group indicated a low
Relative Advantage for the Mobile Parking Service over the traditional methods (e.g.
Coins, Ticket machine). This high percentage has a strong influence on the overall
results. For this reason, the Relative Advantage of Mobile Parking Service shows
insignificant impact on Intention to Use.
On the other hand, the total number of respondents in the whole sample had above-
average scores towards their Intention to Use Mobile Parking Service as indicated in the
(Mean) value which is greater than 4. This indicates a positive attitude towards their
Intention to Use Mobile Parking Service. Therefore, although the quantitative analysis
shows insignificant impact of Relative Advantage on Intention to Use, the respondents
do have the potential to perceive m-Government services as beneficial in contrast with
traditional methods.
Therefore, the decision makers who are involved in the m-Government services’ projects
should consider the Relative Advantage factor when introducing new m-Government
services. They should introduce and market the benefits of any innovation to the
individuals clearly and positively. This could be done via any effective media channel
that can reach a large number of individuals (e.g. TV, Radio, Newspapers, Websites,
Brochures, SMS, etc).
In summary, based on the results above, it can be observed that the respondents do not
consider the importance of benefits of using Mobile Parking Services over the traditional
methods (e.g. Coins, Ticket machine) unlike the decision makers who are responsible of
m-Government services projects. However, the sample included users and non-users.
Thus, it is not necessary for the users to continue using the services and it is not
necessary for non-users to have the intention to use the service. Therefore, despite being

130
the (Mean) value greater than 4, the impact of Relative Advantage on Intention to use is
insignificant. This could also be due to the fact that the advantages of using the Mobile
Parking Service have not been marketed effectively. Concisely, these findings do not
support the hypothesis of this research which is that a higher level of relative advantage
will be positively related to higher levels of Intention to Use m-Government services.
6.2.2. The impact of Compatibility on Intention to Use
Rogers (2003, p.240) defined Compatibility as ’the degree to which an innovation is
perceived as consistent with the existing values. In the context of m-Government
services and the Mobile Parking Service, Compatibility means that it is compatible with
citizens’ lifestyles, fits in well with the way they like to pay for other services, and is
compatible with their daily routine. The following hypothesis regarding citizens’
perceptions of Compatibility was tested:
H2: Higher levels of perceived compatibility will be positively related to higher levels of
intention to use mobile-Government services
Based on the results received from the PLS quantitative analysis, the Compatibility
construct has a high impact on Intention to Use the Mobile Parking Service which
supports the hypothesis of this research. This is because (H2, T-value= 3.53, p < 0.01)
shows that compatibility is a strong indicator to highly impact on intention to use Mobile
Parking Service. Therefore, a higher level of perceived Compatibility will be positively
related to a higher level of Intention to Use the Mobile Parking Service. It can be
observed that the respondents find it important that the Mobile Parking Service fits in
well with their lifestyle, daily routine, and the way they pay for other services (e.g.
Coins, Ticket machine).
In short, Rogers (2003) argues that any innovation that seems to be incompatible with the
values and norms of a social system will not be adopted as swiftly as an innovation that
is compatible. Consequently, compatibility is considered an important variable in the m-
Government context and it will increase the diffusion of such an innovation. In addition,

131
Tornatzky and Klein (1982) have stated that this variable is one of the most significant in
the context of research on adoption. This is in agreement with Carter and Bélanger
(2005) who argue that Compatibility is a major indicator in predicting citizens’ intention
to use e-Government services.
Moreover, previous studies by Sarel and Marmorstein (2004) found that Compatibility
appears to have a significant impact on willingness/intention to adopt an innovation. This
is also in line with Al-Hadidi (2010), who argues that a positive experiences of using m-
Government services that seems compatible with their lifestyle (Compatibility) would
encourage people to use other electronic services in the future (Intention to Use).
Based on the results above, it can be seen that this is a good indication, because the
majority of the respondents are familiar with technology. Additionally, if any new idea
provides more information to individuals then their Intention to Use such an innovation
will be increased. The respondents generally think that the use of Mobile Parking Service
is compatible with their life style (Mean scores greater than 3), therefore they will be
more willing to use such innovation.
In short, since the majority of the respondents are familiar with technology, the decision
makers who are involved in m-Government projects should consider this issue and
should aim to introduce more m-Government services that are compatible with people’s
lifestyles. This should be done in order to move forwards into the new digital era. These
findings are also consistent with evidence from the literature review. Further, the
respondents believe that Compatibility is an important variable as most of the
respondents have indicated into the higher scale (Mean value= 3.77). It is clear that these
findings of Compatibility support the hypothesis of this research, which is that a higher
level of Compatibility will be positively related to higher levels of Intention to Use m-
Government services.

132
6.2.3. The impact of Perceived Ease of Use on Intention to Use
Davis in 1989 defined Perceived Ease of Use as ’the degree to which a person believes
that using a particular system would be free from effort‘(Davis, 1989, p.320). In the
context of m-Government services, Perceived Ease of Use means that it is clear and
understandable, easy to use, easy to learn, not frustrating, and does not require a lot of
mental effort. The following hypothesis regarding citizens’ perceptions of Perceived
Ease of Use was tested:
H3: Higher levels of perceived ease of use will be positively related to higher levels of
intention to use mobile-Government services
The quantitative analysis results revealed that the relationship of Perceived Ease of Use
and Intention to Use the Mobile Parking Service is insignificant as (H3, T-value=0.19, p
> 0.05). This unusual outcome may support previous research by Gilbert, Balestrini &
Littleboy, (2004) who found that an analysis of Perceived Ease of Use shows an
insignificant path in the adoption of e-Government services. In addition, this is in line
with previous researchers such as Davis (1989), Chua (1996), and Karahanna, and Straub
(1999) who argue that the impact of Perceived Ease of Use was not a strong predictor on
intended system use. Davis (1989) also added, the results recommend that ease of use
may be an antecedent of usefulness rather a direct determinant of usage.
Therefore, the decision makers who are involved in the m-Government projects should
consider this factor when introducing new m-Government services. They should ensure
that the m-Government service is easy and clear and that the instructions are simple in
order to encourage people to adopt the service. In addition, for the service provider, the
system designer should develop such services that are simple and should target all
segments of people (e.g. males/females, educated/non-educated, old/young, and disabled
people). Nevertheless, the respondents believe that Perceived Ease of Use is important as
shown by the results (Mean value= 3.71). It is obvious that these findings do not support
the hypothesis of this research which is that a higher level of Perceived Ease of Use will
be positively related to higher levels of Intention to Use m-Government services.
133
6.2.4. The impact of Trialability on Intention to Use
Rogers (2003, p.258) defines Trialability, as ’the degree to which an innovation may be
experimented with on a limited basis‘. In the context of m-Government services,
Trialability can be described as the opportunity for individuals to try out the Mobile
Parking Service for free before deciding to use it. The advantage of a trial is to dismiss
uncertainty about a new idea (innovation) as well as improve confidence in its use. In
addition, the service provider can experiment with the Mobile Parking Service as
necessary to check its effectiveness. This means that the innovation can be modified to
tailor it more precisely to the needs of the individuals. The following hypothesis
regarding citizens’ perceptions of Trialability was tested:
H4: Higher levels of perceived trialability will be positively related to higher levels of
intention to use mobile-Government services
The quantitative analysis shows that the Trialability variable does not have an impact on
the Intention to Use the Mobile Parking Service since the relationship was insignificant
(H4, T-value=1.24, p > 0.05). However, the respondents in the total sample had an
above-average score towards their Intention to Use Mobile Parking Services as indicated
in the (Mean) value which is greater than 3. This could be explained by the fact that the
respondents believe that trying the new idea for free is important (Mean value= 4.03).
However, it is not necessary for their intention to use it (relationship is insignificant T-
value=1.24, P > 0.05). Therefore, although the quantitative analysis does not show an
impact of Trialability on Intention to Use since the relationship was insignificant, the
respondents do want to be able to try out an innovation before using. In summary, that
these findings do not support the hypothesis of this research which is that a higher level
of Trialability will be positively related to higher levels of Intention to Use m-
Government services.

134
6.2.5. The impact of Observability on Intention to Use
Roger (2003) defined Observability as ’the degree to which the results of an innovation
are visible to others‘(p.16). In the context of m-Government services, Observability
means that individuals have no difficulty in telling others about the results of using the
Mobile Parking Service and no difficulty in explaining why using the Mobile Parking
Service may or may not be beneficial. Furthermore, the instructions for using the Mobile
Parking Service are available and visible in many places. The following hypothesis
regarding citizens’ perceptions of Observability was tested:
H5: Higher levels of perceived observability will be positively related to higher levels of
intention to use mobile-Government services
The quantitative analysis results show that the Observability variable has a high impact
on Intention to Use Mobile Parking Service as (H5, T = 3.03 > 1.96, p < 0.05). The PLS
analysis shows that the relationship between Observability and Intention to Use was
significant. Respondents believed they had no difficulty telling others about the results of
using the Mobile Parking Service and no difficulty explaining why using Mobile Parking
Service may or may not be beneficial. They could communicate the consequences of
using the Mobile Parking Service to others because the instructions on how to use
Mobile Parking Service are available and visible in many places as indicated in the
(Mean value= 3.71).
The outcomes of using the Mobile Parking Service are easy to observe and visible to
individuals. Thus, they will be more likely to adopt it easily and quickly. These findings
are consistent with findings from the literature review. For instance, this is in line with
Rogers’ (2003) statement that the relationship between Observability and Intention to
Use is positive. This also supports the findings of Al-Hadidi (2010, p.233) who argues
’Observability proved to be an important concept, with the majority of respondents
agreeing that their observations of friends and family using these m-services had
encouraged their own usage‘. Therefore, the quantitative analysis results support the
135
hypothesis of this research, which is that a higher level of perceived Observability, will
be positively related to higher levels of Intention to Use m-Government services.
6.2.6. The impact of Perceived Trustworthiness on Intention to Use
Belanger, Janine & Wanda (2002, p.252) define Perceived Trustworthiness as ’the
perception of confidence in the electronic marketer’s reliability and integrity‘. In the
context of m-Government services, Perceived Trustworthiness is when the individuals
are confident that their privacy will be protected when using Mobile Parking Service. In
addition, they are confident that the law protects them from problems that could be
caused when using the Mobile Parking Service. Further, they feel comfortable when
using the Mobile Parking Service and they consider it the best option for paying parking
fees. The following hypothesis regarding citizens’ perceptions of Perceived
Trustworthiness was tested:
H6: Higher levels of trust in the mobile-Government services will be positively related to
higher levels of intention to use
The quantitative analysis results revealed that the Perceived Trustworthiness variable has
an impact on the Intention to Use the Mobile Parking Service (H6, T = 3.43, p < 0.01).
The impact of Perceived Trustworthiness on Mobile Parking Service towards Intention to
Use as perceived by the majority of respondents showed a significant path. In addition,
respondents indicated positive responses to using Mobile Parking Service as the (Mean
value equal to 3.65).
The majority of respondents believed that they could trust the ability of a mobile phone
to protect their privacy when using the Mobile Parking Service. In addition, they
believed they could trust the Mobile Parking Service and that it was the best option for
paying for parking fees. Therefore, it is expected that trust would play an important role
in increasing the adoption of online services (Horst, Kuttschreuter & Gutteling, 2007).
This is an agreement with West (2008, p.7) who argues ’Visible statements outlining

136
how a site insures visitors’ privacy and Perceived Security are valuable assets for
encouraging people to use e-Government services and information‘. Consequently, trust
is a vital factor in gaining trust in m-Government services and will encourage people to
use other m-services. Thus, these findings are also consistent with evidence from the
literature review. Therefore, this indicates a positive impact and it supports the
hypothesis of this research, which is that higher levels of trust in the m-Government
services will be positively related to higher levels of Intention to Use.
6.2.7. The impact of Perceived Security on Intention to Use
Al-Khamayseh et al (2006b), argue that Perceived Security of m-Government services is
considered the hallmark of a successful initiative. In the context of m-Government
services and the Mobile Parking Service, Perceived Security means that individuals
believe that the use of Mobile Parking Service is financially secure and that the mobile
phone has enough safeguards to make them feel confident about its use. The following
hypothesis regarding citizens’ perceptions of Perceived Security was tested:
H7: Higher levels of Perceived Security in the mobile-Government services will be
positively related to higher levels of intention to use.
The PLS results from the quantitative analysis of Perceived Security and its impact on
Intention to Use, show a relatively low insignificant relationship as (H7, T=1.05, p >
0.05). This is an indication that the majority of respondents do not perceive Perceived
Security as a vital factor which would impact on their Intention to Use m-Government
services. The respondents believed that Perceived Security by itself was an important
(Mean is greater than three) but not in the context of their Intention to Use m-
Government services. In summary, these findings indicate insignificant impact and it
does not support the hypothesis of this research, which is that higher levels of Perceived
Security in the mobile-Government services will be positively related to higher levels of
intention to use.
137
6.2.8. The impact of Perceived Enjoyment on Intention to Use
As mentioned in Chapter 3, this study includes another variable that could play an
important role into the Intention to Use m-Government services. This variable is
Perceived Enjoyment, which is the extent to which the activity of using a certain
technology is perceived by individuals as being enjoyable in its own right (Davis,
Bagozzi & Warshaw, 1992). In the context of m-Government services, Perceived
Enjoyment is the characteristic of Mobile Parking Service which means that the use of it
is fun, interesting, and enjoyable. The following hypothesis regarding citizens’
perceptions of Perceived Enjoyment was tested:
H8: Higher levels of perceived enjoyment in the mobile-Government services will be
positively related to higher levels of intention to use
According to the PLS results of the quantitative analysis, the relationship between
Perceived Enjoyment and Intention to Use the Mobile Parking Service was significant
(H8, T = 2.29, p < 0.05). It is observed that respondents consider that the use of Mobile
Parking Service is fun and enjoyable (Mean is greater than three) and therefore this is
likely to increase their Intention to Use it. This is in line with previous studies by Davis,
Bagozzi & Warshaw, (1992); Bruner and Kumar (2005) who argue that Perceived
Enjoyment is a critical factor in driving technology adoption.
These outcomes indicate that creating a fun and enjoyable environment could help in
providing favorable consumer perceptions contributing to the usage of innovative
technologies, especially for personalized services like mobile data services.
Consequently, those people who have experienced enjoyment from using mobile data
services are more likely to develop a positive attitude toward continued usage of these
services. Consequently, this indicates a high impact and therefore supports the
hypothesis of this research that higher levels of Perceived Enjoyment when using m-
Government services will be positively related to higher levels of Intention to Use.

138
6.2.9. The impact of Personal Innovativeness on Intention to Use
Rogers (2003) defines Personal Innovativeness as ’the degree to which an individual or
other unit of adoption is relatively earlier in adopting new ideas than other members of a
social system‘(p.22). In the context of m-Government services, Personal Innovativeness
is the characteristic of individuals who want to be the first to try out and explore new
mobile m-Government services. The following hypothesis regarding citizens’ Perception
of personal innovativeness was tested:
H9: Higher levels of personal innovativeness of individuals will be positively related to
higher levels of intention to use mobile-Government services.
The PLS results derived from the quantitative analysis show a significant relationship
between Personal Innovativeness of individuals and the Intention to Use the Mobile
Parking Service (H9, T = 3.56 , p < 0.01). This is indicates that Personal Innovativeness
has a strong impact on the Intention to Use Mobile Parking Service. It is clear from the
outcomes that the majority of respondents like to explore and try out new mobile m-
Government services.
These findings are consistent with previous studies in the literature. Rogers (2003);
Agarwal and Prasad (1997) argue that some individuals are able to manage high levels of
uncertainty and that some individuals have a propensity for risk-taking propensity while
others do not. Consequently, this strongly confirms the hypothesis of this research which
is that higher levels of Personal Innovativeness of individuals in the m-Government
services will be positively related to higher levels of Intention to Use.
6.3. Key findings of Demographic Variables
This section discusses the influence of demographic variables on the perceived
characteristics of innovation. Again, these perceived characteristics of innovations
include Relative Advantage, Compatibility, Perceived Ease of Use, Trialability,

139
Observability, Perceived Trustworthiness, Perceived Security, Perceived Enjoyment and
Personal Innovativeness. In this study there were 246 respondents with 87 females (35
per cent) and 159 males (65 per cent). The higher percentage of males is because the
survey was distributed in many places without intending to target a specific group and
therefore there was no control over the number of males and females (see Chapter 5).
In the sample there were four age groups. These groups were as follows: 1) 18- 28 years
comprising 61 per cent of the sample; 2) 29- 39 years comprising 31 per cent of the
sample; 3) 40- 50 years comprising 7 per cent of the sample; and 4) 51-61 years
comprising 1 per cent of the sample. For easier analysis and readability, the sample was
categorised into two age groups, younger (18-39) and older (40-61). This categorization
can assist in seeing how the relationships between different variables behave within each
of these age groups.
There were four main levels of education groups. These groups were Primary (3 per
cent), Secondary (34 per cent), Undergraduate (50 per cent) (the highest percentage of
the sample); Postgraduate (11 per cent) and other (2 per cent). Again, for easier analysis
and readability, these groups were categorised further into two groups; Group 1 (Primary
and Secondary) and Group 2 (Undergraduate and Postgraduate). The results and a
discussion of the different variables and their influence on the Intention to Use Mobile
Parking Service in terms of demographics for example, gender, age, and education are
discussed below:
6.3.1. The Influence of Demographic Variables on Relative Advantage
The PLS Analysis results revealed that the relationship between Relative Advantage and
Gender was insignificant. The relationship between Relative Advantage in the female
group was (T = 0.42, P > 0.05) which is relatively low. The relationship between
Relative Advantage in the male group was also very low: (T = 0.32, P > 0.05). In the two
age groups of younger and older the relationship between Relative Advantage and Age
was insignificant with the value of (T = 0.26, P > 0.05 and T = 0.47, P > 0.05)

140
respectively. With the Education variable, a closer analysis revealed that Relative
Advantage had an influence in the Primary and Secondary group, where the relationship
was positively significant with values of (T = 2.15, P < 0.05). However, for the other
group, undergraduate and postgraduate, there was an insignificant path (T = 1.43, P <
0.05) which indicates that Relative Advantage in terms of individuals’ characteristics has
no influence on the Intention to Use Mobile Parking Service.
In summary, the analysis shows that there is no influence of demographic variables on
Relative Advantage except in the Primary and Secondary education group. This could be
explained by the fact that this group is still in its early stage of education and therefore
considered to be less educated. Therefore when they are exposed to an innovation such
as the Mobile Parking Service, they appreciate the benefits of using this service more
than people who are more educated. People who are more educated are exposed to many
innovations in their life and so these innovations become routine and these people do not
appreciate the value of such innovations as much.
6.3.2. The Influence of Demographic Variables on Compatibility
The Compatibility variable shows a highly significant influence on the male group (T =
4.10, p < 0.001). It also indicates a more positive relationship between Compatibility and
males in relation to their Intention to Use Mobile Parking Service than females (T = 0.84,
p > 0.05). For instance, males believe that the use of Mobile Parking Service is
compatible with their lifestyle and fits well with the way they like to pay for other
services whereas females do not see the Mobile Parking Service as compatible with their
life style. This could be explained by the culture in Oman where the two groups perceive
the compatibility of m-Government services differently. Thus, when the government
intends to introduce new m-Government services they should target the two groups
differently and pay particular attention to the female attitude to compatibility.
The Age variable, which includes the younger age group (18-39) and the older age
group (40-61), has a high influence on the Intention to Use the Mobile Parking Service.
141
The former shows a high influence on the Intention to Use Mobile Parking Service (T =
3.28, P < 0.05), and the latter shows an even higher influence (T = 4.34, P < 0.001). This
is could be explained by the fact that the use of Mobile Parking Service is simple and
does not require a mental effort and hence the use of this Mobile Parking Service is
compatible with all age groups. Similarly to the Age variable, the impact of the
Education variable on compatibility is significant. Both groups, Primary and Secondary
and Undergraduate and Postgraduate) have a high influence on Compatibility (T = 2.00,
P < 0.05) and (T =3.32, P < 0.05) respectively. However, the latter shows a higher
influence than the former.
6.3.3. The Influence of Demographic Variables on Perceived Ease of Use
The PLS analysis results revealed that there was an insignificant influence of the
demographic variables, gender, age and education on Perceived Ease of Use. It can be
seen from the analysis that individuals perceive ease of use of Mobile Parking Services
equally regardless of gender, age or education level. This is also could be explained by
the fact that the use of Mobile Parking Service is simple and does not require a mental
effort.
6.3.4. The Influence of Demographic Variables on Trialability
Similarly to Perceived Ease of Use, the PLS analysis results indicate that the influence of
demographic variables on Trialability was insignificant. All groups included in the
demographic variables including younger or older, more or less educated, males or
females have a similar perception of the influence of Trialability on the Intention to Use
Mobile Parking Service. In short, that free trials of Mobile Parking Services would not be
perceived differently by different sections of the community.
142
6.3.5. The Influence of Demographic Variables on Observability
Based on the PLS analysis shows that demographic variables have an influence on
Observability. The overall findings indicate that there is an insignificant relationship
between Observability and females (T = 0.91, P > 0.05) but there is significant influence
with males (T = 2.91, P < 0.05). There is also a significant influence with both age
groups in the Age variable, younger and older. The former shows a high influence on the
Intention to Use the Mobile Parking Service (T = 2.74, P < 0.05), whereas the latter also
shows a high influence but is slightly less than the former (T = 2.30, P < 0.05). With the
Education variable, the analysis revealed that there is only a high influence with one
group, the Undergraduate and Postgraduate (T = 2.92, P < 0.05), whereas the Primary
and Secondary shows an insignificant influence (T = 0.87, P > 0.05).
Thus the respondents perceive differently the Observability of Mobile Parking Services.
Therefore, the decision makers who are involved in the m-Government projects should
consider the Observability dimension when introducing new m-Government services.
6.3.6. The Influence of Demographic Variables on Perceived Trustworthiness
The analysis of the PLS results shows similar findings for Perceived Trustworthiness as
for Observability. The results indicate a significant relationship between Perceived
Trustworthiness and males when using the Mobile Parking Service (T = 2.88, P < 0.05).
In contrast, the results show an insignificant path for females when using Mobile Parking
Service (T = 1.26, P > 0.05). In addition, the findings show both age groups, 18-39 and
40-61 have a significant influence on Perceived Trustworthiness (T = 3.07, P < 0.05) and
(T = 3.43, P < 0.05) respectively. With regard to Education, only one group,
undergraduate and postgraduate, shows a significant influence of Perceived
Trustworthiness when interacting with Mobile Parking Service (T = 2.59, P <0.05).
In summary, the Perceived Trustworthiness for individuals using mobiles and m-
Government services differs according to their gender, age, and education level.

143
Consequently, the government should also consider this issue when intending to
introduce new m-Government services.
6.3.7. The Influence of Demographic Variables on Perceived Security
The quantitative analysis revealed that the Perceived Security variable has an
insignificant influence on both the, female and male, groups in terms of their Intention to
Use the Mobile Parking Service. However, regarding Age, the PLS analysis results
shows older people (40 – 61) have a high influence of Perceived Security when
interacting with Mobile Parking Service (T = 2.71, P < 0.05), whereas younger people
(18 – 39) have an insignificant influence (T = 0.76, P > 0.05). In respect to the Education
variable the detailed PLS analysis shows an insignificant influence on the Perceived
Security variable when using Mobile Parking Service. In brief, the Perceived Security
variable is only of concern to older people (40 – 61) when they interact with Mobile
Parking Service.
6.3.8. The Influence of Demographic Variables on Perceived Enjoyment
Overall, the quantitative analysis results revealed that the Perceived Enjoyment variable
shows an insignificant influence on both females and males. Interestingly, younger
people (18 – 39) show a high influence of perceived enjoyment when interacting with
Mobile Parking Service (T = 2.24, P < 0.05). Regarding education, a closer PLS analysis
shows more educated people (Undergraduate and Postgraduate) enjoy using the Mobile
Parking Service more than the other group (Primary and Secondary) (T = 2.55, P <
0.05and T = 0.31, P > 0.05) respectively.
Briefly, it can be observed from the results that younger, educated people are more likely
to enjoy the Mobile Parking Service than less educated and older people. This could be
explained by the fact that younger people are more outgoing and usually enjoy using
mobile devices for many purposes, for instance, chat, games, maps and listening to music

144
and hence they consider Mobile Parking Service to be one of these enjoyable mobile
services. In contrast, older people use mobile devices for more specific functions such as
making and receiving calls and SMS and thus they consider Mobile Parking Service as
an advanced application and prefer to stick with more routine applications.
6.3.9. The Influence of Demographic Variables on Personal Innovativeness
The quantitative analysis findings revealed that the variable Personal Innovativeness has
a high influence on females (T = 2.78, P < 0.05) and males (T = 2.23, P < 0.05). A closer
analysis shows a higher influence on females than males. With regard to Age, again the
analysis indicates that there is a higher influence on the younger age group (18 – 39) than
older (40 – 61) people. The analysis results revealed the former as (T = 7.04, P < 0.01
and the latter as T = 3.01, P < 0. 05). Once again, a deeper analysis shows an interesting
finding, which is that older people have a greater perception of Personal Innovativeness
than younger people. The PLS results for Education also show a high influence on the
two groups (less educated) in terms of their Intention to use Mobile Parking Service with
a higher influence for more educated people. In summary, Personal Innovativeness was
considered being the most influential variable for older people (40-61) in terms of their
intention to use Mobile Parking Service.
6.4. Key Findings of Interviews
A follow-up study involving six interviews with decision makers was conducted in order
to compare and confirm the results of the quantitative data as some of the hypotheses
were found to be not confirmed in the quantitative study. These non-confirmed
hypotheses were Relative Advantage > Intention to Use, Perceived Ease of Use >
Intention to Use, Trialability > Intention to Use, and Perceived Security > Intention to
Use.
145
6.4.1. The impact of Relative Advantage on Intention to Use
Relative Advantage means that the user gains several benefits such as ease of use, a
saving in time and efficiency in achieving tasks compared to other alternatives of paying
for parking (e.g. Coins, Ticket machine).
Further investigation was sought through the qualitative analysis of the interviews. This
can be explained by the fact that the interviews were done with decision makers from
diverse entities of government (e.g. Muscat Municipality, Ministry of Manpower, Royal
Court Affairs, and Ministry of Higher Education). These decision makers are involved
with different m-Government services such as SMS Exam Grade; which is a push and
pull SMS to request the final grade developed by Ministry of Higher Education, and,
Jawab SMS service developed by Ministry of Manpower which is also a push and pull
SMS service to notify subscribers of completion of transactions, their cost and any other
important information needed (see Table 2.2, List of m-Government services available in
Oman in Chapter Two). This analysis of the interviews with decision makers revealed
that most of the respondents stressed the important impact of Relative Advantage on
Intention to Use mobile government services.
Therefore, the decision makers were asked about the Relative Advantage of using m-
Government services in a wider context than those citizens who completed the
questionnaires using only one example of m-Government services, the Mobile Parking
Service. In addition, there were some issues with this particular application which could
explain the belief of the citizens about the lack of any Relative Advantage of Mobile
Parking Service over traditional payment methods. For instance, people complained
about the response time delay and some of them also complained that the instructions on
how to use the service were not available everywhere.
The quantitative analysis of Relative Advantage and its impact on Intention to Use shows
an insignificant path as the T-statistic is 0.34, which is below the 1.96 threshold. This
means that a higher level of relative advantage will not necessarily be positively related
to a higher level of Intention to Use. However, in the qualitative analysis, Relative

146
Advantage showed a significant impact on the Intention to Use m-Government services.
The qualitative data showed that almost all participants believed that the relationship
between Relative Advantage and Intention to Use and the impact of Relative Advantage
on Intention to Use are vital, as indicated by the following excerpts:
‘Of course using mobile government services through SMS is very beneficial, for
example it saves you time, convenient [Relative advantage], and also you can keep a
record of your SMS unlike using the coins’. (Participant 1)
Participants 2 and 3 stated that they have received several complaints about some m-
services, for instance delays in response time, but they had overcome these issues. These
participants also argued that m-Government services have several advantages that
increase the individuals' intention to use. For example, m-Government services can be
used anytime and anywhere because anyone can afford a mobile phone and have it
available at any time. Further, if SMS is used to buy an e-ticket through a mobile phone,
the ticket will be valid everywhere in Muscat unlike coins which are only valid in the
parking spot. In addition, m-Government services can save time, speeds up the
application process, reduces traffic, and is more efficient than the traditional alternatives
[Relative advantage].
‘It is very effective and interactive tool, you can reach your target directly, send
awareness, and the penetration of the mobile it is very high in Oman comparing to the
penetration of the internet and you can find it everywhere in the world and saves time,
cost, and efficient’ [Relative advantage]. (Participant 4)
‘Yes it will increase their intention to use because I believe the advantage of using
mobile government services; saves time, saves money[Relative advantage], encourage
people to use new services since they are familiar with the existing one’.(Participant 6)
Concisely, that although the PLS results of quantitative analysis show that Relative
Advantage has an insignificant impact of on the Intention to Use Mobile Parking Service,
the qualitative results from the decision makers show a positive significant impact on the

147
Intention to Use m-Government services. This could be explained by the fact that since
the decision makers were from a diverse range of government entities they were involved
in diverse m-Government services, so they were asked about the Relative Advantage of
using mobile government services in general. By contrast, those citizens who completed
the questionnaires were only asked about the Relative Advantage of using the Mobile
Parking Service.
A closer analysis of qualitative results revealed that although there were several
advantages of Mobile Parking Service there were some issues with this particular
application. For instance, people complained about the delay in response time. In
addition, some of them also complained that the instructions on how to use the service
were not available everywhere. Therefore, in relation to the quantitative analysis results,
this could be the reason why the relationship between Relative Advantage and Intention
to Use shows an insignificant impact.
6.4.2. The impact of Perceived Ease of Use on Intention to Use
Perceived Ease of Use means that the Mobile Parking Service is clear, understandable,
easy to use, not frustrating, and does not require a lot of mental effort. In contrast, the
qualitative results show a high impact of Perceived Ease of Use on Intention to Use m-
Government services. These are in line with Rogers (2003) who argues that new ideas
that are easy and simple to use and understand are adopted more swiftly than those that
require the development of new skills and understandings. Tan and Teo (2000) also agree
stating that the more complex, and the greater the skill and effort needed for adopting the
innovation, the less likely it is to be adopted.
These outcomes indicate that an innovation can be perceived by respondents as either
easy or difficult to use. This depends on their demographic characteristics, for instance,
their educational level, experience, age and gender. This is in line with Agarwal and
Prasad (1997) who have argued that Complexity/Perceived ease of use of the innovation
can be perceived differently by individuals.

148
In short, that although the PLS results of quantitative analysis show an insignificant
impact of Perceived Ease of Use on Intention to Use Mobile Parking Service, the
qualitative analysis results from the decision makers show a high significant impact on
Intention to Use m-Government services. The decision makers stressed that since the aim
in introducing m-Government services is to make them easier than the traditional
services, m-Government services are usually simpler to use and the instructions are
clearer and more understandable. However, the interviews with the decision makers
showed that some complaints were received from users about the Mobile Parking Service
particularly about the instructions and about its ease of use. Therefore, this could be the
reason why the relationship of Perceived Ease of Use and Intention to Use shows an
insignificant impact in the analysis of the quantitative results. Another reason might be
that the Mobile Parking Service is simple to use and hence, the respondents did not give
so much attention to Perceived Ease of Use.
The quantitative analysis of Perceived Ease of Use and its impact on Intention to Use,
shows an insignificant effect (T-statistics 0.188 < 1.96). This is an indication that higher
levels of Perceived Ease of Use are not necessarily positively related to higher levels of
Intention to Use. However, in the qualitative study when the participants were asked
about the relationship of Perceived Ease of Use and Intention to Use and whether it will
have an effect on the spread of m-Government services, the results show that Perceived
Ease of Use has a positive impact on Intention to Use.
For example, Participant 1, emphasized the simplicity of using this SMS tool when
compared to the traditional alternatives (e.g. coins) by saying: ‘It is much easier than the
traditional alternatives and the instruction is clear [Perceived Ease of Use] and if we
start closing the coin service then yes we will intend to expand the SMS parking but we
are not planning to close the coin service because it is another gate and some people
they do not have phone to use SMS’
In addition, another participant compared the SMS services with the traditional tools and
the advantages of using SMS in place of traditional alternatives. The participant said:
‘Yes it is easy to be used and the process is easy and understandable [Perceived ease of

149
use] because once you do a mistake, the system will return to you and direct you how to
use the SMS parking in the right direction through a simple instruction unlike the coins’
(Participant 2)
Participants 3, 4 and 6 indicated that they had received several complaints at the
beginning when these services were being launched.
For instance, some people complained that some m-Government services were not easy
to use and that the instructions on how to use them were not clear. However, these
complaints have been resolved and now the instructions on how to use SMS services are
very simple and clear. In addition, these instructions are available everywhere (e.g.
websites, through SMS, in the parking spot, and through vouchers). Because the process
for using SMS services and the instructions are now clear and understandable [Perceived
Ease of Use], this will positively increase the individuals' Intention to Use and will
increase the spread of m-Government services. Consequently, this indicates a positive
relationship between Perceived Ease of Use on the Intention to Use m-Government
services.
In summary, that although the PLS results of the quantitative analysis show an
insignificant impact of Perceived Ease of Use on the Intention to Use Mobile Parking
Service, the qualitative results show a positive significant impact on the Intention to Use
m-Government services. A closer analysis of the qualitative results shows that since the
aim of introducing these m-services was to make them easier than the traditional
services, m-Government services are usually simple to use and the instructions are clear
and understandable [Perceived Ease of Use] when compared to the traditional
alternatives. However, the qualitative analysis showed that there had been some issues
with the Mobile Parking Service. For instance, it was not so simple to use and the
instructions were not clear. Therefore, with regard to the quantitative analysis results,
this could be the reason why the relationship of Perceived Ease of Use and Intention to
Use shows an insignificant impact.

150
6.4.3. The impact of Trialability on Intention to Use
Trialability means that individuals believe that it would be better to try the Mobile
Parking Service out for free first to see what it could do before deciding whether to use
it. It would also be better for the service provider to experiment the Mobile Parking
Service as necessary to check its effectiveness.
The results for the impact of Trialability on Intention to Use from the quantitative study
showed an insignificant path as (T-statistic = 1.24 < 1.96). This is an indication that free
trials are not necessary to increase citizens’ Intention to Use m-Government services.
However, the qualitative analysis results revealed a variety of views among decision
makers. Four of the six participants indicated that Trialability and Intention to Use are
positively related and they believe that free trials will increase the spread of mobile
government services because there are so many benefits. For example, participants 1 and
2 emphasized that free trials will increase the spread of m-Government services simply
because there is no charge. In addition, participant 3 mentioned that free trials are a very
effective marketing tool for new mobile services, as shown in the following statement:
‘We have a very good acceptance level because when we started the service we kept it
for free for 6 month and this is type of marketing will increase their intention to use and
the spread of these services besides free trials will help them because you will get four
benefits including, training them how to use the service, free of cost, and marketing for
the services and making them comfortable using the service.’ (Participant 3)
The impact of Trialability on the use of m-Government services was further emphasized
by Participant 4 who indicated that free trials lead to greater awareness among potential
users and therefore lead to wider spread of the services, as shown by the following:
‘Yes it will increase the spread, and we have done it in the beginning for 2 months so
they get to know it and how to use it and knows the value of it’ (Participant 4)

151
However, the other two participants (Participants 5 and 6) had an interesting opposing
views on the importance of Trialability on citizens' Intention to Use m-Government
services, as indicated by the following excerpts:
‘It doesn't matter because the service provider charges you for SMS and this is very
minimal and normal charges, they are not charging for the service itself.’ (Participant
5), and
‘We didn't use free trials and we are not planning to do so because when you do
something for free people will keep just using the service and sending SMS and probably
will reach 500 SMS per day from just one person, so restriction has to be there because
otherwise they will misuse the services, for instance give someone a free fuel so he or she
will not stay at home he or she will be just driving around and cause traffics on road so
restriction has to be there on all services whether mobile or others’ (Participant 6).
Briefly, the construct Trialability is perceived differently by citizens and the decision
makers.
On the other hand, the results from the qualitative data analysis differ. Some of decision
makers agree that it is important to be able to trial a new idea first while others disagree.
This could be due to the fact that decision makers do not share a common understanding
about Trialability since they have experienced it differently and some have not done it
before. Some of them said that if individuals have the chance to try the innovation prior
to adopting it, they will feel more comfortable about using it and will be more likely to
adopt it quickly. Rogers (2003) stated that if an innovation is Trialable, it will provide
the individual with more confidence and less uncertainty towards their intention to use
such innovation.
In summary, the quantitative and qualitative results show the perception of Trialability
involved in using Mobile Parking Service varies for different individuals. This depends
on their experience of using Mobile Parking Service as well as their demographic
characteristics including gender, education and age. Therefore, these findings about

152
Trialability do not support the hypothesis of this research which is that a higher level of
Trialability will be positively related to higher levels of Intention to Use the Mobile
Parking Service.
6.4.4. The impact of Perceived Security on Intention to Use
Perceived Security means that individuals believe that the use of Mobile Parking Service
is financially secure. They are not worried about Perceived Security when using this
service because they know there are enough safeguards in place.
The analysis of the quantitative study showed an insignificant path (T-statistic is 1.05 <
than 1.96) for the impact of Perceived Security on Intention to Use. This means that
people do not see Perceived Security as a factor that would increase their Intention to
Use the SMS parking service. However, in the qualitative study, the interviews with the
decision makers revealed different views, as the following statements show:
‘Perceived Security wise we do not have an issue but we have technical issue sometimes,
for example when you send an SMS, you won't get confirmation from clients and this will
affect the spread and quality of the service’. (Participant 1); and
‘We do not have a real threat of Perceived Security that somebody will steal your money
or data, that Perceived Security comes when you go online payment using your credit
card and you want to pay 100 R/O, honestly I get scared but here using SMS parking I
do not get scared because the amount is very minimal’(Participant 1)
"Perceived Security is not a factor because people are used to use SMS for example they
vote using SMS on TV programs, and for post-paid it will be clear in their Bill, and for
pre-paid they can easily check the remaining balance that has been deducted".
(Participant 2)
"Perceived Security is not a factor, because people they believe using their mobile is
more secure than using the internet." (Participant 3)

153
Perceived Security is a vital factor in order to gain customer trust because if there is no
Perceived Security or privacy, the service provider will lose credibility and customers
will not use the services. (Participants 4 and 5)
In brief, that similar to Trialability, the construct of Perceived Security is perceived
differently by citizens and the decision makers depending on the application itself. For
instance, the charge for the Mobile Parking Service is minimal so Perceived Security is
not an important factor and hence will not significantly impact the Intention to Use,
whereas with m-payment (sending your credit card details), Perceived Security is a vital
factor and will impact the Intention to Use such services.
On the other hand, the qualitative analysis shows different results for the impact of
Perceived Security on Intention to Use m-Government services. The majority of decision
makers indicated that Perceived Security is a vital factor and it will affect the spread of
m-Government services. This is an agreement with Al-Khamayseh et al (2006b), who
state that the Perceived Security of m-Government services is considered to be the
hallmark of a successful initiative. It can be observed from the results of both
quantitative and qualitative analyses that there are different views about Security. Some
perceive Perceived Security as a driver while others perceive Perceived Security as
inhibitor and not all of these issues are applicable to all governments/organizations.
As a result, from both analyses that the perception of Perceived Security in relation to
using Mobile Parking Service via a mobile channel varies for different individuals,
depending on their experience in using Mobile Parking Service in a particular and m-
Government services in general as well as on their demographic characteristics including
gender, education and age.
6.5. Model Refinement
The findings discussed above have highlighted the most influential independent variables
that impact the dependent variable (Intention to Use). Therefore, a refinement of the
proposed Intention to Use model for m-Government services is necessary.

154
Table 6.1 shows the ranking order of the most influential independent variables/
predictive values on the dependent variable Intention to Use.
Independent variables Dependent
variable
T-value > 1.96 Rank
order
Hypothesis
Supported?
Personal Innovativeness
Intention to
use
3.56 1 Yes
Compatibility Intention to
use
3.53 2 Yes
Perceived Trustworthiness Intention to
use
3.43 3 Yes
Observability Intention to
use
3.03 4 Yes
Perceived Enjoyment Intention to
use
2.23 5 Yes
Trialability Intention to
use
1.24 6 No
Perceived Security Intention to
use
1.05 7 No
Relative Advantage Intention to
use
0.34 8 No
Perceived Ease of Use Intention to
use
0.19 9 No
Table 6.1 Ranking order of the most predictive values
on the Intention to use
ndent variable
It can be seen from the Table 6.1 that Personal Innovativeness is considered to be the
most influential variable on the Intention to Use, whereas, Perceived Ease of Use is the
least significant variable. Figure 6.1 below shows the proposed research model of
Intention to use m-Government services:

155
Influence
Influence
Influence
Intention to use
m-Government
services
Personal
Innovativeness
Compatibility
Perceived
Trustworthiness
Observability
Perceived
Enjoyment
Gender
Age
Education
Gender
Age
Education
Gender
Age
Education
Gender
Age
Education
Age
Education
Influence
Influence
Impact
Impact
Impact
Impact
Impact
Figure 6.1 The proposed model of Intention to Use m-Government services
m
It can be seen from Figure 6.1 above that Personal Innovativeness is considered to be the
most influential predictor on the Intention to Use m-Government services followed by
Compatibility, Perceived Trustworthiness, Observability, and Perceived Enjoyment
respectively. In addition, Figure 6.1 shows that there is no relationship between Gender
and Perceived Enjoyment as the results showed insignificant influence with Perceived
Enjoyment. Therefore, the Gender variable was excluded in the proposed research model
against the Perceived Enjoyment variable. When compared with the original model
illustrated in Chapter 3 (A model of intention to use mobile government services), it is
clear that some variables have not been included in the proposed research model of
intention to use mobile government services since the results shows insignificant impact

156
on Intention to Use. Consequently, the proposed research model of intention to use
mobile government services has been proved to be a successful model in explaining the
factors that affect intention to use mobile government services.
6.6. Summary
This chapter has discussed the key findings relevant to the variables in the original
Diffusion of Innovations Model (DOI) including: relative advantage, compatibility,
perceived ease of use, trialability, observability, perceived trustworthiness, perceived
security, perceived enjoyment, and personal innovativeness, and the influence of
demographic variables (gender, age, and education). Further, this chapter has presented
the key findings of interviews followed by a refined research model of Intention to Use
m-Government services based on the results of this research.
Overall, amongst the nine variables tested against the Intention to Use m-Government
services, only five variables were found to be significant and therefore these five
variables have been incorporated in the proposed Intention to Use model. These variables
are Personal Innovativeness, Compatibility, Perceived Trustworthiness, Observability
and Perceived Enjoyment. Trialability, Perceived Security, Relative Advantage and
Perceived Ease of Use were found to be insignificant predictors and hence these
variables have not been included in the proposed research model. Further, Personal
Innovativeness is considered to be the most influential predictor on the Intention to Use
m-Government services followed by Compatibility, Perceived Trustworthiness,
Observability, and Perceived Enjoyment respectively. The proposed Intention to Use
model of m-Government services which will assist the decision makers who are involved
in the m-Government projects, mobile service providers and any other stakeholders to
introduce new mobile government services smoothly was validated and proved to be a
successful model in explaining an Intention to Use m-Government services.

157
Chapter 7.
Conclusion and Future Research
7.1. Introduction
Chapter 6 discussed the findings of both the quantitative and qualitative studies. In
addition, it presented a new model of intention to use m-Government services. This
chapter provides some concluding remarks and the implications for research and practice
from the findings of the quantitative and qualitative studies. This chapter starts with
Section 7.2, the theoretical and practical implications, followed by the limitations and
future research directions in Section 7.3.
7.2. Implications
As the Omani context has no unique factors in terms of m-Government services, the
model proposed in this research is intended to be useful for many countries considering
delivery of m-Government services in order to explain the factors that influence/impact
the intention to use m-Government services and it will contribute to the existing
knowledge. This is because it incorporates many unexplored dimensions that
influence/impact the intention to use m-Government services. The decision makers who
are involved in m-Government projects need research that can assist the provision of
relevant guidelines for implementation of comprehensive m-Government services. The ‘
model of intention to use m-Government services’ will be of practical usefulness to these
decision makers, because it will enable them to better understand the challenges they
face in the implementation of m-Government services and the implementation of these
services will be more effective. This research developed a validated model consists of the
Diffusion of Innovations (DOI) model and the Technology Acceptance Model (TAM) as
well as external variables including Perceived Security, Perceived Trustworthiness,
158
Perceived Enjoyment and Personal Innovativeness. These variables were then
synthesised into a conceptual model and then the model is tested for its predictive value
to determine for instance, what factors influence/impact the intention to use m-
Government services. The proposed model of intention to use m-Government services
has been validated and has proved successful in explaining the intention to use m-
Government services.
Therefore, this research has many theoretical and practical implications which are
discussed in the following sections. A discussion of theoretical and practical implications
is presented in sub-sections 7.2.1 and 7.2.2 respectively. Finally, an account of the
limitations of the current research and suggestions for future research directions are
discussed in Section 7.3.
7.2.1. Theoretical implications
From a theoretical perspective, this research has many contributions. First, this research
fills an important gap in the literature because it helps in understanding m-Government
from citizens’ perspectives in terms of their needs, such as adoption factors and
challenges as well as a less visible issue influencing the success of m-Government
applications is that the ‘citizens’ needs’ to access public sector services via mobile
technology are being overlooked.
Second, this research adds value by incorporating the DOI, the TAM, and other variables
including Perceived Trustworthiness, Perceived Security, Personal Innovativeness and
Perceived Enjoyment into a single model for the first time in the context of m-
Government services.
Third, this research contributes to theory by examining the applicability of the Diffusion
of Innovations (DOI) model and the Technology Acceptance Model (TAM). In addition,
it examines important variables derived from the literature including Perceived
Trustworthiness, Perceived Security, Perceived Enjoyment and Personal Innovativeness.
Therefore, this research has provided more insights to researchers in the field to

159
determine if the DOI is applicable in explaining the factors that impact on intention to
use m-Government services.
Fourth, this research contributes to knowledge by providing a new understanding of the
variables which influence/impact the dissemination of m-Government services. This is
because this research has tested DOI model, and in particular the Perceived
Characteristics of Innovation (PCI) (e.g. Relative Advantage, Perceived Ease of Use for
TAM, Compatibility, Trialability, and Observability) as well as other important variables
including Perceived Enjoyment, Perceived Security, Personal Innovativeness, and
Perceived Trustworthiness. Therefore, this has determined the most important factors/
predictive values which are Personal Innovativeness, Compatibility, Perceived
Trustworthiness, Observability and Perceived Enjoyment. In addition the least important
factors that will influence/impact on the Intention to Use m-Government services were
highlighted (Trialability, Perceived Security, Relative Advantage and Perceived Ease of
Use). Accordingly, the model was enhanced to reflect these key findings. Moreover, the
most important variables have been ranked to depict the degree of significance of the
variables that influence intention to use m-Government services as shown previously in
Table 6.1. This should provide m-Government adopters with a priority plan that aids
successful development in a logical order.
Fifth, this research assists by analyzing the demographic characteristics of the individual
(e.g. Gender, Age, and Education) and their influence on the DOI Model, the TAM, and
other variables including Perceived Trustworthiness, Perceived Security, Personal
Innovativeness and Perceived Enjoyment. This is because there is a lack of research
about demographic variables as Thompson, (2001), Akman et al, (2005), and
Schrammel, Kottel and Tscheligi (2009) have indicated. The research revealed that some
demographic variables have no relationship with key adoption factors. For instance, no
relationship was found between Gender and Perceived Enjoyment. It also showed that
sometimes the demographic variables may react differently to some adoption factors. For
example, Personal Innovativeness was found to have a greater influence on female as
opposed to male respondents. Similarly, different age groups showed varying
160
relationships to Personal Innovativeness. Consequently, this can assist the decision
makers who are involved in m-Government projects to better understand the factors
affecting their intention use m-Government services.
Sixth, this study helps to define mobile users’ characteristics, which will be of interest to
mobile companies and countries for better and more focused mobile services. This was
discussed in detail in Section 6.3.9, where for example, gender showed a positive
relationship with all m-Government adoption factors investigated in this study except for
perceived enjoyment. In addition, mobile services were found to be more popular with
the younger group (18-39), although the older group (40-61) showed an interestingly
positive attitude in general to mobile services.
Finally and interestingly, although DOI and TAM factors have been tested before in
several domains and have proven to be significant to technology adoption, this study
found that some of the factors are applicable (significant) to intention to use m-
Government services. This was discussed in detail in Section 6.4, where disagreements
between qualitative and quantitative findings were highlighted. Although proper
justifications were provided, further investigation and testing is required.
7.2.2. Practical implications
In practical terms, this research will enable decision makers who are responsible for m-
Government projects as well as mobile service providers to better understand the factors
that can influence the dissemination of the m-Government services they introduce. Most
of the interviewees agreed that better understanding of the m- Government environment
is crucial to the successful implementation of future initiatives. For example, an official
from Muscat Municipality stated there is a lack of proper knowledge about m-
Government services among some of the government decision makers. This knowledge
which is provided in this study is believed to assist them to gain an in-depth
understanding of the applicability of the variables in the DOI model and thereby
implement m- Government services successfully. In addition, the study can assist other
stakeholders in the field of m-Government services to better understand and implement

161
m-Government services in order to realize the benefits of these services and fulfil the
needs of citizens.
This research also offers the decision makers who are responsible for m-Government
projects and mobile service providers with a richer understanding of the citizen’s
demographic characteristics in terms of age, gender, and education level. Therefore,
when implementing m-Government services, they can consider these demographic
characteristics and their individual influence in the model in order to achieve a successful
implementation of m-Government services. Most of the interviewees indicated that
demographic variables have little effect on m-Government adoption. Although this might
seem an appropriate with younger users based on the findings of this study, the study
further elaborates on the effects of each demographic variable on the adoption variables
used in the model. This should enhance decision makers understanding of users
demographic characteristics as far as m-Government adoption is concerned.
In addition, this research provides valuable insights into how to enhance a citizen’s
perceptions of m-Government services introduced by government entities or the mobile
service provider. It also demonstrates the most influential factors/predictive values and
the least influential factors in the Intention to Use m-Government services. For instance,
Personal Innovativeness is found to be the most influential predictor on the Intention to
Use m-Government services followed by Compatibility, Perceived Trustworthiness,
Observability, and Perceived Enjoyment respectively, whereas, Perceived Ease of Use is
the least significant variable. On the other hand, qualitative analysis of the interviewees’
responses highlighted additional m-Government adoption factors which are seen as
insignificant.
Finally, the proposed model provides a framework/roadmap for m-Government services
where future initiatives could be evaluated.

162
7.3. Limitations and future research directions
This research has the following limitations. Firstly, this research uses only one m-
Government service, the Mobile Parking Service since it is the most popular m-
Government service in Oman. However, the proposed model in this research could easily
be tested with other m-Government services. This is because the second data collection
using semi-structured interviews was conducted with decision makers who are involved
in various m-Government projects.
Secondly, the data was gathered from Omani citizens in Muscat and excluded
expatriates. However, the same Intention to Use model developed in this research could
be used for expatriates from any other regions in Oman or from abroad as it is designed
to be useful for many countries considering delivery of m-Government services.
Thirdly, this research was cross-sectional and not longitudinal. Therefore, it is uncertain
whether the intention to use m-Government service was influenced by the individuals’
expectations. This is because the individual’s perceptions change over time when they
gain more experience (Venkatesh et al, 2003). Therefore, in order to evaluate the validity
of the proposed model and the findings, a longitudinal research should be conducted
using the same Intention to Use model developed in this research.
Fourthly, this research focused on government to citizens (G2C) and excluded
government to businesses (G2B) and government-to-government (G2G). However, since
most of government’s initiatives in the mobile sector are currently directed mainly
towards individuals rather than businesses or governments, the focus of this research on
G2C is timely and more beneficial to the governments.
Finally, conflicts between quantitative and qualitative findings were found as described
in Section 6.4. Although the study provided justifications about the conflicts, additional
studies and investigations are required to elaborate on these disagreements.
In summary, the outcomes of this research suggest several directions for future research.
Firstly, future research could test the validity of the proposed Intention to Use model in

163
the private sector where mobile commerce is of concern using m-Commerce services.
Secondly, since this research has focused on the DOI and TAM, future research could
test the applicability of other models in the same context of Oman. Thirdly, since this
research has concentrated on the Mobile Parking Service, future research could
concentrate on other m-Government services using the same proposed Intention to Use
model. Finally, since the data was gathered from one urban city in Oman in a particular
from the capital Muscat, future research need studies in many urban and rural areas on
diverse groups of countries before model is robust.

164
References
AGARWAL, R. & PRASAD, J. 1997. The role of innovation characteristics and
perceived voluntariness in the acceptance of information technologies. Decision
Sciences, 28, 557-582.
AJZEN, I & FISHBEIN, M. 1980, Understanding attitudes and predicting
socialbehaviour, Prentice Hall, viewed 4 August
2004,<http://search.epnet.com/login.aspx?direct=true&db=aph&authdb=epref&a
n=uapsb.ajzen.prenticehall.aihj >. [Accessed 10 December 2009].
AKMAN, I., YAZICI, A., MISHRA, A. & ARIFOGLU, A. 2005. E-Government: a
global view and an empirical evaluation of some attributes of citizens.
Government Information Quarterly, 22, 239-257.
AL-BADI, A. H. & ALSHIHI, H. 2007. Adopting M-Government services in Oman:
Challenges and opportunities. Information Management in the Networked
Economy Issues Solutions [Online].
AL-BUSAIDI, K. & OLFMAN, L. 2005. An investigation of the determinants of
knowledge management systems success in Omani organizations. Journal of
Global Information Technology Management, 8, 6.
AL-HADIDI, A. 2010. An Exploratory Study on Adoption and Diffusion of m-
Government Services in the Sultanate of Oman. PhD, Cardiff University.
AL-HINAI, O. F. 2007. Golbal Information Policy, Teaneck NJ, USA, Fairleigh
Dickinson University.
AL-KHAMAYSEH, S., HUJRAN, O., ALOUDAT, A., LAWRENCE, E.,
ZMIJEWSKA, A., AL-SARAIREH, J., YOUSEF, S., AL-NABHAN, M. &
ANTOVSKI, L. Intelligent m-government: application of personalisation and
location awareness techniques. Proceedings of the EURO mGOV 2006, 2006a.
AL-KHAMAYSEH, S., LAWRENCE, E. & ZMIJEWSKA, A. Towards Understanding
Success Factors in Interactive Mobile Government. In: KUSHCHU, I.,
BORUCKI, C. & FITZPATRICK, G., eds. Information Technology, 2006b
Brighton, UK. Consortium International, 3-5.
AL-QIRIM, N. 2007. The adoption and diffusion of e-commerce in developing
countries: The case of an NGO in Jordan. Information Technology for
Development, 13, 107-131.

165
AL-RAHBI, I. 2008. An Empirical Study of the Key Knowledge Economy Factors for
Sustainable Economic Development in Oman. DBA, Victoria University
AL-RUZAIQI, S. 2003. Identifying Technological and Organizational Determinants for
Developmenting an E-Government Adoption Model: The case of the Sultanate of
Oman civil agencies. PhD, Robert Morris University.
AL-SABBAGH, I. & MOLLA, A. 2004. Adoption and use of internet banking in the
Sultanate of Oman: an exploratory study. Journal of Internet Banking and
Commerce, 9, 1-12.
ALBUSAIDI, H. & ALSHIHI, H. M-Government Initiatives in Oman: Technology
Acceptance and Dissemination. In: KUSHCHU, I., ed. mLife 2009: Exploring
the influence of mobile technologies on life 2009 Barcelona, Spain. mGCI
Mobile Government Consortium International
ALFORD, J. 2002. Defining the Client in the Public Sector: A Social-Exchange
Perspective. Public Administration Review, 62, 337-346.
ALHINAI, Y. 2009. The Adoption of Advanced Mobile Commerce Services by
Individuals: Investigating the Impact of the Interaction between the Consumer
and the Mobile Service Provider. PhD, The University of Melbourne.
ALSHIHI, H. 2006. Critical Factors in the Adoption and Diffusion of E-government
Initiatives in Oman. PhD,Victoria University.
ANCKAR, B. & D'INCAU, D. 2002. Value creation in mobile commerce: findings from
a consumer survey. Information Technology Theory and Application, 4, 43-64.
ANTOVSKI, L. & GUSEV, M. M-payments. 25th International conference Information
technology Interfaces ITI 2003. IEEE, 95-100.
ANTOVSKI, L. & GUSEV, M. M-government framework. EURO mGOV 2005, 2005
Brighton, UK. 36-44.
ARMITAGE, C. J. & CHRISTIAN, J. 2003. From attitudes to behaviour: Basic and
applied research on the theory of planned behaviour. Current Psychology, 22,
187-195.
AZWADI, A. 2010. The Mediating Role of Attitudes in Using Investor Relations
Websites. PhD, Victoria University.
BAGOZZI, RP. 1992, 'The self-regulation of attitudes, intentions, and behaviour', Social
Psychology Quarterly, vol. 55, no. 2, 178-204.
BAGOZZI, R. P. & FORNELL, C. 1982. Theoretical concepts, measurements, and
meaning. A second generation of multivariate analysis, 2, 24-38.

166
BAZELEY, P., & RICHARDS, L. 2000, The NVivo qualitative project book,
Publications. Thousand, Oaks, Sage Publications
BÉLANGER, F. & CARTER, L. 2008. Trust and risk in e-government adoption. The
Journal of Strategic Information Systems, 17, 165-176.
BÉLANGER, F. & HILLER, J. S. 2006. A framework for e-government: privacy
implications. Business Process Management Journal, 12, 48-60.
BÉLANGER, F., HILLER, J. S. & SMITH, W. J. 2002. Trustworthiness in electronic
commerce: the role of privacy, security, and site attributes. Strategic Information
Systems, 11, 245 - 270.
BELL, J. 2005. Doing your research project: a guide for first-time researchers in
education, health and social science, New York, Open University Press.
BENBASAT, I. & BARKI, H. 2007,"Quo vadis, TAM?", Journal of the Association of
Information Systems 8 (4): 211–218, http://iris.nyit.edu/~kkhoo/Spring2008/Topics/TAM/000BenTAMarticle.pdf
BLACK, N. J., LOCKETT, A., WINKLHOFER, H. & ENNEW, C. 2001. The adoption
of Internet financial services: a qualitative study. International Journal of Retail
& Distribution Management, 29, 390-398.
BLAIR, T. 2000. Euro leaders bid for e-commerce boom. BBC News.
BOUWMAN, H., CARLSSON, C., MOLINA-CASTILLO, F. J. & WALDEN, P. 2008.
Barriers and drivers in the adoption of current and future mobile services in
Finland. Telematics and Informatics, 24, 145-160.
BRAAK, J. V. & TEARLE, P. 2007. The computer attributes for learning scale (CALS)
among university students: Scale development and relationship with actual
computer use for learning. Computers in Human Behavior, 23, 2966–2982.
BRUNER, G. C. & KUMAR, A. 2005. Explaining consumer acceptance of handheld
Internet devices. Journal of Business Research, 58, 553-558.
BRYMAN, A. 1998. Quantitative and qualitative research strategies in knowing the
social world. In: MAY., T. & WILLIAMS., M. (eds.) Knowing the Social World.
Open University Press.
BRYMAN, A. 2006. Quantitative and qualitative research strategies in knowing the
social world'. Philosophical Foundations of Social Research Methods, 305.
BRYMAN, A. 2007. Barriers to integrating quantitative and qualitative research. Journal
of Mixed Methods Research, 1, 8.

167
BRYMAN, A. & CRAMER, D. 2005. Quantitative data analysis with SPSS 12 and 13: a
guide for social scientists, New York, Psychology Press.
BWALYA, K. J. & GABORONE, B. 2009. Factors Affecting Adoption of e-
Government in Zambia. EJISDC, 38, 1-13.
CAMPBELL, M. A. 2005. The impact of the mobile phone on young people's social life.
Social Change in the 21st Century Conference. QUT Carseldine, Brisbane.
CARROLL, J. 2005. Risky Business: Will Citizens Accept M-government in the Long
Term? From E-Government to M-Government Brighton, UK: University of
Sussex.
CARROLL, J. ‘What’s in It for Me?’: Taking M-Government to the People. 19th Bled
eConference, eValue 2006 Solvenia Citeseer.
CARTER, L. & BÉLANGER, F. 2005. The utilization of e government services: citizen
trust, innovation and acceptance factors. Information Systems Journal, 15, 5-25.
CAVANA, R. Y., DELAHAYE, B. L. & SEKARAN, U. 2001. Applied business
research: Qualitative and Quantitative Methods, Milton, Queensland, Australia
John Wiley & Sons.
CENTRAL BANK OF OMAN 2010. Annual Report 2010. Ruwi, Oman.
CHANG, A. M. & KANNAN, P. K. 2002. Preparing for wireless and mobile
technologies in government. In: LAWRENCE, P. & LITTMAN, I. (eds.) E-
Government 2002. IBM Endowment for The Business of Government.
CHANG, A. M. & KANNAN, P. K. 2008. Leveraging Web 2.0 in Government. E-
Government/Technology Series. Maryland: IBM Center for The Business of
Government
CHEN, L. D., GILLENSON, M. L., & SHERRELL, D. L. 2002. Enticing online
consumers: An extended technology acceptance perspective. Information &
Management, 39(8), 705-719.
CHEN, W. & WELLMAN, B. 2004. The Global Digital Divide - Within and Between
Countries. IT & Society, 1, 39-45.
CHERRYHOLMES, C. H. 1992. Notes on pragmatism and scientific realism.
Educational Researcher, 21, 13-17.
CHIN, W. C., & TODD, P. A. 1995. On the use, usefulness and ease of use of structural
equation modeling in MIS research: a note of caution. MIS Quarterly, 19(2),
237–246.

168
CHIN, W. 1998. The partial least squares approach for structural equation modeling,
Mahwah, NJ, Lawrence Erlbaum.
CHOUDHURY, V. & KARAHANNA, E. 2008. The relative advantage of electronic
channels: a multidimensional view. MIS Quarterly, 32, 179-200.
CHOUDRIE, J. & DWIVEDI, Y. K. 2005. The demographics of broadband residential
consumers of a British local community: the London borough of Hillingdon.
Journal of Computer Information Systems, 45, 93-101.
CHU, Y. & HUANG, L. 2008. Mobile Technologies Adoption: An Exploratory Case
Study. Tsinghua Science & Technology, 13, 300-305.
CHUA, P. 1996. An Empirical Assessment of a Modified Technology Acceptance
Model. Journal of Management Information Systems, 13, 185-204.
CHURCHILL, G. & IACOBUCCI, D. 2009. Marketing research methodological
foundations, Ohio, USA, South-Western Cengage Learning.
CHUTTUR, M.Y. 2009. Overview of the Technology Acceptance Model: Origins,
Developments and Future Directions, Indiana University, USA, CLARK, P., VICKI,
L., CRESSWELL, J. W., GREEN, D. O. & SHOPE, R. 2008. Mixing
Quantitative and Qualitative Approaches: An introduction to emergent mixed
methods research, New York, Guilford Press.
CONRAD, E. D. 2009. Willingness to use IT innovations: A hybrid approach employing
diffusion of innovations and technology acceptance modelss.PhD, Southern
Illinois University Carbondale
CRESWELL, J. W. 2009. Research design: Qualitative, quantitative, and mixed methods
approaches, USA, Sage Publications.
CRESWELL, J. W. & PLANO CLARK, V. L. 2007. Designing and conducting mixed
mithods research, Thousand, Oaks, Sage Publications.
CRESWELL, J. W., PLANO CLARK, V. L., GUTMANN, M. L. & HANSON, W. E.
2003. Advanced mixed methods research designs, Thousand Oaks, Sage
Publications.
DAVIS, F. D. 1989. Perceived usefulness, perceived ease of use, and user acceptance of
information technology. MIS quarterly, 13, 319-340.
DAVIS, F. D., BAGOZZI, R. P. & WARSHAW, P. R. 1992. Extrinsic and intrinsic
motivation to use computers in the workplace. Applied Social Psychology, 22,
1111-1132.

169
DENZIN, N. K. & LINCOLN, Y. S. 2005. The handbook of qualitative research
Thousand Oakes, Sage Publications.
DESHPANDE, R. 1983. Paradigms Lost: on theory and method in research in marketing.
Journal of Marketing, 47, 101-109.
DEY, I. 1993. Qualitative data analysis: A user-friendly guide for social scientists,
London, Routledge.
DOBBINS, M., CILISKA, D., COCKERIL, R., BARNSLEY, J. & DICENSO, A. 2002.
A framework for the dissemination and utilization of research for health-care
policy and practice. The Online Journal of Knowledge Synthesis for Nursing, 9,
1-12.
DOWNS, G. W. & MOHR, L. B. 1976. Conceptual Issues in the Study of Innovations.
21.
DUNPHY, S. & HERBIG, P. A. 1995. Acceptance of innovations: the customer is the
key. High Technology Management Research 6, 193-209.
EDWARDS, J. R. & BAGOZZI, R. P. 2000. On the nature and direction of relationships
between constructs and measures. Psychological Methods 5, 155-174.
EL-KIKI, T., LAWRENCE, E. & STEELE, R. 2005. A Management Framework for
Mobile Government Services. CollECTeR. Sydney, Australia.
ESCWA 2007. Economic and Social Commission for Western Asia Beirut: United
Nations.
EWAN, M. 2006. Dubai has ambitious targets for m-government system [Online].
Available: http://www.smstextnews.com/2006/09/dubai_leading_m.html
[Accessed 15 December 2009].
FANG, S., XIAOWEN, CHAN, J., SUSY, BRZEZINSKI J & XU, S. 2007. Moderating
Effects of Task Type on Wireless Technology Acceptance. Management
Information Systems, 22, 123–157.
FENN, J. 2010. Hype Cycle for Emerging Technologies, 2010. Gartner
FISHBEIN, M. & AJZEN, L. 1975. Belief, Attitude, Intention, and Behavior: An
Introduction to Theory and Research, Reading, MA, Addison-Wesley.
FORNELL, C. & LARCKER, D. F. 1981. Evaluating Structural Equation Models with
Unobservable Variables and Measurement Error. Journal of Marketing Research,
18, 39-50.
GAHRAN, A. 2010. U.S. government launches 17 mobile applications CNN Tech

170
GALLIVAN, M. J. (2001). Organizational adoption and assimilation of complex
technological innovations: Development and application of a new framework.
Database for Advances in Information Systems, 32(3), 51-81.
GANG, S. Transcending e-Government: a Case of Mobile Government in Beijing. First
European Conference on Mobile Government, 2005 Brighton, UK. 9.
GAO. 2001. Electronic government: challenges must be addressed with effective
leadership and management [Online]. Available: http://feapmo.gov/links.asp
[Accessed 22 September 2009].
GEFEN, D., STRAUB, D. & BOUDREAU, M. C. 2000. Structural equation modeling
and regression: Guidelines for research practice. Communications of the
Association for Information Systems, 4, 7.
GERRARD, P. & CUNNINGHAM, J. B. 2003. The diffusion of Internet banking among
Singapore consumers. International Journal of Bank Marketing, 21, 16-28.
CHANG, S. C., & TUNG, F. C. 2008. An empirical investigation of students’
behavioural intentions to use the online learning course websites. British Journal
of Educational Technology, 39(1), 71-83.
GHYASI, F. 2009. m-Government: Cases of Developing Countries, 2009 Mobile
Government Lab. Available: http://www.mgovlab.org [Accessed 14 March
2010].
GHYASI, F. & KUSHCHU, I. m-Government: Cases of Developing Countries. The 4th
European conference on E-Government, 2004 Castle Dublin, Ireland. 887-898.
GILBERT, D., BALESTRINI, P. & LITTLEBOY, D. 2004. Barriers and benefits in the
adoption of e-government International journal of Public Sector Management,
17, 286-301.
HAIR, J., WC., B., BABIN, B., ANDERSON, R. & TATHAM, R. (eds.) 2006.
Multivariate data analysis, Upper Saddle River, NJ: Pearson Prentice-Hall.
HANCOCK, B. 1998. Trent focus for research and development in primary health care:
An introduction to qualitative research. Trent Focus Group [Online].
HARDGRAVE, B., DAVIS, F., & RIEMENSCHNEIDER, C. 2003. Investigating
Determinants of Software Developers’ ntentions to Follow Methodologies.
Journal of Management Information Systems, 20(1), 123-151.
HARRIS, M. M. & SCHAUBROECK, J. 1990. Confirmatory modeling in organizational
behavior human resource management: Issues and applications. Journal of
Management, 16, 337.

171
HEEKS, R. & LALLANA, C. 2004. mGovernment benefits and challenges.
eGovernment for Development Information Exchange. UK: University of
Manchester's Institute for Development Policy and Management
HONG, S.-J., THONG, J., MOON, J.-Y. & TAM, K.-Y. 2008. Understanding the
behavior of mobile data services consumers. Information Systems Frontiers, 10,
431-445.
HORST, M., KUTTSCHREUTER, M. T. & GUTTELING, J. M. 2007. Perceived
usefulness, personal experiences, risk perception and trust as determinants of
adoption of e-government services in The Netherlands. Computers in Human
Behavior, 23, 1838-1852.
HORTON, R., BUCK, T., WATERSON, P., & CLEGG, C. 2001. Explaining intranet
use with the technology acceptance model. Journal of Information Technology,
16, 237-249.
HOSSAN, G. C., CHOWDHURY, M. & KUSHCHU, I. 2005. Prospects of Using m-
Technologies for Disster Informaoin Management in Bangladesh and other
LDCs. EURO mGOV 2005. Brighton, United Kingdom.
HOYLE, R. 1995. Structural equation modeling, concepts, issues, and
applications,Thousand Oaks, Sage Publications.
HUSSEY, J. & HUSSEY, R. (eds.) 2003. Business Research: A practical guide for
undergraduate and postgraduate students, New York Palgrave Macmillan.
IGBARIA, M., ZINATELLI, N., CRAGG, P., & CAVAYE, A. L. M. 1997. Personal
computing acceptance factors in small firms: A structural equation model. MIS
Quarterly, 21(3), 279-305.
INFORMATION TECHNOLOGY AUTHORITY. 2007. Oman Digital Society Report
[Online]. Available:
http://www.itu.int/wsis/stocktaking/docs/activities/1174296945/Oman_Digital_S
ociety_Report.pdf [Accessed 3rd September 2011].
INFORMATION TECHNOLOGY AUTHORITY. 2008. His Majesty Vision [Online].
Available: http://www.ita.gov.om/ITAPortal/ITA/His_Majesty_Vision.aspx
[Accessed 3rd September 2011].
INFORMATION TECHNOLOGY AUTHORITY. 2010. About ITA [Online]. Muscat
Available: http://www.ita.gov.om/ITAPortal/ITA/About_ITA.aspx [Accessed 28
December 2010].

172
INTERNATIONAL TELECOMMUNICATION UNION. 2010. Global mobile statistics
2011: all quality mobile marketing research, mobile Web stats, subscribers, ad
revenue, usage, trends. mobiThinking [Online]. Available:
http://mobithinking.com/mobile-marketing-tools/latest-mobile-stats [Accessed
1st September 2011].
JARVIS, C. B., MACKENZIE, S. B., PODSAKOFF, P. M., MICK, D. G. &
BEARDEN, W. O. 2003. A Critical Review of Construct Indicators and
Measurement Model Misspecification in Marketing and Consumer Research.
Journal of Consumer Research, 30, 199-218.
JEONG, K. & KIM, H. After the introduction of the government portal services:
Evolution into the m-government initiatives. . Proceedings of the ICA 37th
Conference, 2003 Tallinn Estonia.
KARAHANNA, E. & STRAUB, D. W. 1999. The psychological origins of perceived
usefulness and ease-of-use. Information & Management, 35, 237-250.
KHARE, A., DIXIT, S. & CHAUDHARY, R. 2011. Determinants of Indian customers'
preference for online travel services. International Journal of Leisure and
Tourism Marketing, 2, 24-38.
KIMERY, K. M. & AMIRKHALKHALI, S. National culture and diffusion of electronic
commerce: Preliminary results from Japan and the United States. EABR
(Business) & ETLC (Teaching), 2007 Venice Italy.
KLINE, R. (ed.) 2005. Principles and practice of structural equation modeling, New
York: The Guilford Press.
KOTULIC, A. G. & CLARK, J. G. 2004. Why there aren't more information security
research studies. Information & Management, 41, 597-607.
KPMG. 2009. Welcome to Estonian Investment and Trade Agency! [Online]. Available:
http://www.investinestonia.com/news/120-kpmg-report-shows-estonia-as-cee-
leader-in-mobile-payments [Accessed 1st September 2011].
KULVIWAT, S., II, G. C. B., KUMAR, A., NASCO, S. A. & CLARK, T. 2007. Toward
a Unified Theory of Consumer Acceptance Technology. Psychology &
Marketing, 24, 1059–1084.
KUSHCHU, I. 2007. Mobile government: an emerging direction in e-government,
Canada, IGI Publishing
KUSHCHU, I. & KUSCU, H. From E-government to M-government: Facing the
Inevitable. European Conference on E-Government, 2003 Trinity College,
Dublin. 253-260.
173
LALLANA, E. 2008. eGovernment for Development [Online]. University of
Manchester's Institute for Development Policy and Management Available:
http://www.egov4dev.org/mgovernment/applications/ [Accessed 1st January
2011].
LATOUR, B. 2005. Reassembling the social: an introduction to actor-network-theory,
UK, Oxford University Press.
LAUKKANEN, T. & PASANEN, M. 2008. Mobile banking innovators and early
adopters: How they differ from other online users? . Journal of Financial
Services Marketing, 13, 86-94.
LEE, Y., KOZAR, K.A. & LARSON, V.P. (1980). Perceived Usefulness of Information:
A Psychometric Examination. Decision Sciences, 11, 121-134.
LEGRIS, P., INGHAM, J. & COLERETTE, P. 2003. Why do people use information
technology? A critical review of the technology acceptance model. Information
and Management, 40, 191-204.
LI, X., HESS, T. J. & VALACICH, J. S. 2008. Why do we trust new technology? A
study of initial trust formation with organizational information systems. Journal
of Strategic Information Systems, 17, 39-71.
LICHTENSTEIN, S. & WILLIAMSON, K. 2006. Consumer Adoption of Internet
Banking: Understanding Consumer Adoption of Internet Banking An interpretive
study in the Australian Banking context, Journal of Electronic Commerce
Research, Vol. 7,.2, 50-66
LITWIN, M. S. 1995. How to measure survey reliability and validity, Thousand Oaks,
Sage Publications.
MACCALLUM, R. C. & BROWNE, M. W. 1993. The Use of Causal Indicators in
Covariance Structure Models: Some Practical Issues. Psychological Bulletin, 114,
533-541.
MACGREGOR, R. C. & VRAZALIC, L. 2006. E-Commerce Adoption Barriers in
Small Businesses and the Differential Effects of Gender. Journal of Electronic
Commerce in Organizations, 4, 1-24.
MACKENZIE, S. B., PODSAKOFF, P. M. & JARVIS, C. B. 2005. The Problem of
Measurement Model Misspecification in Behavioral and Organizational Research
and Some Recommended Solutions. Journal of Applied Psychology, 90, 710-730.
MADDEN, O. & SAVAGE, S. J. 2000. Some economic and social aspects of residential
Internet use in Australia. The Journal of Media Economics, 13, 171-185.

174
MALHOTRA, N. K. & BIRKS, D. F. (eds.) 2000. Marketing Research: An Applied
Approach, Harlow, England: Pearson Education.
MARCHIONNI, C. & RITCHIE, J. 2007. Organizational factors that support the
implementation of a nursing Best Practice Guideline. Journal of Nursing
Management, 16, 74-266.
MARUYAMA, G. (ed.) 1997. Basics of structural equation modeling, Thousand Oaks,
Sage Publications.
MASON, S. M. & HACKER, K. L. 2003. Applying communication theory to digital
divide research. IT & Society, 1, 40-55.
MASSEY, A. P., KHATRI, V. AND RAMESH, V. From the web to the wireless web:
technology readiness and usability. 38th Hawaii International Conference on
System Sciences, 2005 Hawaii.
MATTILA, M., KARJALUOTO, H., & PENTO, T. 2003. Internet Banking Adoption
among Mature Customers: Early Majority or Laggards, Journal of Services
Marketing, Vol. 17, No 5 pp. 514-528
MENGISTU, D., ZO, H. & RHO, J. J. M-government: Opportunities and Challenges to
Deliver Mobile Government Services in Developing Countries. Fourth
International Conference on Computer Sciences and Convergence Information
Technology 2009 Seoul IEEE, 1445-1450.
MINISTRY OF NATIONAL ECONOMY-OMAN. 1996. Annual Report 1996 [Online].
Available: http://www.mone.gov.om/publications.aspx?view=21 [Accessed 3rd
September 2011].
MINISTRY OF NATIONAL ECONOMY-OMAN. 2008. The Statistical Year Book
2008 [Online]. Available:
http://www.moneoman.gov.om/book/syb_2008/fscommand/english/index.htm
[Accessed 3rd September 2011].
MINISTRY OF NATIONAL ECONOMY-OMAN. 2010 The Statistical Year Book 2010
[Online]. Available: http://www.mone.gov.om/book/SYB2010/index.htm
[Accessed 3rd September 2011].
MINISTRY OF NATIONAL ECONOMY-OMAN. 2011. Monthly Statistical Bulletin
July 2011 [Online]. Available:
http://www.mone.gov.om/book/mb/jul2011/contents.htm [Accessed 3rd
September 2011].
MITRA, S. & RANA, V. 2001. Children and the Internet: Experiments with minimally
invasive education in India. British Journal of Educational Technology, 32, 221-
232.

175
MOON, M. J. 2004. From e-government to m-government? Emerging Practices in the
use of Mobile Technology by State Governments. E-Government Series Texas,
USA: IBM Endowment for The Business of Government.
MOORE, G. C. & BENBASAT, I. 1991. Development of an instrument to measure the
perceptions of adopting an information technology innovation. Information
systems research, 2, 192-222.
MORGAN, K. 1997. The learning region: institutions, innovation and regional renewal.
Regional Studies, Taylor and Francis Journals, 31, 491-503.
MORSE, J. M. 2000. Determining sample size. Qualitative Health Research, 10, 3.
MUSCAT MUNICIPALITY. 2010. Mobile Parking Services [Online]. Available:
http://www.mm.gov.om/tabid/540/Default.aspx [Accessed 28 December 2010].
MYERS, M. D. 1997. Qualitative research in information systems. MIS quarterly, 21,
241-242.
MYERS, M. D. 2008. Qualitative research in business & management, University of
Auckland, New Zealand, Sage Publications
NEUMAN, W. L. (ed.) 1997. Social research methods: Qualitative and quantitative
approaches, Boston: Allyn and Bacon
NEUMAN, W. L. (ed.) 2000. Social research methods: Qualitative and Quantitative
approaches, Boston Allyn & Bacon.
NEUMAN, W. L. (ed.) 2006. Basics of social research: Qualitative and quantitative
approaches, Boston: Allyn & Bacon.
NEWSTED, P. R., HUFF, S. L. & MUNRO, M. C. 1998. Survey instruments in
information systems. MIS quarterly, 22, 553-554.
NTALIANI, M., COSTOPOULOU, C. & KARETSOS, S. 2008. Mobile government: a
challenge for agriculture. Government Information Quarterly, 25, 699-716.
NUNNALLY, J. C. 1967. Psychometric theory, New York, McGraw-Hill.
NUNNALLY, J. C., & BERNSTEIN, I. H. (ed.) 1994. Psychometric theory, New York:
McGraw-Hill.
NYSVEEN, H., PEDERSEN, P. E. & THORBJØRNSEN, H. 2005a. Explaining
intention to use mobile chat services: moderating effects of gender. Journal of
Consumer Marketing, 22, 247-256.

176
NYSVEEN, H., PEDERSEN, P. E. & THORBJØRNSEN, H. 2005b. Intentions to use
mobile services: antecedents and cross-service comparisons. Journal of the
Academy of Marketing Science, 33, 330-346.
OMAN DIGITAL SOCIETY REPORT 2007. ECONOMIC AND SOCIAL
COMMISSION FOR WESTERN ASIA (ESCWA). National Profile of the
Information Society in the Sultanate of Oman United Nations
OMAN MINISTRY OF NATIONAL ECONOMY. 2010. Monthly Statisitcal Bulletin
[Online]. Available:
http://www.moneoman.gov.om/book/mb/Nov2010/T20_T21.pdf [Accessed 28
Dec 2010].
OMANTEL. 2007. Press Release Media Center [Online]. Available:
http://www.omantel.om/OmanWebLib/MediaCenter/Press%20Release.aspx?Link
ID=5&MenuId=183&NewsID=368 [Accessed 23 March 2010].
ORLIKOWSKI., W. J. & BAROUDI., J. J. 1992. Studying information technology in
organizations: Research approaches and assumptions. Information Systems
Research, 2, 1–28.
OSTBERG, O. A Swedish view on mobile government. In Proceedings of International
Symposium on E- & M-Government 2003 Seoul, Korea,.
PALLANT, J. 2005. SPSS survival manual. Available: http://www.mcgraw-
hill.co.uk/openup/chapters/0335208908.pdf [Accessed 1 Mach 2010].
PALVIA, P. 2009. The role of trust in e-commerce relational exchange: A unified model.
Information & Management, 46, 213.
PEAT, J. K., MELLIS, C. & WILLIAMS, K. (eds.) 2002. Health science research: a
handbook of quantitative methods, London, UK: Sage Publications
PETTER, S., STRAUB, D. & RAI, A. 2007. Specifying Formative Constructs in
Information Systems Research. MIS Quarterly, 31, 623-656.
PHILLIPS, D. C. & BURBULES, N. C. 2000. Postpositivism and educational research.
PLOUFFE, C., J. HULLAND, AND VANDENBOSCH. M 2001. Richness versus
Parsimony in Modeling Technology Adoption Decisions: Understanding
Merchant Adoption of a Smartcard-Based Payment System. Information Systems
Research, 12.
POLATOGLU, V. N. & EKIN, S. 2001. An empirical investigation of the Turkish
consumers’ acceptance of Internet banking services. International Journal of
Bank Marketing, 19, 156-165.

177
PRENSKY, M. 2001. Digital Natives, Digital Immigrants Part 1. NCB University Press,
9, 1-6.
PRESCOTT, M. B. & CONGER, S. A. 1995. Information technology innovations: a
classification by IT locus of impact and research approach. ACM SIGMIS
Database, 26, 20-41.
PUNCH, K. F. 2005. Introduction to social research: Quantitative and qualitative
approaches, CA, Sage Publications
RAIN, R. & MAARJA, S. 2005. Mobile Services in Tartu: Existing services, best
practices, methodology and suggestions for future development. Available:
http://www.tartu.ee/data/Mobile%20services%20in%20Tartu.pdf [Accessed 12
April 2010].
RAIN, R., SIIM, S. & TRIIN, M. 2010. Mobile Government: 2010 and Beyond [Online].
Available:
http://www.mobisolutions.com/files/Mobile%20Government%202010%20and%
20Beyond%20v100.pdf.
RAINER, R. K. & CEGIELSKI, C. G. 2011. Introduction to Information System:
Enabling and Transforming Business. Third Edition. Wiley & Sons. p.255
RANDOLPH, J., TRAPPEY, I., ARCH, G. & WOODSIDE 2005. Consumer Responses
to Interactive Advertising Campaigns Coupling Short-Message-Service Direct
Marketing and TV Commercials. Journal of Advertising Research, 45, 382-401.
RINGLE, C., WENDE, S. & WILL, S. 2005. SmartPLS 2.0 beta. ed. University of
Hamburg.
ROGERS, E. M. (ed.) 1995. Diffusion of innovations, New York, USA: Free Press, A
Division of Simon and Schuster.
ROGERS, E. M. (ed.) 2003. Diffusion of Innovations, New York, USA: Free Press, A
Division of Simon and Schuster.
ROSCOE, J. T. 1975. Fundamental research statistics for the behavioral sciences, New
York, USA, Rinehart and Winston.
ROSSEL, P., FINGER, M. & MISURACA, G. 2006. Mobile e-Government Options:
Between Technology-driven and User-centric. The Electronic Journal of e-
Government, 4, 79–86.
ROSSMAN, G. B. & WILSON, B. L. 1985. Numbers and words: Combining
quantitative and qualitative methods in a single large-scaleevaluation study.
Evaluation Review, 9, 627-643.

178
SALLY, R. & INDRIT, T. 2007. A Conceptual Framework and Propositions for the
Acceptance of Mobile Services. Journal of Theoretical and Applied Electronic
Commerce Research [Online], 2.
SAMER, I. & MOHAMMED, W. 2008. Understanding Factors Influencing Citizens’
Adoption of e-Government Services in the Developing World: Jordan as a Case
Study. Available: http://www.dcc.ufla.br/infocomp/artigos/v7.2/art01.pdf
[Accessed 17 May 2010].
SANDY, G. A. & MCMILLAN, S. A Success Factors Model For M-Government.
EURO mGOV 2005, 2005 Brighton, UK. 349-358.
SAREL, D. AND MARMORSTEIN, H. 2003. Marketing Online Banking Services: The
Voice of the Customer, Journal of Financial Services Marketing, Vol. 8, No. 2,
pp.106–118.
SAREL, D. & MARMORSTEIN, H. 2004. Marketing online banking to the indifferent
consumer: A longitudinal analysis of banks' actions. Journal of Financial
Services Marketing, 8, 231-243.
SAUNDERS, M., LEWIS, P. & THORNHILL, A. (eds.) 2009. Research methods for
business students, Harlow, England: Pearson Education.
SCHAUPP, L. C. & CARTER, L. 2005. E-voting: from apathy to adoption. The Journal
of Enterprise Information Management, 18, 586-601.
SCHINDLER, P. S. & COOPER, D. R. (eds.) 1998. Business Research Methods,
Singapore: McGraw-Hill.
SCHRAMMEL, J., KOTTEL, C. & TSCHELIGI, M. 2009. How Much do You Tell?
Information Disclosure Behaviour in Different Types of Online Communities.
The fourth international conference on Communities and technologies. New
York, USA. : ACM
SEGARS, A. H., & GROVER, V. 1993. Re-examining PEU and usefulness: a
confirmatory factor analysis. MIS Quarterly, 17(4), 517-525.
SEKARAN, U. (ed.) 2002. Research methods of business: a skill-building approach,
West Sussex, United Kingdom John Wiley and Sons.
SIDDIQUI, H. 2008. Investigation of intention to use e-commerce in the Arab countries:
A comparison of self-efficacy, usefulness, culture, gender, and socioeconomic
status in Saudi Arabia and the United Arab Emirates.PhD, Nova Southeastern
University.
179
SIGALA, M., AIREY, D., JONES, P., & LOCKWOOD, A. 2000. The diffusion and
application of multimedia technologies in the tourism and hospitality industries.
Information and Communication Technologies in Tourism 2000, Wien: Springer,
396-407.
SINGAPORE GOVERNMENT. 2008. Go Mobile with Government [Online]. Singapore.
Available: http://www.ecitizen.gov.sg/mobile/index.html [Accessed 22 April
2010].
SMITH, S. & JAMIESON, R. 2006. Determining key factors in e-government
information system security. Information Systems Management, 23, 23-32.
SRITE, M. 2006. Culture as an explanation of technology acceptance difference: an
empirical investigation of Chinese and US users. Australasian Journal of
Information Systems, 14, 5-26.
STRAUSS, A. L., & CORBIN, J. 1998. Basics of qualitative research: Grounded theory
procedures and techniques (2 ed.). Newbury Park, Calif: Sage Publications
STROH, M. 2000. Qualitative interviewing In: BURTON, D. (ed.) Research Training
for Social Scientists: A Handbook for Postgraduate Researchers. Queen Mary,
University of London, UK, Sage Publications.
TAN, M. & TEO, T. S. H. 2000. Factors influencing the adoption of Internet banking.
Journal of the AIS, 1, 5.
TASHAKKORI, A. & TEDDLIE, C. (eds.) 1998. Mixed Methodology: Combining
qualitative and quantitative approaches, Thousand Oaks, CA: Sage Publications.
TEDDLIE, C. & TASHAKKORI, A. 2009. Foundations of mixed methods research:
Integrating quantitative and qualitative approaches in the social and behavioral
sciences, Thousand Oaks, Sage Publications.
TEIJLINGEN VAN, E., RENNIE, A. M., HUNDLEY, V. & GRAHAM, W. 2001. The
importance of conducting and reporting pilot studies: the example of the Scottish
Births Survey Journal of Advanced Nursing 34, 289-295.
TELECOMMUNICATION REGULATORY AUTHORITY. 2009. Annual Report 2009
[Online]. Available:
http://www.tra.gov.om/newsite1/Portal/Upload/Documents/450_TRA_ANNUAL
_REPORT_2009_ENGLISH.pdf [Accessed 3rd September 2011].
TELECOMMUNICATION REGULATORY AUTHORITY. 2011a. About Oman
Telecommunication Regulatory Authority [Online]. Available:
http://www.tra.gov.om/newsite1/Default.aspx?Lang=1 [Accessed 25 Augest
2011].

180
TELECOMMUNICATION REGULATORY AUTHORITY. 2011b. Telecom Market
Indicators Report: Q2, 2011 [Online]. Available:
http://www.tra.gov.om/newsite1/Portal/Upload/Documents/481_2011Q2.pdf
[Accessed 3rd September 2011].
TESCH, R. 1990. Qualitative research: Analysis types and software tools, New York,
Falmer.
THE GLOBAL INFORMATION TECHNOLOGY REPORT 2011. Oman elevated to
41st position in the Networked Readiness Index In: SOUMITRA DUTTA
IRENE MIA (ed.) 10th Anniversary Edition ed.
THOMPSON, R., BARCLAY, D. & HIGGINS, C. 1995. The Partial Least Squares
Approach to Causal Modeling: Personal Computer Adoption and Use as an
Illustration. Technology Studies, 2, 285-309.
THOMPSON, S. H. 2001. Demographic and motivation variables associated with
Internet usage activities. Internet Research: Electronic Networking Applications
and Policy, 11, 125-137.
TICEHURST, G. W. & VEAL, A. J. 2000. Business research methods, Frenchs Forest,
Australia, Longman.
TORNATZKY, L. G. & FLEISCHER, M. 1990. The Process of Technological
Innovation, Lexington, Massachusetts, Lexington Books.
TORNATZKY, L. G. & KLEIN, K. J. 1982. Innovation characteristics and innovation
adoption-implementation: A meta-analysis of findings. IEEE Transactions on
engineering management, 29, 28-45.
TOZSA, I. & BUDAI, B. 2005. M-Government, M-Workflow in Hungarian Research.
Available: Brightontozsa1-1_2005.04.29-09.45.53.doc [Accessed 17-2-2010].
TRAUTH, E. M. 2001. Qualitative research in IS: issues and trends, Hershey,PA, USA
Idea Group Publishing
TRIFONOVA, A. & RONCHETTI, M. 2006. Hoarding content for mobile learning.
International Journal of Mobile Communications, 4, 459-476.
TRIMI, S. & SHENG, H. 2008. Emerging trends in M-government. Communications of
the ACM, 51, 53-58.
TRINKLE, S. 2001. Moving Citizens from in Line to Online: How the Internet is
Changing How Government Serves its Citizens. [Accessed 10 September 2010].

181
UNITED NATIONS. 2008. UN E-Government Survey 2008, From E-Government to
Connected Governance [Online]. United Nations publication. Available:
http://unpan1.un.org/intradoc/groups/public/documents/un/unpan028607.pdf
[Accessed 22 January 2011].
VAN DE VEN, A. H. & ANGLE, H. L. 1989. An Introduction to the Minnesota
Innovation Research Program. In: VAN DE VEN, A. H., ANGLE, H. L. &
POOLE, M. S. (eds.) Research on the Management of Innovation: The Minnesota
Studies. New York: Harper & Row.
VAN DE VEN, A. H. & ROGERS, E. M. 1988. Innovation & organizations: critical
perspectives. Communication Research, 15, 632.
VENKATESH, V. & BALA, H. 2008, "Technology Acceptance Model 3 and a Research
Agenda on Interventions", Decision Sciences 39(2): 273–315
VENKATESH, V. & MORRIS, M. G. 2000. Why don't men ever stop to ask for
directions? Gender, social influence and their role in technology acceptance and
usage behavior. MIS Quarterly, 24, 115-139.
VENKATESH, V., MORRIS, M. G. & ACKERMAN, P. L. 2000. A longitudinal field
investigation of gender differences in individual technology adoption decision-
making processes. Organizational Behavior and Human Decision Processes, 83,
33-60.
VENKATESH, V., & DAVIS, F. 2000. A theoretical extension of the technology
acceptance model: four longitudinal field studies. Management Science, 46 (2),
186-204
VENKATESH, V., MORRIS, M. G., DAVIS, G. B., & DAVIS, F. D. 2003. User
Acceptance of Information Technology: Toward a Unified View. MIS Quarterly,
27(3), 425-479.
WARKENTIN, M., GEFEN, D., PAVLOU, P. A. & ROSE, G. M. 2002. Encouraging
citizen adoption of e-government by building trust. Electronic Markets, 12, 157-
162.
WEI, T. T., MARTHANDAN, G., CHONG, A. Y., OOI, K. & ARUMUGAM, S. 2009.
What drives Malaysian m-commerce adoption? An empirical analysis. Industrial
Management & Data Systems, 109, 370-388.
WEST, D. M. 2008. Improving Technology Utilization in Electronic Government around
the World. In: ARRISUENO, G. L. (ed.) Governance Studies at Brookings
Washington, DC: The Brookings Institution.
182
WORLD BANK. 2004. Knowledge Assessment Methodology and Scorecards [Online].
Available: http://site.ebrary.com/lib/victoriauni/Doc?id=10048618andppg=3
[Accessed 24 Augest 2010].
WU, J. H., & WANG, S. C. 2005. What drives mobile commerce? An empirical
evaluation of the revised technology acceptance model. Information
Management, 42, 719–729.
YIN, R. K. 2009. Case study research: design and methods, CA, USA, Sage
Publications.
YORK, R.O. 1998. Conducting social work research: An experiential approach. Boston:
Allyn & Bacon.
ZHU, K. & KRAEMER, K.L. 2005. 'Post-adoption variations in usage and value of e-
business by organizations: cross-country evidence from the retail industry',
Information Systems Research, Vol. 16 No. 1, pp. 61-84.
ZIAMOU, P. 2002. Commercializing new technologies: consumers' response to a new
interface. Journal of Product Innovation Management, 19(5), 365-374.
ZIKMUND, W. (ed.) 2003. Business Research Methods, Ohio, USA: Thomson
Southwestern.

183
Appendixes

184
Appendix A: Plain Language Statement – Questionnaire
Questionnaire Cover Letter
Please direct all enquiries to:
Hamed Al-busaidi
Tel: +61 (0) 415587417
+968 99447448
Email: [email protected]
Assoc Prof. Geoff Sandy
Tel: +61 3 9919 5309
Email. [email protected]

185
Dear (Sir/Madam)
E-government is the application of Information and Communication Technology (ICT) utilized
by the government agencies aims to enhance the information or services delivery to citizens. It
provides services to citizens through wired network such as internet, and fixed telephones. The
internet nowadays has become the cheapest and most effective channel that being utilized by the
government in order to deliver information and communication services to citizens. However in
order to check a certain type of government service (e.g. exam notification) requires resources
such as computer, telephone, and internet connection, which may not be available to citizens.
Nevertheless, due to the existence of advance technology such as wireless mobile communication
infrastructure, pushing the governments to utilize this technology in order to better deliver its
service to citizens anywhere and anytime with satisfaction. Governments that utilize this
technology will gain many benefits such as cost reduction, greater work efficiency, and
effectiveness, and faster access to public services anytime and anywhere. Hence, Mobile
Government is defined as “a strategy and its implementation involving the utilization of all kinds
of wireless and mobile technology, services, applications and devices for improving benefits to
the parties involved in e-government including citizens, businesses and all government units”.
This survey is part of Doctor of Philosophy, being undertaken by the researcher Hamed Al-
busaidi and supervised by Assoc Prof. Geoff Sandy at Victoria University. It aims to investigate
the factors affecting the intention to of mobile government services. This project will use
Diffusion of innovation (DOI) as a main model to test the applicability of this model in the
context of the adoption of M-government services. This study will assist the decision makers who
are involved in m-Government projects to better understand and implement Mobile government
services in the right direction and according to the citizens needs.
In order to achieve the desired goals, you have been purposefully selected to kindly assist us in
providing valuable information in order to understand specific factors that affect the adoption and
diffusion of Mobile-government services. Based on that, we would like to invite you to be part of
this study, which will assist the researcher to identify factors affecting the intention to use of
Mobile-government services. Based on understandings gained from this research, the decision
makers who are involved in m-Government projects will better understand the challenges it will
face in the implementation of M-government services - and implementation of these services will
be more effective and according to your needs.
I assure you that all responses will be confidential. Return of the survey form will constitute your
voluntary consent to participate in the study.
Thank you in anticipation of your involvement
Yours sincerely,
Hamed Al-busaidi

186
Appendix B: Questionnaire Instrument
Please direct all enquiries to:
:الر جاء توجيه جميع الاستفسارات إلى
Hamed Al-busaidi
Tel: +61 (0) 415587417
+968 99447448
Email: [email protected]
Assoc Prof. Geoff Sandy
Tel: +61 3 9919 5309
Email. [email protected]
Please return the completed questionnaire in the reply paid envelope.
المغلفّ المعد لذلك، والمدفع الثمن مسبقا يالرجاء إرسال الاستبيان المنجز ف This Questionnaire should only take 10 minutes to complete
لا يتطلب إنجاز الاستبيان أكثر من عشر دقائق
A PhD study of
بخصوص الدكتوراه دراسة
A Model of Intention to use Mobile Government Services
استخدام وانتشار خدمات الحكومة الإلكترونية عن طريق الهاتف المتنقل نموذج

187
Please mark your response from Question 1 to 5 by ticking only one answer for each question as shown:
وذلك بوضع علامة 5إلى 1واحد من بين الخيارات قرينة كل سؤال من الأسئلة من الرجاء اختيار خيار
1. Please indicate your gender
الرجاء تحديد الجنس. 1
Male
ذكر
Female
أنثى
3. Please indicate your age
range
الرجاء تحديد العمر. 3
18-28
29-39 x
40-50
51-61
62+
2. Please indicate your highest
completed level of education
الرجاء تحديد المستوى التعليمي. 2
Primary
إعدادي
Secondary
ثانوي
Undergraduate
degree
جامعي
Post-graduate
degree
دراسات عليا
Other (Please specify)
(الرجاء التحديد)أخرى
______________________
4. Are you an Omani
Citizen?
هل أنت عماني؟. 4
Yes نعم
No لا (Please specify
your
Citizenship الرجاء تحديد
____________(الجنسية
PART A: Background Information
المعلومات العامة: القسم الاول

188
Please mark more than one answer if required for question 6 and question 7 as shown :
ب في السؤال السادس و السابع بوضع علامة الرجاء اختيار أكثر من خيار واحد إن تطل
Mobile Parking Service: is a new value-added service that enables vehicle drivers to reserve parking spaces and pay their parking
fees via their mobile phones. A fee for this service starts at 60 Bz for 30 minutes. The service operates as follows: 1) SMS to 90091
your vehicle registration number, vehicle code, and time (e.g. 65 RS 60). 2) A confirmation message will be received.
هي خدمة مبتكرة جديدة تمكن سائقي المركبات من استخدام المواقف العامة ودفع رسوم حجز الموقف عن طريق الهاتف : الرسائل القصيرةعن طريق المواقف حجز خدمة
تحتوي على رقم ورمز لوحة السيارة 06601لرقم إرسال رسالة قصيرة إلى ا. 1: وتستخدم الخدمة كالتالي. دقيقة 36بيسة لمدة 06رسوم استخدام الخدمة تبدأ من . المتنقل
استقبال رسالة تأكيد . 2( 06رس 06مثلا )بإلاضافة إلى المدة المطلوبة
6. If you are not
a user of SMS
parking service,
which one of the
following
information
sources is the
most effective to
convince you to
adopt the
service?
إذا لم تكن من . 7
مستخدمي خدمة
عن المواقف حجز
الرسائل طريق
القصيرة فأي من
الوسائل التالية قد
تكون أكثر إقناعا
لك لتبدأ في
استخدام هذه
.الخدمة
TV
Newspaper
Radio
Family
Friends
Other (Please
specify)______________
5. Are you currently a user
of SMS parking service?
ي هل أنت حالياً من مستخدم. 6
عن طريقالمواقف حجز خدمة الرسائل القصيرة؟
Yes نعم
No لا
7. If you are a
user of SMS
parking service,
how did you
learn about it?
إذا كنت من . 7
مستخدمي خدمة
عن واقف مالحجز
الرسائل طريق
القصيرة فأي من
الوسائل التالية
كانت أكثر إقناعا
ك لتبدأ في ل
استخدم هذه
.الخدمة
TV
Newspaper
Radio
Family
Friends
Other (Please
specify)_______________

189
Mobile Government is defined as the “provision of government applications via wireless technologies, anywhere,
anytime, employing a diversity of mobile devices”.
عن طريق التكنولوجيا اللاسلكية، في أي مكان، في أي وقت، باستخدام مجموعه متنوعة من الحكومية كترونية المتنقلة بتوفير الخدمات لتعرف الحكومة الأ
.الأجهزة النقالة
Please indicate your response from question1 to 38 by circling only one number of the scale
.وذلك بوضع دائرة حول الرقم المناسب أمام كل عبارة 38إلى 1الرجاء تحديد مدى التوافق مع النقاط المطروحة من
Please rate your Willingness and Enjoyment of trying Mobile Parking and new Mobile-government services
عن طريق الرسائل القصيرة الخدمات الجديدة للحكومات الإلكترونية خدمة حجز المواقف ومتعة تجربة وقابلية معدل الرجاء تحديد
1. I believe using SMS parking service is fun
ممتعة عن طريق الرسائل القصيرةالمواقف حجز أعتقد بأن استخدام خدمة.1
بض
رعا
أة شد
Str
on
gly
dis
agre
e
1 2 3 4 5
دةش بق
افأو
Str
on
gly
ag
ree
2. I believe using SMS parking service is useful
أعتقد بأن أستخدام خدمة حجز المواقف عن طريق الرسائل القصيرة مفيدة. 2
1 2 3 4 5
3. I believe using SMS parking service is a wise decision
قرار صائبخدمة حجز المواقف عن طريق الرسائل القصيرة أعتقد بأن استخدام . 3
1 2 3 4 5
4. I like to explore new Mobile-Government services
ديدة للحكومة الإلكترونية باستخدام الهاتف المتنقلج خدماتعلى أكتشاف أرغب . 4
1 2 3 4 5
6. Among my peers, I am usually the first to try out new Mobile-
government services
في الغالب أكون أول من يجرب استخدام الخدمات الجديدة للحكومة ( أقراني)من بين أصحابي . 6
ام الهاتف المتنقلالإلكترونية باستخد
1 2 3 4 5
0. In general, I am interested in trying out new Mobile-government services
بشكل عام أنا مهتم بتجربة الخدمات الجديدة للحكومة الإلكترونية باستخدام الهاتف المتنقل. 01 2 3 4 5
Please rate your level of trust and security to use SMS parking service
عن طريق الرسائل القصير الناحية الأمنية منالمواقف حجز بخدمة الرجاء تحديد معدل مدى ثقتك
7. I believe using SMS parking service is financially secure
آمنه قصيرةخدمة حجز المواقف عن طريق الرسائل الأعتقد بأن استخدام عملية الدفع المالي في . 7 1 2 3 4 5
PART B:
:القسم الثاني
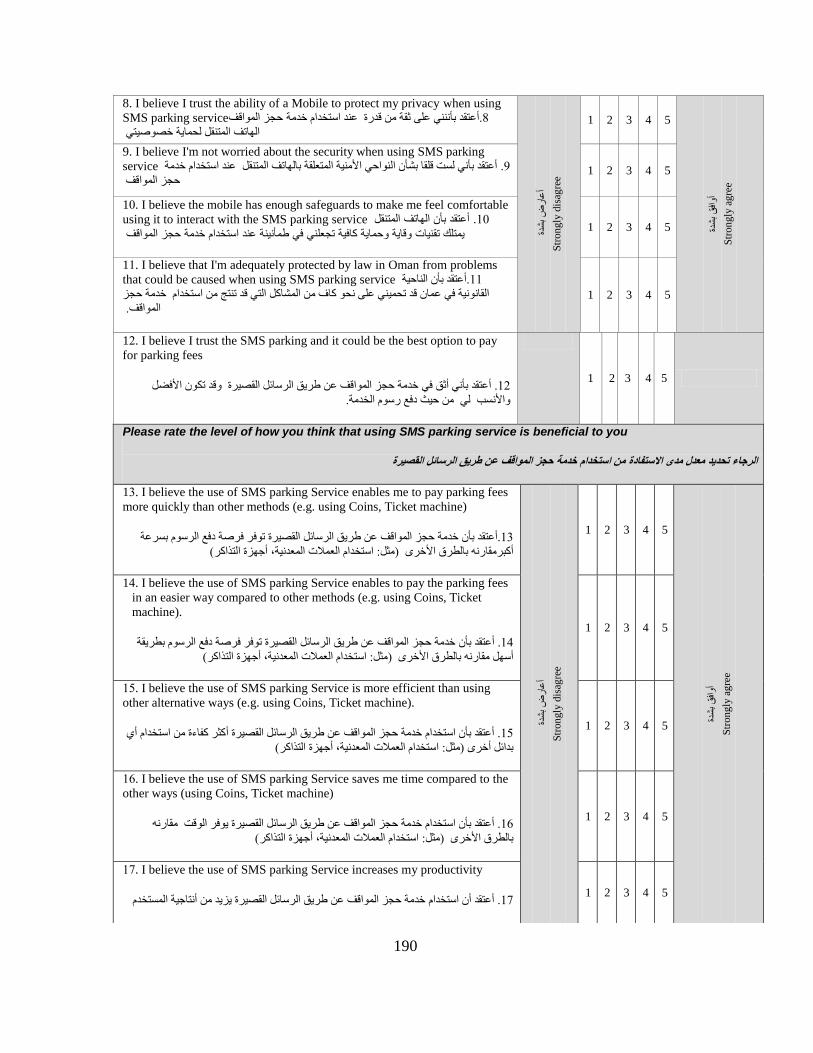
190
8. I believe I trust the ability of a Mobile to protect my privacy when using
SMS parking service المواقف حجز عند استخدام خدمة أعتقد بأننني على ثقة من قدرة .8
اية خصوصيتي الهاتف المتنقل لحم
ة شد
بض
رعا
أ
Str
on
gly
dis
agre
e
1 2 3 4 5
دةش بق
افأو
Str
on
gly
ag
ree
9. I believe I'm not worried about the security when using SMS parking
service 0 .أعتقد بأني لست قلقا بشأن النواحي الأمنية المتعلقة بالهاتف المتنقل عند استخدام خدمة المواقف حجز
1 2 3 4 5
16. I believe the mobile has enough safeguards to make me feel comfortable
using it to interact with the SMS parking service 16 . أعتقد بأن الهاتف المتنقل
يمتلك تقنيات وقاية وحماية كافية تجعلني في طمأنينة عند استخدام خدمة حجز المواقف 1 2 3 4 5
11. I believe that I'm adequately protected by law in Oman from problems
that could be caused when using SMS parking service 11. أعتقد بأن الناحية
القانونية في عمان قد تحميني على نحو كاف من المشاكل التي قد تنتج من استخدام خدمة حجز
. المواقف
1 2 3 4 5
12. I believe I trust the SMS parking and it could be the best option to pay
for parking fees
وقد تكون الأفضل خدمة حجز المواقف عن طريق الرسائل القصيرةأعتقد بأني أثق في . 12
.من حيث دفع رسوم الخدمة والأنسب لي
1 2 3 4 5
Please rate the level of how you think that using SMS parking service is beneficial to you
خدمة حجز المواقف عن طريق الرسائل القصيرةالرجاء تحديد معدل مدى الاستفادة من استخدام
13. I believe the use of SMS parking Service enables me to pay parking fees
more quickly than other methods (e.g. using Coins, Ticket machine)
فرصة دفع الرسوم بسرعة توفر خدمة حجز المواقف عن طريق الرسائل القصيرةأعتقد بأن .13
(استخدام العملات المعدنية، أجهزة التذاكر: مثل)أكبرمقارنه بالطرق الأخرى ة شد
بض
رعا
أ
Str
on
gly
dis
agre
e
1 2 3 4 5
دةش بق
افأو
Str
on
gly
ag
ree
14. I believe the use of SMS parking Service enables to pay the parking fees
in an easier way compared to other methods (e.g. using Coins, Ticket
machine).
توفر فرصة دفع الرسوم بطريقة خدمة حجز المواقف عن طريق الرسائل القصيرةأعتقد بأن .14
(التذاكراستخدام العملات المعدنية، أجهزة : مثل)أسهل مقارنه بالطرق الأخرى
1 2 3 4 5
16. I believe the use of SMS parking Service is more efficient than using
other alternative ways (e.g. using Coins, Ticket machine).
أكثر كفاءة من استخدام أي خدمة حجز المواقف عن طريق الرسائل القصيرةأعتقد بأن استخدام . 16
(استخدام العملات المعدنية، أجهزة التذاكر: ثلم)بدائل أخرى
1 2 3 4 5
10. I believe the use of SMS parking Service saves me time compared to the
other ways (using Coins, Ticket machine)
يوفر الوقت مقارنه خدمة حجز المواقف عن طريق الرسائل القصيرةأعتقد بأن استخدام . 10
(استخدام العملات المعدنية، أجهزة التذاكر: مثل)بالطرق الأخرى
1 2 3 4 5
17. I believe the use of SMS parking Service increases my productivity
أنتاجية المستخدميزيد من خدمة حجز المواقف عن طريق الرسائل القصيرةأعتقد أن استخدام . 171 2 3 4 5

191
Please rate the level of how do you think that using SMS parking service fits well with the way you like to do things in your daily life
.الطريقة التي تود بها إنجاز أعمالك اليومية عم خدمة حجز المواقف عن طريق الرسائل القصيرةالرجاء تحديد معدل مدى تناسب
18. I believe the use of SMS parking Service is compatible with my lifestyle.
تتوافق مع أسلوب خدمة حجز المواقف عن طريق الرسائل القصيرةأعتقد بأن طريقة استخدام . 18
حياتي
ة شد
بض
رعا
أ
Str
on
gly
dis
agre
ed
1 2 3 4 5
دةش بق
افأو
Str
on
gly
ag
ree
10. I believe the use of SMS parking fits well with the way I like to pay for
other services 10 . عن طريق الرسائل المواقف حجزأعتقد بأن الطريقة المستخدمة في خدمة
لدفع الرسوم تتوافق مع ما أتطلع إليه عند الدفع للخدمات الأخرى القصيرة
1 2 3 4 5
26. I believe the use of SMS parking Service is completely compatible with
how I like to do things عن طريق أعتقد بأن طريقة استخدام خدمة حجز المواقف . 26
مع طريقتي المفضلة لعمل الأشياءتماما تتوافق الرسائل القصيرة
1 2 3 4 5
21. I believe the use of SMS parking would fit well with the way I like to
pay for parking fees يتوافق مع الطريقة الرسائل القصيرة لدفع الرسومأعتقد بأن استخدام . 21
التي أرغب بها عند استخدام خدمة حجز المواقف
1 2 3 4 5
Please rate the level of how easy do you think the use of SMS parking service
خدمة حجز المواقف عن طريق الرسائل القصيرةولة استخدام الرجاء تحديد معدل مدى سه
22. I believe the use of SMS parking service is clear and understandable
واضحة ومفهومه أعتقد بأن طريقة استخدام خدمة حجز المواقف عن طريق الرسائل القصيرة. 22
ة شد
بض
رعا
أ
Str
on
gly
dis
agre
ed
1 2 3 4 5
أودة
ش بق
اف
Str
on
gly
ag
ree
23. I believe the use of SMS parking service is easy
هخدمة حجز المواقف عن طريق الرسائل القصيرة سهلأعتقد أن استخدام . 23 1 2 3 4 5
24. I believe learning to use SMS parking service is easy for me
ز المواقف عن طريق الرسائل القصيرة سهل بالنسبة لي أعتقد بأن تعلم أستخدام خدمة حج.241 2 3 4 5
26. I believe the use of SMS parking service does not require a lot of mental
effort 26. لا تتطلب مجهود عن طريق الرسائل القصيرة خدمة حجز المواقف استخدام أعتقد بأن
ذهني1 2 3 4 5
20. I believe the use of SMS parking service is not frustrating 20 . أعتقد بأنليست معقدة خدمة حجز المواقف عن طريق الرسائل القصيرةاستخدام 1 2 3 4 5
Please rate the importance of trying out SMS parking service prior to adopting it
التطبيق لقب مة حجز المواقف عن طريق الرسائل القصيرةخدالرجاء تحديد معدل أهمية تجربة
27. I believe before deciding whether to use the SMS parking service, it will
be better to try it out by the user for free خدمة أعتقد بأن لتحديد أمكانية استخدام . 27
لأفضل تجربتها مجانا أولا من فبل المستخدمين قبل من ا حجز المواقف عن طريق الرسائل القصيرة
وضعها قيد التنفيذ
t
ry it out
ة شد
بض
رعا
أ
Str
on
gly
dis
agre
e
1 2 3 4 5
دةش بق
افأو
Str
on
gly
ag
ree
28. I believe it is better to use SMS parking service on a trial basis for long
enough time to see what it could do 28 . خدمة حجز أعتقد بأنه من الأفضل وضع
في فترة تجربة للمستخدمين لمدة مناسبة للاطلاع على فعاليتها المواقف عن طريق الرسائل القصيرة
1 2 3 4 5

192
Thank you very much for your time and assistance in completing this
questionnaire
لوقتكم ومساعدتكم لتكملة هذا الاستبيان شاكر لكم جزيل الشكر
20. I believe I would not have to spend a lot of effort to try SMS parking
service 20 . لن تستهلك الكثير حجز المواقف عن طريق الرسائل القصيرة خدمةأعتقد بأن تجربة
مني الجهدمن 1 2 3 4 5
36. I believe it would be better for the service provider to experiment the
SMS parking service as necessary to check its effectiveness 36 . أعتقد بأنه منخدمة حجز المواقف عن طريق الرسائل ة الخدمة بإجراء تجربة على الأفضل من الجهة الموفر
كل ما أستدعى الأمر للتأكد من فعاليتها القصيرة
1 2 3 4 5
Please rate the level of result demonstrability of SMS parking service to the public
ةللعام قف عن طريق الرسائل القصيرةخدمة حجز الموااستخدام معدل مدىشيوع الرجاء تحديد
31. I believe I would have no difficulty telling others about the results of
using SMS parking service خدمة حجز فوائدأعتقد بأنه لا توجد صعوبة في نشر . 31
للأخرين عن طريق الرسائل القصيرةالمواقف
ة شد
بض
رعا
أ
Str
on
gly
dis
agre
e
1 2 3 4 5
دةش بق
افأو
Str
on
gly
ag
ree
32. I believe I could communicate to others the consequences of using SMS
parking service خدمة حجز استخدام عواقبأعتقد بأنه يمكنني إطلاع الآخرين على . 32
المواقف عن طريق الرسائل القصيرة1 2 3 4 5
33. I believe I would have no difficulty explaining why using SMS parking
service may or may not be beneficial 33. في شرح فوائد أو أعتقد بأنه لا توجد صعوبة
خدمة حجز المواقف عن طريق الرسائل القصيرةمضار استخدام 1 2 3 4 5
34. I believe the instructions of how to use SMS parking service is available
and visible in many places أعتقد بأن التعليمات على كيفية أستخدام خدمة حجز المواقف . 34في أماكن عدةمتوفره وواضحه
1 2 3 4 5

193
Appendix C: Date Analysis for Questionnaire
Bootstrapping Results

194
Index Values for Latent Variables
LV Index Values
Compat 3.773856
Ease 3.975703
Enjoy 3.848645
Innov 3.782006
Inten_Use 3.915405
Observ 3.718286
RA 4.006401
Sec 3.543468
Trial 4.032362
Trust 3.658586

195
Cross Loadings
Compat Ease Enjoy Innov
Comp_a 0.841666 0.544495 0.526729 0.495533
Comp_b 0.859915 0.540447 0.548492 0.539237
Comp_c 0.839015 0.557032 0.394882 0.455264
Comp_d 0.843900 0.563658 0.551332 0.451982
Complex_a 0.577253 0.822881 0.471163 0.466553
Complex_b 0.572853 0.868473 0.529190 0.469741
Complex_c 0.543291 0.834143 0.505147 0.447074
Complex_d 0.515876 0.821804 0.484362 0.471474
Complex_e 0.521713 0.845594 0.504866 0.433022
Inten_a 0.580059 0.476738 0.481378 0.431104
Inten_b 0.594939 0.515348 0.480190 0.487833
Inten_c 0.496263 0.470187 0.494006 0.457010
Inten_d 0.518212 0.507269 0.565033 0.642208
Observ_a 0.523260 0.629242 0.500816 0.488866
Observ_b 0.379559 0.378825 0.345930 0.380454
Observ_c 0.372949 0.452604 0.349885 0.340389
Observ_d 0.277606 0.427419 0.232672 0.154789
RA_a 0.557350 0.532815 0.539888 0.459746
RA_b 0.561082 0.571521 0.562166 0.441419
RA_c 0.612820 0.511694 0.473526 0.465617
RA_d 0.621524 0.553955 0.466767 0.377685
Trial_a 0.195236 0.276922 0.228200 0.324920
Trial_b 0.263202 0.326416 0.284965 0.379062
Trial_c 0.502873 0.590720 0.451405 0.413258
Trial_d 0.453258 0.528287 0.464527 0.481036
enjoy_a 0.567114 0.504545 0.852814 0.525349

196
enjoy_b 0.494020 0.503846 0.851378 0.533775
enjoy_c 0.440714 0.486323 0.808402 0.483790
innovat_a 0.354138 0.434630 0.523754 0.785827
innovat_b 0.327522 0.168270 0.204470 0.500012
innovat_c 0.560612 0.501607 0.523931 0.840733
secur_a 0.458175 0.426017 0.432350 0.402691
secur_b 0.457656 0.468384 0.400243 0.404850
secur_c 0.553105 0.473545 0.392443 0.454639
trust_a 0.498071 0.473102 0.422151 0.412014
trust_b 0.443399 0.461103 0.356742 0.350311
trust_c 0.569872 0.540816 0.487945 0.450961
Inten_Use Observ RA Sec
Comp_a 0.602453 0.495220 0.607554 0.479508
Comp_b 0.607079 0.469577 0.617935 0.515579
Comp_c 0.544649 0.428201 0.560826 0.475100
Comp_d 0.581673 0.500573 0.584641 0.523908
Complex_a 0.532870 0.608518 0.517423 0.468100
Complex_b 0.522571 0.553195 0.549787 0.446819
Complex_c 0.478496 0.521814 0.527333 0.441018
Complex_d 0.529707 0.553525 0.541672 0.438031
Complex_e 0.543003 0.559981 0.569627 0.497556
Inten_a 0.762005 0.478583 0.440277 0.429362
Inten_b 0.816304 0.559651 0.502106 0.472415
Inten_c 0.804846 0.440907 0.476189 0.444196
Inten_d 0.784157 0.510629 0.552621 0.422020
Observ_a 0.578614 0.790501 0.569561 0.387107
Observ_b 0.404275 0.708571 0.348974 0.355409
Observ_c 0.466382 0.783214 0.342608 0.333209
Observ_d 0.286949 0.542269 0.170524 0.292613
RA_a 0.516907 0.427907 0.861818 0.498502

197
RA_b 0.507440 0.435101 0.875838 0.422704
RA_c 0.540810 0.418712 0.815366 0.499502
RA_d 0.531202 0.522364 0.807509 0.410661
Trial_a 0.287098 0.396598 0.262834 0.177998
Trial_b 0.332614 0.439988 0.335937 0.173848
Trial_c 0.497453 0.520655 0.565766 0.333695
Trial_d 0.516671 0.511292 0.522887 0.348221
enjoy_a 0.584401 0.430772 0.553380 0.402102
enjoy_b 0.505781 0.404532 0.486964 0.435862
enjoy_c 0.512415 0.477080 0.482267 0.385748
innovat_a 0.518600 0.370783 0.477338 0.357572
innovat_b 0.288842 0.224626 0.155005 0.317228
innovat_c 0.540051 0.468534 0.417474 0.433589
secur_a 0.424630 0.366980 0.448738 0.777736
secur_b 0.445612 0.395506 0.449371 0.857102
secur_c 0.520213 0.433015 0.468834 0.865002
trust_a 0.436099 0.409216 0.473126 0.742123
trust_b 0.510666 0.431775 0.455491 0.560445
trust_c 0.633958 0.439189 0.584521 0.678264

198
Average Variance Extracted
AVE
Compat 0.715992
Ease 0.703513
Enjoy 0.701884
Innov 0.524789
Inten_Use 0.627421
Observ 0.508611
RA 0.706679
Sec 0.695908
Trial 0.628230
Trust 0.689781

199
Total Effects (Mean, STDEV, T-Values)
Original
Sample (O)
Sample
Mean (M)
Standard
Deviation
(STDEV)
Standard Error
(STERR)
Compat ->
Inten_Use
0.233013 0.234002 0.065954 0.065954
Ease ->
Inten_Use
-0.012399 -0.007554 0.065856 0.065856
Enjoy ->
Inten_Use
0.149720 0.148905 0.067008 0.067008
Innov ->
Enjoy
0.614324 0.617694 0.046291 0.046291
Innov ->
Inten_Use
0.284177 0.278375 0.058748 0.058748
Observ ->
Inten_Use
0.179357 0.179883 0.059110 0.059110
RA ->
Inten_Use
0.024667 0.022919 0.071667 0.071667
Sec ->
Inten_Use
0.133829 0.132160 0.051460 0.051460
Sec -> Trust 0.797824 0.798563 0.025483 0.025483
Trial ->
Inten_Use
0.178466 0.185545 0.053810 0.053810
Trial ->
Observ
0.598311 0.600884 0.049610 0.049610
Trust ->
Inten_Use
0.254239 0.251580 0.074057 0.074057
200
Appendix D: Plain Language Statement - Interviews
Please direct all enquiries to:
Hamed Al-busaidi
Tel: +61 (0) 415587417
+968 99447448
Email: [email protected]
Assoc Prof. Geoff Sandy
Tel: +61 3 9919 5309
Email. [email protected]
Dear (Sir/Madam)
E-government is the application of Information and Communication Technology (ICT) utilized
by the government agencies aims to enhance the information or services delivery to citizens. It
provides services to citizens through wired network such as internet, and fixed telephones. The
internet nowadays has become the cheapest and most effective channel that being utilized by the
government in order to deliver information and communication services to citizens. However in
order to check a certain type of government service (e.g. exam notification) requires resources
such as computer, telephone, and internet connection, which may not be available to citizens.
Nevertheless, due to the existence of advance technology such as wireless mobile communication
infrastructure, pushing the governments to utilize this technology in order to better deliver its
service to citizens anywhere and anytime with satisfaction. Governments that utilize this

201
technology will gain many benefits such as cost reduction, greater work efficiency, and
effectiveness, and faster access to public services anytime and anywhere. Hence, Mobile
Government is defined as ‘a strategy and its implementation involving the utilization of all kinds
of wireless and mobile technology, services, applications and devices for improving benefits to
the parties involved in e-government including citizens, businesses and all government units’.
This survey is part of Doctor of Philosophy study, being undertaken by the researcher Hamed Al-
busaidi and supervised by Assoc Prof. Geoff Sandy at Victoria University. It aims to investigate
the factors affecting the intention to use of mobile government services. This research will use
Diffusion of innovation (DOI) as a main model to test the applicability of this model in the
context of the adoption of m-government services. This study will assist the decision makers who
are involved in m-Government projects to better understand and implement Mobile government
services in the right direction and according to the citizens needs.
In order to achieve the desired goals, the researcher is conducting interviews for 30 minutes with
decision makers involved with m-Government projects in Oman such as yourself, who are in a
position to provide valuable information on m-Government projects current and future plans, in
addition if there are barriers hindering the projects progress. Based on that, we would like to
invite you to be part of this study, which will assist the researcher to identify factors affecting the
intention to use of Mobile-government service. Based on understandings gained from this
project, the decision makers who are involved in m-Government projects will better understand
the challenges it will face in the implementation of m-Government services - and implementation
of these services will be more effective.
I assure you that all responses will be confidential. Could I ask you please to complete the
attached Consent Form prior to our interview.
Thank you in anticipation of your involvement
Yours sincerely,
Hamed Al-busaidi

202
Appendix E: Consent Form for
Participants Involved in Research
INFORMATION TO PARTICIPANTS:
We would like to invite you to be a part of Doctor of Philosophy study into ‘ A Model of
Intention to Use Mobile Government Services’ which is sponsored by Diwan of Royal Court
This objective of this study is to investigate the factors affecting the intention to use of mobile
Government services. This project will use Diffusion of innovation (DOI) as a main model. This
study will assist the decision makers who are involved in m-Government projects to better
understand and implement mobile Government services in the right direction and according to
the citizens needs. This research has commenced with a general literature search process
focused on key concepts from the following areas: information systems, diffusion of innovation
theories, and E/M-government. The literature search helped to set and refine the study’s aims.
The literature will undergo a more focused literature on M-government experience wide world
in general. In addition a more focus literature on Diffusion of innovation technology in general
and diffusion of innovation theory for Rogers in particular. Semi-Structured interviews and
survey questionnaire will be the primary data collection tools that will be used in this study. The
interview will be taped or notes taken according to the participant’s preference in order to
record information accurately. The information gathered will be kept confidential along with the
identity of the participant. The anonymity and confidentiality of participants and information
collected from participants will be ensured through important steps.
CERTIFICATION BY SUBJECT
I,
of

203
certify that I am at least 18 years old* and that I am voluntarily giving my consent to participate
in the study:
A Model of Intention to Use Mobile Government Services being conducted at Victoria
University by:
I certify that the objectives of the study, together with any risks and safeguards associated with
the procedures listed hereunder to be carried out in the research, have been fully explained to me
by:
Hamed Al-busaidi
and that I freely consent to participation involving the below mentioned procedures:
I am participating on voluntary bases.
The interview will be: Audio taped Notes taken. (please circle your preference)
The interview will take place in my office
The information gathered from me will be kept confidential along with my identity.
The anonymity and confidentiality of participants and information collected from
participants will be ensured through important steps.
I certify that I have had the opportunity to have any questions answered and that I understand that
I can withdraw from this study at any time and that this withdrawal will not jeopardise me in any
way.
I have been informed that the information I provide will be kept confidential.
Signed:
Date:

204
Please direct all enquiries to:
Hamed Al-busaidi
Tel: +61 (0) 415587417
+968 99447448
Email: [email protected]
Assoc Prof. Geoff Sandy
Tel: +61 3 9919 5309
Email. [email protected]
If you have any queries or complaints about the way you have been treated, you may contact the
Secretary, Victoria University Human Research Ethics committee, Victoria University, PO Box
14428, Melbourne, VIC, 8001 phone (03) 9919 4781

205
Appendix F: Interview Questions (Guideline)
Semi-Structured Interview Questions
Note: The main questions are listed below. However, this is a semi-structured interview and it is
anticipated that more questions will be added based on the interviewee responses.
Demographics
General information to include:
Gender
Age
Organization and position details
Education level
General Question
Does peer pressure or recommendation have an (or any) impact on the spread of
mobile government services use in a society?
Do you think Gender would make a difference on the spread of mobile services use
in a society? how?
Do you think Education level would make a difference on the spread of mobile
services use in a society? how?
Do you think Age would make a difference on the spread of mobile services use in
a society? how?
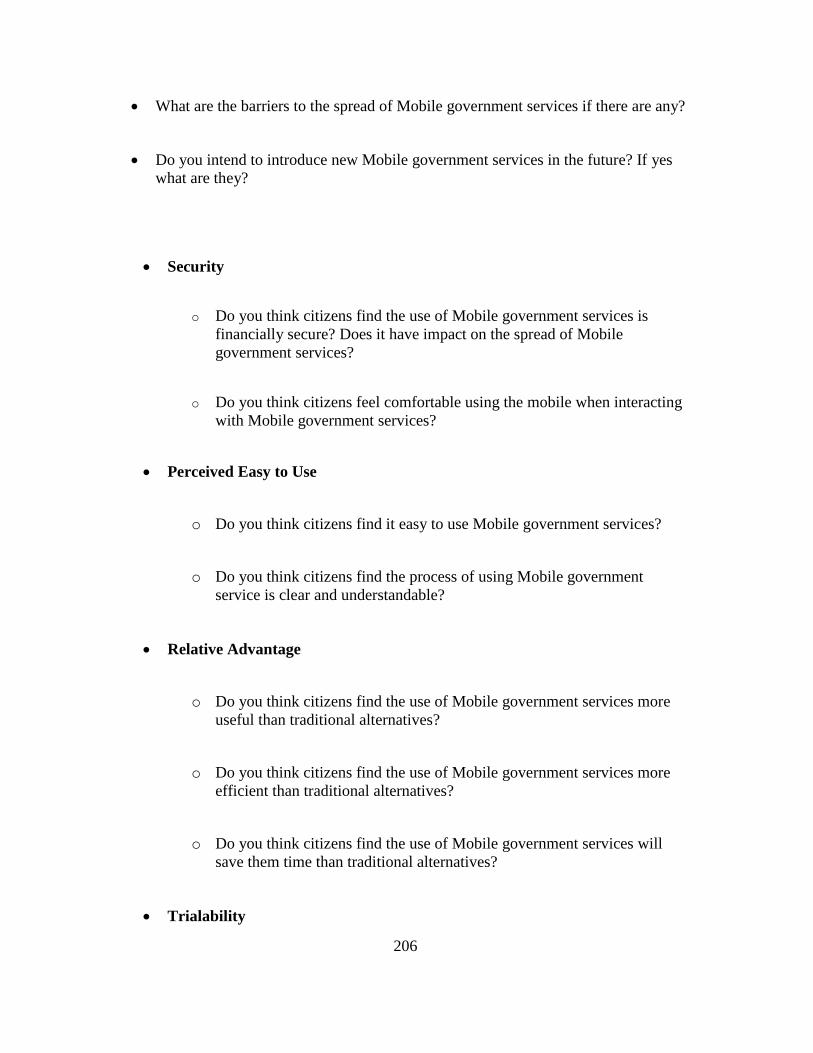
206
What are the barriers to the spread of Mobile government services if there are any?
Do you intend to introduce new Mobile government services in the future? If yes
what are they?
Security
o Do you think citizens find the use of Mobile government services is
financially secure? Does it have impact on the spread of Mobile
government services?
o Do you think citizens feel comfortable using the mobile when interacting
with Mobile government services?
Perceived Easy to Use
o Do you think citizens find it easy to use Mobile government services?
o Do you think citizens find the process of using Mobile government
service is clear and understandable?
Relative Advantage
o Do you think citizens find the use of Mobile government services more
useful than traditional alternatives?
o Do you think citizens find the use of Mobile government services more
efficient than traditional alternatives?
o Do you think citizens find the use of Mobile government services will
save them time than traditional alternatives?
Trialability

207
o Do you think citizens find trying Mobile government services for free will
have impact on the spread of mobile government services?

208
Appendix G: Construct Specification Accuracy
Construct Indicators Construct
Type
Reason
Relative
Advantage
(RA)
I believe the use of Mobile Parking Service enables me to pay parking fees
more quickly than other methods (e.g. using Coins, Ticket machine).
I believe the use of Mobile Parking Service enables me to pay the parking fees
in an easier way compared to other methods (e.g. using Coins, Ticket machine).
I believe the use of Mobile Parking Service is more efficient than using other
alternative ways (e.g. using Coins, Ticket machine).
I believe the use of Mobile Parking Service saves me time compared to other
ways (using Coins, Ticket machine).
I believe the use of Mobile Parking Service increases my productivity
Reflective Direction of causality is from
construct to items.
Indicators are manifestations of the
construct
Changes in the indicator do not cause
changes in the construct
Changes in the construct do cause
changes in the indicators
Indicators are interchangeable and
have similar content/indicators and
share a common theme
Dropping an indicator does not alter
the conceptual domain of the
construct
Indicators are expected to co-vary
with each other
Nomo-logical net for the indicators
do not differ
Indicators have the same antecedents
and consequences

209
Compatibility
(CT) I believe the use of Mobile Parking Service is compatible with my lifestyle.
I believe the use of SMS parking fits well with the way I like to pay for other
services.
I believe the use of Mobile Parking Service is completely compatible with how
I like to do things.
I believe the use of SMS parking would fit well with the way I like to pay for
parking fees.
Reflective Direction of causality is from construct to
items.
Indicators are manifestations of the
construct
Changes in the indicator do not cause
changes in the construct
Changes in the construct do cause
changes in the indicators
Indicators are interchangeable and
have similar content/indicators and
share a common theme
Dropping an indicator do not alter the
conceptual domain of the construct
Indicators are expected to co-vary
with each other
Nomo-logical net for the indicators
do not differ
Indicators have the same antecedents
and consequences
Perceived Ease
of Use (PEOU) I believe the use of Mobile Parking Service is clear and understandable.
I believe the use of Mobile Parking Service is easy.
I believe learning to use Mobile Parking Service is easy for me.
I believe the use of Mobile Parking Service does not require a lot of mental
effort.
I believe the use of Mobile Parking Service is not frustrating.
Reflective Direction of causality is from
construct to items.
Indicators are manifestations of the
construct
Changes in the indicator do not cause
changes in the construct
Changes in the construct do cause
changes in the indicators
Indicators are interchangeable and
have similar content/indicators and
share a common theme
Dropping an indicator does not alter
the conceptual domain of the
construct
Indicators are expected to co-vary
with each other

210
Nomo-logical net for the indicators
do not differ
Indicators have the same antecedents
and consequences
Trialability
(TRL) I believe before deciding whether to use the SMS parking service, it will be
better to try it out by the user for free.
I believe it is better to use Mobile Parking Service on a trial basis for long
enough time to see what it could do.
I believe I would not have to spend a lot of effort to try SMS parking service.
I believe it would be better for the service provider to experiment the Mobile
Parking Service as necessary to check its effectiveness.
Reflective Direction of causality is from
construct to items.
Indicators are manifestations of the
construct
Changes in the indicator do not cause
changes in the construct
Changes in the construct do cause
changes in the indicators
Indicators are interchangeable and
have similar content/indicators and
share a common theme
Dropping an indicator does not alter
the conceptual domain of the
construct
Indicators are expected to co-vary
with each other
Nomo-logical net for the indicators
do not differ
Indicators have the same antecedents
and consequences
Observability
(OBSV) I believe I would have no difficulty telling others about the results of using
SMS parking service.
I believe I could communicate to others the consequences of using SMS
parking service.
I believe I would have no difficulty explaining why using Mobile Parking
Service may or may not be beneficial.
I believe the instructions of how to use Mobile Parking Service is available and
visible in many places.
Reflective Direction of causality is from
construct to items.
Indicators are manifestations of the
construct
Changes in the indicator do not cause
changes in the construct
Changes in the construct do cause
changes in the indicators
Indicators are interchangeable and
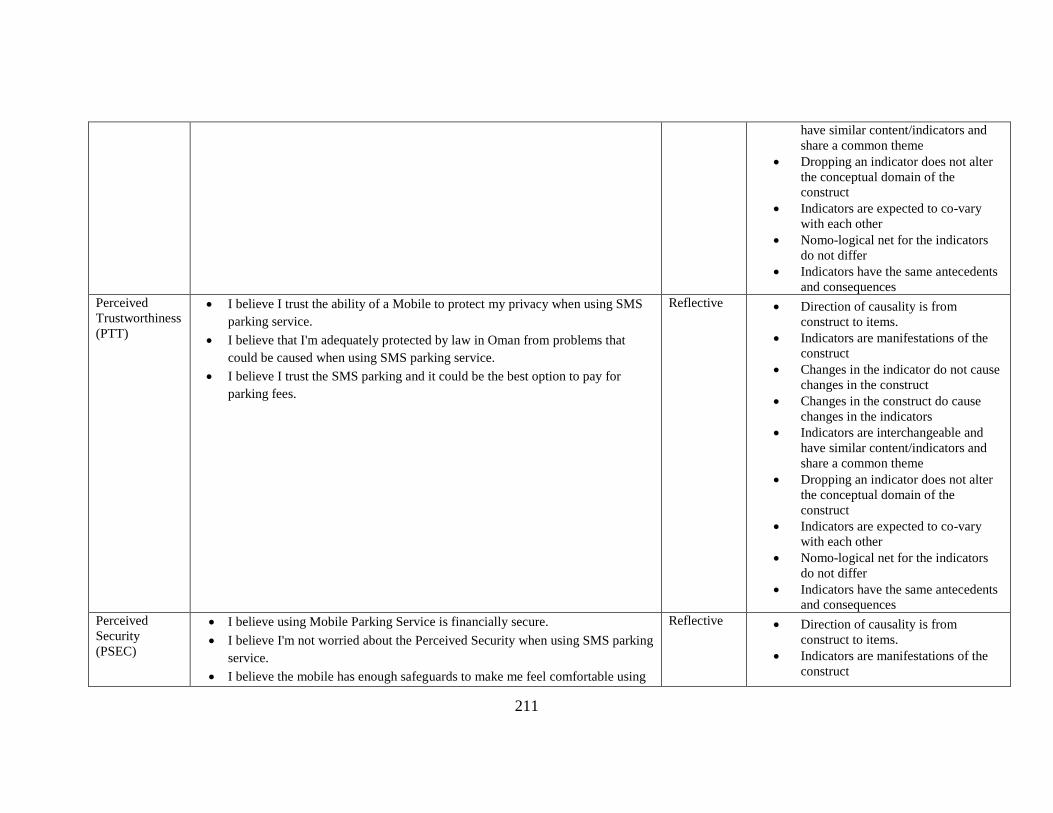
211
have similar content/indicators and
share a common theme
Dropping an indicator does not alter
the conceptual domain of the
construct
Indicators are expected to co-vary
with each other
Nomo-logical net for the indicators
do not differ
Indicators have the same antecedents
and consequences
Perceived
Trustworthiness
(PTT)
I believe I trust the ability of a Mobile to protect my privacy when using SMS
parking service.
I believe that I'm adequately protected by law in Oman from problems that
could be caused when using SMS parking service.
I believe I trust the SMS parking and it could be the best option to pay for
parking fees.
Reflective Direction of causality is from
construct to items.
Indicators are manifestations of the
construct
Changes in the indicator do not cause
changes in the construct
Changes in the construct do cause
changes in the indicators
Indicators are interchangeable and
have similar content/indicators and
share a common theme
Dropping an indicator does not alter
the conceptual domain of the
construct
Indicators are expected to co-vary
with each other
Nomo-logical net for the indicators
do not differ
Indicators have the same antecedents
and consequences
Perceived
Security
(PSEC)
I believe using Mobile Parking Service is financially secure.
I believe I'm not worried about the Perceived Security when using SMS parking
service.
I believe the mobile has enough safeguards to make me feel comfortable using
Reflective Direction of causality is from
construct to items.
Indicators are manifestations of the
construct

212
it to interact with the SMS parking service. Changes in the indicator do not cause
changes in the construct
Changes in the construct do cause
changes in the indicators
Indicators are interchangeable and
have similar content/indicators and
share a common theme
Dropping an indicator does not alter
the conceptual domain of the
construct
Indicators are expected to co-vary
with each other
Nomo-logical net for the indicators
do not differ
Indicators have the same antecedents
and consequences
Perceived
Enjoyment
(PENJ)
I believe using Mobile Parking Service is fun.
I believe using Mobile Parking Service is useful.
I believe using Mobile Parking Service is a wise decision.
Reflective Direction of causality is from
construct to items.
Indicators are manifestations of the
construct
Changes in the indicator do not cause
changes in the construct
Changes in the construct do cause
changes in the indicators
Indicators are interchangeable and
have similar content/indicators and
share a common theme
Dropping an indicator does not alter
the conceptual domain of the
construct
Indicators are expected to co-vary
with each other
Nomo-logical net for the indicators
do not differ
Indicators have the same antecedents
and consequences

213
Personal
Innovativeness
(PINV)
I like to explore new m-Government services.
Among my peers, I am usually the first to try out new Mobile-government
services.
In general, I am interested in trying out new Mobile-government services.
Reflective Direction of causality is from
construct to items.
Indicators are manifestations of the
construct
Changes in the indicator do not cause
changes in the construct
Changes in the construct do cause
changes in the indicators
Indicators are interchangeable and
have similar content/indicators and
share a common theme
Dropping an indicator does not alter
the conceptual domain of the
construct
Indicators are expected to co-vary
with each other
Nomo-logical net for the indicators
do not differ
Indicators have the same antecedents
and consequences
Intention to use
(INT) I would use the Mobile Parking Service frequently.
I would use the Mobile Parking Service whenever possible.
I intend to use the Mobile Parking Service in the future.
I would like to use new Mobile-government services in the future.
Reflective Direction of causality is from
construct to items.
Indicators are manifestations of the
construct
Changes in the indicator do not cause
changes in the construct
Changes in the construct do cause
changes in the indicators
Indicators are interchangeable and
have similar content/indicators and
share a common theme