Embed Size (px)
Citation preview

The Effect of Consumer Learning on Intention to Use Mobile Payments
by
Lin Jia
A dissertation submitted to the Graduate Faculty of Auburn University
in partial fulfillment of the requirements for the Degree of
Doctor of Philosophy
Auburn, Alabama December 13, 2014
Keywords: mobile payments, trust, consumer learning, technology usage habits, behavioral intention, cross-cultural
Copyright 2014 by Lin Jia
Approved by
Dianne J. Hall, Chair, Professor of Management Information Systems Terry A. Byrd, Bray Distinguished Professor of Management Information Systems
R. Kelly Rainer, George Phillips Privett Professor of Management Information Systems Casey G. Cegielski, Professor of Management Information Systems

ii
Abstract
With the fast development of mobile applications and mobile internet, we arrive at the
mobile commerce era. Mobile payments, a promising form of electronic payments, will become
an important channel for conducting transactions especially with regard to mobile commerce. As
the popularity of mobile devices increases, mobile payments have become one of the critical
drivers for mobile commerce success. It is necessary to examine how to encourage mobile
payments adoption and continuous usage. The series of essays in this dissertation strive to
address these issues.
Essay 1 explores consumers’ trust building in the consumer learning process and its
effect on consumers’ behavioral intention toward mobile payments. Results verify the vital role
of consumer learning in building trust and encouraging consumers to engage in mobile
payments. This essay also explores which characteristics differentiate users and non-users and
differentiate American and Chinese consumers. The research is the foundation of an
understanding of the effect of culture on mobile payments acceptance, and deepens our
understanding of how consumer learning can be used to help consumers build trust and
encourage them to accept mobile payments.
Essay 2 explores how consumers’ learning outcomes affect their mobile payments
acceptance decision. This essay views self-efficacy, attitude, and perceived knowledge as
outcomes of consumer learning. Results indicate that consumer learning has a positive
relationship with learning outcomes, which then enhance consumers’ behavioral intention toward

iii
mobile payments. When we statistically compared our results across users and non-users and
across American and Chinese consumers, the similarities and differences in the cognitive
processes involved for adoption and post adoption became apparent.
Essay 3 explores the effect of technology usage habits and price discount on consumers’
intention to continue using mobile payments. Results indicate that consumers’ online shopping
habit, mobile service usage habit, and cell phone usage habit each have a positive relationship
with their mobile payment usage habit and thereafter enhance their intention to continue using
mobile payments. This essay also found mixed effect of price discount on the relationship
between mobile payment usage habit and its three predictors.
Taken together, these three essays systematically explore factors affecting consumers’
acceptance of mobile payments and also discuss the effect of culture on their cognitive processes
involved for adoption and post adoption of mobile payments. Results extend our understanding
of factors affecting consumers’ adoption and post-adoption of mobile payments. Implications for
research and practice provide suggestions for better understanding of mobile payment acceptance
and applying the results to managerial contexts.

iv
Acknowledgments
I would like to thank my chair, Dr. Dianne J. Hall, for her invaluable help and direction
towards completion of my dissertation and doctoral program. Her responsiveness to my
questions and helpful comments helped me considerably during the dissertation writing process.
Her challenging comments and insightful suggestions helped me improve the research quality
and become a better researcher. Her serious attitude toward research and writing will forever be
remembered, and her understanding and patience with my writing will forever be appreciated.
Thanks are also due to the other three committee members, Dr. Terry A. Byrd, Dr. R. Kelly
Rainer, and Dr. Casey G. Cegielski, who have offered good suggestions on how to extend my
research scope. They also enriched my understanding of research and added strength to the
arguments in this dissertation. All professors in the Information Systems Management program
at Auburn University, including my committee chair and committee members, are friendly and
helpful. They taught me how to be a good researcher.
Additional thanks must go to my parents. As the single child in my family, I cannot be
with them at home. However, they continuously encourage me to pursue my doctoral degree and
my dream. Their endurance, courage, and good-nature have inspired me to be nothing less than
my best. I also would like to thank my friends at Auburn University and those respondents who
have participated in my survey for their support of my research.

v
Table of Contents Abstract ....................................................................................................................................... vii
Acknowledgements ...................................................................................................................... iv
List of Tables .............................................................................................................................. vii
List of Figures ............................................................................................................................... x
ESSAY 1
Introduction ....................................................................................................................... 1
Theoretical Background .................................................................................................... 4
Research Model and Hypotheses Development ............................................................. 11
Methodology ................................................................................................................... 23
Data Analysis and Results .............................................................................................. 26
Discussion ....................................................................................................................... 42
Conclusion ...................................................................................................................... 54
Reference ........................................................................................................................ 55
APPENDIX 1: Instrument .............................................................................................. 67
ESSAY 2
Introduction ..................................................................................................................... 71
Literature Review............................................................................................................ 75
Research Model and Hypotheses Development ............................................................. 85
Methodology ................................................................................................................... 99

vi
Data Analysis and Results ............................................................................................ 102
Discussion ..................................................................................................................... 117
Conclusion .................................................................................................................... 131
Reference ...................................................................................................................... 131
APPENDIX 2: Instrument ............................................................................................ 147
ESSAY 3
Introduction ................................................................................................................... 153
Theoretical Background and Research Model .............................................................. 156
Hypotheses Development ............................................................................................. 163
Methodology ................................................................................................................. 170
Data Analysis and Results ............................................................................................ 172
Discussion ..................................................................................................................... 181
Conclusion .................................................................................................................... 188
Reference ...................................................................................................................... 189
APPENDIX 3: Instrument ............................................................................................ 197
APPENDIX 4: Information Letter ............................................................................................ 199

vii
List of Tables ESSAY 1
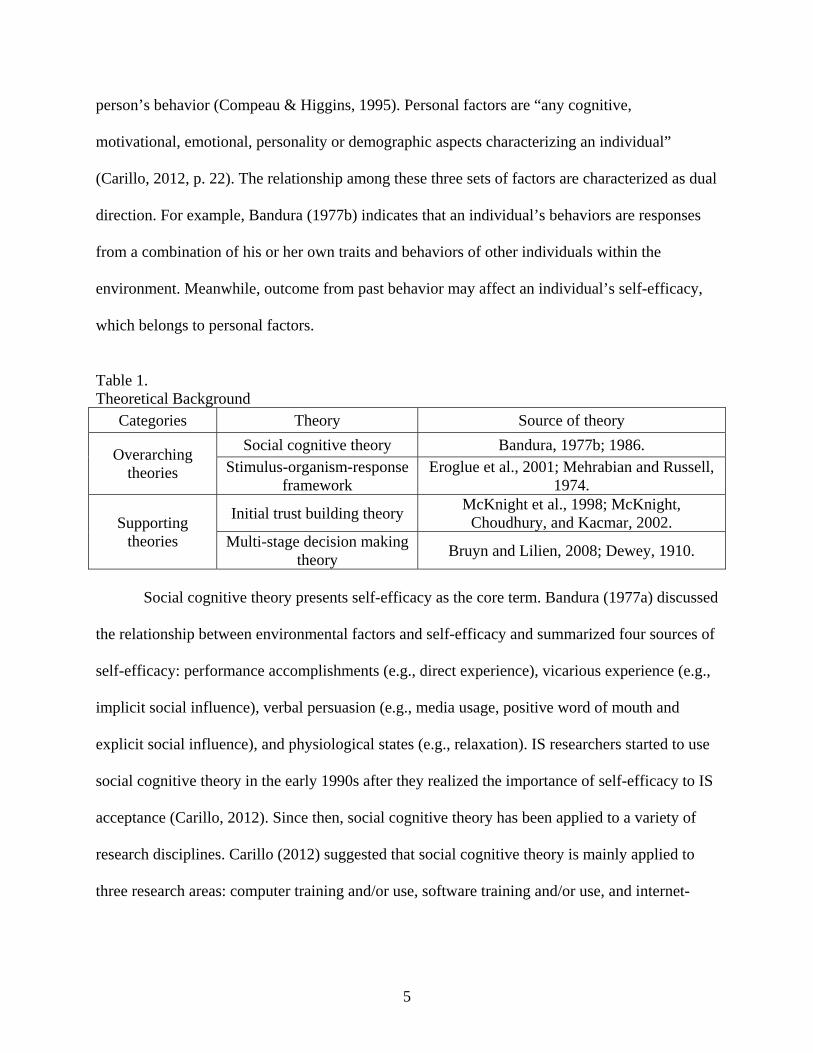
Table 1. Theoretical Background ........................................................................................ 5
Table 2. Definitions of Variables ...................................................................................... 12
Table 3. Demographic Information ................................................................................... 25
Table 4. Measurement Validity for the User Group from China ...................................... 30
Table 5. Measurement Validity for the Non-User Group from China .............................. 30
Table 6. Measurement Validity for the User Group from the U.S. ................................... 31
Table 7. Measurement Validity for the Non-User Group from the U.S. ........................... 31
Table 8. Cross Loading for the User Group from China ................................................... 32
Table 9. Cross Loading for the Non-User Group from China .......................................... 33
Table 10. Cross Loading for the User Group from the U.S. ............................................. 34
Table 11. Cross Loading for the Non-User Group from the U.S. ..................................... 35
Table 12. Summary of Hypotheses Tests .......................................................................... 38
Table 13. Result of Parametric Multi-Group Analysis with PLS for the Two Groups of China .................................................................................................................. 39
Table 14. Result of Parametric Multi-Group Analysis with PLS for the Two Groups of the U.S. .................................................................................................................... 40
Table 15. Result of Parametric Multi-Group Analysis with PLS for Users of China and the U.S. .................................................................................................................... 41
Table 16. Result of Parametric Multi-Group Analysis with PLS for Non-Users of China and the U.S. ........................................................................................................ 42
Table 17. Summary of Testing Results for the Two Groups from China ......................... 43

viii
Table 18. Summary of Testing Results for the Two Groups from the U.S. ...................... 44
Table 19. Summary of Testing Results for the Two User Groups .................................... 44
Table 20. Summary of Testing Results for the Two Non-User Groups ............................ 45
ESSAY 2
Table 1. Theoretical Background ...................................................................................... 78
Table 2. Definitions of variables ....................................................................................... 86
Table 3. Demographic Information ................................................................................. 100
Table 4. Measurement Validity for the User Group from China .................................... 105
Table 5. Measurement Validity for the Non-User Group from China ............................ 106
Table 6. Measurement Validity for the User Group from the U.S. ................................. 106
Table 7. Measurement Validity for the Non-User Group from the U.S. ......................... 107
Table 8. Cross Loading for the User Group from China ................................................. 108
Table 9. Cross Loading for the Non-User Group from China ........................................ 109
Table 10. Cross Loading for the User Group from the U.S. ........................................... 110
Table 11. Cross Loading for the Non-User Group from the U.S. ................................... 111
Table 12. Summary of Hypotheses Testing .................................................................... 114
Table 13. Result of Parametric Multi-Group Analysis with PLS for the Two Groups of China ................................................................................................................ 116
Table 14. Result of Parametric Multi-Group Analysis with PLS for the Two Groups of the U.S. .................................................................................................................. 117
Table 15. Result of Parametric Multi-Group Analysis with PLS for Users of China and the U.S. .................................................................................................................. 118
Table 16. Result of Parametric Multi-Group Analysis with PLS for Non-Users of China and the U.S. ...................................................................................................... 119
Table 17. Summary of Testing Results for the Two Groups from China ....................... 119
Table 18. Summary of Testing Results for the Two Groups from the U.S. .................... 120

ix
Table 19. Summary of Testing Results for the Two User Groups .................................. 120
Table 20. Summary of Testing Results for the Two Non-User Groups .......................... 121
ESSAY 3
Table 1. Demographic Information ................................................................................. 171
Table 2. Measurement Validity for the China Group ...................................................... 174
Table 3. Measurement Validity for the U.S. Group ........................................................ 175
Table 4. Cross Loading for the China Group .................................................................. 176
Table 5. Cross Loading for the U.S. Group .................................................................... 177
Table 6. Result of Parametric Multi-Group Analysis for Users of China and the U.S. .. 178
Table 7. Comparison of the Low and the High Price Discount Groups for China ......... 180
Table 8. Comparison of the Low and the High Price Discount Groups for the U.S. ...... 181
Table 9. Summary of Hypotheses Tests .......................................................................... 181

x
List of Figures
ESSAY 1
Figure 1. Trust Building in the Consumer Learning Process ............................................ 12
Figure 2. Structural Model (China) ................................................................................... 36
Figure 3. Structural Model (the U.S.) ................................................................................ 37
ESSAY 2
Figure 1. Triadic causal nature of human functioning ...................................................... 79
Figure 2. Research Model ................................................................................................. 86
Figure 3. Structural Model for China .............................................................................. 112
Figure 4. Structural Model for the U.S. ........................................................................... 113
ESSAY 3
Figure 1. Research Model ............................................................................................... 163
Figure 2. Structural Model (Main Effect) ....................................................................... 178
Figure 3. Structural Model (China) ................................................................................. 179
Figure 4. Structural Model (the U.S.) .............................................................................. 180

ESSAY 1: TRUST BUILDING IN THE CONSUMER LEARNING PROCESS AND ITS EFFECT ON CONSUMERS’ BEHAVIORAL INTENTION TOWARD MOBILE
PAYMENTS
Introduction
McKinsey (2013a) emphasizes twelve disruptive technologies with the potential for
massive impact on how people live and work and on industries and economies. Mobile internet is
at the top of the list. The report also suggests that mobile payments represent a large opportunity
made possible by mobile internet technology. An electronic transaction can “save 50 to 70
percent of processing costs over a paper transaction, and the total potential economic impact of
moving transactions to an electronic format is estimated to be US$200 billion to US$300 billion
per year in 2025” (McKinsey, 2013a, p. 37). Mobile payments, payments made by individuals
who use mobile devices to pay for goods, services, and bills or perform bank transactions
(Dahlberg, Mallat, Ondrus, & Zmijewska, 2008), are a promising form of electronic payments.
Mobile payments will become an important channel for conducting transactions,
especially within mobile commerce (Yang et al., 2012). Many researchers and business analysts
believe that mobile payments will flourish in the coming years. It is estimated that worldwide
mobile payment revenue will rise to US$998.5 billion by 2016 (Business Wire, 2012). However,
the acceptance rate of mobile payments is low although the growth forecast for them is very
positive (Duane, O’Reilly, and Andreev, 2014). In the U.S., only 37% of smartphone owners
have used their phones to make a mobile payment (Nielsen, 2014). In China, only twenty nine
percent of consumers have used mobile payments, among which only six percent of consumers

2
use mobile payments frequently and twenty three percent of consumers use mobile payments
occasionally (iResearch, 2013). McKinsey indicates that about 45% of U.S. consumers are open
to the idea of using mobile payments, but this number has fallen since 2011 (McKinsey, 2013b).
According to the MasterCard mobile payments readiness index, no country has achieved a
mainstream consumer acceptance, and we are still in the early days for the adoption of mobile
payments globally (MasterCard, 2014). Singapore ranks first with an index of 45.6, and the
indexes for the United States and China are 41.5 and 36.5, respectively (MasterCard, 2014).
These numbers indicate that consumers are not widely accepting of mobile payments. More
research is needed to explore the drivers of mobile payment acceptance.
Trust is an important driver of consumers’ acceptance of IT innovations, especially when
there is a high level of risk associated with them (Coleman, 1990; Gefen et al., 2003). Pavlou
(2003) found that consumers’ trust has a positive relationship with their adoption of e-commerce.
Trust is also viewed as a driver of consumers’ adoption of mobile banking (Kim et al., 2009; Luo
et al., 2010). Mobile payments operate based on mobile internet and there is high uncertainty and
perceived risk associated with both (Zhou, 2014). Top concern of consumers are money safety,
personal information leakage, and mobile device virus infection (iResearch, 2013). Trust in
technology decreases the perception of risk. Thus, trust is anticipated to have a positive
relationship with consumers’ intention to use mobile payments.
Consumers’ trust in mobile technology is dynamic (Lin, Wang, Wang, & Lu, 2014).
Consumers modify their trust in mobile payments according to new information they obtain
during the consumer learning process. In this process, external factors play an important role in
affecting consumers’ trust in mobile payments (Liebana-Cabanillas et al., 2014). Liebana-
Cabanillas et al. (2014) posited that social influences and social norms are two types of external

3
factors that have a positive relationship with consumers’ trust in mobile payments. They
proposed that future research should explore the influence of other external elements on
consumers’ trust in mobile payments (Liebana-Cabanillas et al., 2014). For example, word of
mouth and media usage are considered external factors that affect consumers’ trust in mobile
payments (Chandra et al., 2010; Kim et al., 2009).
Apart from trust, culture has been accepted as an important factor that will affect
adoption and usage of mobile technologies (Dahlberg et al., 2008; Dai & Palvia, 2009; Zhang,
Zhu, & Liu, 2012). As mobile payment services spread globally, the importance of culture
should be included in acceptance research regarding mobile payments (Dahlberg et al., 2008). In
addition, culture is closely related to trust in online environments and will influence how trust is
developed and the effect of trust on behavioral outcomes such as adoption (Gefen, Benbasat, &
Pavlou, 2008). Gefen et al. (2008) suggested that “future research could take culture and gender
into account more seriously when examining the effects of trust on behavioral outcomes”
(Benbasat, & Pavlou, 2008, p. 280). However, little research has performed cross-cultural
research on mobile payment acceptance (Arvidsson, 2014; Dahlberg et al., 2008).
In order to analyze the issues mentioned above, we adopt the definition of innovation as
an “on-going process involving persuasive communication and learning” (Lee & Xia, 2011, p.
289) and separate consumer learning into passive and active consumer learning, which are
represented by exposure to mobile payments and information searching, respectively. Exposure
to mobile payments is composed of media usage, positive word of mouth, and explicit and
implicit social influence, which are under the umbrella of external factors that will affect the
acceptance of mobile payments. We view consumer learning as a source of quality information
and explore the effect of consumer learning on consumers’ trust building and behavioral

4
intention toward mobile payments. This research explores trust building and its effect on mobile
payments acceptance in two countries: China and the United States, which are culturally
different and represent the eastern and the western cultures, respectively (Hofstede, 1980, 1991,
2001).
The objective of this research is to explore consumers’ trust building in the consumer
learning process and its effect on consumers’ behavioral intention toward mobile payments. Our
research questions are: (1) whether consumer learning can increase consumers’ trust in mobile
payments and hence affect their behavioral intention toward mobile payments; and (2) what
factors differentiate the users and non-users and differentiate American and Chinese consumers.
The rest of the paper proceeds as follows. The theoretical background and conceptual model are
presented first. Then, the hypotheses are developed. Data collection and analysis are explained
next followed by presentation of the results.
Theoretical Background
To investigate the effect of consumer learning on trust building and mobile payment
acceptance, we drew on four theories as summarized in Table 1. Social cognitive theory and the
stimulus-organism-response (SOR) framework serve as overarching theories in our model
conceptualization while the multi-stage decision making model and the initial trust building
model are used to support links among model constructs.
Social Cognitive Theory
Social cognitive theory was proposed by Bandura (1977b, 1986). This theory emphasizes
dual relationships among three sets of factors: environmental, personal, and behavioral factors.
Behavior refers to behavioral intention or actual behavior toward the object. Environmental
factors refer to either social or physical factors that are external to the person and affect a
5
person’s behavior (Compeau & Higgins, 1995). Personal factors are “any cognitive,
motivational, emotional, personality or demographic aspects characterizing an individual”
(Carillo, 2012, p. 22). The relationship among these three sets of factors are characterized as dual
direction. For example, Bandura (1977b) indicates that an individual’s behaviors are responses
from a combination of his or her own traits and behaviors of other individuals within the
environment. Meanwhile, outcome from past behavior may affect an individual’s self-efficacy,
which belongs to personal factors.
Table 1. Theoretical Background
Categories Theory Source of theory
Overarching theories
Social cognitive theory Bandura, 1977b; 1986. Stimulus-organism-response
framework Eroglue et al., 2001; Mehrabian and Russell,
1974.
Supporting theories
Initial trust building theory McKnight et al., 1998; McKnight,
Choudhury, and Kacmar, 2002. Multi-stage decision making
theory Bruyn and Lilien, 2008; Dewey, 1910.
Social cognitive theory presents self-efficacy as the core term. Bandura (1977a) discussed
the relationship between environmental factors and self-efficacy and summarized four sources of
self-efficacy: performance accomplishments (e.g., direct experience), vicarious experience (e.g.,
implicit social influence), verbal persuasion (e.g., media usage, positive word of mouth and
explicit social influence), and physiological states (e.g., relaxation). IS researchers started to use
social cognitive theory in the early 1990s after they realized the importance of self-efficacy to IS
acceptance (Carillo, 2012). Since then, social cognitive theory has been applied to a variety of
research disciplines. Carillo (2012) suggested that social cognitive theory is mainly applied to
three research areas: computer training and/or use, software training and/or use, and internet-

6
based applications or services (p. 249). The topic of our research, mobile payments, belongs to
the third area.
According to social cognitive theory, each of the three sets of factors can serve as a
dependent variable. However, behavioral intention or actual behavior are the most represented
dependent variables because researchers try to explain and predict human behaviors (Carillo,
2012). In this research, behavioral intention is also used as the dependent variable; the model we
propose can be used to explain consumers’ behavioral intention toward mobile payments.
Stimulus-Organism-Response (SOR) Framework
Mehrabian and Russell (1974) proposed the M-R model based on the SOR paradigm.
Mehrabian and Russell (1974) posited that three basic emotion states, known as PAD (pleasure,
arousal, and dominance), mediate the relationship between an environmental stimulus and an
approach or avoidance response (Mehrabian & Russell, 1974). There are some critics of the M-R
model. Russell & Pratt (1980) found that dominance does not have a significant relationship with
the response. Bagozzi (1983) criticized the narrow scope of the stimulus in the M-R model and
posited that it should include managerially controllable factors such as “advertising, price,
product/package design, and distribution policies” (p. 142), and environmental factors such as
“competition, social pressure, legal regulations, and economic conditions” (p. 142). Additionally,
Eroglue et al. (2001) criticized the narrow scope of the organism and expanded the M-R model
by including cognitive states as a part of the organism. Cognitive states refer to “everything that
goes in minds of consumers that concern the acquisition, processing, retention, and retrieval of
information” (Eroglue et al., 2001, p. 181). Cognitive states include but are not limited to
attitudes, beliefs, comprehension, and knowledge (Eroglue et al., 2001). The SOR framework in
this research is adapted from the expanded M-R model.

7
In the SOR framework, stimulus refers to the impetus within the environment with
potential to affect the consumers’ cognitive and affective processes (Fiore & Kim, 2007),
organism refers to “the mediating processes between the stimulus and consumers’ response”
(Fiore & Kim, 2007, p. 426), and response refers to “the concluding result of the internal
processes of the organism” (Fiore & Kim, 2007, p. 432). Behavioral intention is the mostly used
dependent variable in SOR research (Kawaf & Tagg, 2012). The SOR framework suggests that
an individual will change his or her affective and cognitive attitudes after he or she is exposed to
some type of stimulus, and further, affective and cognitive attitudes will contribute to the
response (a behavior such as purchase or adoption).
The SOR framework has been applied to prediction of consumer responses toward a
variety of products, services, technologies, traditional brick-n-mortar stores, and online stores
(Lee, Ha, & Widdows, 2011). Fiore and Kim (2007) proposed an integrative model to explain
consumers’ shopping experience within the SOR framework. In their model, stimulus is
expressed as environmental input variables, organism is expressed as a set of factors that belong
to cognition, consciousness, affect, and value, and response is expressed as behavioral factors
such as behavioral intentions. Wang, Minor, and Wei (2011) proposed a research model to
examine online consumers’ hierarchical response to web aesthetics by combining the tripartite
model of attitude and SOR framework. In their research, perceived web aesthetics serve as the
stimuli, affective changes and cognitive reactions serve as the organism, and conative
inclinations serve as the response. According to their research, perceived web aesthetics
encourage consumers to change their affective and cognitive attitude, influencing consumers’
purchase behavior. Lee, Ha, and Widdows (2011) adapted the SOR framework to explore
consumer responses to high-technology products. They proposed that high-technology product

8
attributes will elicit consumers’ cognitive and affective attitudes, contributing to their approach-
avoidance behavior.
The scope of stimulus, organism, and response is flexible; a user of the SOR framework
should choose variables to represent stimulus, organism, and response based on his or her
research questions and context. Many researchers use features of products to represent stimulus.
However, stimulus is not limited to tangible and intangible features of a product. Anything that
provokes action can be considered stimulus variables (Bagozzi, 1986). Kim and Lennon (2010)
used amount of information to represent the stimulus, perceived risk and satisfaction to represent
the organism, and intention to revisit and purchase intention to represent the response. Fang
(2012) considered sellers’ online interactivity strategies as the stimulus and discussed its effect
on perceived diagnosticity and deception, affecting consumers’ transaction intention. However,
greater attention should be paid to social environmental stimuli (Kawaf & Tagg, 2012) such as
word of mouth and social influence of friends and relatives.
Initial Trust Building Theory
McKnight et al. (1998) and McKnight, Choudhury, and Kacmar (2002) proposed the
initial trust building model, explaining the trust building mechanism and the role of trust in
affecting behavioral intention as follows:
Trust building levers Trust in vendorTrust intention
Trust building levers refer to some environmental or personal factors that help build trust. They
used disposition to trust and institution-based trust to represent trust building levers. Trust
intentions refer to intention to engage in trust related behaviors and are positively related with
trust related behaviors such as adoption and purchase (McKnight et al., 2002). According to the
model, disposition to trust and institution-based trust each have a positive effect on trust belief

9
and in turn, affects trust intention. McKnight et al. (2002) suggested that trust plays a central role
in helping consumers overcome the uncertainty and risk of purchasing from online sellers and
encourages consumers to adopt e-commerce. They applied the initial trust building model to e-
commerce and tested the items they proposed to measure disposition to trust, institution-based
trust, trusting belief, and trust intention. They found that disposition to trust is positively related
to both trust belief and institution-based trust. Trust belief then positively affects individuals’
trusting intention.
Multi-Stage Decision Making Model
Dewey (1910) first proposed the multi-stage buying decision process that includes
problem/need recognition, information searching, alternatives evaluation, purchase decision, and
post purchase behavior. Consumers’ decision making processes start when they recognize the
need to purchase a product or service. They will search for initial information to help reduce the
number of products or services from which to choose into a reasonable number of alternatives.
More detailed information is then sought about each alternative to facilitate the final selection.
Simon (1960) proposed the Intelligence-Design-Choice (IDC) model that is similar to the
Dewey (1910) buying decision process. According to Simon’s model, an individual goes through
three stages during the decision process: intelligence gathering, design, and choice (Simon,
1960). Simon viewed individuals’ decision making as information processing. In order to make a
wise decision, individuals should search environment for information to make a decision. Then,
they design possible alternatives with information they obtain and consider the consequences of
each alternatives. Simon (1960) posited that individuals have limited ability to process
knowledge, and thus a satisficing decision is acceptable. Individuals will compare of each
alternative and choose one.

10
A similar model of decision making is proposed by Bruyn and Lilien (2008). The model
includes three stages: awareness, interest, and final decision. In the awareness stage, people
become aware of the existence of an object because of exposure to the object or having received
information about the object from the external environment. After becoming aware of the object,
individuals will search for information to see whether the object meets their needs. During this
stage, they will distinguish alternatives to the object and search for more detailed information.
With the information they obtain, they become more knowledgeable of the object. Their
knowledge will then be used to evaluate the object and its alternatives. After the evaluation, they
will make a final selection of either the original object or one of its alternatives.
General speaking, there are three stages in the consumer decision making process, which
are awareness, information searching, and decision making. However, as Kotler and Keller
(2008) said, consumers do not need to move through every stage of the decision making process.
For example, a person with higher personal innovativeness or who has received strong positive
word of mouth from friends or relatives may decide to adopt the innovation without searching
for more information, thus bypassing that stage.
Summary
Adoption of innovation is a process involving persuasive communication and learning
(Lee & Xia, 2011), and social cognitive theory focuses on individual learning (Carillo, 2012).
Thus, social cognitive theory is used as the overarching theory to explore the relationship
between consumer learning and adoption of innovation. Social cognitive theory emphasizes the
bidirectional relationships among environmental, personal, and behavioral factors (Carillo,
2012). In this research, we follow the logic of environmental factorspersonal
factorsbehavioral factors, which is also supported by stimulus-organism-response framework.

11
The stimulus-organism-response framework suggests that an individual will change his/her
affective and cognitive status after he/she is exposed to environmental stimulus, and thereafter
affect his/her behavioral factors. In addition, initial trust building theory and multi-stage decision
making theory support links among model constructs. Initial trust building theory emphasizes the
importance of trust in affecting consumers’ behavioral intention while multi-stage decision
making theory supports the importance of information searching in consumers’ decision making
process.
Research Model and Hypotheses Development
Research Model
We use social cognitive theory and the SOR framework as the overarching theories for
our model that is proposed by combining multi-stage decision making theory and initial trust
building theory with social cognitive theory and the SOR framework (Figure 1). In this model,
exposure to mobile payments serves as the initiation of consumer learning. If an individual is
interested in mobile payments, he or she will search for information to reduce his or her
uncertainty about mobile payments and evaluate the pros and cons of them. Based on past
literature, we define uncertainty about mobile payments as a consumer’s perceived risk because
of confusion and lack of knowledge about them (Lin & Nguyen, 2011; Pavlou et al., 2007).
Exposure to mobile payments, perceived uncertainty, and information searching will then affect
consumers’ trust in mobile payments, affecting their behavioral intention. Definitions of
variables in this research are summarized in Table 2.

12
Figure 1. Trust Building in the Consumer Learning Process
Table 2. Definitions of Variables
Hypotheses Development
Consequences of exposure to mobile payments.
Exposure refers to “the degree to which an individual has acquired or exchanged
information about the technology and its usage” (Khalifa, Cheng, & Shen, 2012, p. 15).
Exposure to word of mouth, advertising, promotion or press coverage are methods by which
consumer’s interest may be elevated (Kulkarni, Kannan, & Moe, 2012). Awareness and interest
Variable Definition Source(s)
Word of mouth Informal communication among consumers about mobile payments.
e.g., Liu, 2006
Social influence The extent to which consumers perceive that important others (e.g., family and friends) believe they should use a particular technology such as mobile payments.
e.g., Venkatesh et al., 2012
Media usage The extent to which messages regarding mobile payments are transmitted through mass media such as television, newspapers, magazines, radio, and the Internet.
e.g., Wei et al., 2011
Information searching The process by which individuals seek information about mobile payments.
e.g., Browne, Pitts, & Wetherbe, 2007
Trust in mobile payments
The belief that mobile payments have characteristics that would benefit the individual.
e.g., McKnight et al.,1998
Uncertainty A consumer’s perceived risk because of confusion and lack of information about mobile payments.
e.g., Antioco and Kleijnen (2010); Lin and Nguyen (2011)
Behavioral intention Consumers’ intention to use or continue using mobile payments.
e.g., Venkatesh et al., 2012
Organism
H8: +
H7: +
H6: -
H5: +
H4: -
H3: +
H1: +
H2: -
Exposure
Uncertainty
Trust
Information Searching
Behavioral Intention
Stimulus Response

13
about new technology may occur after consumers are exposed to information about it (Yoo,
2008). Consumers will benefit from information searching no matter whether they have prior
knowledge or not (Kulkarni, Kannan, & Moe, 2012). Individuals do not simply respond to
environmental influences, but also actively seek and interpret information (Nevid, 2009). After
consumers become aware of and interested in new technology, they are motived to search for
more information about it before making an adoption decision (Bruyn & Lilien, 2008). The
positive relationship between exposure to information about mobile payments and information
searching is supported by multi-stage decision making models, according to which individuals
will search for additional information to evaluate alternatives before making a final decision
(Bruyn & Lilien, 2008; Dewey, 1910; Simon, 1960).
Hypothesis 1. Exposure to information regarding mobile payments will encourage
consumers to search for additional information about mobile payments.
Information asymmetry is an important reason of perceived uncertainty (Datta &
Chatterjee, 2008). Uncertainty exists because consumers do not have adequate information and
knowledge on which to act (Kim & Han, 2009; Kwon, Choi, & Kim, 2007). For example, they
do not know whether mobile payments are operable and whether service providers will behave
opportunistically. Exposure to mobile payments, the degree to which an individual has been
exposed to information about mobile payments and their usage (Khalifa et al., 2012), reduces the
information asymmetry. With repeated exposures to information regarding mobile payments,
consumers’ perceived uncertainty is reduced (Lee, 2001).
In this research, exposure to mobile payments is composed of positive word of mouth,
implicit and explicit social influence, and mass media. Exposure to mobile payments is one of
14
the most commonly employed mechanisms for reducing uncertainty (Bradac, 2001; Weick,
1995). The positive relationship between exposure to information regarding mobile payments
and perceived uncertainty can be explained in several reasons. First, Allsop (2007) posited that
mass media, social influence, and word of mouth serve as antecedents of firm reputation. Firm
reputation is a valuable asset and is important for companies to achieve success (Chandra et al.,
2010). It takes time for firms to build reputation, but reputation is easy to lose (Kartalia, 2000).
Mobile payment service providers will strive to avoid behaving opportunistically to the detriment
of consumers and to perform actions as expected by consumers in order to retain or improve firm
reputation necessary for business success. Thus, consumers may believe that mobile payment
service providers that have a better reputation will be less likely to behave opportunistically,
making their future behaviors more predictable. Datta and Chatterjee (2008) posited that
perceived uncertainty reflects the extent to which mobile payment service providers’ future
behaviors are unpredictable. Hence, exposure to mobile payments will increase consumers’
perceived reputation of mobile payments service providers and thereafter reduces consumers’
uncertainty about them.
In addition, through repeated exposure to mobile payments, consumers build a
framework and understanding of mobile payments and the related ecosystem (Gefen, 2000). This
helps consumers explicate their expectation of operability of mobile payments and future
behavior of mobile payment service providers. Thus, exposure to mobile payments increases
consumers’ familiarity with mobile payments (Gursoy, 2001). Familiarity will reduce
consumers’ perceived uncertainty toward an object, and this negative relationship is well
supported by past literature. Gulati (1995) concluded that familiarity helps consumers reduce
uncertainty by telling them what to expect. Gefen (2000) posited that familiarity can reduce

15
perceived uncertainty by allowing consumers to generate a knowledge structure. Lee (2001) and
Zhou and Nakamoto (2007) also posited that familiarity is negatively related to perceived
uncertainty. Thus, it is anticipated that exposure to information regarding mobile payments will
increase consumers’ familiarity with them and thereafter reduce consumers’ perceived
uncertainty about them.
Hypothesis 2. Exposure to information regarding mobile payments will reduce
consumers’ uncertainty about mobile payments.
Wang (2012) posited that mobile marketers should manage positive assessments of
mobile payments by increasing consumers’ media exposure to them, and consumers will
perceive mobile payments as available alternative if they are exposed to various advertising and
publicity messages. Repeated exposure to mobile payments will remind consumers of mobile
payment service providers and mobile payments services, increasing consumers’ familiarity with
mobile payments. People tend to trust an object with which they are familiar (Siau & Shen,
2003). Thus, repeated exposure to information regarding mobile payments will increase
familiarity with mobile payments and encourage them to trust mobile payments (Gefen, 2000;
Moorthy & Hawkins, 2005).
Zuckers (1986) suggested that characteristics-based trust is an important mode for
building trust. Chandra et al. (2010) posited that perceived reputation of mobile payment service
providers will encourage consumers to trust in mobile payments. Exposure to mobile payments
helps consumers build an image of mobile payment service provider reputation. For example,
word of mouth is closely related to consumers’ perception of firm reputation. Positive word of
mouth will increase consumers’ perceived firm reputation, and negative word of mouth will

16
reduce consumers’ perceived firm reputation (Allsop, 2007). However, for the purpose of this
study, we are looking at positive outcomes. In this research, positive word of mouth but not
negative word of mouth is included as a component of exposure to mobile payments. Positive
word of mouth is a socially generated signal of product or service (Amblee & Bui, 2011). Mobile
payment users convey their positive feelings about mobile payments to their friends and
relatives, increasing people’s perceived reputation of mobile payments. Reputation serves as a
trust signal and will have a positive relationship with consumers’ trust in mobile financial service
(Chandra et al., 2010; Flavia’n et al., 2006; Kim, Shin, & Lee, 2009).
With exposure to mobile payments, consumers are passively informed of the
characteristics of mobile payments (Valck, van Bruggen, & Wierenga, 2009; Wang, 2012). For
example, mobile marketers use mass media to attract consumers by providing them with
information on advantages of products or services (Wei et al., 2011). Consumers become aware
of the advantages and the disadvantages involved with mobile payments and know more about
how to protect themselves when they use mobile payments. This reduces consumers’ perceived
risk of using mobile payments. Reduction of perceived risk has a positive relationship with
consumers’ trust in mobile payments (Chandra et al., 2010). In view of these, we posit that:
Hypothesis 3. Exposure to information regarding mobile payments will help encourage
consumers to trust mobile payments.
Predictors of trust in mobile payments.
Uncertainty about mobile payments is exacerbated by mobile technology. Mobile
payments are built on wireless networks that are vulnerable for attack, increasing the level of
uncertainty for consumers (Zhou, 2013). Trust is the expectation that a party will not behave

17
opportunistically to the detriment of another (Bunduchi, 2005). Trust has generally been defined
in terms of perception of certainty, and uncertainty reduction is required to build trust (Koljatic
& Silva, 2008). Thus, reduction of perceived uncertainty should improve consumers’ trust of
mobile payments. Past literature supports the negative relationship between perceived
uncertainty and trust (Dainton & Aylor, 2001; Datta & Chatterjee, 2008; Holmes & Rempel,
1987; Planalp et al., 1988). Kwon and Suh (2004) posited that perceived uncertainty in trading
relationships will decrease trust. Wang and Benbasat (2008) suggested that reduction of
uncertainty applies to the early stages of trust formation. Datta and Chatterjee (2008) posited that
consumers tend to reduce their trust in an object if they are not sure of what to expect from it.
Sales literature also describes uncertainty as a factor that directly affects trust development
(Mallin, O’Donnell, & Hu, 2010). This negative link between perceived uncertainty and trust is
also supported by theories such as knowledge-based affect theory (Demerath, 1993) and the
theory of motivation (Turner, 1988), according to which perceived uncertainty has a negative
relationship with trust.
The negative relationship between perceived uncertainty and trust can be explained in
several approaches. First, perceived uncertainty will increase consumers’ doubt regarding mobile
payment service providers’ ability to help consumers complete a transaction (Nicolaou, Ibrahim,
& Heck, 2013), which is an important factor affecting consumers’ trusting in mobile payments
(McKnight et al., 1998, 2002). Thus, perceived uncertainty will decreasing consumers’ trust in
mobile payments. In addition, perceived uncertainty will cause anxiety of using mobile payments
(Asveld & Roeser, 2009). For example, consumers may be concerned regarding possible money
loss if they make mistakes that they cannot correct. With anxiety in mind, consumers are less
likely to trust in innovations such as mobile payments (Hwang & Kim, 2007). Moreover,

18
perceived uncertainty reflects consumers’ perceived risk of mobile payments (Lin & Nguyen,
2011). Perceived risk is an antecedent of trust as concluded by Mitchell (1999). Thus, perceived
uncertainty will negatively affect consumers’ trust in mobile payments.
Hypothesis 4. Consumers’ uncertainty about mobile payments will decrease their trust
in mobile payments.
Information searching is the process by which individuals seek information about using
mobile payments (Browne, Pitts, & Wetherbe, 2007). It is possible that consumers will get
exposed to both positive and negative information regarding mobile payments during their
information searching process. However, we focus on positive outcomes of information
searching because consumers prefer to attribute other individuals’ failure to internal factors while
attributing their success to external factors (Zuckerman, 1979). Consumers may believe that bad
things that happen to other individuals will not happen to themselves. Thus, negative information
regarding mobile payments may not significantly affect consumers’ cognitive and affective
status.
Individuals rely on information searching to reduce uncertainty and increase trust
(Flanagin, 2007). Consumers trust in mobile payments because they know about them (Lin &
Nguyen, 2011). On the contrary, they do not tend to trust mobile payments if they lack
information regarding them. Through information searching, consumers obtain needed
information, which is an important prerequisite to trust (Flavia’n et al., 2006). For example, they
can search for information about characteristics of mobile technology that include perceived
environmental risk and structural assurance and characteristics of service providers such as the
reputation of service providers. Chandra et al. (2010) posited that these characteristics of mobile

19
payments and service providers have a positive relationship with consumers’ trust in mobile
payments. Thus, information searching is anticipated to increase consumers’ trust in mobile
payments.
Trust reflects an individual’s positive expectation toward another party’s future behavior
(Mayer et al., 1995). Knowledge about another party is required to predict the behavior of other
party (Doney et al., 1998). Consumers accumulate trust-relevant knowledge about mobile
payment through information searching (Komiak & Benbasat, 2006). Consumers will use the
information and knowledge they obtain through information searching to predict performance of
mobile payments in the future and evaluate whether mobile payments will operate stably (Doney
& Cannon, 1997). Additionally, during information searching, consumers can determine the
nature of mobile payments, how to use them, when to use them, and what the expected benefits
and potential risks are. This is referred as familiarity, which is “experience with the what, who,
how, and when of what is happening” (Gefen et al. 2003, p.63). Thus, information searching will
increase consumers’ familiarity with mobile payments (Gefen et al., 2003). Familiarity has a
positive relationship with consumers’ trust in mobile payments. This is well supported by past
literature (Bhattacherjee, 2002; Gefen, 2000; Komiak & Benbasat, 2006). Komiak and Benbasat
(2006) separated trust to cognitive trust and emotional trust and concluded that familiarity has a
positive relationship with both. Hence, information searching increases consumers’ familiarity
with mobile payments and thereafter encourages consumers to trust in mobile payments.
Hypothesis 5. Consumers’ information searching will increase their trust in mobile
payments.
Predictors of consumers’ behavioral intention.

20
There is a high level of uncertainty associated with mobile payments (Zhou, 2014). Users
may be exposed to risk related to mobile payments if they decide to adopt mobile payments
(Yang et al., 2012). People tend to avoid uncertainty (Baldwin, 1992; Hofstede, 1980, 1991,
2001). An increase in uncertainty will lead to a decrease in consumers’ acceptance of mobile
payments (Berger & Calabrese, 1975). People are less likely to adopt and use an innovation if
they do not like it. Thus, perceived uncertainty is anticipated to have a negative relationship with
consumers’ intention to use mobile payments. This relationship is supported by past literature.
Mallat (2007) suggested that perceived uncertainty has a negative relationship with adoption of
innovations. Au and Kauffman (2008) also posited that consumers tend to have a higher level of
perceived uncertainty if there are too many competing plans and providers of mobile payments,
and that uncertainty will slow down technology adoption among consumers.
Uncertainty reflects consumers’ concern about their exposure to risk and potential loss.
This may include concerns that the service providers will misuse their personal information or
that the system may be unstable or inoperable, preventing successful completion of the
transaction (Nicolaou et al., 2013). Thus, uncertainty is likely to be accompanied by negative
emotions such as anxiety (Asveld & Roeser, 2009; Karahanna et al., 1999), worry (Alaszewski,
& Coxon, 2009), and fear (Demerath, 1993). Anxiety, worry, and fear will reduce consumers’
self-efficacy of using an innovation such as mobile payments (Bandura, 1986; Kwang & Kim,
2007), which in turn, decrease consumers’ intention to use (Ajzen, 1991). Adding to the negative
effect of these concerns on behavioral intention is consumers’ own subjective probability of
suffering loss (Chiles & McMackin, 1996). Thus, the perceived risk is amplified, negatively
affecting consumers’ intention to use mobile payments (Yang, et al., 2012). In addition, because

21
people try to avoid behavior that invokes anxious feelings (Compeau & Higgins, 1995), concerns
are negatively associated with consumers’ behavioral intention.
Hypothesis 6. Consumers who perceive more uncertainty about mobile payments will
be less likely to use mobile payments.
Past research has identified many factors affecting technology acceptance, one of which
is trust in IT innovations. Consumers are more willing to conduct payments with trustworthy
channels (Mallat, 2007). The relationship between trust and behavioral intention is supported by
both the initial trust building theory and empirical research. According to the initial trust building
theory, trust belief toward a behavior will have a positive relationship with trust behavior such as
adoption of mobile payments in this research (McKnight et al., 1998, 2002). Past research
posited that consumers’ trust in mobile payments affects their behavioral intention directly and
indirectly through mediators. Chandra et al. (2010) suggested that consumers’ trust in mobile
payment affects their behavioral intention directly and indirectly through perceived usefulness
and ease of use. In addition, Lu et al. (2011) posited that trust affects consumers’ behavioral
intention directly and indirectly through perceived risk and relative advantage.
Trust in mobile payments reflects consumers’ expectation that mobile payment service
providers will provide services that securely and successfully meet their needs (Shin, 2009).
People will not use mobile payments if they think that service providers are not customer service
oriented. Trust is particularly important when it comes to financial services because consumers
worry about money loss (Coleman, 1990). In addition to financial concerns, the infrastructure
that facilitates mobile payments is itself often a concern for consumers (Zhou, 2014). People tend
to avoid risk and use trustworthy innovations. Trust helps reduce consumers’ fears and worries

22
about potential loss that may happen because of their usage of mobile payments (Gefen et al.,
2003; McKnight et al., 2002), thus reducing the perceived risks of mobile payments. Perceived
risk has a negative relationship with consumers’ intention to use mobile payments (Shin, 2009).
Thus, trust reduces consumers’ perceived risk about mobile payments and encourage them to use
mobile payments.
Hypothesis 7. Consumers’ trust in mobile payments will increase their intent to use
mobile payments.
Information searching is an important stage of the consumer decision making process,
and consumers search for information before they make a decision (Bruyn & Lilien, 2008;
Dewey, 1910; Simon, 1960). There are several barriers to consumers’ adoption and use of
mobile financial services such as value, risk, and image barriers (Laukkanen & Kiviniemi, 2010).
These barriers reflect consumers’ concern as to whether the innovation is easy to use, useful, and
secure. Information regarding an innovation such as mobile payments will help consumers
overcome these acceptance barriers (Laukkanen & Kiviniemi, 2010). Through information
searching, consumers become more knowledgeable about mobile payments, improving
consumers’ perception of their ability to use mobile payments. This ability, or self-efficacy, is
positively associated to consumers’ intention to use mobile payments (Bandura, 1986). Thus,
information about a product or service serves as a factor affecting its adoption (Pikkarainen et
al., 2004) while lack of information will impede the adoption of an innovation (Kuisma et al.,
2007).
Consumers may obtain both positive and negative information through information
searching. Positive information may encourage consumers to trust mobile payments, but negative

23
information may allow them to learn about problems of mobile payment and thus impede them
to trust mobile payments. However, for the purpose of this study, we are looking at positive
outcomes of information searching as past literature. As a result of information searching,
consumers learn more about the benefits of using mobile payments and form an overall
assessment of the utility of mobile payments based on the information they obtain. This overall
assessment, referred to as perceived value (Zeithaml, 1988), increases the possibility that a
consumer will indicate an intention to use mobile payments (Setterstrom et al., 2013).
Meanwhile, information searching not only increases the quantity of information but improves
the quality of information because consumers can actively target information that fills a
knowledge gap. Information quality has a positive relationship with individuals’ intention to use
mobile payments (DeLone & McLean, 1992, 2003). In addition, information searching refers to
time and energy consumers spend on learning how to use mobile payments in this research,
which is a type of sunk cost (Park et al., 2012). Sunk cost is one component of switching cost,
which will increase consumers’ inertia to make a change and thus encourage them to use or
continue use mobile payments (Polites & Karahanna, 2012). Past research has reached similar
conclusions. For example, Hahn and Kim (2009) posited that consumers’ information search
behavior has a positive relationship with their purchase intention. Thus,
Hypothesis 8. Consumers’ information searching will increase their intent to use
mobile payments.
Methodology
Data Collection

24
A survey based research was used to develop an understanding of consumers’ trust
building in their consumer learning process and its effect on their behavioral intention toward
mobile payments. Two sets of data were collected. The first dataset was collected from general
public in China. Three hundred and forty questionnaires were collected from China. Eighteen
questionnaires were excluded from the dataset as unsuitable for analysis, making the final sample
size 322. In the China dataset, there are 216 respondents who have used mobile payments and
106 respondents who have not used mobile payments. The second dataset was collected from
general public in the U.S. Three hundred and twenty questionnaires were collected from the U.S.
Thirty three questionnaires were excluded during the data screening, making the final sample
size 287. In the U.S. dataset, there are 165 respondents who have used mobile payments and 122
respondents who have not used mobile payments.
In order to make a comparison of the user and the non-user groups and the China and the
U.S. datasets, we randomly selected 106 questionnaires from each group. Hence, we have four
groups: the user group from China, the user group from the U.S., the non-user group from China,
and the non-user group from the U.S. Each group has 106 respondents. Table 3 summarizes the
demographic information of the participants.
Measures
Wherever possible, items were drawn from existing scales. Some minor modifications
were made to the adopted measures. All items are measured on a seven-point Likert scale,
ranging from strongly disagree (1) to strongly agree (7). Because data was collected from both
users and non-users, two versions of the questionnaire were used, targeting users and non-users.
The English instruments were translated into Chinese by following the back translation
approach. In order to test the wording and reliability of the items, a pilot test was conducted

25
using a group of volunteer respondents in China and one English speaking group. Subsequently,
some minor changes were made to the questionnaires that can be found in the Appendix 1
(English version only).
Table 3. Demographic Information
Positive word of mouth was assessed with three items adapted from Alexandrov and
Babakus (2013). Media usage was assessed with seven items adapted from Loibl et al. (2009)
and Wei et al. (2011). Explicit social influence was assessed with three items adapted from
Venkatesh et al. (2012), and implicit social influence was assessed with three items adapted from
Kim et al. (2007). Uncertainty was assessed with four items adapted from Pavlou et al. (2007).
Measure Item
China The U.S.
User group (n=106)
Non-user group (n=106)
User group (n=106)
Non-user group (n=106)
# % # % # % # %
Age
<21 6 5.7 11 10.4 0 0 2 1.9
21-25 58 54.7 54 50.9 20 18.9 24 22.6
26-30 31 29.2 23 21.7 49 46.2 17 16
31-35 9 8.5 11 10.4 35 33 29 27.4
>35 2 1.9 7 6.6 2 1.9 34 21.1
Gender Male 65 61.3 57 53.8 49 46.2 69 65.1
Female 41 38.7 49 46.2 57 53.8 37 34.9
Education background
Some college or less
20 18.9 20 18.9 45 42.5 62 58.5
Bachelor 60 56.6 63 59.4 42 39.6 29 27.4
Master 23 21.7 19 17.9 18 17 12 11.3
PhD or Professional
3 2.8 4 3.8 1 0.9 3 2.8
Time of using mobile payments
(Months)
None N/A N/A 106 100 N/A N/A 106 100
0-6 24 22.6 N/A N/A 17 16 N/A N/A
7-12 18 17.0 N/A N/A 27 25.5 N/A N/A
13-18 20 18.9 N/A N/A 18 17 N/A N/A
>18 44 41.5 N/A N/A 44 41.5 N/A N/A

26
Information searching was assessed with five items adapted from Barki et al. (2007). Trust in
mobile payments was assessed with eight items adapted from Chandra et al. (2010) and Lu et al.
(2011). Intention to use was assessed with three items adapted from Gu et al. (2009), and
intention to continue using was assessed with three items adapted from Venkatesh et al. (2012).
Disposition to trust was assessed with three items adapted from Zhou (2011). Institution-based
trust was assessed with six items adapted from Setterstrom et al. (2013). Perceived ease of use
was assessed with three items adapted from Lin et al. (2011). Perceived usefulness was assessed
with three items adapted from Kim et al. (2010).
According to the initial trust building model (McKnight et al., 1998), disposition to trust
and institution-based trust will affect consumers’ behavioral intention. The technology
acceptance model supports the effect of perceived ease of use and perceived usefulness on
behavioral intention (Lin et al., 2007). Thus, disposition to trust, institution-based trust,
perceived ease of use, and perceived usefulness were used as control variables in this research.
Data Analysis and Results
SmartPLS (Ringle, Wende, & Will, 2005) was used to analyze the data. PLS was chosen
for its ability to handle non-normality in the data, and because the goal of this research is to
explain variance in the outcome variable (Gefen & Straub, 2000). Exposure to mobile payments
was measured using multiple subscales, which are media usage, positive word of mouth, explicit
social influence, and implicit social influence. We condensed exposure to mobile payments using
latent variable scores of the subscales as items of the higher order construct. We first calculated
the latent variable scores of each subscale using SmartPLS, and four latent variable scores were
generated. Then we took these four factor scores as the reflective items for exposure to mobile
27
payments. Latent variable scores have been widely used in prior studies to simplify a research
model (Sun et al., 2012; Williams & Hazer, 1986)
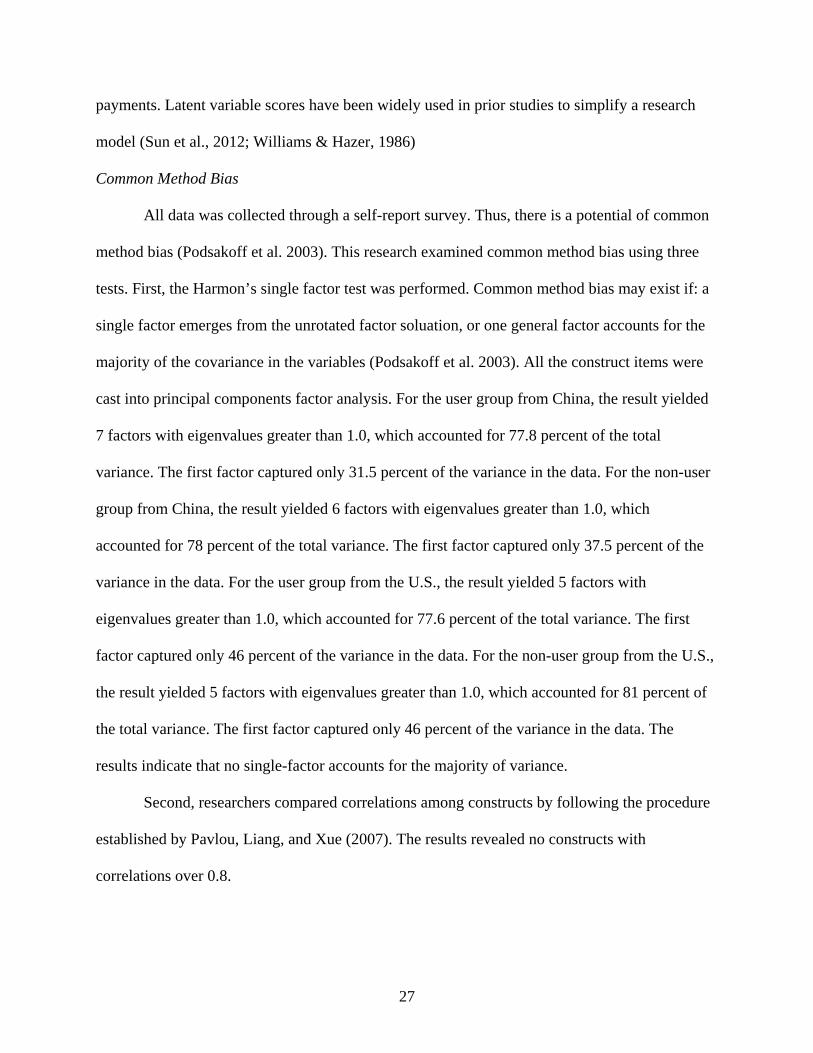
Common Method Bias
All data was collected through a self-report survey. Thus, there is a potential of common
method bias (Podsakoff et al. 2003). This research examined common method bias using three
tests. First, the Harmon’s single factor test was performed. Common method bias may exist if: a
single factor emerges from the unrotated factor soluation, or one general factor accounts for the
majority of the covariance in the variables (Podsakoff et al. 2003). All the construct items were
cast into principal components factor analysis. For the user group from China, the result yielded
7 factors with eigenvalues greater than 1.0, which accounted for 77.8 percent of the total
variance. The first factor captured only 31.5 percent of the variance in the data. For the non-user
group from China, the result yielded 6 factors with eigenvalues greater than 1.0, which
accounted for 78 percent of the total variance. The first factor captured only 37.5 percent of the
variance in the data. For the user group from the U.S., the result yielded 5 factors with
eigenvalues greater than 1.0, which accounted for 77.6 percent of the total variance. The first
factor captured only 46 percent of the variance in the data. For the non-user group from the U.S.,
the result yielded 5 factors with eigenvalues greater than 1.0, which accounted for 81 percent of
the total variance. The first factor captured only 46 percent of the variance in the data. The
results indicate that no single-factor accounts for the majority of variance.
Second, researchers compared correlations among constructs by following the procedure
established by Pavlou, Liang, and Xue (2007). The results revealed no constructs with
correlations over 0.8.

28
Third, the unmeasured latent method construct (ULMC) technique (Liang et al. 2007)
was performed. For the user group from China, the results demonstrate that the average
substantively explained variance of the indicators is 0.698, while the average method-based
variance is 0.015. The ratio of substantive variance to method variance is about 46.5:1. In
addition, the results revealed that 22 method factor loadings (out of 27) were not significant at a
95 percent confidence level. For the non-user group from China, the results demonstrate that the
average substantively explained variance of the indicators is 0.755, while the average method-
based variance is 0.0103. The ratio of substantive variance to method variance is about 73.3:1. In
addition, the results revealed that 24 method factor loadings (out of 27) were not significant at a
95 percent confidence level. For the user group from the U.S., the results demonstrate that the
average substantively explained variance of the indicators is 0.804, while the average method-
based variance is 0.0307. The ratio of substantive variance to method variance is about 26.2:1. In
addition, the results revealed that 23 method factor loadings (out of 27) were not significant at a
95 percent confidence level. For the non-user group, the results demonstrate that the average
substantively explained variance of the indicators is 0.832, while the average method-based
variance is 0.0136. The ratio of substantive variance to method variance is about 61.3:1. In
addition, the results revealed that 22 method factor loadings (out of 27) were not significant at a
95 percent confidence level. Taken together the above results indicate that common method bias
is unlikely to influence the analysis below.
Measurement Model
The control variables do not have significant impact on intention to (continue) use for any
groups, excluding perceived usefulness. Thus, results with perceived usefulness are reported
below. This research adopted the two-stage analytical procedure (Anderson & Gerbing, 1988;

29
Hair et al., 1998). Confirmative factor analysis was first conducted to assess the measurement
model; then, the structural relationships were examined. As shown in Tables 4, 5, 6, and 7,
Cronbach’s alpha ranged from 0.712 to 0.926 for the user group from China, 0.798 to 0.952 for
the non-user group from China, 0.821 to 0.957 for the user group from the U.S., 0.886 to 0.962
for the non-user group from the U.S., providing evidence of measure reliability (Cronbach,
1971). Meanwhile, composite reliability (CR) ranged from 0.825 to 0.947 for the user group
from China, from 0.868 to 0.960 for the non-user group from China, from 0.882 to 0.967 for the
user group from the U.S., and from 0.922 to 0.975 for the non-user group from the U.S.,
indicating valid internal consistency reliability (Chin, 1998). All AVEs are larger than 0.5,
indicating that convergent validity is met (Fornell & Larcker, 1981). Additionally, as shown in
Tables 4, 5, 6, and 7, all squared roots of the AVEs are greater than the correlation shared
between the construct and other constructs in the model. As shown in Tables 8, 9, 10, and 11, all
items load appropriately on their intended construct. All these results indicate discriminant
validity. Jointly, these findings suggest adequate convergent and discriminant validity. We also
investigated the variance inflation factors (VIFs) of all the independent variables. VIF for the
user group from China ranged from 1.361 to 2.627, and VIF for the non-user group from China
ranged from 1.337 to 2.428. VIF for the user group from the U.S. ranged from 1.471 to 3.327,
and VIF for the non-user group from the U.S. ranged from 1.673 to 3.243. None of the VIFs
exceed 10, suggesting that multicollinearity is not a concern (Petter et al. 2007).
Structural Model
The path coefficients and explained variances of the structural model for both groups are
shown in Figure 2 and Figure 3. PLS model does not generate the model fit statistics but uses R2
to assess the explanatory power of a structural model. For the China dataset, the model explained

30
59.7% of the variance in users’ intention to continue using, and 58.5% of the variance in non-
users’ intention to use. For the U.S. dataset, the model explained 69.3% of the variance in users’
intention to continue using, and 67.8% of the variance in non-users’ intention to use. These
statistics validate the predictive power of the model.
Table 4. Measurement Validity for the User Group from China
User Group
R2 CR Cronbach’s AVE EXP INS TR UNC INT PU
EXP N/A 0.825 0.712 0.547 0.739 INS 0.187 0.890 0.847 0.618 0.432 0.786 TR 0.331 0.933 0.917 0.637 0.295 0.194 0.798 UNC 0.001 0.947 0.926 0.818 0.025 0.121 -0.468 0.904 INT 0.597 0.932 0.890 0.820 0.357 0.239 0.496 -0.445 0.906 PU N/A 0.940 0.904 0.840 0.173 0.022 0.339 -0.261 0.658 0.916
Note: Bold diagonal values are the square root of average variance extracted; EXP=exposure, INS=information searching, TR=trust, UNC=uncertainty, INT=intention to continue using, and PU=perceived usefulness. Table 5. Measurement Validity for the Non-User Group from China
Non-User Group
R2 CR Cronbach’s AVE EXP INS TR UNC INT PU
EXP N/A 0.868 0.798 0.624 0.790 INS 0.182 0.921 0.892 0.701 0.427 0.837 TR 0.585 0.922 0.873 0.798 0.368 0.381 0.893 UNC 0.374 0.960 0.952 0.752 0.451 0.427 0.577 0.867 INT 0.066 0.943 0.920 0.806 -0.256 -0.182 -0.424 -0.447 0.898 PU N/A 0.941 0.909 0.842 0.128 0.055 0.583 0.229 -0.286 0.918
Note: Bold diagonal values are the square root of average variance extracted; EXP=exposure, INS=information searching, TR=trust, UNC=uncertainty, INT=intention to use, and PU=perceived usefulness.

31
Table 6. Measurement Validity for the User Group from the U.S.
User Group
R2 CR Cronbach’s AVE EXP INS TR UNC INT PU
EXP N/A 0.882 0.821 0.658 0.811
INS 0.16 0.944 0.927 0.773 0.4 0.879
TR 0.607 0.964 0.957 0.771 0.710 0.470 0.878
UNC 0.115 0.952 0.932 0.832 -0.34 -0.123 -0.472 0.912
INT 0.693 0.967 0.948 0.906 0.595 0.420 0.727 -0.527 0.952
PU N/A 0.900 0.835 0.750 0.369 0.484 0.489 -0.344 0.683 0.866
Note: Bold diagonal values are the square root of average variance extracted; EXP=exposure, INS=information searching, TR=trust, UNC=uncertainty, INT=intention to continue using, and PU=perceived usefulness. Table 7. Measurement Validity for the Non-User Group from the U.S.
Non-User Group
R2 CR Cronbach’s AVE EXP INS TR UNC INT PU
EXP N/A 0.922 0.886 0.748 0.865
INS 0.418 0.960 0.948 0.827 0.647 0.909
TR 0.485 0.965 0.958 0.775 0.608 0.350 0.880
UNC 0.045 0.962 0.947 0.863 -0.213 0.081 -0.458 0.929
INT 0.678 0.975 0.962 0.929 0.624 0.436 0.775 -0.268 0.964
PU N/A 0.949 0.920 0.861 0.459 0.359 0.531 -0.160 0.621 0.928
Note: Bold diagonal values are the square root of average variance extracted; EXP=exposure, INS=information searching, TR=trust, UNC=uncertainty, INT=intention to use, and PU=perceived usefulness.
For the user group from China, the results indicate that exposure to mobile payments has
a positive impact on information searching (b=0.432, p<0.001) and trust (b=0.243, p<0.01) but
does not affect perceived uncertainty, supporting H1 and H3 while not supporting H2.
Uncertainty has a negative relationship with both consumers’ trust in mobile payments (b=-
0.492, p<0.001) and intention to use them (b=-0.265, p<0.001). Thus, H4 and H6 are supported.
Information searching does not affect consumers’ trust but has a positive relationship with their
intention to continue using mobile payments (b=0.231, p<0.01), supporting H8 while not
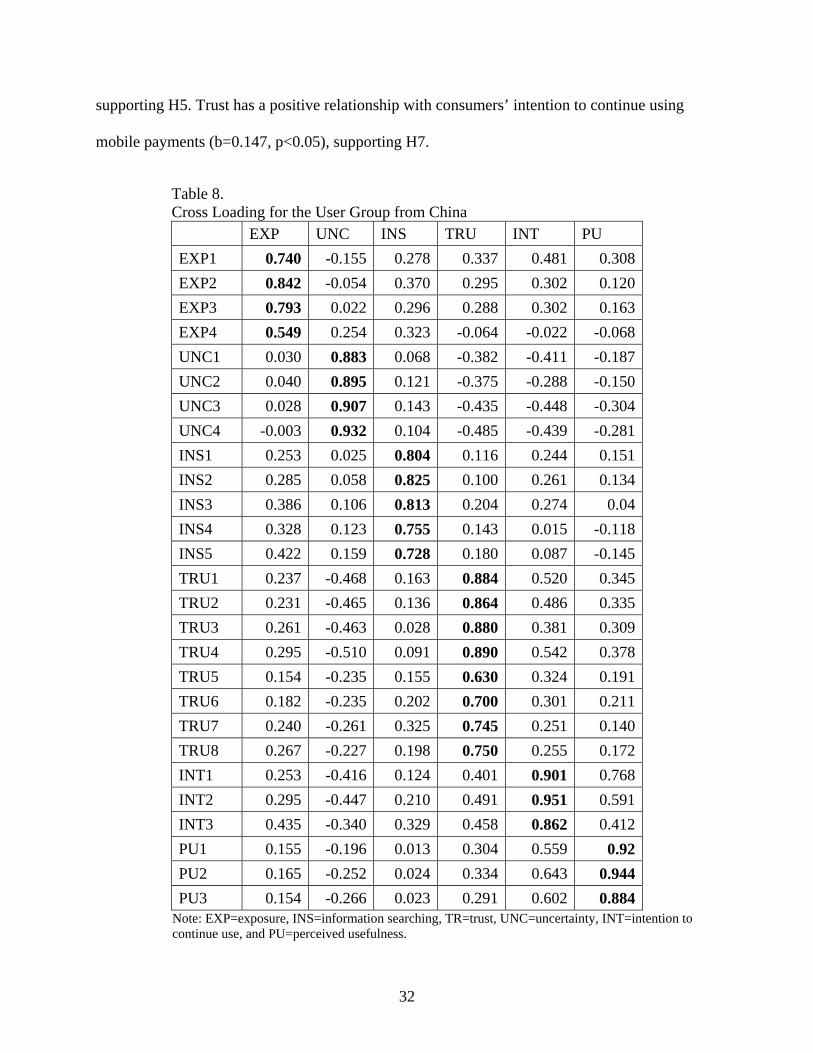
32
supporting H5. Trust has a positive relationship with consumers’ intention to continue using
mobile payments (b=0.147, p<0.05), supporting H7.
Table 8. Cross Loading for the User Group from China
EXP UNC INS TRU INT PU
EXP1 0.740 -0.155 0.278 0.337 0.481 0.308
EXP2 0.842 -0.054 0.370 0.295 0.302 0.120
EXP3 0.793 0.022 0.296 0.288 0.302 0.163
EXP4 0.549 0.254 0.323 -0.064 -0.022 -0.068
UNC1 0.030 0.883 0.068 -0.382 -0.411 -0.187
UNC2 0.040 0.895 0.121 -0.375 -0.288 -0.150
UNC3 0.028 0.907 0.143 -0.435 -0.448 -0.304
UNC4 -0.003 0.932 0.104 -0.485 -0.439 -0.281
INS1 0.253 0.025 0.804 0.116 0.244 0.151
INS2 0.285 0.058 0.825 0.100 0.261 0.134
INS3 0.386 0.106 0.813 0.204 0.274 0.04
INS4 0.328 0.123 0.755 0.143 0.015 -0.118
INS5 0.422 0.159 0.728 0.180 0.087 -0.145
TRU1 0.237 -0.468 0.163 0.884 0.520 0.345
TRU2 0.231 -0.465 0.136 0.864 0.486 0.335
TRU3 0.261 -0.463 0.028 0.880 0.381 0.309
TRU4 0.295 -0.510 0.091 0.890 0.542 0.378
TRU5 0.154 -0.235 0.155 0.630 0.324 0.191
TRU6 0.182 -0.235 0.202 0.700 0.301 0.211
TRU7 0.240 -0.261 0.325 0.745 0.251 0.140
TRU8 0.267 -0.227 0.198 0.750 0.255 0.172
INT1 0.253 -0.416 0.124 0.401 0.901 0.768
INT2 0.295 -0.447 0.210 0.491 0.951 0.591
INT3 0.435 -0.340 0.329 0.458 0.862 0.412
PU1 0.155 -0.196 0.013 0.304 0.559 0.92
PU2 0.165 -0.252 0.024 0.334 0.643 0.944
PU3 0.154 -0.266 0.023 0.291 0.602 0.884 Note: EXP=exposure, INS=information searching, TR=trust, UNC=uncertainty, INT=intention to continue use, and PU=perceived usefulness.

33
Table 9. Cross Loading for the Non-User Group from China
EXP UNC INS TRU INT PU
EXP1 0.830 -0.286 0.324 0.437 0.357 0.164
EXP2 0.876 -0.244 0.377 0.443 0.354 0.06
EXP3 0.767 -0.128 0.257 0.250 0.278 0.230
EXP4 0.671 -0.094 0.388 0.226 0.126 -0.040
UNC1 -0.263 0.930 -0.174 -0.441 -0.382 -0.259
UNC2 -0.274 0.907 -0.186 -0.430 -0.422 -0.240
UNC3 -0.190 0.863 -0.148 -0.367 -0.349 -0.271
UNC4 -0.176 0.890 -0.141 -0.353 -0.364 -0.261
INS1 0.347 -0.173 0.875 0.378 0.326 0.076
INS2 0.353 -0.196 0.879 0.401 0.381 0.137
INS3 0.390 -0.196 0.800 0.248 0.316 0.173
INS4 0.355 -0.108 0.846 0.390 0.304 -0.057
INS5 0.346 -0.086 0.781 0.359 0.260 -0.107
TRU1 0.438 -0.429 0.355 0.897 0.604 0.333
TRU2 0.409 -0.489 0.342 0.926 0.567 0.218
TRU3 0.365 -0.448 0.324 0.913 0.599 0.300
TRU4 0.407 -0.472 0.334 0.910 0.590 0.296
TRU5 0.326 -0.247 0.367 0.757 0.399 0.037
TRU6 0.366 -0.300 0.428 0.806 0.373 0.130
TRU7 0.423 -0.349 0.430 0.884 0.413 0.138
TRU8 0.387 -0.310 0.412 0.828 0.404 0.061
INT1 0.276 -0.361 0.258 0.437 0.893 0.631
INT2 0.387 -0.390 0.329 0.512 0.920 0.556
INT3 0.319 -0.385 0.428 0.595 0.865 0.380
PU1 0.050 -0.214 -0.020 0.151 0.460 0.927
PU2 0.068 -0.156 0.033 0.185 0.440 0.912
PU3 0.199 -0.367 0.113 0.269 0.651 0.914 Note: EXP=exposure, INS=information searching, TR=trust, UNC=uncertainty, INT=intention to use. PU=perceived usefulness.

34
Table 10. Cross Loading for the User Group from the U.S.
EXP UNC INS TRU INT PU
EXP1 0.835 -0.321 0.229 0.575 0.507 0.229 EXP2 0.910 -0.336 0.362 0.674 0.582 0.386 EXP3 0.885 -0.362 0.369 0.640 0.559 0.368 EXP4 0.570 0.048 0.376 0.353 0.178 0.155 UNC1 -0.274 0.889 -0.071 -0.388 -0.457 -0.267 UNC2 -0.351 0.917 -0.165 -0.442 -0.465 -0.374 UNC3 -0.272 0.897 -0.079 -0.421 -0.509 -0.282 UNC4 -0.336 0.944 -0.126 -0.468 -0.492 -0.327 INS1 0.255 -0.132 0.870 0.343 0.342 0.497 INS2 0.362 -0.147 0.896 0.443 0.388 0.520 INS3 0.326 -0.114 0.863 0.388 0.333 0.427 INS4 0.447 -0.121 0.894 0.481 0.431 0.358 INS5 0.332 -0.020 0.872 0.382 0.330 0.341 TRU1 0.657 -0.549 0.423 0.905 0.706 0.478 TRU2 0.647 -0.516 0.455 0.932 0.694 0.489 TRU3 0.604 -0.472 0.426 0.915 0.683 0.481 TRU4 0.623 -0.459 0.452 0.892 0.713 0.473 TRU5 0.445 -0.155 0.301 0.681 0.320 0.184 TRU6 0.645 -0.322 0.380 0.880 0.607 0.391 TRU7 0.643 -0.374 0.448 0.909 0.663 0.447 TRU8 0.691 -0.357 0.388 0.885 0.608 0.400 INT1 0.556 -0.483 0.384 0.695 0.953 0.696 INT2 0.536 -0.503 0.389 0.661 0.965 0.675 INT3 0.608 -0.520 0.425 0.718 0.937 0.578 PU1 0.176 -0.185 0.314 0.307 0.412 0.762 PU2 0.342 -0.318 0.455 0.379 0.628 0.918 PU3 0.395 -0.358 0.463 0.548 0.685 0.909
Note: EXP=exposure, INS=information searching, TR=trust, UNC=uncertainty, INT=intention to continue use, and PU=perceived usefulness.

35
Table 11. Cross Loading for the Non-User Group from the U.S.
EXP UNC INS TRU INT PU
EXP1 0.877 -0.256 0.524 0.539 0.486 0.329
EXP2 0.945 -0.191 0.573 0.609 0.632 0.450
EXP3 0.832 -0.229 0.473 0.500 0.562 0.440
EXP4 0.797 -0.051 0.675 0.444 0.471 0.37
UNC1 -0.220 0.938 0.043 -0.433 -0.246 -0.184
UNC2 -0.199 0.944 0.047 -0.469 -0.259 -0.173
UNC3 -0.188 0.928 0.132 -0.398 -0.277 -0.157
UNC4 -0.183 0.906 0.083 -0.399 -0.210 -0.071
INS1 0.590 0.130 0.913 0.262 0.347 0.369
INS2 0.617 0.019 0.906 0.331 0.437 0.379
INS3 0.520 0.160 0.902 0.225 0.325 0.352
INS4 0.603 0.077 0.930 0.342 0.390 0.265
INS5 0.594 0.011 0.894 0.401 0.456 0.280
TRU1 0.617 -0.397 0.340 0.907 0.662 0.456
TRU2 0.562 -0.479 0.304 0.918 0.682 0.486
TRU3 0.531 -0.462 0.259 0.924 0.641 0.476
TRU4 0.556 -0.411 0.292 0.926 0.704 0.472
TRU5 0.339 -0.354 0.285 0.749 0.522 0.339
TRU6 0.554 -0.276 0.396 0.854 0.765 0.531
TRU7 0.547 -0.369 0.317 0.863 0.742 0.501
TRU8 0.537 -0.476 0.271 0.888 0.711 0.458
INT1 0.597 -0.257 0.438 0.726 0.969 0.602
INT2 0.555 -0.208 0.414 0.711 0.971 0.597
INT3 0.646 -0.304 0.407 0.798 0.951 0.595
PU1 0.375 0.003 0.350 0.397 0.481 0.927
PU2 0.383 -0.129 0.345 0.453 0.550 0.948
PU3 0.497 -0.273 0.311 0.594 0.664 0.908 Note: EXP=exposure, INS=information searching, TR=trust, UNC=uncertainty, INT=intention to use. PU=perceived usefulness.
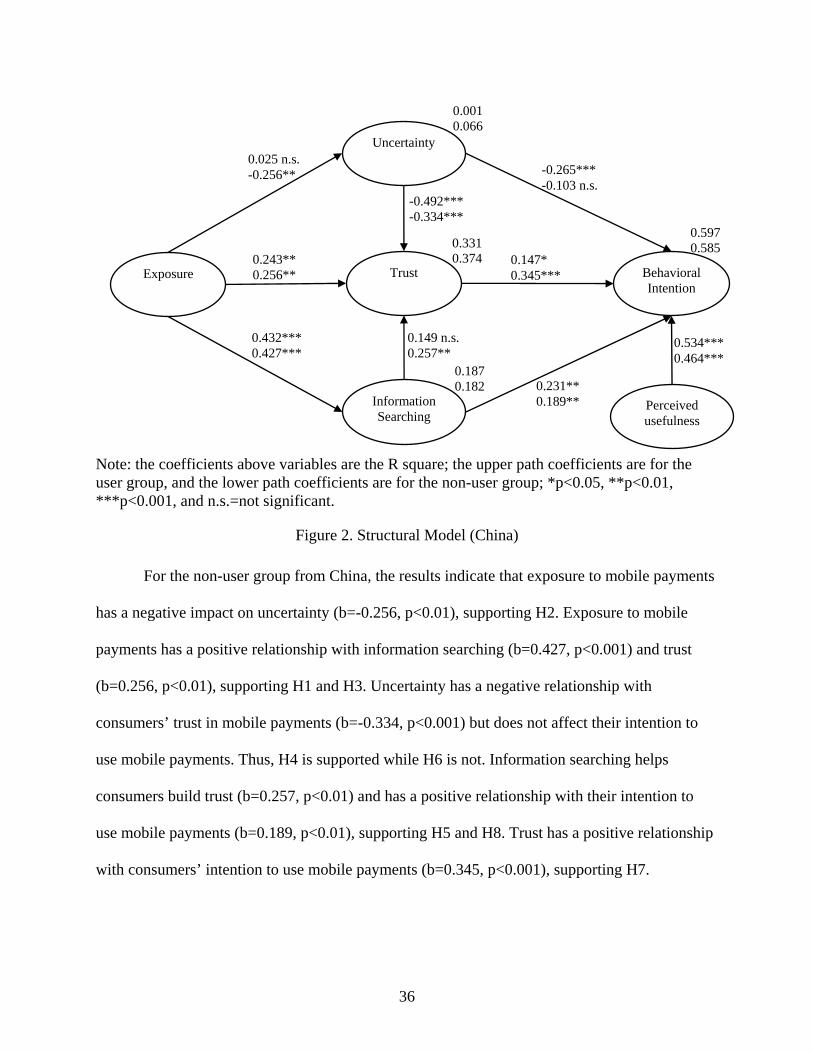
36
Note: the coefficients above variables are the R square; the upper path coefficients are for the user group, and the lower path coefficients are for the non-user group; *p<0.05, **p<0.01, ***p<0.001, and n.s.=not significant.
Figure 2. Structural Model (China)
For the non-user group from China, the results indicate that exposure to mobile payments
has a negative impact on uncertainty (b=-0.256, p<0.01), supporting H2. Exposure to mobile
payments has a positive relationship with information searching (b=0.427, p<0.001) and trust
(b=0.256, p<0.01), supporting H1 and H3. Uncertainty has a negative relationship with
consumers’ trust in mobile payments (b=-0.334, p<0.001) but does not affect their intention to
use mobile payments. Thus, H4 is supported while H6 is not. Information searching helps
consumers build trust (b=0.257, p<0.01) and has a positive relationship with their intention to
use mobile payments (b=0.189, p<0.01), supporting H5 and H8. Trust has a positive relationship
with consumers’ intention to use mobile payments (b=0.345, p<0.001), supporting H7.
0.147* 0.345***
-0.492*** -0.334***
0.001 0.066
0.149 n.s. 0.257**
0.597 0.585
0.187 0.182
0.331 0.374
0.025 n.s. -0.256**
0.243** 0.256**
0.432*** 0.427***
-0.265*** -0.103 n.s.
0.231** 0.189**
0.534*** 0.464***
Exposure Trust
Information Searching
Behavioral Intention
Uncertainty
Perceived usefulness

37
Note: the coefficients above variables are the R square; the upper coefficients are for the user group, and the lower coefficients are for the non-user group; *p<0.05, **p<0.01, ***p<0.001, and n.s.=not significant.
Figure 3. Structural Model (the U.S.)
For the user group from the U.S., the results indicate that exposure to mobile payments
has a negative impact on uncertainty (b=-0.34, p<0.001), supporting H1. Exposure to mobile
payments has a positive relationship with information searching (b=0.400, p<0.001) and trust
(b=0.529, p<0.001), supporting H2 and H3. Uncertainty has a negative relationship with
consumers’ trust in mobile payments (b=-0.265, p<0.001), and information searching has a
positive relationship with consumers’ trust in mobile payments (b=0.226, p<0.01). Thus, H4 and
H5 are supported. In addition, uncertainty (b=-0.176, p<0.01) and trust (b=0.449, p<0.001) has a
significant relationship with consumers’ intention to continue using mobile payments, but
information searching does not affect consumers’ intention to continue using mobile payments.
Thus, H6 and H7 are supported but H8 is not.
0.449*** 0.616***
-0.265*** -0.358***
0.115 0.045
0.226** 0.061n.s.
0.693 0.678
0.160 0.418
0.607 0.485
-0.340*** -0.213*
0.529*** 0.492***
0.400*** 0.647***
-0.176** 0.046 n.s.
-0.010n.s. 0.124 *
0.407*** 0.256**
Exposure Trust
Information Searching
Behavioral Intention
Uncertainty
Perceived usefulness

38
For the non-user group from the U.S., the results indicate that exposure to mobile
payments has a negative impact on uncertainty (b=-0.213, p<0.05), supporting H1. Exposure to
mobile payments has a positive relationship with trust (b=0.492, p<0.001) and information
searching (b=0.647, p<0.001), supporting H2 and H3. Uncertainty has a negative relationship
with non-users’ trust in mobile payments (b=-0.358, p<0.001) but does not affect non-users’
intention to use mobile payments. Thus, H4 is supported but H6 is not. Information searching has
a positive relationship with non-users’ intention to use mobile payment (b=0.124, p<0.05) but
does not affect non-users’ trust in mobile payments, supporting H8 but not H5. In addition, non-
users’ trust in mobile payments is positively related to their intention to use mobile payments
(b=0.616, p<0.001). Thus, H7 is supported. The results of the hypotheses testing are summarized
in Table 12.
Multi Group Analysis
In the structural model, the path coefficients vary across the user and the non-user groups
and across China and the U.S. A multi group analysis was performed with PLS to test whether
these differences are significant (Chin, 2000; Keil et al., 2000).
Table 12. Summary of Hypotheses Tests
Hypotheses China The U.S.
Users Non-Users Users Non-users
H1. Exposure Information Searching Supported Supported Supported Supported
H2. Exposure Uncertainty Not Supported Supported Supported Supported
H3. Exposure Trust Supported Supported Supported Supported
H4. Uncertainty Trust Supported Supported Supported Supported
H5. Information Searching Trust Not supported Supported Supported Not supported
H6. Uncertainty Behavioral Intention Supported Not supported Supported Not supported
H7. Trust Behavioral Intention Supported Supported Supported Supported
H8. Information Searching Behavioral Intention
Supported Supported Not supported
Supported
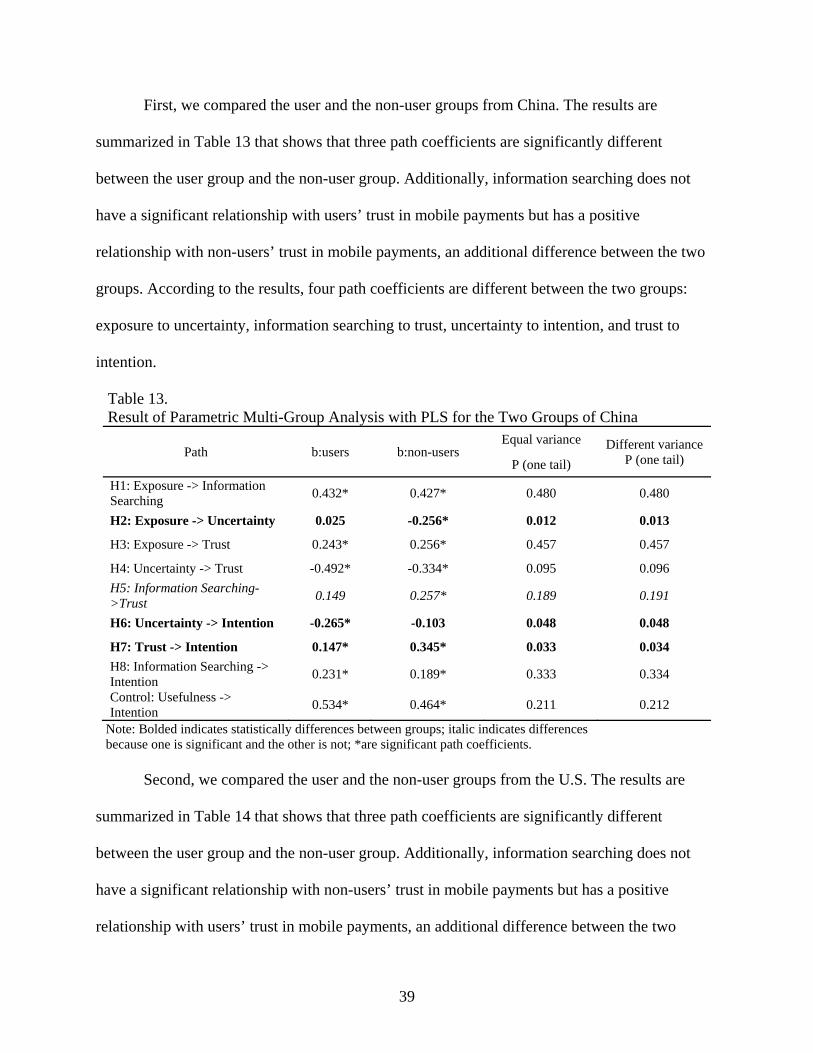
39
First, we compared the user and the non-user groups from China. The results are
summarized in Table 13 that shows that three path coefficients are significantly different
between the user group and the non-user group. Additionally, information searching does not
have a significant relationship with users’ trust in mobile payments but has a positive
relationship with non-users’ trust in mobile payments, an additional difference between the two
groups. According to the results, four path coefficients are different between the two groups:
exposure to uncertainty, information searching to trust, uncertainty to intention, and trust to
intention.
Table 13. Result of Parametric Multi-Group Analysis with PLS for the Two Groups of China
Path b:users b:non-users Equal variance Different variance
P (one tail) P (one tail)
H1: Exposure -> Information Searching
0.432* 0.427* 0.480 0.480
H2: Exposure -> Uncertainty 0.025 -0.256* 0.012 0.013
H3: Exposure -> Trust 0.243* 0.256* 0.457 0.457
H4: Uncertainty -> Trust -0.492* -0.334* 0.095 0.096
H5: Information Searching->Trust
0.149 0.257* 0.189 0.191
H6: Uncertainty -> Intention -0.265* -0.103 0.048 0.048
H7: Trust -> Intention 0.147* 0.345* 0.033 0.034
H8: Information Searching -> Intention
0.231* 0.189* 0.333 0.334
Control: Usefulness -> Intention
0.534* 0.464* 0.211 0.212
Note: Bolded indicates statistically differences between groups; italic indicates differences because one is significant and the other is not; *are significant path coefficients. Second, we compared the user and the non-user groups from the U.S. The results are
summarized in Table 14 that shows that three path coefficients are significantly different
between the user group and the non-user group. Additionally, information searching does not
have a significant relationship with non-users’ trust in mobile payments but has a positive
relationship with users’ trust in mobile payments, an additional difference between the two

40
groups. According to the results, four path coefficients are different between the two groups:
exposure to information searching, information searching to trust, uncertainty to intention, and
information searching to intention.
Table 14. Result of Parametric Multi-Group Analysis with PLS for the Two Groups of the U.S.
Path b:users b:non-users Equal variance Different variance
P (one tail) P (one tail)
H1: Exposure -> Information Searching 0.4* 0.647* 0.014 0.014
H2: Exposure -> Uncertainty -0.340* -0.213* 0.166 0.167
H3: Exposure -> Trust 0.529* 0.492* 0.383 0.383
H4: Uncertainty -> Trust -0.265* -0.358* 0.187 0.188H5: Information Searching->Trust 0.226* 0.061 0.063 0.064
H6: Uncertainty -> Intention -0.176* 0.046 0.002 0.002
H7: Trust -> Intention 0.449* 0.616* 0.107 0.108H8: Information Searching -> Intention -0.010 0.124* 0.042 0.043Control: Usefulness -> Intention 0.407* 0.256* 0.085 0.086
Note: Bolded indicates statistically differences between groups; italic indicates differences because one is significant and the other is not; *are significant path coefficients. Third, we compared the user groups from China and the U.S. The results are summarized
in Table 15 that shows that five path coefficients are significantly different across the user
groups from China and the U.S. Additionally, information searching does not have a significant
relationship with users’ trust in mobile payments but has a positive relationship with non-users’
trust in mobile payments, an additional difference across the two groups. According to the
results, six path coefficients are different between the two groups: exposure to uncertainty,
exposure to trust, uncertainty to trust, information searching to trust, information searching to
intention, and trust to intention.

41
Table 15. Result of Parametric Multi-Group Analysis with PLS for Users of China and the U.S.
Path b:Users
from China
b:Users from the U.S.
Equal variance Different variance
P (one tail) P (one tail)
H1: Exposure -> Information Searching
0.432* 0.400* 0.395 0.395
H2: Exposure -> Uncertainty
0.025 -0.340* 0.002 0.002
H3: Exposure -> Trust 0.243* 0.529* 0.004 0.005
H4: Uncertainty -> Trust -0.492* -0.265* 0.007 0.008H5: Information Searching->Trust
0.149 0.226* 0.242 0.243
H6: Uncertainty -> Intention
-0.265* -0.176* 0.173 0.174
H7: Trust -> Intention 0.147* 0.449* 0.007 0.007H8: Information Searching -> intention
0.231* -0.010 0.004 0.004
Control: Usefulness -> Intention
0.534* 0.407* 0.097 0.098
Note: Bolded indicates statistically differences between groups; italic indicates differences because one is significant and the other is not; *are significant path coefficients. Finally, we compared the non-user groups from China and the U.S. The results are
summarized in Table 16 that shows that five path coefficients are significantly different between
the user group and the non-user group. Additionally, information searching does not have a
significant relationship with trust of non-users’ from the U.S. but has a positive relationship with
trust of non-users’ from China, an additional difference between the two groups. According to
the results, six path coefficients are different between the two groups: exposure to information
searching, exposure to trust, information searching to trust, uncertainty to intention, trust to
intention, and perceived usefulness to intention.

42
Table 16. Result of Parametric Multi-Group Analysis with PLS for Non-Users of China and the U.S.
Path b:Non-
users from China
b:Non-users from the U.S.
Equal variance Different variance
P (one tail) P (one tail)
H1: Exposure -> Information Searching
0.427* 0.647* 0.018 0.019
H2: Exposure -> Uncertainty
-0.256* -0.213* 0.370 0.371
H3: Exposure -> Trust 0.256* 0.492* 0.045 0.045
H4: Uncertainty -> Trust -0.334* -0.358* 0.426 0.426H5: Information Searching->Trust
0.257* 0.061 0.052 0.053
H6: Uncertainty -> Intention
-0.103 0.046 0.031 0.032
H7: Trust -> Intention 0.345* 0.616* 0.013 0.014H8: Information Searching -> Intention
0.189* 0.124* 0.227 0.228
Control: Usefulness -> Intention
0.464* 0.256* 0.020 0.021
Note: Bolded indicates statistically differences between groups; italic indicates differences because one is significant and the other is not; *are significant path coefficients.
Discussion
Key Findings
Overall, all eight hypotheses are fully or partially supported. The results of our study
provide insight into the importance of exposure to mobile payments and its relationship with
consumers’ trust in mobile payments and behavioral intention toward mobile payments.
Considering the complexity of the hypotheses testing and multi-group comparisons, we
summarized the results of hypotheses testing and multi-group analysis in Tables 17, 18, 19, and
20. In these tables, differential impact across groups refers to one of the two conditions: one
coefficient is significant while the other is not, no matter whether the difference is statistically
significant; or the difference across the two groups is statistically different. Meanwhile, same
impact across groups means that both coefficients are significant or insignificant and there is no

43
statistically difference across the two groups. In addition, the significant column for “differential
impact across groups” refers to the difference across the two groups is statistically significant
and the not significant column refers to the difference is insignificant. The significant column for
“same impact across groups” refers to both path coefficients are significant while the not
significant column refers to both are insignificant. Stronger influence for the user group means
the absolute path coefficient of the user group is larger than that of the non-user group while
stronger influence for the non-user group means the absolute path coefficient of the non-user
group is larger than that of the user group.
Table 17. Summary of Testing Results for the Two Groups from China
Type of Hypothesis
Significant Not Significant
Different path coefficients
across groups
Stronger Influence for the User Group
H6: Uncertainty -> Behavioral Intention
N/A
Stronger Influence for the Non-User Group
H2: Exposure -> Uncertainty H7: Trust -> Behavioral Intention
H5: Information searching->Trust
Path coefficients that have no difference
H1: Exposure -> Information searching H3: Exposure -> Trust H4: Uncertainty -> Trust H8: Information searching -> Behavioral Intention Control: Usefulness->Behavioral Intention
N/A
Influence of Exposure to Mobile Payments
Our results reveal two consequences of exposure to mobile payments: increased
information searching and trust in mobile payments. This finding is supported by the multi-stage
decision making models. Consumers will search for information after they become aware of the
need to make a final decision or solve a problem such as whether to adopt mobile payments

44
(Bruyn & Lilien, 2008; Dewey, 1910; Simon, 1960). The findings suggest that consumers who
have more exposure to mobile payments are more likely to search for information about mobile
payments than those who have less exposure to mobile payments.
Table 18. Summary of Testing Results for the Two Groups from the U.S.
Type of Hypothesis
Significant Not Significant
Different path coefficients
across groups
Stronger Influence for the User Group
N/A H5: Information searching->Trust H6: Uncertainty -> Behavioral Intention
Stronger Influence for the Non-User Group
H1: Exposure -> Information searching
H8: Information searching -> Behavioral Intention
Path coefficients that have no difference
H2: Exposure -> Uncertainty H3: Exposure -> Trust H4: Uncertainty -> Trust H7: Trust -> Behavioral Intention Control: Usefulness->Behavioral Intention
N/A
Table 19. Summary of Testing Results for the Two User Groups
Type of Hypothesis
Significant Not Significant
Different path coefficients
across groups
Stronger Influence for the Users Group from China H4: Uncertainty -> Trust H8: Information searching -> Behavioral Intention
N/A
Stronger Influence for the User Group from the U.S. H2: Exposure -> Uncertainty H3: Exposure -> Trust H7: Trust -> Behavioral Intention
H5: Information searching->Trust
Path coefficients that have no difference
H1: Exposure -> Information Searching H6: Uncertainty -> Behavioral Intention Control: Usefulness->Behavioral Intention
N/A

45
Table 20. Summary of Testing Results for the Two Non-User Groups
Type of Hypothesis
Significant Not Significant
Different path coefficients
across groups
Stronger Influence for the Non-User Group from China
Control: Usefulness->Behavioral Intention
H5: Information Searching->Trust H6: Uncertainty -> Behavioral Intention
Stronger Influence for the Non-User Group from the U.S. H1: Exposure -> Information Searching H3: Exposure -> Trust H7: Trust -> Behavioral Intention
N/A
Path coefficients that have no difference
H2: Exposure -> Uncertainty H4: Uncertainty -> Trust H8: Information searching -> Behavioral Intention
N/A
Results show that exposure to mobile payments will encourage consumers to trust in
them. This finding is consistent with social cognitive theory (Bandura, 1977b, 1986). Exposure
to mobile payments pertains to environmental factors while trust pertains to personal factors.
According to social cognitive theory, environmental factors will directly affect consumers’
personal factors (Bandura, 1977b, 1986). Siau and Shen (2003) emphasized the importance of
convincing consumers to use mobile payment by demonstrating features such as convenience
and cost efficiency and thereafter affecting consumers’ trust. Exposure to mobile payments
serves as mechanisms to convey relevant information to consumers, encouraging them to trust in
mobile payments.
There are some differences between users and non-users. Path comparisons indicate that
the path between exposure to mobile payments and perceived uncertainty is negatively
significant for Chinese non-users, but not for Chinese users. One possible explanation is that
users have already formed an opinion that is not variable. External influences such as exposure to

46
mobile payments no longer affect them (or, are ignored) and thus cannot affect their perceived
uncertainty. However, non-users lack of information about mobile payments and use exposure to
mobile payments as a source of information, helping them decrease their uncertainty.
The results suggest that American non-users’ exposure to mobile payments has a stronger
influence than American users’ exposure to mobile payments on their information searching.
Users have past experience of using mobile payments, and generally speaking, they know more
about mobile payments than non-users (Venkatesh, 2012), reducing their dependence on
searching for information to make final decisions than non-users.
When we statistically compared our results across the Chinese and American
respondents, the differences became apparent. The results indicate that the path between
exposure to mobile payments and perceived uncertainty is negatively significant for American
users, but not for Chinese users. In addition, American users’ exposure to mobile payments has a
stronger influence than Chinese users’ exposure to mobile payments on their trust in mobile
payments. These two findings can be explained from the perspective of one dimension of nation
cultures: high and low context cultures. Exposure in high-context cultures such as China is
implicit and indirect while exposure in low-context cultures such as the U.S. is more direct, less
implicit, and more informative (Singh, Zhao, & Hu, 2005). Thus, we can expect that the U.S.
exposure has a stronger influence than that of China on consequences of exposure to mobile
payments.
Antecedents of Trust in Mobile Payments
Exposure to mobile payments serves as a predictor of consumers’ trust in mobile
payments, which has been discussed above. Our results pertaining to the relationship between
perceived uncertainty and trust also warrant some discussions. Non-users who have a higher
47
level of uncertainty are less likely to trust mobile payments but exposure reduces uncertainty for
this group. This finding is consistent with the findings of Wang and Benbasat (2008), who
suggested that reduction of uncertainty applies to the early stage of trust formation. Meanwhile,
results indicate that users’ perceived uncertainty also reduces their trust in mobile payments.
Thus, reduction of uncertainty also applies to trust formation in the post adoption stage.
Path comparisons indicate that the path between information searching and trust is
positively significant for Chinese non-users, but not for Chinese users. However, oppositely, the
path between information searching and trust is positively significant for American users, but not
for American non-users. One possible reason is the different level of information searching for
Chinese users, Chinese non-users, American users, and American non-users. A t-test was
performed to test whether the mean of information searching is different between American
users and Chinese users and between American non-users and Chinese non-users. Results
indicate that the American user group (mean=4.75, Std=1.284) has a higher level of information
searching than Chinese user group (mean=4.23, Std=1.314). Thus, this could explain the finding
that the path between information searching and trust is significant for American users, but not
for Chinese users. In addition, consumers rely on trust-relevant knowledge about the trustee to
build their expectation toward the trustee’s future behavior (Komiak & Benbasat, 2006). Chinese
non-users are more familiar with mobile payments than American non-users (MasterCard, 2014).
Compared with Chinese non-users, American non-users may have less knowledge to organize
the information they find to evaluate operability of mobile payments. Thus, American non-users’
information searching may not affect their trust in mobile payments.
The results also find that Chinese users’ perceived uncertainty has a stronger negative
influence than American users’ perceived uncertainty on their trust in mobile payments. This is

48
related to the impact of uncertainty avoidance. Individuals from China have a higher level of
uncertainty avoidance than individuals from the U.S. (Singh et al., 2005). This means that
Chinese users will perceive a higher level of perceived risk than that of American users under a
given level of uncertainty. Therefore, Chinese users are less likely to trust mobile payments than
American users under the certain level of perceived uncertainty.
Antecedents of Behavioral Intention
Our results show that consumers’ trust in mobile payments increases their intention to
(continue to) use mobile payments. Our finding of the positive relationship between trust and
behavioral intention is supported by the initial trust building theory, according to which
consumers’ trust in an object will increase the likelihood of engaging with that object (McKnight
et al., 1998, 2002). Similar results can be found in Lu et al. (2011) and Zhou (2014), who posited
that consumers’ trust in mobile payments positively affects their intention to use mobile
payments.
Path comparisons suggest that the path between perceived uncertainty and behavioral
intention is negatively significant for Chinese and American users, but not for Chinese and
American non-users. This reflects that non-users are willing to try mobile payments even though
they feel uncertain about them. We tested whether trust serves as a mediator between uncertainty
and non-users’ intention to use mobile payments. According to the results of the Sobel tests, trust
fully mediates the relationship between uncertainty and non-users’ intention to use mobile
payments (China: Sobel statistics= -2.738, P-value<0.01; the U.S.: Sobel statistics= -3.44, P-
value<0.001).
The results also indicate that Chinese non-users’ trust in mobile payments has a stronger
influence than Chinese users’ trust in mobile payments on their behavioral intention. The

49
importance of trust depends on the degree of perceived risk (Coleman, 1990), and thus, the less
the perceived risk, the less the effect of trust on behavioral intention. Mobile payment users
learned how to protect their properties during the prior usage of mobile payments, reducing their
perceived risk of using mobile payments. Thus, the relationship between users’ trust on
behavioral intention is weaker than that of non-users.
In addition, the path between information searching and behavioral intention is positively
significant for American non-users, but not for American users. We tested whether trust serves as
a mediator between American users’ information searching and their behavioral intention.
According to the results of the Sobel tests, trust fully mediates the relationship between
American users’ information searching and their intention to continue using mobile payments
(Sobel statistics=2.584, P-value<0.01).
There are also some differences across Chinese and American consumers. The results
show that American users’ and non-users’ trust in mobile payments has a stronger positive
influence than Chinese users’ and non-users’ trust on their behavioral intention. Yoon (2009)
posited that the degree of uncertainty avoidance negatively moderates the relationship between
trust and behavioral intention. The higher the level of uncertainty avoidance, the lower the effect
of trust on behavioral intention. Chinese consumers have a higher level of uncertainty avoidance
than American consumers (Singh et al., 2005). Thus, the relationship between trust and
behavioral intention of American consumers is stronger than that of Chinese consumers.
Limitations
As with all research, there are some limitations that should be considered when
interpreting the results. First, the data was collected by using a self-report survey. Hence there is
potential for common method biases (Podsakoff et al., 2003). However, common method bias is

50
not a significant problem as shown by testing. Second, exposure to mobile payments explains
only a small amount of the variance of consumers’ uncertainty. Future research is needed to
explore the sources of consumers’ perceived uncertainty and ways to reduce it. Third, the limited
source and special characteristics of the sample restrict the generalization of the findings in this
research. However, most of our respondents are in their 20s or 30s, two age groups who are more
willing to adopt mobile payments than other age groups (Scevak, 2010).
Implications for Theory
This research explores the similarities and differences across adoption and post adoption.
Past research has suggested that predictors of adoption and post adoption are different
(Limayem, at al., 2007; Setterstrom et al., 2013). However, there are variables that can be used to
predict both. Anderson (1991) argues that affective states, attitudes, and belief are not replaced
by new information; rather, new attitudes and beliefs are formed by integrating old attitudes and
beliefs with new information. Thus, consumers update their trust in mobile payments during their
learning process. This research finds that exposure to mobile payments, perceived uncertainty,
information searching, and trust in mobile payments can be used to predict both adoption and
post adoption behavior. Moreover, past research focuses on changes in significance of path
coefficient between adoption and post adoption while ignoring the differences in the strength of
relationships (Setterstrom et al., 2013). Our research explores the difference in the strength of
relationships across the user and the non-user groups thus extending the body of knowledge of
technology acceptance.
Few past literature performs cross-culture research of mobile payments acceptance. This
research chose China and the U.S. to represent the eastern and western cultures, respectively.
This research explores the similarities and differences across Chinese and American consumers.

51
The results suggest that consumers’ exposure to mobile payments will attract their attentions and
encourage them to search for information of mobile payments. Exposure to mobile payments and
perceived uncertainty about mobile payments each have a significant relationship with
consumers’ trust in mobile payments, which, in turn, increases Chinese and American
consumers’ intention to use mobile payments. We also found several differences across the
Chinese and American consumers as shown in Tables 19 and 20. This research serves as
foundation of cross-culture research on mobile payments acceptance.
This research also contributes to trust building research. We explore the trust building
during the consumer learning process. Consumer learning is separated into active and passive
learning, which are represented by exposure to mobile payments and information searching,
respectively. We then use exposure to mobile payments and information searching to predict
consumers’ trust in mobile payments. Past literature views trust as a reducer of uncertainty
(Pavlou et al., 2007). However, Bandura (1977b, 1986) suggested that there is a dual relationship
between environmental factors and personal factors. This research explores the effect of
uncertainty on trust because our focus is trust building. Results indicate that exposure to mobile
payments and perceived uncertainty serve as antecedents to consumers’ trust in mobile
payments.
Additionally, our results indicate that consumers’ information searching will have a
positive relationship with their trust and behavioral intention. In this research, we discussed the
importance of information searching before consumers make adoption or post adoption decisions
and found that information searching is needed to encourage consumers to accept mobile
payments. Information searching refers to time and energy consumers spent on learning how to
use mobile payments in this research, which is a type of sunk cost (Park et al., 2012). Sunk cost

52
is one component of switching cost, which will increase consumers’ inertia to make a change and
thus encourage them to use or continue use mobile payments (Polites & Karahanna, 2012).
Implications for Practice
This research provides mobile payments vendors with some suggestions on how to attract
non-users and retain users. Vendors should increase consumers’ exposure to mobile payments
because it will encourage consumers to search for information and to trust mobile payments. For
example, mobile payment service providers can give users an incentive to encourage them to
recommend mobile payments to their friends. Wechat mobile payments, remote mobile
payments based on the instant messaging app called Wechat, launched a marketing initiative
called “Qiang hongbao” to attract non-users during the 2014 Chinese Spring Festival. Users of
Wechat mobile payments can send out digital money parcels to their friends who also use
Wechat. The amount of money in those digital parcels are randomly decided by the Wechat
system. The more digital parcels people grab, the more money they receive. However, they must
create a Wechat mobile payment account and link credit or debit cards to it before they may
receive the money. Wechat mobile payments increased their market share with this initiative
(Liao & Li, 2014).
Importantly, uncertainty will reduce consumers’ trust in mobile payments. Thus, vendors
need to investigate sources of consumers’ uncertainty, and take steps to reduce it. Mallat (2007)
posited that perceived risk is the most important barrier to adopting mobile payment services.
About 75% of consumers worry about security and transaction risks of mobile payments (Lu et
al., 2011). Some mobile payment service providers cooperate with insurance companies and
purchase insurance for their users to protect their transactions.

53
Meanwhile, vendors should realize the differences between users and non-users in their
decision making process and develop different marketing tactics. There are two common
differences between users and non-users for both China and the U.S. consumers. First, perceived
uncertainty does not affect non-users’ adoption but has a negative relationship with users’ post
adoption. Thus, vendors need to explore the sources of users’ uncertainty, and design marketing
messages that can help reduce users’ uncertainty. Second, non-users’ trust in mobile payments
has a stronger influence than users’ trust in mobile payments on consumers’ behavioral intention
toward mobile payments. Vendors should show non-users how they protect consumers’ property
and rights to encourage non-users to trust mobile payments. Some examples of trust building
mechanisms are company reputation, structural assurance, information quality, and system
quality (Chandra, et al., 2010; Zhou, 2011). There are also some differences across users and
non-users which can be found in Tables 13 and 14. For example, for Chinese consumers,
exposure to mobile payments is effective in reducing non-users’ perceived uncertainty. However,
they are usually less interested in messages about mobile payments than users. Thus, vendors
need to consider how to attract the attention of non-users.
Vendors, especially international mobile payment service providers such as PayPal,
should realize the cultural differences across Chinese and American consumers in their decision
making process. First, American consumers’ exposure to mobile payments has a stronger
influence than that of Chinese consumers on their trust in mobile payments. Thus, vendors
should explore the most effective structure of exposure mechanisms and adapt their marketing
tactics to the relevant market to help consumers build trust in mobile payments. Second, trust and
perceived usefulness play an important role in affecting consumers’ adoption and usage
decisions. However, American consumers’ trust in mobile payments has a stronger influence

54
than that of Chinese consumers on their intention to use mobile payments while Chinese
consumers’ perceived usefulness has a stronger influence than that of American consumers on
their intention to use them. Thus, in order to achieve success in markets such as China and the
U.S., vendors should address trust building and transmission of information about usefulness of
mobile payments. However, vendors should emphasize the importance of trust building
mechanisms when they enter a market such as the U.S., and they should emphasize the
importance of perceived usefulness when they enter a market such as China.
Conclusion
Trust is a powerful factor influencing consumers’ willingness to use mobile payments
(Duane et al., 2014). This research explores consumers’ trust building in the consumer learning
process and its effect on their behavioral intention toward mobile payments. We developed a
model suggesting that exposure to mobile payments encourages consumers to search for
information and build trust in mobile payments, which in turn affects their behavioral intention.
This research verifies the vital role of consumer learning in building trust and encouraging
consumers to engage in mobile payments.
We also explore what characteristics differentiate users and non-users and differentiate
American and Chinese consumers. When we compared our results across the user and non-user
groups and across American and Chinese consumers, the similarities and differences in the
cognitive processes involved for adoption and post adoption became apparent. The results
provide vendors with suggestions on how to attract non-users and retain users and how to adapt
their marketing tactics to achieve success in the U.S. and China. The research is the foundation
of an understanding of the effect of culture on mobile payments acceptance, and deepens our
understanding of how consumer learning, represented as exposure to mobile payments and

55
information searching, can be used to help consumers build trust and encourage them to accept
mobile payments.
Reference
Ajzen, I. (1991). The theory of planned behavior. Organizational Behavior and Human
Decision Processes, 50 (2), 179–211.
Alaszewski, A., & Coxon, K. (2009). Uncertainty in everyday life: Risk, worry, and trust.
Health, Risk, & Society, 11(3), 201-207.
Alexandrov, A., Lilly, B., & Babakus, E. (2013). The effects of social- and self-motives on the
intentions to share positive and negative word of mouth. Journal of the Academic
Marketing Science, 41(5), 531-546.
Allsop, D.T., Bassett, B.R. and Hoskins, J.A. (2007). Word-of-mouth research: Principles and
applications. Journal of Advertising Research, 47(4), 398-411.
Amblee, N., & Bui, T. (2011). Harnessing the influence of social proof in online shopping: The
effect of electronic word of mouth on sales of digital microproducts. International
Journal of Electronic Commerce, 16(2), 91-113.
Anderson, J. C., & Gerbing, D. W. (1988). Structural equation modeling in practice: A review
and recommended two-step approach. Psychological Bulletin, 103(3), 411-423.
Anderson, N. H. (1991). A cognitive theory of judgment and decision. In N.H. Anderson (ed.),
Contributions to information integration theory (Vol. 1: Cognition, pp. 105–144).
Hillsdale, NJ: Lawrence Erlbaum.
Antioco, M., & Kleijnen, M. (2010). Consumer adoption of technological innovations: Effects
of psychological and functional barriers in a lack of content versus a presence of content
situation. European Journal of Marketing, 44(11/12), 1700-1724.
Arvidsson, N. (2014). Consumer attitudes on mobile payment services-results from a proof of
concept test. International Journal of Bank Marketing, 32(2), 150-170.
Asveld, L., & Roeser, S. (2009). The ethics of technological risk. London, UK: Earthscan.
Au, Y. A., & Kauffman, R. J. (2008). The economics of mobile payments: Understanding
stakeholder issues for an emerging financial technology application. Electronic
Commerce Research and Applications, 7, 141-164.

56
Bagozzi, R. P. (1983). A holistic methodology for modeling consumer response to innovation.
Operations Research, 31(1), 128-176.
Bagozzi, R. P. (1986). Principles of marketing management. Chicago, IL: Science Research
Association.
Baldwin, M. W. (1992). Relational schemas and the processing of social information.
Psychological Bulletin, 112, 461-484.
Bandura, A. (1977a). Self-efficacy: Toward a unifying theory of behavioral change.
Psychological Review, 84(2), 191-215.
Bandura, A. (1977b). Social learning theory. Englewood Cliffs, NJ: Prentice-Hall.
Bandura, A. (1986). Social foundations of thought and action: A social cognitive theory.
Englewood Cliffs, NJ: Prentice-Hall.
Bandura, A. (1988). Organizational applications of social cognitive theory. Australian Journal
of Management, 13(2), 275-302.
Barki, H., Titah, R., & Boffo, C. (2007). Information system use-related activity: An
expanded behavioral conceptualization of individual-level information system use.
Information Systems Research, 18, 2, 173-192.
Berger, C. R., & Calabrese, R. (1975). Some explorations in initial interaction and beyond:
Toward a developmental theory of interpersonal communication. Human Communication
Research, 1, 99-112.
Bhattacherjee, A. (2002). Individual trust in online firm: Scale development and initial test.
Journal of Management Information Systems, 19(1), 211–241.
Bradac, J. J. (2001). Theory comparison: Uncertainty reduction, problematic integration,
uncertainty management, and other curious construct. Journal of Communication, 51(3),
456-476.
Browne, G. J., Pitts, M. G., & Wetherbe, J. C. (2007). Cognitive stopping rules for terminating
information search in online tasks. MIS Quarterly, 31(1), 89-104.
Bruyn, A. D., & Lilien, G. L. (2008). A multi-stage model of word-of-mouth influence
through viral marketing. International Journal of Research in Marketing, 25, 151-163.
Bui, M., Krishen, A. S., & Bates, K. (2011). Modeling regret effects on consumer post-
purchase decisions. European Journal of Marketing, 45(7/8), 1068-1090.
Bunduchi, R. (2005). Business relationships in Internet-based electronic markets: The role of
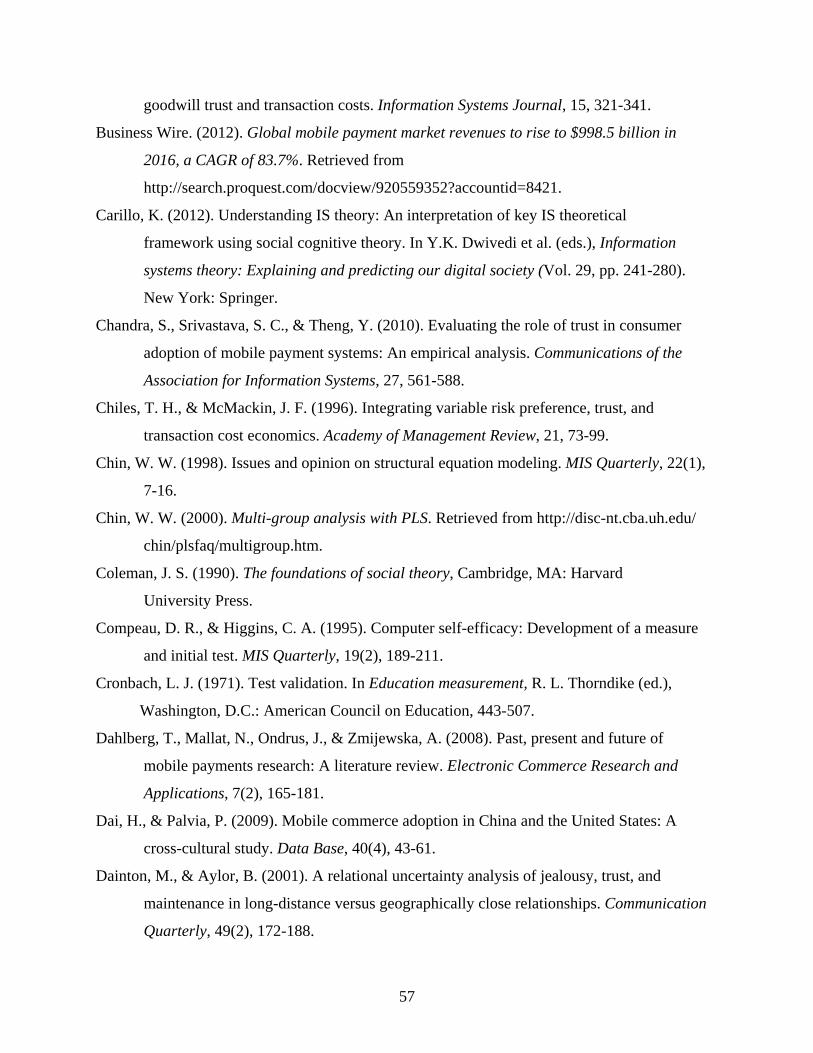
57
goodwill trust and transaction costs. Information Systems Journal, 15, 321-341.
Business Wire. (2012). Global mobile payment market revenues to rise to $998.5 billion in
2016, a CAGR of 83.7%. Retrieved from
http://search.proquest.com/docview/920559352?accountid=8421.
Carillo, K. (2012). Understanding IS theory: An interpretation of key IS theoretical
framework using social cognitive theory. In Y.K. Dwivedi et al. (eds.), Information
systems theory: Explaining and predicting our digital society (Vol. 29, pp. 241-280).
New York: Springer.
Chandra, S., Srivastava, S. C., & Theng, Y. (2010). Evaluating the role of trust in consumer
adoption of mobile payment systems: An empirical analysis. Communications of the
Association for Information Systems, 27, 561-588.
Chiles, T. H., & McMackin, J. F. (1996). Integrating variable risk preference, trust, and
transaction cost economics. Academy of Management Review, 21, 73-99.
Chin, W. W. (1998). Issues and opinion on structural equation modeling. MIS Quarterly, 22(1),
7-16.
Chin, W. W. (2000). Multi-group analysis with PLS. Retrieved from http://disc-nt.cba.uh.edu/
chin/plsfaq/multigroup.htm.
Coleman, J. S. (1990). The foundations of social theory, Cambridge, MA: Harvard
University Press.
Compeau, D. R., & Higgins, C. A. (1995). Computer self-efficacy: Development of a measure
and initial test. MIS Quarterly, 19(2), 189-211.
Cronbach, L. J. (1971). Test validation. In Education measurement, R. L. Thorndike (ed.),
Washington, D.C.: American Council on Education, 443-507.
Dahlberg, T., Mallat, N., Ondrus, J., & Zmijewska, A. (2008). Past, present and future of
mobile payments research: A literature review. Electronic Commerce Research and
Applications, 7(2), 165-181.
Dai, H., & Palvia, P. (2009). Mobile commerce adoption in China and the United States: A
cross-cultural study. Data Base, 40(4), 43-61.
Dainton, M., & Aylor, B. (2001). A relational uncertainty analysis of jealousy, trust, and
maintenance in long-distance versus geographically close relationships. Communication
Quarterly, 49(2), 172-188.

58
Datta, P., & Chatterjee, S. (2008). The economics and psychology of consumer trust in
intermediaries in electronic markets: The EM-trust framework. European Journal of
Information Systems, 17, 12-28.
DeLone, W. H., & McLean, E. R. (1992). Information systems success: The quest for
the dependent variable. Information Systems Research. 3(1), 60-95.
Delone, W. H., & McLean, E. R. (2003). The Delone and Mclean model of information
system success: A ten year update. Journal of Management Information System, 19(4),
31-47.
Demerath, L. (1993). Knowledge-based affect. Social Psychology Quarterly, 56, 136-147.
Dewey, J. (1910). How we think. Boston: D.C. Heath.
Doney, P. M., & Cannon, J. P. (1997). An examination of the nature of trust in buyer-seller
relationships. Journal of Marketing, 61(2), 33-51.
Doney, P. M., & Cannon, J. P. (1998). Understanding the influence of national culture on the
development of trust. Academy of Management Review, 23(3), 601-620.
Duane, A., O’Reilly, P., & Andreev, P. (2014). Realising m-payments: Modelling consumers’
willingness to m-pay using smart phones. Behavior & Information Technology, 33(4),
318-334.
Eroglu, S. A., Machleit, K. A., & Davis, L. M. (2001). Atmospheric qualities of online
retailing: A conceptual model and implications. Journal of Business Research, 54(2),
177-184.
Fang, Y. (2012). Does online interactivity matter? Exploring the role of interactivity strategies
in consumer decision making. Computers in Human Behavior, 28, 1790-1804.
Flanagin, A. J. (2007). Commercial markets as communication markets: Uncertainty reduction
through mediated information exchange in online auctions. New Media & Society, 9 (3),
401-423.
Flavia’n, C., Guinali’u, M., & Gurrea, R. (2006). The role played by perceived usability,
satisfaction and consumer trust on website loyalty. Information & Management, 43, 1-14.
Fornell, C., & Larcker, D. F. (1981). Evaluating structural equation models with unobservable
variables and measurement error. Journal of Marketing Research, 18(1), 39-50.
Fiore, A. M., & Kim, J. (2007). An integrative framework capturing experiential and utilitarian

59
shopping experience. International Journal of Retail & Distribution Management, 35(6),
421-442.
Gefen, D. (2000). E-commerce: The role of familiarity and trust. Omega, 28, 725-737.
Gefen, D., Benbasat, I., & Pavlou, P.A. (2008). A research agenda for trust in online
environments. Journal of Management Information Systems, 24(4), 275-286.
Gefen, D., Karahanna, E., & Straub, D. (2003). Trust and TAM in online shopping: An
integrated model. MIS Quarterly, 27 (1), 51-90.
Gefen, D., & Straub, D. (2000). The relative importance of perceived ease-of-use in IS
adoption: A study of e-commerce adoption. Journal of Association for Information
Systems, 8(1), 1-30.
Gu, J., Lee, S., & Suh, Y. (2009). Determinants of behavioral intention to mobile banking.
Expert Systems with Applications, 36, 11605–11616.
Gulati, R. (1995). Does familiarity breed trust? The implications of repeated ties for
contractual choice in alliances. Academy of Management Journal, 38(1), 85-112.
Gursoy, D. (2001). Development of a travelers’ information search behavior model. Retrieved
from:http://scholar.lib.vt.edu/theses/available/etd12072001175913/unrestricted/gursoy_di
sertation.pdf.
Hahn, K. H., & Kim, J. (2009). The effect of offline brand trust and perceived internet
confidence on online shopping intention in the integrated multi-channel context.
International Journal of Retail & Distribution Management, 37(2), 126-141.
Hair, J. F., Anderson, R. E., Tatham, R. L., & Black, W. C. (1998). Multivariate data
analysis (5th ed.), Englewood Cliffs, NJ: Prentice Hall.
Hofstede, H. (1980). Culture’s consequences: International differences in work-related
values. Beverly Hills, CA: Sage.
Hofstede, H. (1991). Culture and organizations: Software of the mind. London: McGraw-Hill.
Hofstede, H. (2001). Culture’s consequences: Comparing values, behaviors, institutions, and
organization across nations. Beverly Hills, CA: Sage.
Holmes, J.G., & Rempel, J.K. (1989). Trust in close relationships. In C. Hendrick (Ed.), Close
relationships (pp. 187-220). Newbury Park, CA: Sage.
Hwang, Y., & Kim, D. J. (2007). Customer self-service systems: The effects of perceived web

60
quality with service contents on enjoyment, anxiety, and e-trust. Decision Support
Systems, 43, 746-760.
iResearch. (2013). 2012-2013 China mobile payment user behavior report. Retrieved from
http://www.iresearchchina.com/reports/4875.html.
Karahanna, E., Straub, D. W., & Chervany, N. L. (1999). Information technology adoption
across time: A cross-sectional comparison of pre-adoption and post-adoption beliefs. MIS
Quarterly, 23(2), 183-213.
Kartalia, J. (2000). Reputation at risk? Risk Management, (4)7, 51–58.
Kawaf, F., & Tagg, S. (2012). Online shopping environments in fashion shopping: An S-O-R
based review. Marketing Review, 12(2), 161-180.
Keil, M., Tan, B. C. Y., Wei, K., & Saarinen, T. (2000). A cross-cultural study on escalation of
commitment behavior in software projects. MIS Quarterly, 24(2), 299-325.
Khalifa, M., Cheng, S. K. N., & Shen, K. N. (2012). Adoption on mobile commerce: A
confidence model. Journal of Computer Information Systems, 53(1), 14-22.
Kim, B., & Han, I. (2009). What drives the adoption of mobile data services? An approach
from a value perspective. Journal of Information Technology, 24, 36-45.
Kim, C., Jahng, J., Lee, J. (2007). An empirical investigation into the utilization-based
information technology success model: Integrating task-performance and social influence
perspective. Journal of Information Technology, 22,152-162.
Kim, C., Mirusmonov, M., & Lee, I. (2010). An empirical examination of factors influencing
the intention to use mobile payment. Computers in Human Behavior, 26 (3), 310-322.
Kim, G., Shin, B., & Lee, H. G. (2009). Understanding dynamics between initial trust and
usage intentions of mobile banking. Information Systems Journal, 19, 283-311.
Kim, H., & Lennon, S. J. (2010). E-atmosphere, emotional, cognition, and behavioral
response. Journal of Fashion Marketing and Management, 14(3), 412-428.
Koljatic, M., & Silva, M. (2008). Uncertainty reduction mechanisms in cross-sector alliances
in Latin America. Journal of Business Research, 61, 648-650.
Komiak, S. Y. X., & Benbasat, I. (2006). The effects of personalization and familiarity on trust
and adoption of recommendation agents. MIS Quarterly, 30(4), 941-960.
Kotler, P., & Keller, K. L. (2008). Marketing management (13th ed). Englewood Cliffs, NJ:
Prentice Hall.

61
Kulkarni, G., Kannan, P. K., & Moe, W. (2012). Using online search data to forecast new
product sales. Decision Support Systems, 52, 604-611.
Kuisma, T., Laukkanen, T. & Hiltunen, M. (2007). Mapping the reasons for resistance to
internet banking: A means-end approach. International Journal of Information
Management, 27(2), 75-85.
Kwon, I. G., & Suh, T. (2004). Factors affecting the level of trust and commitment in supply
chain relationships. Journal of Supply Chain Management, 40(1), 4-14.
Kwon, O., Choi, K., & Kim, M. (2007). User acceptance of context-aware services: Self-
efficacy, user innovativeness and perceived sensitivity on contextual pressure. Behavior
& Information Technology, 26(6), 483-498.
Laukkanen, T., & Kiviniemi, V. (2010). The role of information in mobile banking resistance.
International Journal of Banking Marketing, 28(5), 372-388.
Lee, A. Y. (2001). The mere exposure effect: An uncertainty reduction explanation revisited.
Personality and Social Psychology Bulletin, 27, 1255-1266.
Lee, G., & Xia, W. (2011). A longitudinal experimental study on the interaction effects of
persuasion quality, user training, and first-hand-use on user perceptions of new
information technology. Information & Management, 48, 288-295.
Lee, S., Ha., S., & Widdows, R. (2011). Consumer responses to high-technology products:
product attributes, cognition, and emotions. Journal of Business Research, 64, 1195-
1200.
Liang, H., Saraf, N., Hu, Q., & Xue, Y. (2007). Assimilation of enterprise systems: The effect
of institutional pressures and the mediating role of top management. MIS Quarterly,
31(1), 59-87.
Liao, F., and Li, B. (2014). Users of Webchat “Qiang Hong Bao” exceed eight million. Accessed
from http://finance.people.com.cn/BIG5/n/2014/0210/c1004-24308128.html on Sep. 17,
2014.
Liebana-Cabanillas, F., Sanchez-Fernandez, J., & Munoz-Leiva, F. (2014). The moderating
effect of experience in the adoption of mobile payment tools in virtual social networks:
The m-payment acceptance model in virtual social networks (MPAM-VSN).
International Journal of Information Management. 34, 151-166.
Limayem, M., Hirt, S. G., & Cheung, C. M. K. (2007). How habit limits the predictive power

62
of intention. MIS Quaterly, 31(4), 705-737.
Lin, C., & Nguyen, C. (2011). Exploring e-payment adoption in Vietnam and Taiwan. Journal
of Computer Information Systems, 51(4), 41-52.
Lin, C., Shih, H., & Sher, P. J. (2007). Integrating technology readiness into technology
acceptance: The TRAM model. Psychology & Marketing, 24(7), 641-657.
Lin, J., Lu, Y., Wang, B., & Wei, K. K. (2011). The role of inter-channel trust transfer in
establishing mobile commerce trust. Electronic Commerce Research and Applications,
10, 615-625.
Lin, J., Wang, B., Wang, N., & Lu, Y. (2014). Understanding the evolution of consumer trust
in mobile commerce: A longitudinal study. Information Technology Management, 15, 37-
49.
Liu, Y. (2006). Word of mouth for movies: Its dynamics and impact on box office revenue.
Journal of Marketing, 70 (3), 74-89.
Loibl, C., Cho, S. H., Diekmann, F., & Batte, M. T. (2009). Consumer self-confidence in
searching for information. Journal of Consumer Affairs, 43(1), 26-55.
Lu, Y., Yang, S., Chau, P. Y. K., & Cao, Y. (2011). Dynamics between the trust transfer
process and intention to use mobile payment services: A cross-environment perspective.
Information & Management, 48(8), 393-403.
Luo, X., Li, H., Zhang, J., & Shim, J. P. (2010). Examining multi-dimensional trust and multi-
faceted risk in initial acceptance of emerging technologies: An empirical study of mobile
banking services. Decision Support Systems, 49 (2), 222-234.
Mallat, N. (2007). Exploring consumer adoption of mobile payments-A qualitative study.
Journal of Strategic Systems, 16(4), 413-432.
Mallin, M. L., O’Donnell, E., & Hu, M. Y. (2010). The role of uncertainty and sales control
development of sales manager trust. Journal of Business & Industrial Marketing, 25(1),
30-42.
MasterCard. (2014). Mobile payments readiness index. Retrieved from
http://mobilereadiness.mastercard.com/the-index/.
Mayer, R. C., Davis, J. H., Schoorman, F. D. (1995). An integrative model of organizational
trust. Academy of Management Review, 20(3), 709-734.
McKnight, D. H., Choudhury, V., & Kacmar, C. (2002). Developing and validating trust

63
measures for e-commerce: An integrative typology. Information Systems Research, 13(3),
334-359.
McKnight, D. H., Cummings, L. L., & Chervany, N. L. (1998). Initial trust formation in new
organizational relationships. Academy of Management Review, 23 (3), 473-490.
McKinsey. (2013a). Disruptive technologies: Advances that will transform life, business, and
the global economy. Retrieved from
http://www.mckinsey.com/insights/business_technology/disruptive_technologies.
McKinsey. (2013b). The 2013 McKinsey mobile payments consumer survey. Retrieved from
www.mckinsey.com/~/media/mckinsey/dotcom/client_service/financial%20services/lates
t%20thinking/payments/mop17_the_2013_mckinsey_mobile_payments_survey.ashx.
Mehrabian, A., & Russell, J. A. (1974). An approach to environmental psychology. Cambridge,
MA: MIT Press.
Mitchell, V. (1999). Consumer perceived risk: Conceptualisations and models. European
Journal of Marketing, 33 (1/2), 163–195.
Moorthy, S., & Hawkins, S. A. (2005). Advertising repetition and quality perceptions. Journal
of Business Research, 58 (3), 354-360.
Nevid, J. S. (2009). Psychology: Concepts and applications (3rd). Boston, MA: Houghton
Mifflin.
Nicolaou, A. I., Ibrahim, M., & Heck, E. V. (2013). Information quality, trust, and risk
perceptions in electronic data exchanges. Decision Support Systems, 54, 986-996.
Nicolaou, A. I., & McKnight, D. H. (2006). Perceived information quality in data exchanges:
Effects on risk, trust, and intention to use. Information Systems Research, 17(4), 332-351.
Nielsen. (2014). The digital consumer. Retrieved from: http://www.nielsen.com/content/dam/
corporate/us/en/reports-downloads/2014%20Reports/the-digital-consumer-report-feb-
2014.pdf.
Park, S. C., Keil, M., Kim, J. U., & Bock, G. (2012). Understanding overbidding behavior in
C2C auctions: An escalation theory perspective. European Journal of Information
Systems, 21, 643-663.
Pavlou, P. A. (2003). Consumer acceptance of electronic commerce: Integrating trust and risk
with the technology acceptance model. International Journal of Electronic Commerce,
7(3), 101-134.

64
Pavlou, P. A., Liang, H., Xue, Y. (2007). Understanding and mitigating uncertainty in online
exchange relationships: A principal-agent perspective. MIS Quarterly, 31(1), 105-136.
Petter, S., Straub, D., & Rai, A. (2007). Specifying formative constructs in information systems
research. MIS Quarterly, 31(4), 623-656.
Pikkarainen., T., Pikkarainen, K., Karjaluoto, H., & Pahnila, S. (2004). Consumer acceptance
of online banking: An extension of the technology acceptance model. Internet Research,
14(3), 224-235.
Planalp, S., Rutherford, D.K., & Honeycutt, J.M. (1988). Events that increase uncertainty in
personal relationships II: Replication and extension. Human Communication Research,
14, 516-547.
Podsakoff, P., MacKenzie, S., Lee, J., & Podsakoff, N. (2003). Common method biases in
behavioral research: A critical review of the literature and recommended remedies.
Journal of Applied Psychology, 88(5), 879-903.
Ringle, C. M., Wende, S., & Will, A. (2005). SmartPLS 2.0 M3 (Beta), SmartPLS, Hamburg,
Germany.
Polites, G. L., & Karahanna, E. (2012). Shackled to the status quo: The inhibiting effect of
incumbent system habit, switching costs, and inertia on new system acceptance. MIS
Quarterly, 36(1), 21-42.
Russell, J. A., & Pratt, G. (1980). A description of the affective quality attributed to
environments. Journal of Personality and Social Psychology, 38(2), 311-322.
Scevak, N. (2010). Forrester research mobile media and messaging forecast, 2010 to 2015
(Western Europe). Retrieved from
http://www.forrester.com/Forrester+Research+Mobile+Media+And+Messaging+Forecast
+2010+To+2015+Western+Europe/-/E-RES57671?objectid=RES57671.
Setterstrom, A. J., Pearson, J. M., & Orwig, R. A. (2013). Web-enabled wireless technology:
An exploratory study of adoption and continued use intention. Behavior & Information
Technology, 32(11), 1139-1154.
Shin, D. (2009). Towards an understanding of the consumer acceptance of mobile wallet.
Computer in Human Behavior, 25, 1343-1354.
Siau, K., & Shen, Z. (2003). Building customer trust in mobile commerce. Communications of
the ACM, 46(4), 91-94.

65
Simon, H. A. (1960). The new science of management decision. New York: Harper and
Brothers.
Singh, N., Zhao, H., & Hu, X. (2005). Analyzing the cultural content of web sites: A cross-
national comparison of China, India, Japan, and US. International Marketing Review,
22(2), 129-146.
Srite, M. (2000). The influence of national culture on the acceptance and use of information
technologies: An empirical study. Unpublished Doctoral Dissertation, Florida State
University, Tallahassee, FL.
Sun, Y., Fang, Y., Lim, K. H., & Straub, D. (2012). User satisfaction with information
technology service delivery: A social capital perspective. Information Systems Research,
23(4), 1195-1211.
Valck, K. D., van Bruggen, G. H., & Wierenga, B. (2009). Virtual communities: A marketing
perspective. Decision Support Systems, 47, 185-203.
Venkatesh, V., Thong, J. Y. L., & Xu, X. (2012). Consumer acceptance and use of information
technology: Extending the unified theory of acceptance and use of technology. MIS
Quarterly, 36(1), 157-178.
Wang, A. (2012). A preliminary model for mobile payment acceptance. International Journal
of Mobile Marketing, 7(2), 37-51.
Wang, C., Harris, J., & Patterson, P. G. (2012). Customer choice of self-service technology:
The roles of situational influences and past experience. Journal of Service Management,
23(1), 54-78.
Wang, W., & Benbasat, I. (2008). Attributions of trust in decision support technologies: A
study of recommendation agents for e-commerce. Journal of Management Information
Systems, 24(4), 249-273.
Wei, Y., Frankwick, G. L., Gao, T., & Zhou, N. (2011). Consumer adoption intentions toward
the Internet in China: The effects of impersonal and interpersonal communication
channels. Journal of Advertising Research, 51(4), 594-607.
Weick, K. E. (1995). Sensemaking in organizations. Thousand Oaks, CA: Sage.
Williams, L. J., & Hazer, J. T. (1986). Antecedents and consequences of satisfaction and
commitment in turnover models: A reanalysis using latent variable structural equation
methods. Journal of Applied Psychology, 71(2), 219–231.

66
Yang, S., Lu, Y., Gupta, S., Cao, Y., & Zhang, R. (2012). Mobile payment services adoption
across time: An empirical study of the effects of behavioral beliefs, social influence, and
personal traits. Computer in Human Behavior, 28, 129-142.
Yoo, C. Y. (2008). Unconscious processing of web advertising: Effects on implicit memory,
attitude toward the brand, and consideration set. Journal of Interactive Marketing, 22 (2),
2–17.
Yoon, C. (2009). The effects of national culture values on consumer acceptance of e-
commerce: Online shoppers in China. Information & Management, 46, 294-301.
Zeithaml, V. A. (1988). Consumer perceptions of price, quality, and value: A means-end
model and synthesis of evidence. Journal of Marketing, 52(3), 2-22.
Zhang, L., Zhu, J., & Liu, Q. (2012). A meta-analysis of mobile commerce adoption and the
moderating effect of culture. Computers in Human Behavior, 28, 1902-1911.
Zhou, T. (2011). An empirical examination of initial trust in mobile banking. Internet
Research, 21(5), 527-540.
Zhou, T. (2013). An empirical examination of continuance intention of mobile payment
services. Decision Support Systems, 54(2), 1085-1091.
Zhou, T. (2014). An empirical examination of initial trust in mobile payment. Wireless
Personal Communication. 77(2), 1519-1531.
Zhou, K. Z., & Nakamoto, K. (2007). How do enhanced and unique features affect new product
preference? The moderating role of product familiarity. Journal of the Academy of
Marketing Science, 35, 53-62.
Zhu, P. (2004). The relationship among community identification, community trust, and
purchase behavior- The case of RVs communities (Unpublished master’s thesis). National
Dong Hwa University, Shoufeng.
Zuckerman, M. (1979). Attribution of success and failure revisited: The motivation bias is
alive and well in attribution theory. Journal of Personality, 47(2), 245-287.
Zuckers, L. G. (1986). Similarity based trust. Research in Organizational Behavior, 8, 53-111.

67
APPENDIX 1: Instrument
Table A. Measurement Items for Users
Exposure to Mobile Payments: Media Usage 1. I often obtain information about mobile payments from online newspapers. 2. I often obtain information about mobile payments from printed newspapers. 3. I often obtain information about mobile payments from online magazines. 4. I often obtain information about mobile payments from printed magazines. 5. I often obtain information about mobile payments from TV. 6. I often obtain information about mobile payments from radio. 7. I often obtain information about mobile payments from the Internet (excluding online newspapers and magazines). Adapted from Loibl et al. (2009) and Wei et al. (2011) Positive Word of Mouth 1. People say positive things about mobile payments. 2. People recommend using mobile payments to me. 3. Someone else from whom I seek advice recommends mobile payments for me. Adapted from Alexandrov and Babakus (2013) Explicit Social Influence 1. People who are important to me think that I should use mobile payments. 2. People who influence my behavior think that I should use mobile payments. 3. People whose opinions that I value prefer that I use mobile payments. Adapted from Venkatesh et al. (2012) Implicit Social Influence 1. People who are important to me use mobile payments. 2. People who influence my behavior use mobile payments. 3. People whose opinions that I value use mobile payments. Adapted from Kim et al. (2007) Information Searching: 1. I have researched, on my own initiative, in order to increase my knowledge of using mobile payments. 2. I have researched, on my own initiative, in order to increase my mastery of using mobile payments. 3. I have explored several information sources, on my own initiative, concerning using mobile payments. 4. I have spent much time and energy learning about using mobile payments. 5. I have invested much time and energy in order to better use mobile payments. Adapted from Barki et al. (2007) Trust: 1. I trust mobile payment systems to be reliable.

68
2. I trust mobile payment systems to be secure. 3. I believe mobile payment systems are trustworthy. 4. I trust mobile payment systems. 5. Even if the mobile payment systems are not monitored, I'd trust them to do the job correctly. 6. Mobile payments always provide accurate financial services. 7. Mobile payments always provide reliable financial services. 8. Mobile payments always provide safe financial services. Adapted from Chandra et al. (2010) and Lu et al. (2011)Uncertainty 1. I feel that using mobile payments involves a high degree of uncertainty. 2. I feel the uncertainty associated with using mobile payments is high. 3. I am exposed to many transaction uncertainties if I use mobile payments. 4. There is a high degree of uncertainty when using mobile payments. Adapted from Pavlou et al. (2007) Intention to continue using 1. I intend to continue using mobile payments in the future. 2. I predict that I will continue to use mobile payments frequently in the future. 3. I will strongly recommend that others use mobile payments. Adapted from Venkatesh et al. (2012) Perceived Usefulness 1. Using mobile payments enables me to pay more quickly. 2. Using mobile payments makes it easier for me to conduct transactions. 3. I find mobile payments a useful possibility for making payments. Adopted from Kim et al. (2010)

69
Table B. Measurement Items for Non-Users
Exposure to Mobile Payments: Media Usage 1. I often obtain information about mobile payments from online newspapers. 2. I often obtain information about mobile payments from printed newspapers. 3. I often obtain information about mobile payments from online magazines. 4. I often obtain information about mobile payments from printed magazines. 5. I often obtain information about mobile payments from TV. 6. I often obtain information about mobile payments from radio. 7. I often obtain information about mobile payments from the Internet (excluding online newspapers and magazines). Adapted from Loibl et al. (2009) and Wei et al. (2011) Positive Word of Mouth 1. People say positive things about mobile payments. 2. People recommend using mobile payments to me. 3. Someone else from whom I seek advice recommends mobile payments for me. Adapted from Alexandrov and Babakus (2013) Explicit Social Influence 1. People who are important to me think that I should use mobile payments. 2. People who influence my behavior think that I should use mobile payments. 3. People whose opinions that I value prefer that I use mobile payments. Adapted from Venkatesh et al. (2012) Implicit Social Influence 1. People who are important to me use mobile payments. 2. People who influence my behavior use mobile payments. 3. People whose opinions that I value use mobile payments. Adapted from Kim et al. (2007) Information Searching: 1. I have researched, on my own initiative, in order to increase my knowledge of using mobile payments. 2. I have researched, on my own initiative, in order to increase my mastery of using mobile payments. 3. I have explored several information sources, on my own initiative, concerning using mobile payments. 4. I have spent much time and energy learning about using mobile payments. 5. I have invested much time and energy in order to better use mobile payments. Adapted from Barki et al. (2007) Trust: 1. I trust mobile payment systems to be reliable. 2. I trust mobile payment systems to be secure. 3. I believe mobile payment systems are trustworthy.
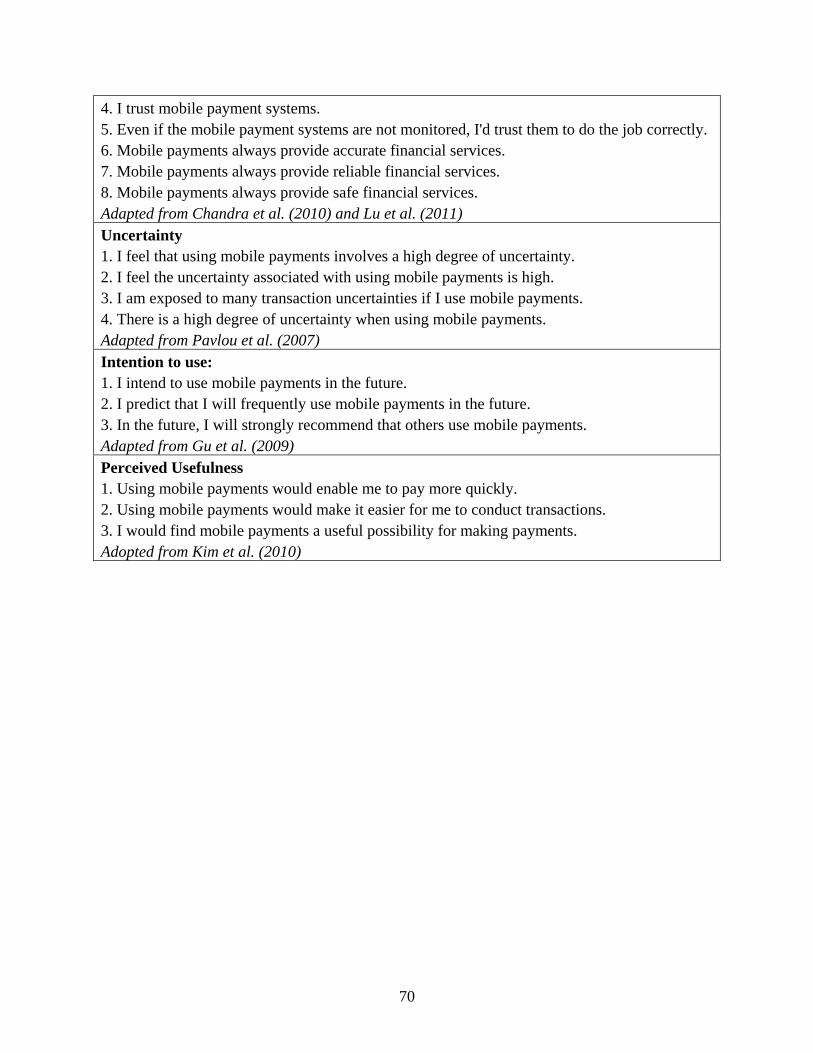
70
4. I trust mobile payment systems. 5. Even if the mobile payment systems are not monitored, I'd trust them to do the job correctly. 6. Mobile payments always provide accurate financial services. 7. Mobile payments always provide reliable financial services. 8. Mobile payments always provide safe financial services. Adapted from Chandra et al. (2010) and Lu et al. (2011)Uncertainty 1. I feel that using mobile payments involves a high degree of uncertainty. 2. I feel the uncertainty associated with using mobile payments is high. 3. I am exposed to many transaction uncertainties if I use mobile payments. 4. There is a high degree of uncertainty when using mobile payments. Adapted from Pavlou et al. (2007) Intention to use: 1. I intend to use mobile payments in the future. 2. I predict that I will frequently use mobile payments in the future. 3. In the future, I will strongly recommend that others use mobile payments. Adapted from Gu et al. (2009) Perceived Usefulness 1. Using mobile payments would enable me to pay more quickly. 2. Using mobile payments would make it easier for me to conduct transactions. 3. I would find mobile payments a useful possibility for making payments. Adopted from Kim et al. (2010)

71
ESSAY 2: EXAMINING CONSUMER LEARNING AS A WAY TO PROMOTE BEHAVIORAL INTENTION TOWARD MOBILE PAYMENTS
Introduction
Adoption of innovation is an on-going process involving persuasive communication and
learning (Lee & Xia, 2011, P. 289). This process is affected by different stakeholders such as
governments, companies that develop innovations, the media, and end users. User acceptance is
of the greatest importance because users cannot benefit from their implementation of an
innovation if they do not use it (Setterstrom, Pearson, & Orwig, 2013) and companies that
develop innovations cannot recover investments in new technology if consumers do not buy it.
Continuous usage is a factor in a long term relationship and often encourages consumers to
develop loyalty toward the object that is being used (Deng, Lu, Wei, & Zhang, 2010). Adoption
of IT innovations is analogous to the purchase of products/services in the consumer context
(Deng, Turner, Gehling, & Prince, 2010), and consumer loyalty is important to vendor success.
For example, online sellers can earn five times more profit from repeat consumers than from new
consumers because repeat consumers are less sensitive to price and spend more at online stores
(Gupta & Kim, 2007; Reichheld & Schefter, 2000). Adoption and post adoption of innovation
have attracted much attention from information systems (IS) academics and have become
important IS research topics.
Adoption and post adoption behaviors are continuous processes although continuous
usage is not simply an extension of the adoption decision. The difference between technology
adoption and continuous usage has attracted the attention of IS researchers (Setterstrom et al.,

72
2013). Past research has suggested that predictors of technology adoption and continuous usage
are different (Limayem, Hirt, & Cheung, 2007), but there should be some concepts that can be
used to predict both. Learning outcomes can serve as these predictors because learning is
continuous, and learning outcomes such as affective states, attitudes, and belief can evolve as
environmental factors change (Bandura, 1977b, 1988). Anderson (1991) argues that affective
states, attitudes, and belief are not replaced by new information; rather, new attitudes and beliefs
are formed by integrating old attitudes and beliefs with information as it is received. Consumers
update their trust, knowledge, and attitude about a technology during the learning process. A
model can be used to predict, at least to some extent, both behavior and post adoption behaviors
by integrating consumer learning and learning outcomes.
In this research, we use mobile payments as the artifact and explore consumers’
acceptance of them. Mobile payments refer to any transaction that is initiated, activated, and
confirmed using mobile devices (Au & Kauffman, 2008). During mobile payment processes,
money is transferred from payer to receiver via an intermediary or directly (Mallat, 2007). Many
researchers and business analysts believe that mobile payments will flourish in coming years. It
is estimated that worldwide mobile payment revenue will rise to US$998.5 billion in 2016
(Business Wire, 2012). Mobile payments, a promising form of electronic payments, will become
an important channel for conducting transactions especially with regard to mobile commerce
(Yang, Lu, Gupta, Cao, & Zhang, 2012). It is necessary to examine how to encourage mobile
payments adoption and continuous usage.
Adoption of innovations cannot happen spontaneously. Awareness of the existence of IT
innovations is always the first step of the diffusion process (Dinev & Hu, 2007). Perceived
awareness is viewed as a subjective self-assessment of consumers’ knowledge that measures how

73
much consumers know about products or innovations (Mihaela-Roxana, 2010). Because there
are many types of IT innovations, prospective consumers rely on external information sources to
learn more about an innovation before making adoption decisions (Doh & Hwang, 2009).
Communication serves as an important information source and plays a vital role in encouraging
diffusion of innovations (Jiang & Benbasat, 2007; Rogers, 2003). There are two categories of
communication channels: interpersonal and mass media (Rogers, 2003). Mass media channels
include radio, television, newspapers, magazines, and new media such as the Internet, while
interpersonal channels involve an information exchange between two or more individuals
(Rogers, 2003) such as social influence and word of mouth. The positive effect of social
influence on innovation adoption is supported by adoption theories such as the theory of planned
behavior (TPB) (Ajzen, 1991). Meanwhile, word of mouth has long been accepted as the most
important communication format between individual consumers (Derbaix & Vanhamme, 2003)
and is proposed to initiate the consumer learning process (Bruyn & Lilien, 2008).
There are many theories to guide IS acceptance research such as the innovation diffusion
theory, the theory of reasoned action (TRA), the theory of planned behavior (TPB), the
technology acceptance model (TAM), the unified theory of acceptance and use of technology
(UTAUT), and the extended unified theory of acceptance and use of technology (UTUAT 2). In
this study, adoption is viewed as a consumer learning process, during which attitude is formed.
TPB is the most widely used theory in attitude-behavior research. According to TPB, behavioral
intention is predicted by attitude, subjective norm, and perceived behavioral control, which are
determined by behavioral beliefs, normative beliefs, and control beliefs, respectively (Ajzen,
1991). Social cognitive theory focuses on individual learning and indicates that environmental
factors, personal factors, and behavior affect each other interactively (Bandura, 1977b; Bandura,

74
1986). In this research, the importance of consumer learning is explored by integrating social
cognitive theory and TPB.
However, TPB has some shortcomings. For example, there is doubt that the theory
adequately captures all theoretical determinants of intention (Rise, Sheeran, & Hukkelberg,
2010). TPB does not address some potentially important concepts such as learning and perceived
knowledge. Benbasat and Barki (2007) posited that researchers should explore learning behavior
in TPB research. Ajzen (1991) also encouraged others to extend TPB by including additional
concepts if they help increase the prediction power of TPB. In addition, belief structures in TPB
are not easy to measure (Taylor & Todd, 1995). The theory begins after the belief about social
norm, perceived behavioral control, and attitude are formed while neglecting the formation of
these beliefs (Bagozzi, 2007). Taylor and Todd (1995) decomposed the belief structures and
proposed the decomposed theory of planned behavior in which behavioral beliefs include
perceived usefulness, ease of use, and compatibility, normative beliefs include peer influence
and superior influence, and control beliefs include self-efficacy, resource facilitating conditions,
and technology facilitating conditions (Taylor & Todd, 1995). However, it emphasized the
measurement of these beliefs while not exploring the formation of these beliefs. Moreover, TPB
does not consider the interrelationships among predictors of behavioral intention in the model.
Wu (2006) suggested that attitudes, subjective norms, and perceived behavioral control not only
have direct effects on behavioral intention but also interact with each other.
We extend the research discussed above by viewing IT acceptance as a consumer
learning process and viewing the belief structures in TPB as learning outcomes. This serves as a
response to the suggestion of Benbasat and Barki (2007) that researchers should explore learning
behavior in TPB research. Social cognitive theory and the theory of planned behavior serve as

75
background theories to explore the effect of consumer learning on consumers’ acceptance of
mobile payments. We also explore the interaction among predictors of behavioral intention in
TPB by adopting the tripartite model of attitude. Meanwhile, the potential to include perceived
knowledge in TPB research is also discussed by exploring the role of consumer learning and
perceived knowledge in adoption and post adoption of mobile payments. The main goal of this
study is to discuss how consumer learning can affect people’s mobile payments acceptance
decisions. Our research questions are:
RQ1: How do consumers’ learning outcomes affect their mobile payments acceptance
decisions?
RQ2: What characteristics differentiate users and non-users?
The rest of the paper proceeds as follows. The theoretical background and conceptual
model are presented first. Then, the hypotheses are developed. Data collection and analysis are
explained next, followed by presentation of the results. Key findings and implications are then
discussed.
Literature Review
Mobile Payments
Definition of mobile payments.
Mobile payments are payments that use mobile devices to pay for goods, services, and
bills or perform banking transactions by using mobile technology (Dahlberg et al., 2008; Gerpott
& Kornmeier, 2009; Mallat, 2007). Two important components of the definition are mobile
devices and mobile technology. Mobile devices are handheld devices such as cell phones,
smartphones, PDAs, pocket PCs, tablet PCs or multimedia readers with wireless capability (or
any other way of connecting to online banking services) (Cruz & Laukkanen, 2010). Gartner

76
Group (2009) proposed that mobile payments are performed by using mobile technologies
including near field communication (NFC), short message service (SMS), wireless application
protocol (WAP) or direct mobile billing.
Categories of mobile payments.
There are two popular mobile payment systems: remote and proximity mobile payments
(Chandra, Srivastava, & Theng, 2010). Different types of mobile payments are supported by
different technologies. Remote mobile payments are based on mobile technologies such as short
message services (SMS), which is leveraged by PayPal (Au & Kauffman, 2008). Proximity
mobile payments are often based on technologies such as near field contact (NFC) (Zhou, 2013).
Vivotech uses NFC technology to provide mobile payment services for consumers (Au &
Kauffman, 2008). There are three types of mobile payment business modes: mobile network
operator (MNO) led such as mobile payments provided by China Mobile, bank and financial
institution led such as mobile banking provided by Citibank, and third party led such as mobile
payments provided by PayPal (Turner, 2009).
Actual behavior control.
Consumers need to use smart devices such as smartphones or tablets and access the
internet to perform mobile payments. Business Wire (2013a) indicated that smartphone
ownership in developed markets (U.S., U.K., France, and Germany) jumped to 64% in 2013
from 49% in 2012, while the rate in developing markets (Brazil, Russia, India, and China)
jumped to 37% in 2013 from 24% in 2012. The smartphone ownership rate of China is especially
high among developing markets. According to Nielsen (2013), 66% of phone users in China use
smartphones. Additionally, mobile internet users are growing fast as well. Close-Up Media
(2013) reported that the global mobile internet market will have a robust growth in the next five
77
years and should reach to estimated US$402.8 billion in 2018. It is estimated that the worldwide
penetration rate of mobile internet will reach 37% in 2015 (Business Wire, 2013b). Increasing
smartphone ownership and a fast growing mobile internet market provide a foundation for the
growth of mobile payments.
Importance of mobile payments research.
Research on mobile payments is of great importance. Payment is necessary to complete
transactions in mobile commerce. As the popularity of mobile devices increases, mobile
payments become one of the critical drivers for mobile commerce success (Yang et al., 2012).
Mobile payments also make smartphones flexible payment devices and thus realize a potential
commercial value of smartphones (Andreev, Duane, & O’Reilly, 2011). Companies have
invested considerable assets in mobile payments. For example, China Mobile invested US$7
billion in the Shanghai Pudong Development Bank to prepare for their mobile payments business
(Yang et al., 2012); three U.S wireless carriers, Verizon, AT&T, and T-Mobile, invested US$100
million in the Isis mobile wallet in order to compete with Google wallet (Kharif, 2011).
However, companies can recover their investment and profit only if consumers adopt the mobile
payment service and use it continuously. Many industry stakeholders can benefit from mobile
payment service. Organizations may achieve organizational value via the provision of mobile
payments to consumers. The value may result from, for example, extension of their market to
less developed regions by providing mobile payment services for those who have no access to
the Internet other than through mobile devices. The acceptance rate of mobile payments is low
although the growth forecast for mobile payments is very positive (Duane, O’Reilly, & Andreev,
2014). However, several researchers have concluded that consumers do not have positive

78
attitudes toward mobile shopping, and in particular making mobile payments using smartphones
(Duane et al., 2014).
Theoretical Background
We drew on several frameworks to explore the effect of consumer learning on mobile
payment acceptance as listed in Table 1. Social cognitive theory serves as the overarching
theory. TPB is used to explore the effect of social influence, self-efficacy, attitude, and perceived
knowledge on behavioral intention. The multi-stage decision making model, the model of
learning outcomes, and the tripartite model of attitude are used to support links among concepts
in the model.
Table 1. Theoretical Background
Framework Source(s)
Social cognitive theory Bandura, 1977b; 1986.
Theory of planned behavior Ajzen, 1991.
Multi-stage decision making theory Bruyn and Lilien, 2008; Dewey, 1910; Simon, 1960.
Model of learning outcomes Kraiger, Ford, and Salas, 1993
Tripartite model of attitude Lavidge and Steiner, 1961; Rosenberg and Hovland, 1960.
Social cognitive theory.
Social cognitive theory was proposed by Bandura (1977b, 1986); it presents behavior as
one set of factors in a triadic causal framework (Figure 1). Behavior refers to behavioral
intention or actual behavior toward the object. The other two sets of factors are personal factors
and environmental factors. Environmental factors refer to either social or physical factors that are
external to an individual and affect his or her behavior (e.g., positive word of mouth, social
influence, and media usage) (Compeau & Higgins, 1995). Personal factors are “any cognitive,

79
motivational, emotional, personality or demographic aspects characterizing an individual”
(Carillo, 2012, p. 22) (e.g., attitude, self-efficacy, and perceived knowledge).
Social cognitive theory presents self-efficacy as the core term. Bandura (1977b) indicates
that an individual’s behaviors are responses from a combination of his or her own traits and
behaviors of other individuals within the environment. Meanwhile, outcome from past behavior
may affect an individual’s self-efficacy, which belongs to personal factors. Bandura (1977a)
discussed the relationship between environmental factors and self-efficacy and summarized four
sources of self-efficacy: performance accomplishments (e.g., direct experience), vicarious
experience (e.g., implicit social influence), verbal persuasion (e.g., positive word of mouth,
explicit social influence, and media usage), and physiological states (e.g., relaxation).
Figure 1. Triadic causal nature of human functioning
IS researchers started to use social cognitive theory in the early 1990s after they realized
the importance of self-efficacy to IS acceptance (Carillo, 2012). Since then, social cognitive
theory has been applied to a variety of research disciplines. Carillo (2012) suggested that “social
cognitive theory is mainly applied to three research areas: computer training and/or use, software
training and/or use, and internet-based applications or services” (p. 249). According to social
cognitive theory, each of the three sets of factors can serve as a dependent variable. However,
Environmental factors
Personal factors
Behavior

80
behavioral intention or actual behavior are the most represented dependent variables because
researchers try to explain and predict human behaviors (Carillo, 2012). In this research,
behavioral intention is used as the dependent variable because we attempt to explain factors that
affect consumers’ acceptance of mobile payments. We explore this topic by positing that
environmental factors lead to personal factors that lead to behavioral factors.
Theory of planned behavior (TPB).
One area of IT acceptance research is the attitude-behavior approach. The TPB, proposed
by Ajzen (1991), is one of the most widely used models in this approach. The TPB is considered
a comprehensive foundation that can be used to explain most adoption behaviors (Taylor &
Todd, 1995). According to the theory, behavioral intention is predicted by attitude toward the
behavior, subjective norms, and perceived behavioral control. Behavior is then predicted by
perceived behavioral control, actual behavior control, and behavioral intention.
Attitude is an individual’s positive or negative feelings about performing a behavior
(Ajzen & Fishbein, 1980). Subjective norms refer to “perceived social pressure to perform or not
to perform a behavior” (Ajzen, 1991, p. 188). Social influence closely resembles subjective norm
(Johnston & Warkentin, 2010). Venkatesh, Morris, Davis, and Davis (2003) posited that “social
influence is represented as subjective norm in TPB” (p. 451), suggesting that social influence and
social norm are interchangeable. Perceived behavioral control is composed of two correlated
sub-constructs: self-efficacy and controllability (Ajzen, 2002). Self-efficacy is a consumer’s
belief about his or her ability to do something (Bandura, 1986) while controllability refers to the
belief about the extent to which performing the behavior is voluntary (Ajzen, 2002). Ajzen
(2002) suggested that self-efficacy accounts for significant portions of variance in intention

81
while controllability does not significantly improve the prediction of intention. Thus, we use
self-efficacy to represent perceived behavioral control in this research.
Multi-stage decision making model.
Dewey (1910) first proposed the multi-stage buying decision process, which includes
problem/need recognition, information searching, alternatives evaluation, purchase decision, and
post purchase behavior. Consumers’ decision making processes start when they recognize the
need to purchase a product or service. They will search for initial information to help reduce the
number of products or services from which to choose into a reasonable number of alternatives.
More detailed information is then sought about each alternative to facilitate the final selection.
Simon (1960) proposed the Intelligence-Design-Choice (IDC) model that is similar to the
Dewey (1910) buying decision process. According to the Simon model, an individual goes
through three stages during the decision process: intelligence gathering, design, and choice
(Simon, 1960). Simon viewed individuals’ decision making as information processing. In order
to make a decision, individuals search environment for information to make a decision. Then,
they design possible alternatives with information they obtain and conceive consequences of
each alternative. Simon (1960) posited that individuals have limited capability to process
knowledge, and thus less than an ideal decision is acceptable. Individuals will compare the
efficacy of each alternative and choose one that, while not perfect, is acceptable.
A similar model of decision making is proposed by Bruyn and Lilien (2008). The model
includes three stages: awareness, interest, and final decision. In the awareness stage, people
become aware of the existence of an object because of exposure to the object or having received
information about the object from the external environment. After becoming aware of the object,
individuals will search for information to see whether the object meets their needs. During this
82
stage, they will distinguish alternatives to the object and search for more detailed information.
With the information they obtain, they become more knowledgeable of the object. Their
knowledge will then be used to evaluate the object and its alternatives. After the evaluation, they
will make a final selection of either the original object or one of its alternatives.
General speaking, there are three stages in the consumer decision making process, which
are awareness, information searching, and decision making. However, as Kotler and Keller
(2008) said, consumers do not need to move through every stage of the decision making process.
For example, a person with higher personal innovativeness or who has received strong positive
word of mouth from friends or relatives may decide to adopt the innovation without searching
for more information, thus bypassing that stage.
Model of learning outcomes.
Any process that changes consumers’ memory and behavior is considered consumer
learning (Arnould, Price, & Zinkhan, 2001). Through communication and learning, individuals
obtain knowledge and experience, increasing their capacity to utilize technology (Saga & Zmud,
1994). There are two main categories of consumer learning: direct consumer learning and
indirect consumer learning. In direct consumer learning, consumers learn from their product
usage experiences. In indirect consumer learning, consumers learn from outside sources such as
word of mouth, advertisements, and information searching (Li, Daugherty, & Biocca, 2003).
Learning is a form of intangible, cognitive activity that is goal directed. Learning
outcomes reflect the efficacy of learning processes. Kraiger et al. (1993) proposed that learning
has three categories of outcomes, which are cognitive outcomes, skill-based outcomes, and
affective outcomes. According to Kraiger et al. (1993), cognitive outcomes refer to “a class of
variables related to the quantity and type of knowledge and the relationships among knowledge

83
elements” (p. 313). They summarized three types of knowledge: declarative knowledge (know-
what knowledge), procedural knowledge (know-how knowledge), and tacit knowledge
(information about which, when, and why). This category reflects the knowledge that users have,
for example, about what a technology is and how to use it (Marcolin, Compeau, Munro, & Huff,
2000).
Affective outcomes refer to “a class of variables encompassing issues such as attitudes,
motivation, and goals that are relevant to the objectives of the training program” (Kraiger et al.,
1993, p. 319). This category represents users’ change in their attitude and motivation toward an
object as a result of the learning experience (Ng, Dyne, & Ang, 2009). Affective learning
outcomes have two dimensions, attitudinal outcomes and motivation. Attitudinal outcomes
include self-efficacy and attitude toward using an object; motivation includes engaging
intentionally, goal difficulty, exerting effort, persisting on a task, and mastery orientation
(Kraiger, 2002).
Skill-based outcomes or behavioral learning outcomes concern the development of
technical or motor skills (Kraiger et al., 1993). This category includes compilation and
automaticity. Roberson, Kulik, and Pepper (2001) and Kalinoski, et al. (2012) used behavioral
intentions and behavior to represent behavioral learning outcomes. With knowledge obtained as
cognitive learning outcomes, people build competency to perform tasks faster and more fluidly.
Through continual practice, people will reach the automaticity stage, in which they develop the
habit of performing tasks without much conscious thought.
Tripartite model of attitude.
Attitude captures individuals’ positive or negative evaluations of performing a certain
behavior and thus can be used to predict consumers’ behavioral intention (Ajzen, 1991).

84
Rosenberg and Hovland (1960) proposed the tripartite model of attitude, in which attitude is
composed of the affective component, the behavioral component, and the cognitive component.
The affective component refers to individuals’ emotions toward the object, the behavioral
component refers to how individuals tend to act toward the object, and the cognitive component
refers to individuals’ thoughts and beliefs about the object (Breckler, 1984). Li et al. (2003)
posited that consumers’ behavioral intention is the most widely used behavior measure.
Lavidge and Steiner (1961) used the tripartite model of attitude to explore consumer
learning in advertising. They summarized three functions of advertisement: the cognitive
function, the affective function, and the conative function. The cognitive function refers to
intellectual, mental, or relational states, the affective function refers to emotional or feeling
states, and the conative function refers to the states relating to the tendency to treat objects as
positive or negative (Lavidge & Steiner, 1961, p. 60). They also explored how advertisements
move potential consumers from being aware of the existence of the product toward the final
purchase. According to Lavidge and Steiner (1961), consumers first sense the stimuli and obtain
relevant information from the surrounding environment, and then they develop attitudes and
feelings about the product, which in turn affect their purchase decisions.
The tripartite model of attitude has been used in research areas such as customer loyalty,
advertising, consumer learning, and IS acceptance. Dick and Basu (1994) utilized the three
dimensions of attitude structure and presented the attitude-based framework of customer loyalty
with three phases: belief, affect, and intention. Oliver (1999) applied the model to loyalty
development and extended the framework by adding the action phase. Oliver (1999) proposed
that customer can become loyal at each phase of the attitude development process: cognitive
loyalty affective loyalty conative loyalty action loyalty.

85
Li et al. (2003) evaluated the impact of 3-D advertising by adopting the tripartite model
of attitude. They also explored the role of virtual experience in facilitating consumer learning (Li
et al., 2003). In Li et al. (2003), knowledge, attitude, and purchase intentions were chosen to
represent the cognitive, affective, and conative components of attitude, respectively. The
tripartite attitude model has also been applied to IS acceptance research. Hong, Thong,
Chasalow, and Dhillon (2011) applied the tripartite model of attitude to consumer acceptance of
agile information systems. They used perceived usefulness, perceived ease of use, social
influence, and facilitating conditions to represent the cognitive dimension of attitude, satisfaction
and comfort with change to represent the affective dimension of attitude, and habit as the
behavioral dimension of attitude.
Research Model and Hypotheses Development
Research Model
In order to explore the impact of consumer learning on consumers’ behavioral intention
toward mobile payments, a conceptual model as shown in Figure 2 is proposed by combining
background theories listed in Table 1. According to the model, exposure to mobile payments will
increase consumers’ information searching. Both exposure to mobile payments and information
searching will increase consumers’ self-efficacy and perceived knowledge, which have a positive
relationship with their attitude toward using mobile payments. Consumers’ self-efficacy,
perceived knowledge, and attitude toward using mobile payments will then positively influence
their behavioral intention toward mobile payments. Definitions of the variables used in this study
are listed in Table 2.

86
Figure 2. Research Model
Table 2. Definitions of variables
Variable Definition Source(s) Positive word of mouth
Positive informal communication among consumers about mobile payments.
e.g., Liu, 2006
Explicit social influence
The extent to which consumers perceive that important others (e.g., family and friends) believe they should use a particular technology such as mobile payments.
e.g., Venkatesh, Thong, and Xu, 2012
Implicit social influence
The extent to which consumers perceive that important others (e.g., family and friends) use a particular technology themselves.
e.g., Kim, Jahng, Lee, 2007
Media usage
The extent to which messages regarding mobile payments are transmitted through mass media such as television, newspapers, magazines, radio, and the Internet.
e.g., Wei, Frankwick, Gao, and Zhou, 2011
Information searching
The process by which individuals seek information about mobile payments.
e.g., Browne, Pitts, & Wetherbe, 2007
Attitude toward using mobile payments
Individuals’ positive or negative evaluations of using mobile payments.
e.g., Ajzen, 1991
Self-efficacy Consumers’ belief about their ability to use mobile payments.
e.g., Bandura, 1986
Perceived knowledge
A subjective self-assessment of how much consumers know about mobile payments.
e.g., Mihaela-Roxana, 2010
Behavioral intention
Consumers’ intention to use or continue to use mobile payments.
e.g., Venkatesh et al., 2012

87
Hypotheses Development
The importance of information in consumers’ decision making process is well accepted.
Gefen and Straub (2000) posited that online consumers obtain product information before
purchasing products. Similarly, consumers should search for information before deciding
whether to adopt and use mobile payments (Bruyn & Lilien, 2008; Dewey, 1910; Simon, 1960).
Exposure refers to “the degree to which an individual has acquired or exchanged information
about the technology and its usage” (Khalifa, Cheng, & Shen, 2012, p.15). Individuals do not
simply respond to environmental influences, but also actively seek and interpret information to
which they are exposed (Nevid, 2009). After they are exposed to information regarding mobile
payments, they may seek additional information on specific attributes of mobile payments or
how mobile payments compare relative to other payments methods (Kulkarni et al., 2012). They
may also search for information to distinguish the correctness of information they receive and
thereafter make a final decision. Exposure to information regarding mobile payments is viewed
as the start point of the consumer learning process in this research.
Exposure to information regarding mobile payments will increase consumers’ awareness
and interest about them and thereafter encourage consumers to search for additional information
regarding them. In this research, exposure to information regarding mobile payments is
composed of positive word of mouth, implicit and explicit social influence, and mass media
usage. Exposure to word of mouth, advertising, promotion, and mass media coverage are
methods by which consumer’s interest may be elevated (Kulkarni, Kannan, & Moe, 2012). With
repeated exposure to information regarding mobile payments, consumers are attracted to them
(Zajonc, 1968). Yoo (2008) also found that repeated exposure to information about or use of an
innovation can lead to attractiveness and awareness of the innovation which is mobile payments

88
in this research. After people become aware and attracted of an innovation, they will search for
additional information to make further decision on whether to adopt and use it (Bruyn & Lilien,
2008; Rogers, 2003).
Searching for additional information is contingent upon exposure to information
regarding mobile payments. This notion is captured in the multi-stage decision making models,
which assume a sequential relationship between exposure to information regarding an innovation
and searching for additional information (Bruyn & Lilien, 2008; Dewey, 1910; Simon, 1960).
According to the multi-stage decision making models, consumers realize the need to make a
decision on whether to adopt and use mobile payments when they are exposed to information
regarding them, and then, they will search for information to obtain knowledge that will be used
to evaluate possible alternative and make a selection (Bruyn & Lilien, 2008; Dewey, 1910;
Simon, 1960). In view of this, exposure to information regarding mobile payments serves as the
starting point of the acceptance process because it informs consumers about the existence of
mobile payments and encourages consumers to search for information before they make
decisions.
Hypothesis 1. Exposure to information regarding mobile payments will encourage
consumers to search for additional information about mobile payments.
Bandura (1977a) proposed four sources of consumers’ self-efficacy: performance
accomplishments, vicarious experience, verbal persuasion, and physiological states. In this
research, vicarious experience and social persuasion attract our attention. Vicarious experience
refers to individuals’ experience to observe other people’s behavior and its consequences
(Bandura, 1977a, 1986) while implicit social influence reflects consumers’ perception that

89
important others use mobile payments (Kim et al., 2007). Thus, vicarious experience is
represented by implicit social influence in this study. Meanwhile, past literature distinguishes
different types of social persuasion such as positive word of mouth (Mazzarol, Sweeney, &
Soutar, 2007), explicit social influence (Lu & Hsiao, 2007), and media usage (Pecujlija, &
Culibrk, 2012). These types of social persuasion are used to represent social persuasion in this
study. The positive relationship between exposure to mobile payments and self-efficacy is
supported by the social cognitive theory (Bandura, 1977a, 1977b, & 1986), and empirical
research also reports a positive correlation between vicarious experience and self-efficacy and
between social persuasion and self-efficacy (Warkentin, Johnston, & Shropshire, 2011).
Exposure to mobile payments facilitates consumers’ self-efficacy through affecting their
physiological states. On one hand, exposure to mobile payments will reduce consumers’ negative
judgment of their physiological states. For example, exposure to mobile payments will reduce
consumers’ anxiety toward using them (Beckers, Wicherts, & Schmidt, 2007). With repeated
exposure to mobile payments, consumers become familiar with them. Familiarity with mobile
payments has a negative relationship with consumers’ anxiety about mobile payments (Arndt,
Feltes, & Hanak, 1983; Fuller, Chelley, & Brown, 2006), which belongs to the judgment of their
own physiological states (Bandura, 1977a). On the other hand, exposure to mobile payments will
increase consumers’ positive judgment of their physiological states. Zajonc (1968) proposed the
mere-exposure effect, which means that with repeated exposure to mobile payments, individuals
will more likely appreciate them. Salanova and Schaufeli (2000) also posited that exposure to an
innovation will increase an individual’s appraisal of it. Judgment of one’s own physiological
states is a source of self-efficacy as suggested by Bandura (1977a). Thus, exposure to mobile

90
payments will reduce consumers’ negative judgment of their physiological states and increase
consumers’ positive judgment, increasing their self-efficacy.
The IS literature has also invested some effort to explain the impact of exposure on
consumers’ self-efficacy toward the objective innovation. Compeau and Higgins (1995) tested
the positive relationship between system exposure and end-user self-efficacy. Warkentin et al.
(2011) viewed exposure as an external cue and tested its impact on consumers’ behavioral
intention through self-efficacy. Khalifa et al. (2012) also explored the effect of exposure to
mobile commerce on its adoption and found that exposure positively affects individuals’ self-
efficacy. In view of the supports mentioned above, we posit that:
Hypothesis 2. Consumers’ exposure to mobile payments will increase their self-efficacy
about using mobile payments.
Information searching is usually goal-directed (David, Song, Hayes, & Fredin, 2007). At
the beginning of the information searching, consumers have vague goals. In this study,
consumers search for information to learn how to use mobile payments. Information searching,
the process by which individuals seek information about mobile payments (Browne, Pitts, &
Wetherbe, 2007), serves as an active mechanism of learning. Through information searching,
consumers learn to use mobile payments. Thus, self-efficacy, consumers’ belief about their
ability to use mobile payments (Bandura, 1986), is anticipated to be affected by information
searching.
Through information searching, consumers obtain related knowledge, resources, and
supports about mobile payments. For example, they can obtain introduction of what is and how
to use mobile payments from websites of mobile payment service providers. They can also

91
search for information about other people’s mobile payment usage experiences which will
positively affect their self-efficacy judgment (Bandura, 1977a). Huang, Liu, and Chang (2012)
posited that availability of related knowledge, resources, and supports directly affects
consumers’ perception of their capability of using IT innovations such as mobile payments. With
support and resources obtained through information searching, individuals become more
confident of using mobile payments (Compeau & Higgins, 1995; Huang, et al., 2012).
Information searching also reduces consumers’ uncertainty about mobile payments and
thereafter increases their self-efficacy of using them. Uncertainty exists because consumers do
not have adequate information on which and how to act (Kim & Han, 2009; Kwon, Choi, &
Kim, 2007). Through information searching, consumers obtain quality and quantity of
information (Ramirez, Walther, Burgoon, & Sunnafrank, 2002). This helps consumers reduce
their perceived uncertainty (Brashers, 2001), boosting their self-efficacy. Past literature also
supports the positive relationship between information searching and consumers’ self-efficacy of
using mobile payments (Bauer, Bodner, Erdogan, & Truxillo, 2007; van Beuningen, de Ruyter,
& Wetzels, 2009). Thus, we posit that
Hypothesis 3. Consumers’ information searching will increase their self-efficacy of
using mobile payments.
Perceived knowledge refers to what consumers think they know about mobile payments
(Brucks, 1985). Consumers often feel that they learn a great deal from exposure to new
technologies because exposure itself is information exchange (Gravill, Compeau, & Marcolin,
2006; Khalifa et al., 2012). One possible explanation is that, with repeated exposure to mobile
payments, consumers may become more familiar with mobile payments without necessarily

92
gaining more actual knowledge of mobile payments than those who are less exposed to them
(Park, 2001). Familiarity is one important aspect of perceived knowledge, and consumers will
perceive themselves knowledgeable of mobile payments if they are familiar with mobile
payments (O’Cass, 2004). Thus, exposure to information regarding mobile payments is
anticipated to increase consumers’ perceived knowledge.
Exposure to information regarding mobile payments will initiate consumers’ implicit
learning and thereafter increase consumers’ perception of their knowledge of them. Individuals
will learn when they process information to which they are exposed (Mayer, 2003). Reber (1967)
posited that individuals will naturally learn when they are exposed to stimulus without requiring
consciousness. This learning mechanism is known as “implicit learning” (Reber, 1967).
Perceived knowledge is one type of learning outcome (Kraiger, 1993). Thus, consumers will
feel more knowledgeable of using mobile payments as of result of their implicit learning initiated
by exposure to information regarding mobile payments.
In this research, exposure to information regarding mobile payments is represented as
consumers’ exposure to positive word of mouth, social influence, and mass media. Consumers’
interaction with friends and exposure to mass media such as advertisement are two sources of
their product knowledge (O’Cass, 2004). For example, Sohail and Al-Jabri (2014) posited that
consumers gain information and thereafter knowledge about products or innovations through
exposure to mass media such as newspapers, television, and the Internet. The positive effect of
exposure to information regarding mobile payments on perceived knowledge is also supported
by some past research. Broussard (2000) and Tewksbury, Weaver, and Maddex (2001) found
that consumers’ frequency of exposure to online advertising and information on the Internet

93
about an innovation will have a positive relationship with their perceived knowledge of the
object. Thus, we posit that:
Hypothesis 4. Consumers’ exposure to mobile payments will increase their perceived
knowledge about mobile payments.
Information searching is a process by which individuals seek information about a
problem, situation, or artifact independently (Browne et al., 2007). It is a process during which
consumers purposely change their state of knowledge (Marchionini, 1995; Pelsmacker &
Janssens, 2007). Thus, information searching is anticipated to increase consumers’ perceived
knowledge of mobile payments (Brucks, 1985). In this research, we emphasize the positive
effects of increasing information searching because consumers search for information before
they make final decisions and people who do more information searching will have more
understanding of the innovation, and thus are more likely to adopt it (Pelsmacker & Janssens,
2007).
The positive relationship between information searching and perceived knowledge is
easily explained. Information searching will boost consumers’ self-confidence, and thereafter
allow them to feel more knowledgeable about mobile payments. Past research has viewed
information searching as an important factor that increases consumers’ confidence (Gershoff,
2001; Kaid, 2001; O’Cass & Pecotich, 2005). Consumers feel more confident because they will
have more understanding of the innovation through searching for information regarding mobile
payments. Consumers’ self-confidence is an important antecedent to their perceived knowledge
(Mattila & Wirtz, 2002; Park, Mothersbaugh, & Feick, 1994; Wirtz & Mattila, 2003).

94
In addition, consumers obtain information, a source of knowledge, through their
information searching behavior. Independent exploration behavior is an important type of
information searching behavior (Barki, Titah, & Boffo, 2007). By searching for information
independently, consumers obtain information in which they are interested. Knowledge is an
appropriate collection of information, and information is transferred to knowledge when
consumers add insight and better understanding to information (Spiegler, 2003). By searching for
information, consumers also become more informed and confident about mobile payments
(Smith et al., 2011). Feeling informed means “believing that you have some understanding of the
product (e.g., quality), how it meets personal needs, and potential time-related post-purchase
issues” (Smith, Johnston, & Howard, 2011, p. 643). Feeling informed is the belief of consumers
about their state of knowledge, which is anticipated to improve consumers’ knowledge about IT
innovations (Barki, et al., 2007). In view of the support discussed above, we suggest that the
more effort consumers spend on information searching, the more information they get, and thus
the more knowledgeable they feel.
Hypothesis 5. Consumers’ information searching will increase their perceived
knowledge about mobile payments.
Self-efficacy reflects the extent to which mobile payments consumers think they are able
to use mobile payments (Bandura, 1986). The positive relationship between self-efficacy and
attitude is captured in tripartite model of attitude. Tripartite model of attitude categorizes general
attitude to cognitive, affective, and conative attitudes and supports the effect of the cognitive
components on the affective components (Lavidge & Steiner, 1961). According to the tripartite
model of attitude, self-efficacy, an element of the cognitive dimension, is anticipated to

95
positively affect attitude, a factor of the affective dimension (Ajzen & Sexton, 1999). This logic
is reasonable because individuals prefer and enjoy behaviors that they are able to perform while
they dislike those that they do not think they can successfully perform (Compeau & Higgins,
1995). Bandura (1993) even posited that perceived self-efficacy can predict positive attitudes
better than actual ability.
Self-efficacy will encourage consumers to form a positive attitude toward mobile
payments by reducing their perceived risk and anxiety toward using mobile payments.
Consumers with high self-efficacy tend to think that they can handle uncertainty appropriately
and make accurate decisions with limited information (Cho & Lee, 2006), reducing their
perceived risk toward a desired behavior (Kim & Kim, 2005). In addition, self-efficacy reflects
consumers’ efficacy to cope with potential emergency events that will make them feel anxious.
Thus, a high level of self-efficacy will allow consumers to reduce their anxiety of using
technologies (Bandura, 1977a, 1986). Reduction of perceived risk and anxiety will encourage
consumers to form a positive attitude toward using technologies (Dash & Saji, 2008; Okazaki,
Molina, & Hirose, 2012; Venkatesh, 2000).
Some research also supports the effect of self-efficacy on attitude toward a desired
behavior. For example, Oliver and Shapiro (1993) posited that people’s self-efficacy positively
influences their willingness to achieve the desired outcomes that reflects their attitude toward the
behavior. Hsu and Chiu (2004) found that consumers’ self-efficacy affects their attitude toward
using e-service, and Gangadharbatla (2007) discussed the effect of self-efficacy on consumers’
attitude of using social networking sites. Thus, we posit that

96
Hypothesis 6. Consumers with a higher level of self-efficacy will be more likely to form
a positive attitude toward using mobile payments than those with a lower level of self-
efficacy.
Both knowledge and attitude are closely related to information one has. Knowledge about
mobile payments is used by consumers to evaluate them and form opinions and beliefs about
them (Martin & Lueg, 2013). Without such knowledge, attitude formation will not happen (Little
& John, 2002). The impact of knowledge on attitude is supported by the traditional knowledge-
attitude-behavior logic (Severin & Tankard, 2000). This logic assumes that “before people
consume most goods and services, they have some information about these goods and services
and form some attitude, no matter how weak that attitude or how quickly the attitude was
formed” (Barry, 2002, p. 46). Given that mobile payments has advantages such as mobility,
reachability, compatibility, and convenience compared to other payment approaches (Kim,
Mirusmonov, & Lee, 2010), we anticipate that consumers who perceive themselves
knowledgeable of mobile payments are more likely to form a more positive attitude than those
who have a lower level of perceived knowledge.
Perceived knowledge reflects how consumers think they are familiar with mobile
payments (Mihaela-Roxana, 2010). Perceived knowledge allows consumers to become familiar
with characteristics of mobile payments and then encourages them to form a positive attitude
toward mobile payments. With knowledge about mobile payments, individuals form an initial
attitude about the innovation based on their perceptions of technological characteristics such as
perceived usefulness and ease of use (Kang, Lim, Kim, & Yang, 2012). People prefer what is
familiar and feel discomfort when they are faced with unfamiliar objects (Venkatesan, 1973).
Moreover, perceived knowledge will encourage consumers to form positive attitude through

97
reducing their anxiety of using mobile payments. Lack of knowledge and confidence of handling
emergency events during using mobile payments is an important source of consumers’ anxiety
(Bandura, 1977a, 1986). Consumers who perceive themselves knowledgeable of mobile
payments will be more confident in handling emergency events during their usage of mobile
payments, decreasing their anxiety of using mobile payments. Anxiety has a negative impact on
consumers’ attitudes about IT innovations such as mobile payments (Venkatesh, 2000).
The positive relationship between perceived knowledge and attitude is also supported by
some past literature. Mathieson and Chin (2001) posited that perceived knowledge has a positive
relationship with individuals’ attitude toward using information systems. Eastman, Eastman, and
Eastman (2002) proposed that individuals with a high level of perceived knowledge about an
innovation may be more likely to have a positive attitude toward it. Pelsmacker and Janssens
(2007) and Lin and Hwang (2014) suggested that perceived knowledge will encourage
consumers to generate positive feelings toward IT innovations such as mobile payments. In view
of the support mentioned above, we anticipate that people with a higher level of perceived
knowledge will form a more positive attitude toward mobile payments than those with a lower
level of perceived knowledge.
Hypothesis 7. Consumers’ perceived knowledge will have a positive relationship with
their attitude toward using mobile payments.
Past research has identified many predictors of behavioral intention such as self-efficacy
and attitude. Their ability to predict behavioral intention is supported by theories such as theory
of planned behavior. According to that theory, self-efficacy and attitude positively influence
consumers’ behavioral intention toward mobile payments (Ajzen, 1991). The effects of self-

98
efficacy and attitude on behavioral intention have been verified by past research. Past literature
has applied the theory of planned behavior to predict many different types of behaviors such as
the adoption of electronic commerce (Pavlou & Fygenson, 2006), advanced mobile services
acceptance (Nicola´s et al., 2008; Nysveen, Pedersen, & Thorbjornsen, 2005), continued use of
social network sites (AI-Debei et al., 2013), and acceptance of mobile wallet (Shin, 2009). Thus,
it is anticipated that
Hypothesis 8. Consumers’ self-efficacy regarding the use of mobile payments will have
a positive relationship with their behavioral intention toward using mobile payments.
Hypothesis 9. Consumers’ attitude toward using mobile payments will have a positive
relationship with their behavioral intention toward using mobile payments.
Perceived knowledge influences consumers’ decision behavior (Smith et al., 2011).
Berger, Ratchford, & Haines Jr. (1994) suggested that perceived knowledge serves as a direct
antecedent of consumers’ behavioral intention. It is reasonable because perceived knowledge
encourages consumers to adopt innovations through reducing their perceived risk and
uncertainty. Consumers are not familiar with a new IT innovation or new features of the
innovation, increasing their perceive risk and uncertainty regarding it. Perceived risk and
uncertainty are two barriers that will impede consumers’ intention to use mobile payments
(Dahlberg et al., 2008; Lu et al., 2011; Mallat, 2007). Knowledge about IT innovations reduces
individuals’ perceived risk and uncertainty (Conrath, 1967). Thus, consumers’ perceived
knowledge reduces their perceived risk and uncertainty about mobile payments and thereafter
encourages them to use mobile payments.

99
Perceived knowledge encourages consumers to accept IT innovations while lack of
knowledge impedes their acceptance of innovations. This logic is well supported by past
literature. Mathieson and Chin (2001) posited that perceived knowledge has a positive
relationship with individuals’ intention to use information systems. Lin and Chen (2006) and Zhu
(2004) also emphasized the importance of the amount of product knowledge and found that
consumers’ knowledge affects their purchase intention through shaping their decision making
process. Bhattacherjee and Hikmet (2007) mentioned that related knowledge will help physicians
transition into using HIT systems. Meanwhile, lack of knowledge is also considered a barrier to
the adoption of innovations. Venkatesh and Brown (2001) found that consumers did not adopt
personal computers because of their lack of knowledge about them. Meanwhile, small firms did
not adopt EDI at first because they lacked knowledge about it (Chau, 2001). In view of all
support mentioned above, we posit that:
Hypothesis 10. Consumers’ perceived knowledge about mobile payments will have a
positive relationship with their behavioral intention toward using mobile payments.
Methodology
Data Collection
A survey based research was used to develop an understanding of the relationship
between consumer learning and consumers’ behavioral intention toward mobile payments. Two
sets of data were collected. The first dataset was collected from general public in China. Four
hundred and twenty four respondents were collected from China. Ninety eight respondents from
the China dataset were excluded from the dataset during data screening, making the final sample
size 326. In this dataset, there are 210 respondents who have used mobile payments and 116

100
respondents who have not used mobile payments. The second dataset was collected from general
public in the U.S. Two hundred and sixty two responses were collected from the U.S. Fifteen
respondents were excluded during the data screening, making the final sample 247. In this
dataset, 116 respondents have used mobile payments and 131 respondents have not used mobile
payments. In order to make a comparison of the user and the non-user groups and the China and
the U.S. datasets, we randomized selected 116 questionnaires from each group. Hence, we have
four groups: the user group from China, the non-user group from China, the user group from the
U.S., and the non-user group from the U.S., each of which has 116 respondents. Table 3
summarizes the demographic information of the participants.
Table 3. Demographic Information
China The U.S.
Measure Item User group
(n=116) Non-user
group (n=116) User group
(n=116) Non-user
group (n=116) # % # % # % # %
Age
<21 2 2 3 2.6 3 2.6 7 6.0 21-25 59 59.6 45 38.8 20 17.2 17 14.7 26-30 22 22.2 26 22.4 36 31.0 23 19.8 31-35 8 8.1 21 18.1 38 32.8 30 25.9 >35 8 8.1 21 18.1 19 16.4 39 33.6
Gender Male 67 67.7 71 61.2 40 34.5 36 31.0
Female 32 32.3 45 38.8 76 65.5 80 69.0
Education background
Some college or less
8 8.1 15 12.9 71 61.2 80 69.0
Bachelor 59 59.6 51 44 37 31.9 26 22.4 Master 22 22.2 34 29.3 7 6.0 10 8.6 PhD or
Professional 10 10.1 16 13.8 1 0.9 0 0
Time of using
mobile payment (Months)
None N/A N/A 116 100 N/A N/A 116 100 0-6 16 16.2 N/A N/A 22 19.0 N/A N/A
7-12 29 29.2 N/A N/A 32 27.6 N/A N/A 13-18 21 21.2 N/A N/A 28 24.1 N/A N/A 19-36 18 18.2 N/A N/A 20 17.2 N/A N/A
More than 36 15 15.2 N/A N/A 14 12.1 N/A N/A

101
Measures
Wherever possible, items were drawn from existing scales. Some minor modifications
were made to the adopted measures. All items are measured on a seven-point Likert scale,
ranging from strongly disagree (1) to strongly agree (7). Because data were collected from both
current and potential users, two versions of the questionnaire were used targeting users and non-
users. The English instruments was translated into Chinese by following the back translation
approach. In order to test the wording and reliability of the items, a pilot test was conducted
using a group of volunteer respondents in China and one English speaking group. Subsequently,
some minor changes were made to the questionnaires that can be found in Appendix 2 (English
version only).
Positive word of mouth was assessed with three items adapted from Alexandrov, Lilly,
and Babakus (2013). Media usage was assessed with five items adapted from Loibl et al. (2009)
and Wei et al. (2011). Explicit social influence was assessed with three items adapted from
Venkatesh et al. (2012), and implicit social influence was assessed with three items adapted from
Kim et al. (2007). Information searching was assessed with five items adapted from Barki et al.
(2007). Attitude toward using was assessed with four items adapted from Schierz et al. (2010).
Self-efficacy was assessed with three items adapted from Hsieh, Rai, and Keil (2011). Perceived
knowledge was assessed with four items adapted from Suh and Lee (2005). Potential users’
intention to use was assessed with three items adapted from Gu, Lee, and Suh (2009), and
current users’ intention to continue using was assessed with three items adapted from Venkatesh
et al. (2012). Perceived usefulness was assessed with three items adapted from Kim et al.,
(2010). Disposition to trust was assessed with three items adapted from Zhou (2011). Institution-
based trust was assessed with six items adapted from Setterstrom et al. (2013).

102
The technology acceptance model and the initial trust building model support the effect
of perceived ease of use, perceived usefulness, disposition to trust, and institution-based trust on
behavioral intention (Lin, Shih, & Sher, 2007; McKnight et al., 1998, 2002). Thus, perceived
ease of use, perceived usefulness, disposition to trust, and institution-based trust were used as
control variables in this research.
Data Analysis and Results
SmartPLS 2.0 (Ringle, Wende, & Will, 2005) was used to analyze the data. PLS was
chosen for its ability to handle non-normality in the data, and because the goal of this research is
to explain variance in the outcome variable (Gefen & Straub, 2000). Exposure to mobile
payments was measured using multiple subscales, which are media usage, positive word of
mouth, explicit social influence, and implicit social influence. We condensed exposure to mobile
payments by using latent variable scores of the subscales as items of the higher order construct.
We first calculated the latent variable scores of each subscale of exposure to mobile payments
using SmartPLS, and four latent variable scores were generated. Then we took these four factor
scores as the reflective items for exposure to mobile payments. Latent variable scores have been
widely used in prior studies to simplify a research model (Sun et al., 2012).
Common Method Bias
All data was collected through a self-report survey. Thus, there is a potential of common
method bias (Podsakoff et al. 2003). This research examined common method bias using three
tests. First, the Harmon’s single factor test was performed. Common method bias may exist if: a
single factor emerges from the unrotated factor solution, or one general factor accounts for the
majority of the covariance in the variables (Podsakoff et al. 2003). All the construct items were
cast into principal components factor analysis. For the user group from China, the result yielded

103
8 factors with eigenvalues greater than 1.0, which accounted for 75 percent of the total variance.
The first factor captured only 30 percent of the variance in the data. For the non-user group from
China, the result yielded 7 factors with eigenvalues greater than 1.0, which accounted for 77
percent of the total variance. The first factor captured only 40 percent of the variance in the data.
For the user group from the U.S., the results yielded 6 factors with eigenvalues greater than 1.0,
which accounted for 75 percent of the total variance. The first factor captured only 42 percent of
the variance in the data. For the non-user group from the U.S., the results yielded 6 factors with
eigenvalues greater than 1.0, which accounted for 77 percent of the total variance. The first
factor captured only 46 percent of the variance in the data. The results indicate that no single-
factor accounts for the majority of variance.
Second, researchers compared correlations among constructs by following the procedure
established by Pavlou, Liang, and Xue (2007). The results revealed no constructs with
correlations over 0.8.
Third, the unmeasured latent method construct (ULMC) technique (Liang, Saraf, Hu, &
Xue, 2007) was performed. For the user group from China, the results demonstrate that the
average substantively explained variance of the indicators is 0.720, while the average method-
based variance is 0.0087. The ratio of substantive variance to method variance is about 82.8:1. In
addition, the results revealed that 30 method factor loadings (out of 35) were not significant at a
95 percent confidence level. For the non-user group from China, the results demonstrate that the
average substantively explained variance of the indicators is 0.738, while the average method-
based variance is 0.006. The ratio of substantive variance to method variance is about 123.8:1. In
addition, the results revealed that 30 method factor loadings (out of 35) were not significant at a
95 percent confidence level. For the user group from the U.S, the results demonstrate that the

104
average substantively explained variance of the indicators is 0.768, while the average method-
based variance is 0.012. The ratio of substantive variance to method variance is about 62.5:1. In
addition, the results revealed that 29 method factor loadings (out of 35) were not significant at a
95 percent confidence level. For the non-user group from the U.S, the results demonstrate that
the average substantively explained variance of the indicators is 0.803, while the average
method-based variance is 0.006. The ratio of substantive variance to method variance is about
139:1. In addition, the results revealed that 31 method factor loadings (out of 35) were not
significant at a 95 percent confidence level. Taken together the above results indicate that
common method bias is unlikely to influence the analysis below.
Measurement Model
Perceived ease of use has no significant relationship with consumers’ behavioral
intention toward mobile payments for neither group. Thus, results with perceived usefulness,
disposition to trust and institution based trust were reported below. This research adopted the
two-stage analytical procedure (Anderson & Gerbing, 1988; Hair, Anderson, Tatham, & Black,
1998). Confirmative factor analysis was first conducted to assess the measurement model; then,
the structural relationships were examined. As shown in Tables 4, 5, 6, and 7, Cronbach’s alpha
ranged from 0.718 to 0.911 for the user group from China, from 0.823 to 0.91 for the non-user
group from China, from 0.818 to 0.940 for the user group from the U.S., and from 0.828 to 0.953
for the non-user group from the U.S., providing evidence of measure reliability (Cronbach,
1971). Meanwhile, composite reliability (CR) ranged from 0.828 to 0.944 for the user group
from China, from 0.885 to 0.937 for the non-user group from China, from 0.880 to 0.952 for the
user group from the U.S., and from 0.886 to 0.969 for the non-user group from the U.S.,
indicating valid internal consistency reliability (Chin, 1998). All AVEs are larger than 0.5,
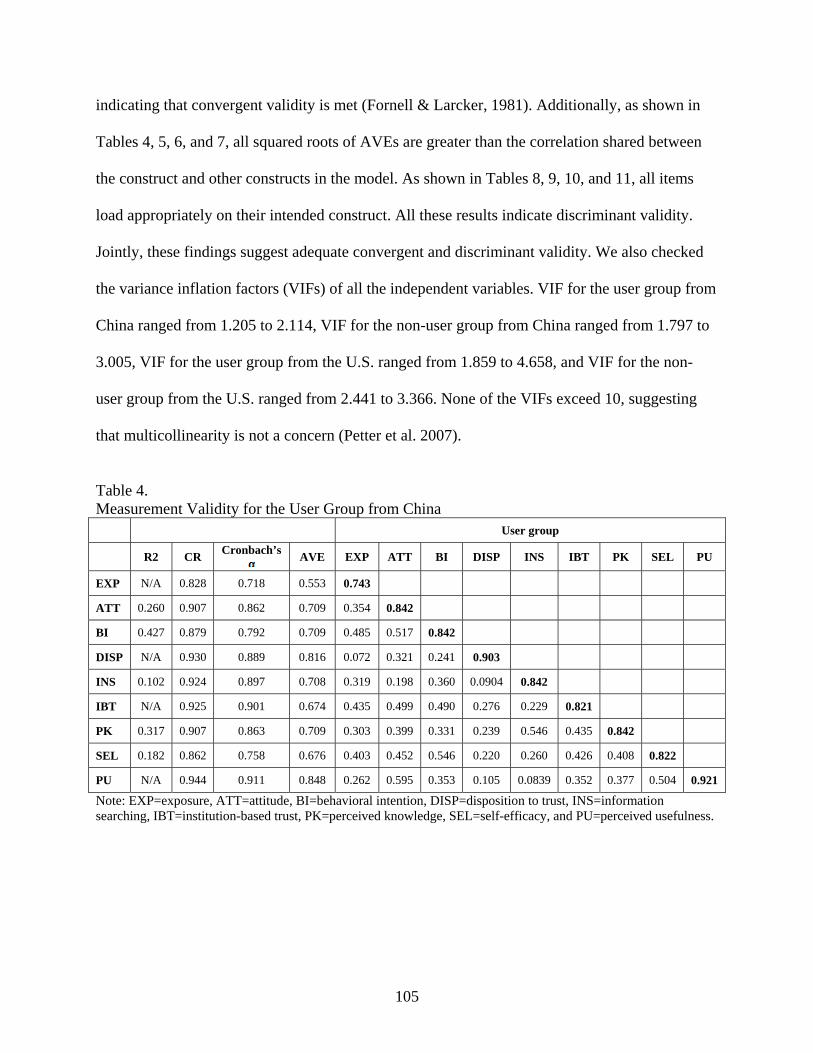
105
indicating that convergent validity is met (Fornell & Larcker, 1981). Additionally, as shown in
Tables 4, 5, 6, and 7, all squared roots of AVEs are greater than the correlation shared between
the construct and other constructs in the model. As shown in Tables 8, 9, 10, and 11, all items
load appropriately on their intended construct. All these results indicate discriminant validity.
Jointly, these findings suggest adequate convergent and discriminant validity. We also checked
the variance inflation factors (VIFs) of all the independent variables. VIF for the user group from
China ranged from 1.205 to 2.114, VIF for the non-user group from China ranged from 1.797 to
3.005, VIF for the user group from the U.S. ranged from 1.859 to 4.658, and VIF for the non-
user group from the U.S. ranged from 2.441 to 3.366. None of the VIFs exceed 10, suggesting
that multicollinearity is not a concern (Petter et al. 2007).
Table 4. Measurement Validity for the User Group from China
User group
R2 CR Cronbach’s
AVE EXP ATT BI DISP INS IBT PK SEL PU
EXP N/A 0.828 0.718 0.553 0.743
ATT 0.260 0.907 0.862 0.709 0.354 0.842
BI 0.427 0.879 0.792 0.709 0.485 0.517 0.842
DISP N/A 0.930 0.889 0.816 0.072 0.321 0.241 0.903
INS 0.102 0.924 0.897 0.708 0.319 0.198 0.360 0.0904 0.842
IBT N/A 0.925 0.901 0.674 0.435 0.499 0.490 0.276 0.229 0.821
PK 0.317 0.907 0.863 0.709 0.303 0.399 0.331 0.239 0.546 0.435 0.842
SEL 0.182 0.862 0.758 0.676 0.403 0.452 0.546 0.220 0.260 0.426 0.408 0.822
PU N/A 0.944 0.911 0.848 0.262 0.595 0.353 0.105 0.0839 0.352 0.377 0.504 0.921
Note: EXP=exposure, ATT=attitude, BI=behavioral intention, DISP=disposition to trust, INS=information searching, IBT=institution-based trust, PK=perceived knowledge, SEL=self-efficacy, and PU=perceived usefulness.

106
Table 5. Measurement Validity for the Non-User Group from China
Non-User group
R2 CR Cronbach’s AVE EXP ATT BI DISP INS IBT PK SEL PU
EXP N/A 0.885 0.823 0.661 0.813
ATT 0.3253 0.909 0.866 0.716 0.557 0.846
BI 0.6596 0.937 0.898 0.831 0.564 0.691 0.912
DISP N/A 0.918 0.867 0.790 0.436 0.447 0.558 0.889
INS 0.2342 0.933 0.910 0.735 0.484 0.335 0.404 0.48 0.858
IBT N/A 0.925 0.904 0.674 0.463 0.467 0.572 0.562 0.4 0.821
PK 0.3429 0.887 0.832 0.665 0.414 0.433 0.364 0.434 0.563 0.403 0.815
SEL 0.3806 0.919 0.869 0.791 0.383 0.553 0.483 0.535 0.609 0.412 0.574 0.889
PU N/A 0.934 0.894 0.825 0.455 0.692 0.640 0.221 0.372 0.318 0.394 0.510 0.909
Note: EXP=exposure, ATT=attitude, BI=behavioral intention, DISP=disposition to trust, INS=information searching, IBT=institution-based trust, PK=perceived knowledge, SEL=self-efficacy, and PU=perceived usefulness. Table 6. Measurement Validity for the User Group from the U.S.
User group
R2 CR Cronbach’s
AVE EXP ATT BI DISP INS IBT PK SEL PU
EXP N/A 0.907 0.863 0.710 0.843
ATT 0.427 0.880 0.818 0.650 0.546 0.806
BI 0.775 0.933 0.891 0.822 0.476 0.766 0.906
DISP N/A 0.915 0.861 0.783 0.344 0.460 0.535 0.885
INS 0.231 0.947 0.930 0.781 0.480 0.408 0.347 0.247 0.884
IBT N/A 0.952 0.940 0.770 0.435 0.643 0.689 0.663 0.316 0.877
PK 0.507 0.911 0.868 0.721 0.514 0.483 0.554 0.377 0.679 0.390 0.849
SEL 0.109 0.937 0.899 0.831 0.230 0.629 0.695 0.361 0.318 0.479 0.525 0.912
PU N/A 0.923 0.875 0.801 0.464 0.745 0.798 0.435 0.386 0.521 0.491 0.711 0.895
Note: EXP=exposure, ATT=attitude, BI=behavioral intention, DISP=disposition to trust, INS=information searching, IBT=institution-based trust, PK=perceived knowledge, SEL=self-efficacy, and PU=perceived usefulness. Structural Model
The path coefficients and explained variances of the structural model for both groups from China
and the U.S. are shown in Figure 3 and Figure 4, respectively. The PLS model does not generate
the model fit statistics but uses R2 to assess the explanatory power of a structural model. In the

107
China dataset, the model explained 42.7% of the variance in users’ intention to continue using,
and 66% of the variance in non-users’ intention to use. In the American dataset, the model
explained 77.5% of the variance in users’ intention to continue using, and 63.9% of the variance
in non-users’ intention to use. These statistics validate the predictive power of the model.
Table 7. Measurement Validity for the Non-User Group from the U.S.
Non-User group
R2 CR Cronbach’s AVE EXP ATT BI DISP INS IBT PK SEL PU
EXP N/A 0.886 0.828 0.662 0.814
ATT 0.332 0.927 0.894 0.760 0.497 0.871
BI 0.639 0.969 0.951 0.911 0.594 0.710 0.955
DISP N/A 0.927 0.881 0.809 0.351 0.543 0.533 0.899
INS 0.549 0.962 0.951 0.835 0.741 0.402 0.489 0.308 0.914
IBT N/A 0.963 0.953 0.812 0.421 0.527 0.568 0.725 0.406 0.901
PK 0.594 0.893 0.832 0.684 0.653 0.466 0.498 0.471 0.758 0.511 0.827
SEL 0.188 0.967 0.949 0.907 0.383 0.544 0.536 0.596 0.420 0.535 0.572 0.952
PU N/A 0.951 0.923 0.866 0.523 0.698 0.725 0.496 0.404 0.509 0.478 0.660 0.931
Note: EXP=exposure, ATT=attitude, BI=behavioral intention, DISP=disposition to trust, INS=information searching, IBT=institution-based trust, PK=perceived knowledge, SEL=self-efficacy, and PU=perceived usefulness. For the user group from China, the results indicate that exposure to mobile payments has
a positive impact on information searching (b=0.319, p<0.001) and self-efficacy (b=0.357,
p<0.001) but does not affect perceived knowledge, supporting H1 and H2 while not supporting
H4. Information searching has a positive relationship with perceived knowledge (b=0.500,
p<0.001) but does not affect self-efficacy. Thus, H5 is supported while H3 is not. Self-efficacy
(b=0.347, p<0.01) and perceived knowledge (b=0.258, p<0.05) each have a positive relationship
with consumers’ attitude, supporting both H6 and H7. Self-efficacy (b=0.358, p<0.05) and
attitude (b=0.287, p<0.05) both have a positive relationship with users’ intention toward mobile
payments, but perceived knowledge does not affect users’ behavioral intention. Thus, H8 and H9
are supported while H10 is not.

108
Table 8. Cross Loading for the User Group from China
EXP ATT BI DISP INS IBT PK SEL PU
EXP1 0.835 0.348 0.445 0.052 0.187 0.414 0.242 0.240 0.212
EXP2 0.768 0.206 0.301 0.0597 0.194 0.290 0.219 0.252 0.216
EXP3 0.539 0.095 0.210 0.076 0.328 0.124 0.203 0.187 0.071
EXP4 0.795 0.367 0.448 0.032 0.228 0.428 0.229 0.458 0.257
ATT1 0.309 0.891 0.496 0.261 0.193 0.546 0.337 0.355 0.523
ATT2 0.365 0.825 0.446 0.326 0.147 0.438 0.298 0.416 0.542
ATT3 0.237 0.869 0.362 0.213 0.137 0.419 0.354 0.333 0.573
ATT4 0.274 0.778 0.427 0.275 0.185 0.275 0.354 0.409 0.369
BI1 0.280 0.415 0.756 -0.011 0.285 0.308 0.266 0.529 0.393
BI2 0.441 0.481 0.886 0.289 0.281 0.425 0.303 0.432 0.259
BI3 0.490 0.410 0.878 0.305 0.343 0.495 0.267 0.429 0.252
DISP1 0.081 0.259 0.167 0.839 0.081 0.180 0.171 0.218 0.102
DISP2 0.094 0.368 0.264 0.924 0.100 0.355 0.286 0.226 0.127
DISP3 0.016 0.219 0.201 0.943 0.060 0.171 0.165 0.149 0.047
INS1 0.125 0.150 0.282 0.023 0.827 0.211 0.477 0.254 0.099
INS2 0.235 0.202 0.317 0.045 0.859 0.248 0.474 0.228 0.116
INS3 0.264 0.209 0.244 0.058 0.848 0.172 0.413 0.232 0.095
INS4 0.328 0.138 0.299 0.107 0.874 0.179 0.482 0.183 0.014
INS5 0.367 0.139 0.361 0.135 0.799 0.157 0.450 0.205 0.039
IBT1 0.393 0.572 0.460 0.205 0.245 0.733 0.460 0.392 0.401
IBT2 0.267 0.177 0.307 0.354 0.083 0.68 0.269 0.247 0.153
IBT3 0.448 0.429 0.333 0.253 0.222 0.850 0.379 0.283 0.316
IBT4 0.350 0.367 0.443 0.252 0.199 0.903 0.354 0.292 0.253
IBT5 0.287 0.439 0.388 0.272 0.137 0.873 0.281 0.406 0.325
IBT6 0.384 0.406 0.435 0.0729 0.210 0.861 0.365 0.437 0.251
PK1 0.257 0.368 0.333 0.220 0.533 0.419 0.882 0.383 0.325
PK2 0.286 0.402 0.288 0.319 0.301 0.318 0.777 0.388 0.324
PK3 0.219 0.231 0.197 0.133 0.550 0.294 0.860 0.249 0.321
PK4 0.259 0.333 0.283 0.130 0.450 0.420 0.846 0.344 0.298
SEL1 0.384 0.438 0.483 0.248 0.172 0.329 0.329 0.877 0.379
SEL2 0.270 0.329 0.470 -0.029 0.254 0.309 0.335 0.739 0.531
SEL3 0.335 0.339 0.387 0.319 0.221 0.417 0.344 0.845 0.333
PU1 0.284 0.541 0.395 0.056 0.097 0.344 0.394 0.478 0.958
PU2 0.241 0.563 0.300 0.096 0.084 0.284 0.350 0.459 0.929
PU3 0.179 0.551 0.251 0.163 0.040 0.348 0.277 0.457 0.874 Note: EXP=exposure, ATT=attitude, BI=behavioral intention, DISP=disposition to trust, INS=information searching, IBT=institution-based trust, PK=perceived knowledge, SEL=self-efficacy, and PU=perceived usefulness.
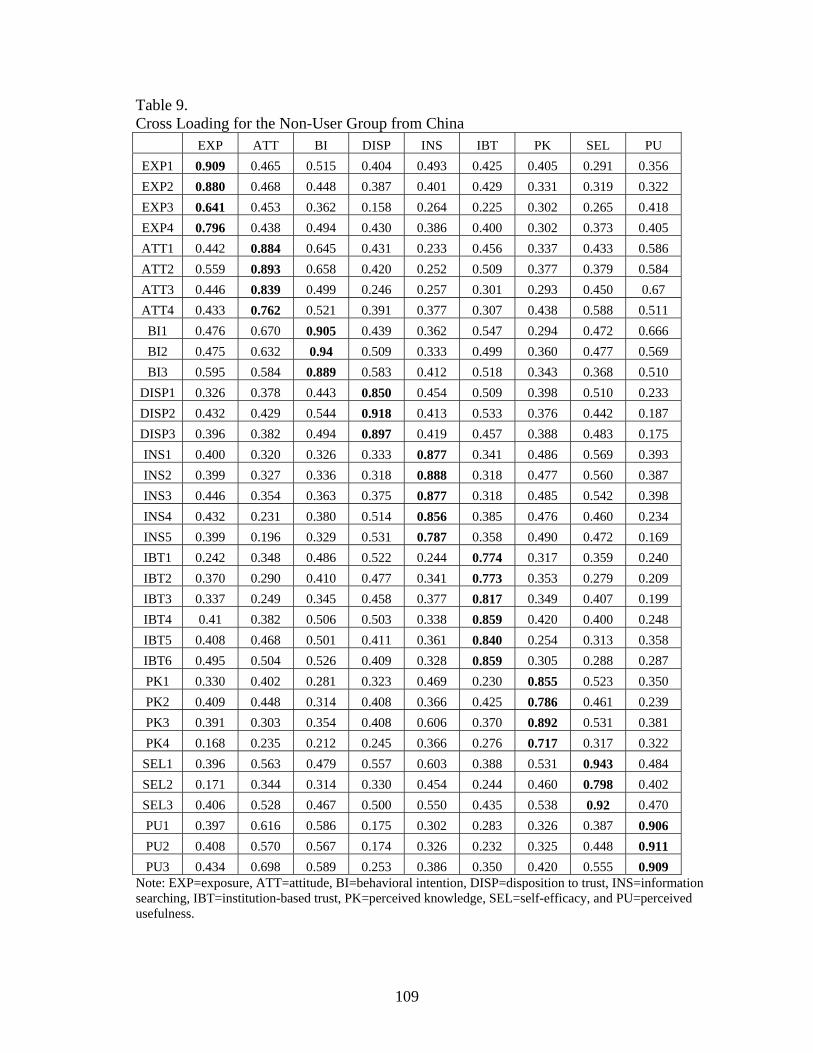
109
Table 9. Cross Loading for the Non-User Group from China
EXP ATT BI DISP INS IBT PK SEL PU
EXP1 0.909 0.465 0.515 0.404 0.493 0.425 0.405 0.291 0.356
EXP2 0.880 0.468 0.448 0.387 0.401 0.429 0.331 0.319 0.322
EXP3 0.641 0.453 0.362 0.158 0.264 0.225 0.302 0.265 0.418
EXP4 0.796 0.438 0.494 0.430 0.386 0.400 0.302 0.373 0.405
ATT1 0.442 0.884 0.645 0.431 0.233 0.456 0.337 0.433 0.586
ATT2 0.559 0.893 0.658 0.420 0.252 0.509 0.377 0.379 0.584
ATT3 0.446 0.839 0.499 0.246 0.257 0.301 0.293 0.450 0.67
ATT4 0.433 0.762 0.521 0.391 0.377 0.307 0.438 0.588 0.511
BI1 0.476 0.670 0.905 0.439 0.362 0.547 0.294 0.472 0.666
BI2 0.475 0.632 0.94 0.509 0.333 0.499 0.360 0.477 0.569
BI3 0.595 0.584 0.889 0.583 0.412 0.518 0.343 0.368 0.510
DISP1 0.326 0.378 0.443 0.850 0.454 0.509 0.398 0.510 0.233
DISP2 0.432 0.429 0.544 0.918 0.413 0.533 0.376 0.442 0.187
DISP3 0.396 0.382 0.494 0.897 0.419 0.457 0.388 0.483 0.175
INS1 0.400 0.320 0.326 0.333 0.877 0.341 0.486 0.569 0.393
INS2 0.399 0.327 0.336 0.318 0.888 0.318 0.477 0.560 0.387
INS3 0.446 0.354 0.363 0.375 0.877 0.318 0.485 0.542 0.398
INS4 0.432 0.231 0.380 0.514 0.856 0.385 0.476 0.460 0.234
INS5 0.399 0.196 0.329 0.531 0.787 0.358 0.490 0.472 0.169
IBT1 0.242 0.348 0.486 0.522 0.244 0.774 0.317 0.359 0.240
IBT2 0.370 0.290 0.410 0.477 0.341 0.773 0.353 0.279 0.209
IBT3 0.337 0.249 0.345 0.458 0.377 0.817 0.349 0.407 0.199
IBT4 0.41 0.382 0.506 0.503 0.338 0.859 0.420 0.400 0.248
IBT5 0.408 0.468 0.501 0.411 0.361 0.840 0.254 0.313 0.358
IBT6 0.495 0.504 0.526 0.409 0.328 0.859 0.305 0.288 0.287
PK1 0.330 0.402 0.281 0.323 0.469 0.230 0.855 0.523 0.350
PK2 0.409 0.448 0.314 0.408 0.366 0.425 0.786 0.461 0.239
PK3 0.391 0.303 0.354 0.408 0.606 0.370 0.892 0.531 0.381
PK4 0.168 0.235 0.212 0.245 0.366 0.276 0.717 0.317 0.322
SEL1 0.396 0.563 0.479 0.557 0.603 0.388 0.531 0.943 0.484
SEL2 0.171 0.344 0.314 0.330 0.454 0.244 0.460 0.798 0.402
SEL3 0.406 0.528 0.467 0.500 0.550 0.435 0.538 0.92 0.470
PU1 0.397 0.616 0.586 0.175 0.302 0.283 0.326 0.387 0.906
PU2 0.408 0.570 0.567 0.174 0.326 0.232 0.325 0.448 0.911
PU3 0.434 0.698 0.589 0.253 0.386 0.350 0.420 0.555 0.909 Note: EXP=exposure, ATT=attitude, BI=behavioral intention, DISP=disposition to trust, INS=information searching, IBT=institution-based trust, PK=perceived knowledge, SEL=self-efficacy, and PU=perceived usefulness.

110
Table 10. Cross Loading for the User Group from the U.S.
EXP ATT BI DISP INS IBT PK SEL PU
EXP1 0.940 0.470 0.417 0.271 0.536 0.351 0.530 0.203 0.445
EXP2 0.865 0.536 0.490 0.298 0.355 0.397 0.439 0.282 0.479
EXP3 0.690 0.210 0.178 0.210 0.303 0.239 0.333 -0.041 0.072
EXP4 0.857 0.551 0.451 0.374 0.387 0.457 0.400 0.241 0.450
ATT1 0.493 0.916 0.735 0.451 0.316 0.643 0.438 0.610 0.652
ATT2 0.522 0.845 0.652 0.390 0.317 0.541 0.413 0.473 0.606
ATT3 0.361 0.760 0.588 0.232 0.304 0.407 0.393 0.590 0.657
ATT4 0.379 0.685 0.454 0.443 0.432 0.474 0.290 0.288 0.461
BI1 0.354 0.719 0.930 0.468 0.323 0.615 0.503 0.734 0.761
BI2 0.430 0.662 0.900 0.466 0.312 0.571 0.469 0.602 0.684
BI3 0.513 0.701 0.889 0.521 0.309 0.683 0.532 0.550 0.721
DISP1 0.324 0.450 0.556 0.921 0.316 0.662 0.431 0.432 0.428
DISP2 0.313 0.322 0.374 0.795 0.084 0.463 0.202 0.186 0.354
DISP3 0.279 0.434 0.465 0.931 0.215 0.608 0.330 0.299 0.368
INS1 0.334 0.386 0.347 0.251 0.896 0.304 0.612 0.341 0.349
INS2 0.376 0.383 0.319 0.251 0.916 0.314 0.633 0.272 0.365
INS3 0.380 0.377 0.355 0.243 0.893 0.335 0.647 0.386 0.414
INS4 0.454 0.297 0.239 0.142 0.856 0.174 0.551 0.224 0.262
INS5 0.581 0.356 0.266 0.200 0.856 0.258 0.552 0.168 0.308
IBT1 0.305 0.506 0.544 0.641 0.258 0.893 0.273 0.373 0.405
IBT2 0.411 0.600 0.547 0.553 0.318 0.885 0.305 0.387 0.412
IBT3 0.419 0.578 0.627 0.649 0.276 0.915 0.332 0.408 0.447
IBT4 0.374 0.545 0.612 0.559 0.280 0.859 0.394 0.440 0.424
IBT5 0.403 0.575 0.601 0.490 0.245 0.791 0.339 0.419 0.545
IBT6 0.369 0.574 0.672 0.595 0.287 0.915 0.391 0.481 0.498
PK1 0.452 0.485 0.560 0.424 0.551 0.454 0.862 0.608 0.508
PK2 0.384 0.223 0.234 0.190 0.405 0.103 0.672 0.165 0.188
PK3 0.456 0.411 0.482 0.305 0.677 0.336 0.935 0.476 0.421
PK4 0.457 0.468 0.537 0.327 0.637 0.358 0.904 0.448 0.482
SEL1 0.236 0.616 0.673 0.459 0.351 0.505 0.515 0.922 0.666
SEL2 0.161 0.580 0.587 0.302 0.251 0.358 0.459 0.907 0.642
SEL3 0.226 0.518 0.633 0.208 0.257 0.436 0.457 0.905 0.636
PU1 0.399 0.556 0.646 0.388 0.303 0.398 0.448 0.559 0.872
PU2 0.441 0.707 0.764 0.400 0.368 0.498 0.471 0.638 0.932
PU3 0.405 0.726 0.724 0.382 0.362 0.496 0.399 0.707 0.880
Note: EXP=exposure, ATT=attitude, BI=behavioral intention, DISP=disposition to trust, INS=information searching, IBT=institution-based trust, PK=perceived knowledge, SEL=self-efficacy, and PU=perceived usefulness.

111
Table 11. Cross Loading for the Non-User Group from the U.S.
EXP ATT BI DISP INS IBT PK SEL PU EXP1 0.898 0.416 0.541 0.344 0.639 0.388 0.599 0.377 0.441
EXP2 0.73 0.458 0.506 0.245 0.456 0.317 0.463 0.268 0.471
EXP3 0.756 0.291 0.377 0.207 0.703 0.287 0.554 0.266 0.330
EXP4 0.859 0.475 0.517 0.341 0.585 0.376 0.495 0.328 0.477
ATT1 0.482 0.889 0.610 0.501 0.386 0.518 0.424 0.432 0.555
ATT2 0.417 0.878 0.595 0.568 0.331 0.553 0.448 0.452 0.559
ATT3 0.424 0.909 0.647 0.456 0.347 0.376 0.427 0.549 0.724
ATT4 0.412 0.806 0.622 0.366 0.339 0.396 0.320 0.459 0.584
BI1 0.575 0.669 0.962 0.510 0.470 0.525 0.488 0.529 0.710
BI2 0.565 0.682 0.961 0.462 0.481 0.497 0.471 0.486 0.701
BI3 0.559 0.681 0.940 0.552 0.449 0.602 0.468 0.517 0.666
DISP1 0.347 0.548 0.493 0.926 0.327 0.690 0.535 0.588 0.464
DISP2 0.242 0.409 0.426 0.851 0.136 0.558 0.294 0.483 0.408
DISP3 0.349 0.500 0.514 0.918 0.349 0.696 0.426 0.532 0.462
INS1 0.654 0.375 0.383 0.241 0.923 0.326 0.680 0.377 0.354
INS2 0.701 0.428 0.510 0.285 0.926 0.368 0.697 0.371 0.401
INS3 0.657 0.321 0.428 0.273 0.904 0.383 0.703 0.357 0.363
INS4 0.683 0.330 0.420 0.321 0.925 0.407 0.718 0.410 0.378
INS5 0.688 0.382 0.489 0.287 0.892 0.368 0.665 0.404 0.351
IBT1 0.386 0.488 0.514 0.659 0.346 0.938 0.460 0.471 0.424
IBT2 0.410 0.391 0.472 0.626 0.354 0.894 0.396 0.411 0.409
IBT3 0.396 0.463 0.553 0.682 0.392 0.942 0.488 0.457 0.440
IBT4 0.395 0.512 0.528 0.630 0.399 0.928 0.507 0.516 0.468
IBT5 0.307 0.461 0.408 0.596 0.307 0.758 0.364 0.495 0.474
IBT6 0.378 0.528 0.575 0.718 0.386 0.932 0.520 0.547 0.539
PK1 0.629 0.404 0.401 0.410 0.737 0.461 0.876 0.454 0.357
PK2 0.300 0.350 0.287 0.183 0.224 0.173 0.522 0.235 0.268
PK3 0.606 0.429 0.476 0.416 0.777 0.464 0.942 0.572 0.465
PK4 0.560 0.374 0.464 0.493 0.633 0.517 0.899 0.562 0.468
SEL1 0.414 0.584 0.585 0.593 0.430 0.577 0.543 0.935 0.659
SEL2 0.358 0.503 0.481 0.564 0.401 0.482 0.563 0.963 0.615
SEL3 0.308 0.448 0.444 0.536 0.359 0.453 0.522 0.959 0.600
PU1 0.536 0.573 0.648 0.396 0.374 0.419 0.440 0.562 0.923
PU2 0.478 0.631 0.670 0.448 0.367 0.467 0.461 0.640 0.960
PU3 0.448 0.738 0.703 0.533 0.387 0.531 0.433 0.637 0.909 Note: EXP=exposure, ATT=attitude, BI=behavioral intention, DISP=disposition to trust, INS=information searching, IBT=institution-based trust, PK=perceived knowledge, SEL=self-efficacy, and PU=perceived usefulness.

112
Note: the upper coefficients are for the user group, and the lower coefficients are for the non-user group; *p<0.05, **p<0.01, ***p<0.001, and n.s.=not significant; control variables: DISP= disposition to trust, IBT=institution-based trust, and PU=perceived usefulness.
Figure 3. Structural Model for China
For the non-user group from China, the results indicate that exposure to mobile payments
has a positive impact on information searching (b=0.484, p<0.001) and perceived knowledge
(b=0.185, p<0.05) but does not affect self-efficacy, supporting H1 and H4 while not supporting
H2. Information searching has a positive relationship with perceived knowledge (b=0.473,
p<0.001) and self-efficacy (b=0.552, p<0.001). Thus, H3 and H5 are supported. Self-efficacy
(b=0.453, p<0.001) and perceived knowledge (b=0.173, p<0.05) each have a positive
relationship with consumers’ attitude, supporting both H6 and H7. Attitude (b=0.250, p<0.05)
has a positive relationship with users’ intention toward mobile payments, but self-efficacy and
0.358* -0.061 n.s.
0.357*** 0.116 n.s.
0.146 n.s. 0.552***
0.319*** 0.484***
0.347** 0.453***
0.500*** 0.473***
0.144 n.s. 0.185* 0.258*
0.173*
0.287* 0.250*
0.001 n.s. -0.085 n.s.
0.018 n.s. 0.306***
-0.076 n.s. 0.394***
0.102 0.234
0.427 0.660
0.259 0.325
0.182 0.381
0.216* 0.218**
0.316 0.343
Exposure
Information Searching
Self-Efficacy
Attitude
Perceived Knowledge
Behavioral Intention
DISP
IBT
PU

113
perceived knowledge do not affect users’ behavioral intention. Thus, H9 is supported while H8
and H10 are not.
Note: the upper coefficients are for the user group, and the lower coefficients are for the non-user group; *p<0.05, **p<0.01, ***p<0.001, and n.s.=not significant; control variables: DISP=disposition to trust, IBT=institution-based trust, and PU=perceived usefulness.
Figure 4. Structural Model for the U.S.
For the user group from the U.S., the results indicate that exposure to mobile payments
has a positive impact on information searching (b=0.480, p<0.001) and perceived knowledge
(b=0.244, p<0.01) but does not affect self-efficacy, supporting H1 and H4 while not supporting
H2. Information searching has a positive relationship with self-efficacy (b=0.269, p<0.05) and
perceived knowledge (b=0.562, p<0.001). Thus, H3 and H5 is supported. Self-efficacy (b=0.518,
p<0.001) and perceived knowledge (b=0.211, p<0.01) each have a positive relationship with
consumers’ attitude, supporting both H6 and H7. Attitude (b=0.176, p<0.05) has a positive
0.126 n.s. -0.065 n.s.
0.100 n.s. 0.159 n.s.
0.269* 0.302*
0.480*** 0.741***
0.518*** 0.413***
0.562*** 0.608***
0.244** 0.202* 0.211**
0.230*
0.176* 0.314***
0.105 n.s. 0.099 n.s.
0.038 n.s. 0.048 n.s.
0.377*** 0.402***
0.231 0.549
0.775 0.639
0.427 0.332
0.109 0.188
0.253* 0.147 n.s.
0.507 0.594
Exposure
Information Searching
Self-Efficacy
Attitude
Perceived Knowledge
Behavioral Intention
DISP
IBT
PU

114
relationship with users’ intention to continue using mobile payments, but self-efficacy and
perceived knowledge do not affect users’ behavioral intention. Thus, H9 is supported while H8
and H10 are not.
For the non-user group from the U.S., the results indicate that exposure to mobile
payments has a positive impact on information searching (b=0.741, p<0.001) and perceived
knowledge (b=0.202, p<0.05) but does not affect self-efficacy, supporting H1 and H4 while not
supporting H2. Information searching has a positive relationship with self-efficacy (b=0.302,
p<0.05) and perceived knowledge (b=0.608, p<0.001). Thus, H3 and H5 are supported. Self-
efficacy (b=0.413, p<0.001) and perceived knowledge (b=0.230, p<0.05) each have a positive
relationship with consumers’ attitude, supporting H6 and H7. Attitude (b=0.314, p<0.001) has a
positive relationship with users’ intention to continue using mobile payments, but self-efficacy
and perceived knowledge do not affect users’ behavioral intention. Thus, H9 is supported while
H8 and H10 are not. Results of the hypotheses testing are summarized in Table 12.
Table 12. Summary of Hypotheses Testing
Hypotheses China U.S.A
Users Non-Users Users Non-Users H1. Exposure Information Searching
Supported Supported Supported Supported
H2. Exposure Self-Efficacy Supported Not Supported Not Supported Not Supported H3. Information Searching Self-Efficacy
Not Supported Supported Supported Supported
H4. Exposure Perceived Knowledge
Not Supported Supported Supported Supported
H5. Information Searching Perceived Knowledge
Supported Supported Supported Supported
H6. Self-Efficacy Attitude Supported Supported Supported Supported
H7. Perceived Knowledge Attitude Supported Supported Supported Supported H8. Self-Efficacy Behavioral Intention
Supported Not Supported Not Supported Not Supported
H9. Attitude Behavioral Intention Supported Supported Supported Supported H10. Perceived Knowledge Behavioral Intention
Not supported Not Supported Not Supported Not Supported

115
Multi Group Analysis
In the structural model, the path coefficients vary across the user and the non-user groups
and across China and the U.S. datasets. A multi group analysis with PLS was conducted in order
to test whether these differences are significant (Chin, 2000).
Frist, we compared the user and the non-user groups from China. The results are
summarized in Table 13 that shows that five path coefficients are significantly different between
the user group and the non-user group. Additionally, exposure to mobile payments has a
significant relationship with users’ perceived knowledge but does not have a positive relationship
with non-users’ perceived knowledge, an additional difference between the two groups.
According to the results, six path coefficients are different between the two groups: exposure to
self-efficacy, information searching to self-efficacy, self-efficacy to behavioral intention, and
disposition to trust to behavioral intention, perceived usefulness to behavioral intention, and
exposure to perceived knowledge.
Second, we compared the user and the non-user groups from the U.S. The results are
summarized in Table 14 that shows that two path coefficients are significantly different across
the user and the non-user groups. Additionally, institution based trust has a significant
relationship with users’ intention to continue using mobile payments but does not affect non-
users’ intention to use, an additional difference across the two groups. According to the results,
three path coefficients are different across the two groups: exposure to information searching,
self-efficacy to behavioral intention, and institution-based trust to behavioral intention.
Third, we compared the user groups from China and the U.S. The results are summarized
in Table 15 that shows that two path coefficients are significantly different across the user groups
from China and the U.S. Additionally, information searching has a positive relationship with

116
self-efficacy of users from the U.S. but does not affect self-efficacy of users from China,
exposure to mobile payments positively affect American users’ perceived knowledge but does
not affect Chinese users’ perceived knowledge, and Chinese users’ self-efficacy positively
affects their behavioral intention but American users’ self-efficacy does not. According to the
results, five path coefficients are different between the two groups: exposure to self-efficacy,
information searching to self-efficacy, exposure to perceived knowledge, self-efficacy to
behavioral intention, and perceived usefulness to behavioral intention,
Table 13. Result of Parametric Multi-Group Analysis with PLS for the Two Groups of China
Path b:users b:non-users
Equal variance Different variance P (one tail) P (one tail)
H1: Exposure -> Information Search 0.319* 0.484* 0.077 0.077
H2: Exposure -> Self-Efficacy 0.357* 0.116 0.030 0.030
H3: Information Searching -> Self-Efficacy 0.146 0.552* 0.0003 0.0003
H4: Exposure -> Perceived Knowledge 0.144 0.185* 0.363 0.363 H5: Information Searching -> Perceived Knowledge
0.500* 0.473* 0.412 0.412
H6: Self-Efficacy -> Attitude 0.347* 0.453* 0.262 0.262
H7: Perceived Knowledge -> Attitude 0.258* 0.173* 0.265 0.265
H8: Self-Efficacy -> Behavioral Intention 0.358* -0.061 0.004 0.004
H9: Attitude -> Behavioral Intention 0.287* 0.250* 0.405 0.405
H10: Perceived Knowledge -> Behavioral Intention 0.001 -0.085 0.179 0.179 Control: Disposition to Trust -> Behavioral Intention
0.018 0.306* 0.001 0.001
Control: Institution Based Trust -> Behavioral Intention
0.216* 0.218* 0.495 0.495
Control: Usefulness -> Behavioral Intention -0.076 0.394* 0.0002 0.0002 Note: Bolded indicates statistically differences between groups; italic indicates differences because one is significant and the other is not; *are significant path coefficients. Finally, we compared the non-user groups from China and the U.S. The results are
summarized in Table 16 that shows that three path coefficients are significantly different
between the user group and the non-user group. Additionally, Chinese non-users’ institution-
based trust positively affect their behavioral intention but American non-users’ institution-based
trust does not affect their behavioral intention. According to the results, four path coefficients are

117
different between the two groups: exposure to information searching, perceived knowledge to
behavioral intention, disposition to trust to behavioral intention, and institution-based trust to
behavioral intention.
Table 14. Result of Parametric Multi-Group Analysis with PLS for the Two Groups of the U.S.
Path b:users b:non-users
Equal variance Different variance P (one tail) P (one tail)
H1: Exposure -> Information Search 0.480* 0.741* 0.0003 0.0004
H2: Exposure -> Self-Efficacy 0.100 0.159 0.330 0.331
H3: Information Searching -> Self-Efficacy 0.269* 0.302* 0.423 0.423
H4: Exposure -> Perceived Knowledge 0.244* 0.202* 0.380 0.380 H5: Information Searching -> Perceived Knowledge
0.562* 0.608* 0.356 0.357
H6: Self-Efficacy -> Attitude 0.518* 0.413* 0.208 0.209
H7: Perceived Knowledge -> Attitude 0.211* 0.230* 0.441 0.442
H8: Self-Efficacy -> Behavioral Intention 0.126 -0.065 0.030 0.030
H9: Attitude -> Behavioral Intention 0.176* 0.314* 0.087 0.088
H10: Perceived Knowledge -> Behavioral Intention 0.105 0.098 0.470 0.470 Control: Disposition to Trust -> Behavioral Intention
0.038 0.048 0.448 0.448
Control: Institution Based Trust -> Behavioral Intention
0.253* 0.147 0.240 0.241
Control: Usefulness -> Behavioral Intention 0.377* 0.402* 0.422 0.422
Note: Bolded indicates statistically differences between groups; italic indicates differences because one is significant and the other is not; *are significant path coefficients. Discussion
Key Findings
Overall, nine of ten hypotheses are fully or partially supported. Results of hypotheses
testing and multi group analysis are summarized in Tables 17, 18, 19, and 20. In these tables,
differential impact across groups means one of two conditions: first, one coefficient is significant
while the other is not, no matter whether the difference is statistically significant; and second, the
difference across the two groups is statistically different. Meanwhile, same impact across groups
means that both coefficients are significant or insignificant and there is no statistically difference
across the two groups. In addition, the significant column for “differential impact across groups”

118
refers to the difference across the two groups is significant and the not significant column refers
to the difference is insignificant. The significant column for “same impact across groups” refers
to both path coefficients are significant while the not significant column refers to both are
insignificant. Stronger influence for the user group means the absolute path coefficient of the
user group is larger than that of the non-user group while stronger influence for the non-user
group means the absolute path coefficient of the non-user group is larger than that of the user
group.
Table 15. Result of Parametric Multi-Group Analysis with PLS for Users of China and the U.S.
Path b:users from
China b:users from
the U.S. Equal variance Different variance
P (one tail) P (one tail)
H1: Exposure -> Information Search 0.319* 0.480* 0.062 0.062
H2: Exposure -> Self-Efficacy 0.357* 0.100 0.014 0.014
H3: Information Searching -> Self-Efficacy 0.146 0.269* 0.189 0.190
H4: Exposure -> Perceived Knowledge 0.144 0.244* 0.201 0.202 H5: Information Searching -> Perceived Knowledge
0.500* 0.562* 0.278 0.278
H6: Self-Efficacy -> Attitude 0.347* 0.518* 0.109 0.110
H7: Perceived Knowledge -> Attitude 0.258* 0.211* 0.360 0.361
H8: Self-Efficacy -> Behavioral Intention 0.358* 0.126 0.077 0.078
H9: Attitude -> Behavioral Intention 0.287* 0.176* 0.223 0.225 H10: Perceived Knowledge -> Behavioral Intention
0.001 0.105 0.086 0.087
Control: Disposition to Trust -> Behavioral Intention
0.018 0.038 0.387 0.388
Control: Institution Based Trust -> Behavioral Intention
0.216* 0.253* 0.405 0.406
Control: Usefulness -> Behavioral Intention
-0.076 0.377* 0.0003 0.0004
Note: Bolded indicates statistically differences between groups; italic indicates differences because one is significant and the other is not; *are significant path coefficients.

119
Table 16. Result of Parametric Multi-Group Analysis with PLS for Non-Users of China and the U.S.
Path b:non-users from China
b:non-users from the
U.S.
Equal variance Different variance P (one tail) P (one tail)
H1: Exposure -> Information Search 0.484* 0.741* 0.003 0.003
H2: Exposure -> Self-Efficacy 0.116 0.159 0.383 0.384
H3: Information Searching -> Self-Efficacy 0.552* 0.302* 0.050 0.051
H4: Exposure -> Perceived Knowledge 0.185* 0.202* 0.449 0.449 H5: Information Searching -> Perceived Knowledge
0.473* 0.608* 0.165 0.166
H6: Self-Efficacy -> Attitude 0.453* 0.413* 0.400 0.401
H7: Perceived Knowledge -> Attitude 0.173* 0.230* 0.334 0.335
H8: Self-Efficacy -> Behavioral Intention -0.061 -0.065 0.480 0.480
H9: Attitude -> Behavioral Intention 0.250* 0.314* 0.287 0.288 H10: Perceived Knowledge -> Behavioral Intention
-0.085 0.099 0.034 0.035
Control: Disposition to Trust -> Behavioral Intention
0.306* 0.048 0.007 0.007
Control: Institution Based Trust -> Behavioral Intention
0.218* 0.147 0.292 0.292
Control: Usefulness -> Behavioral Intention 0.394* 0.402* 0.474 0.474
Note: Bolded indicates statistically differences between groups; italic indicates differences because one is significant and the other is not; *are significant path coefficients. Table 17. Summary of Testing Results for the Two Groups from China
Type of Hypothesis Significant Not Significant
Differential Impact Across Groups
Stronger Influence for the User Group
H2: EXP -> SEL H8: SEL -> BI
N/A
Stronger Influence for the Non-User Group H3: INS -> SEL Control: PU -> BI Control: DISP -> BI
H4: EXP -> PK
Same Impact Across Groups
H1: EXP -> INS H5: INS -> PK H6: SEL -> ATT H7: PK -> ATT H9: ATT -> BI Control: IBT -> BI
H10: PK -> BI
Note: EXP=exposure, ATT=attitude, BI=behavioral intention, DISP=disposition to trust, INS=information searching, IBT=institution-based trust, PK=perceived knowledge, SEL=self-efficacy, and PU=perceived usefulness. Influence of exposure to mobile payments.
The results show that exposure to mobile payments will encourage consumers to search
for information about mobile payments. Thus, consumers with a higher level of exposure to
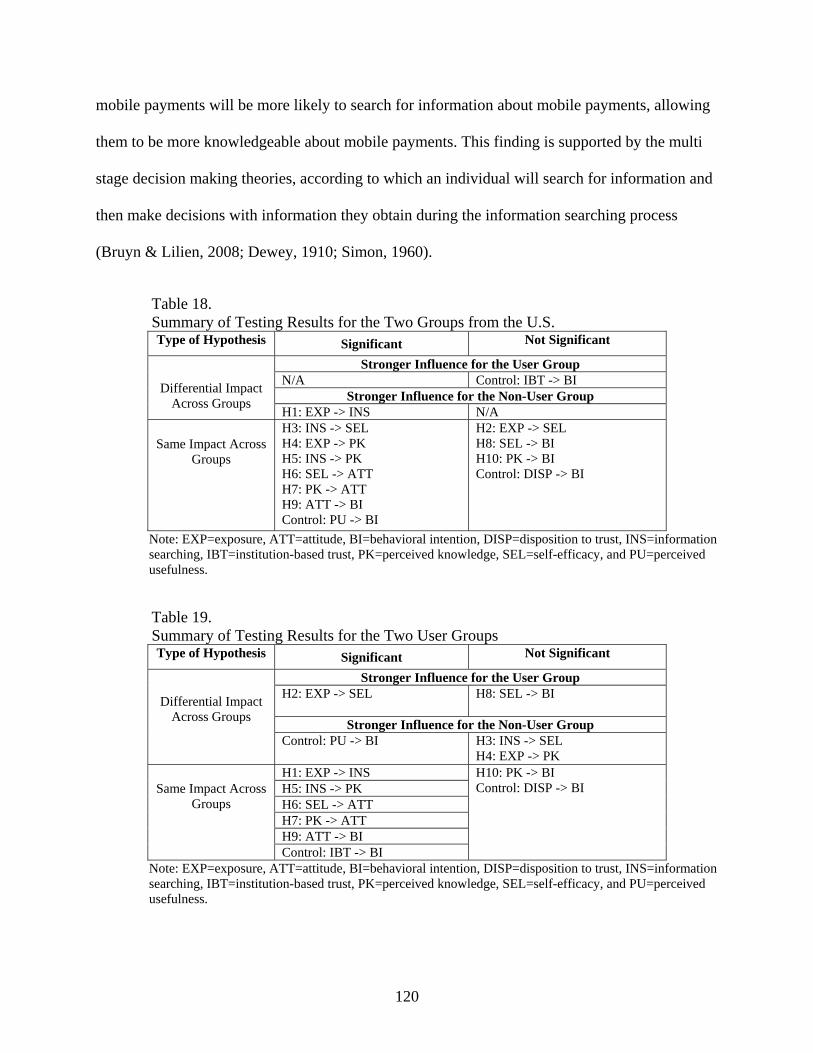
120
mobile payments will be more likely to search for information about mobile payments, allowing
them to be more knowledgeable about mobile payments. This finding is supported by the multi
stage decision making theories, according to which an individual will search for information and
then make decisions with information they obtain during the information searching process
(Bruyn & Lilien, 2008; Dewey, 1910; Simon, 1960).
Table 18. Summary of Testing Results for the Two Groups from the U.S.
Type of Hypothesis Significant Not Significant
Differential Impact Across Groups
Stronger Influence for the User Group N/A Control: IBT -> BI
Stronger Influence for the Non-User Group H1: EXP -> INS N/A
Same Impact Across Groups
H3: INS -> SEL H4: EXP -> PK H5: INS -> PK H6: SEL -> ATT H7: PK -> ATT H9: ATT -> BI Control: PU -> BI
H2: EXP -> SEL H8: SEL -> BI H10: PK -> BI Control: DISP -> BI
Note: EXP=exposure, ATT=attitude, BI=behavioral intention, DISP=disposition to trust, INS=information searching, IBT=institution-based trust, PK=perceived knowledge, SEL=self-efficacy, and PU=perceived usefulness. Table 19. Summary of Testing Results for the Two User Groups
Type of Hypothesis Significant Not Significant
Differential Impact Across Groups
Stronger Influence for the User Group H2: EXP -> SEL
H8: SEL -> BI
Stronger Influence for the Non-User Group Control: PU -> BI H3: INS -> SEL
H4: EXP -> PK
Same Impact Across Groups
H1: EXP -> INS H10: PK -> BI Control: DISP -> BI H5: INS -> PK
H6: SEL -> ATT H7: PK -> ATT H9: ATT -> BI Control: IBT -> BI
Note: EXP=exposure, ATT=attitude, BI=behavioral intention, DISP=disposition to trust, INS=information searching, IBT=institution-based trust, PK=perceived knowledge, SEL=self-efficacy, and PU=perceived usefulness.

121
There are some differences between users and non-users. Path comparisons indicate that
the path between exposure to mobile payments and self-efficacy is positively significant for
Chinese users, but not for Chinese non-users. According to the results of Sobel test, information
searching fully mediates the relationship between Chinese non-users’ exposure and self-efficacy
(Sobel statistic=4.352, p<0.001). Information searching fully mediates the relationship between
American non-users’ exposure and self-efficacy (Sobel statistic=5.596, p<0.001). This suggests
that exposure to mobile payments does not directly affect non-users’ self-efficacy but has an
indirectly relationship with self-efficacy through information searching.
Table 20. Summary of Testing Results for the Two Non-User Groups
Type of Hypothesis Significant Not Significant
Differential Impact Across Groups
Stronger Influence for the User Group Control: DISP -> BI Control: IBT -> BI
Stronger Influence for the Non-User Group H1: EXP -> INS N/A
Same Impact Across Groups
H3: INS -> SEL H4: EXP -> PK H5: INS -> PK H6: SEL -> ATT H7: PK -> ATT H9: ATT -> BI Control: PU -> BI
H2: EXP -> SEL H8: SEL -> BI H10: PK -> BI
Note: EXP=exposure, ATT=attitude, BI=behavioral intention, DISP=disposition to trust, INS=information searching, IBT=institution-based trust, PK=perceived knowledge, SEL=self-efficacy, and PU=perceived usefulness. Results show that the path between exposure to mobile payments and perceived
knowledge is positively significant for Chinese non-users, but not for Chinese users. This is
because users have past experience of using mobile payments, and generally speaking, they
know more about mobile payments than non-users (Venkatesh, 2012), reducing their dependence
on external information sources to make final decisions. However, non-users lack knowledge of
mobile payments, increasing their dependence on external information sources. We also
performed a Sobel test for Chinese users. According to the results, information searching fully

122
mediates the relationship between exposure and perceived knowledge (Sobel statistics=3.268,
p<0.001). This suggests that Chinese users’ exposure to mobile payments has an indirect effect
on their perceived knowledge through information searching.
Meanwhile, American non-users’ exposure to mobile payments has a stronger influence
than American users’ exposure to mobile payments on their information searching. This is
reasonable because individuals with little knowledge of mobile payments will do more
information searching than those with high prior knowledge (Bettman & Park, 1980). American
non-users are less knowledgeable of mobile payments compared with users. Thus, American
non-users respond more to exposure to mobile payments.
When we statistically compared our results across Chinese and American consumers, the
differences became apparent. Results suggest that the path between exposure to mobile payments
and self-efficacy is positively significant for Chinese users, but not for American users. This can
be explained by one dimension of nation cultures: individualism or collectivism. Individualists
rely more on privately referenced information such as their own experience and self-oriented
information searching while collectivists rely more on in-group opinions such as positive word
of mouth and social influence (Erez & Earley, 1993). Components of exposure, excluding media
usage, reflect in-group opinions, and thus are more likely to affect self-efficacy of collectivists.
Results show that the path between exposure to mobile payments and perceived
knowledge is positively significant for American users, but not for Chinese users. In addition,
American non-users’ exposure to mobile payments has a stronger influence than Chinese non-
users’ exposure to mobile payments on their information searching. Exposure in high-context
cultures such as China is implicit and indirect while exposure in low-context cultures such as the
U.S. is more direct, less implicit, and more informative (Singh, Zhao, & Hu, 2005). Exposure to

123
mobile payments in the U.S. should be more information richness than that of China. In addition,
explicit knowledge is more sharable than implicit knowledge. American users are more likely to
accumulate knowledge based on their exposure to mobile payments. Thus, American consumers
respond more to exposure to mobile payments, and the U.S. exposure has a stronger influence
than that of China on consequences of exposure to mobile payments.
Influence of information searching.
Consumer knowledge is an important construct in explaining their consumption behavior
(Bruyn & Lilien, 2008; Dewey, 1910; Simon, 1960). There are three categories of knowledge:
perceived knowledge, objective knowledge, and usage knowledge (Brucks, 1985), of which
perceived knowledge has been considered a stronger predictor for behaviors than other types of
knowledge (Lee & Koo, 2012). The results indicate that information searching has a positive
relationship with consumers’ perceived knowledge. Information searching represents active
consumer learning, and learning and knowledge are closely related in knowledge management
literature (Janz & Prasarnphanich, 2003). With information that they obtain during information
searching, consumers become familiar with mobile payments and think that they know more
about mobile payments even without gaining objective knowledge (Park, 2001).
Results show that the path between information searching and self-efficacy is positively
significant for Chinese non-users, but not for Chinese users. Prior experience is one source of
self-efficacy, and users rely on their past experience to build self-efficacy (Bandura, 1977b,
1988). Information searching may no longer affect them (or, are ignored) and thus cannot affect
their self-efficacy. However, non-users lack past experience of using mobile payments and use
information searching as a source of information, helping them build self-efficacy.

124
Results also suggest that the path between information searching and self-efficacy is
positively significant for American users, but not for Chinese users. Vicarious experience is one
source of self-efficacy (Bandura, 1977b, 1986). During consumers’ information searching, they
should be able to learn other consumers’ experience of using mobile payments. China is
vulnerable to cyber-attack, and thus Chinese consumers’ are more likely to get exposed to other
people’s failure experiences during their information searching. Success strengthens self-
efficacy, and failure decreases self-efficacy (Bandura, 1977b, 1986). Thus, it is reasonable that
information searching has a positive relationship with American users’ self-efficacy but does not
affect Chinese users’ self-efficacy.
Antecedents of attitude.
This research distinguishes two antecedents of consumers’ attitude toward mobile
payments: self-efficacy and perceived knowledge. The results show that consumers are more
likely to have a positive attitude if they have a higher level of self-efficacy and perceived
knowledge. This is reasonable since people love what is familiar and feel discomfort when they
are faced with unfamiliar objects (Venkatesan, 1973). These findings are consistent with
tripartite model of attitude. Lavidge and Steiner (1961) and Dick and Basu (1994) posited that
consumers’ cognition belief will has a positive relationship with their affection, which, in turn,
affect consumers’ final attitude toward an object. Self-efficacy and perceived knowledge reflect
consumers’ belief of their ability to use mobile payments and will positively affect their attitude
toward using mobile payments.
Antecedents of behavioral intention.
This research explores the importance of attitude in encouraging consumers to use or
continue use mobile payments. According to the results, consumers who have a positive attitude

125
toward mobile payments are more likely to use or continue use mobile payments than those who
have a negative attitude toward mobile payments, no matter in China or the U.S. The relationship
between attitude and behavioral intention is well supported by theory of planned behavior
(Ajzen, 1991), which views attitude as an important predictor of consumers’ behavioral
intention.
Results indicate that the relationship between self-efficacy and behavioral intention is
positively significant for Chinese users, but not for Chinese non-users. In addition, American
consumers’ self-efficacy does not affect their behavioral intention toward mobile payments. We
performed Sobel tests and found that Chinese non-users’ and American consumers’ attitude fully
mediates the relationship between their self-efficacy and behavioral intention (Chinese non-
users: Sobel statistic=2.12, p<0.05; American users: Sobel statistic=2.18, p<0.05; American non-
users: Sobel statistic=3.24, p<0.01). Thus, self-efficacy does not directly affect Chinese non-
users’ and American consumers’ behavioral intention but has an indirect relationship with their
behavioral intention through attitude.
The path between self-efficacy and behavioral intention is positively significant for
Chinese users, but not for American users. This finding suggests that Chinese users pay greater
attention to self-efficacy. This finding is consistent with findings of past literature. Chinese
culture is collective and long term orientated while the U.S. culture is individualistic and short-
term oriented (Hofstede, 1980). Klassen (2004) posited that “among collectivists, efficacy beliefs
are typically lower but equally or even more predictive of performance” (p. 225). Meanwhile,
Chan and Lau (2002) and Tan, Yan, and Urquhart (2007) verified that self-efficacy will exert a
stronger influence on Chinese users’ behavioral intention than on American users’ behavioral
intention.

126
The finding that perceived knowledge does not affect consumers’ behavioral intention
toward mobile payments is unexpected. One possible reason is that perceived knowledge affects
consumers’ behavioral intention through perceived ease of use (Kim, Mirusmonov, & Lee,
2010). However, mobile payments service are designed to be easy to use. Thus, perceived ease
of use no longer is a significant predictor of mobile payments acceptance. In addition, early
adopters of mobile payments rely on perceived knowledge whereas late adopters do not (Kim et
al., 2010). Perceived knowledge is important in the initial stage of diffusion of innovation, but
now, consumers are knowledgeable about mobile payments, and perceived knowledge no longer
affects consumers’ behavioral intention.
Limitation
As with all research, there are some limitations that should be considered when
interpreting the results of this research. First, the data was collected by using a self-report survey.
Hence there is potential for common method biases (Podsakoff et al., 2003). However, common
method bias is not a significant problem in this research. Second, in some groups, the model
explained a small part of variance of information searching and self-efficacy. However, all R-
squares exceed the acceptable threshold of 10 percent as suggested by Falk and Miller (1992),
indicating substantive explanatory power of the model. Future research is needed to explore
antecedents of information searching and self-efficacy. Third, the limited source and special
characteristics of the sample restrict the generalization of the findings in this research. However,
most of our samples are in their 20s or 30s, who are more willing to adopt mobile payment than
other age groups (Scevak, 2010). They worth our attention because our target is to encourage
adoption of mobile payments.
Implications for Theory

127
We view adoption of innovation as an on-going process involving persuasive
communication and learning (Lee & Xia, 2011) and construct consumer learning as a
combination of positive word of mouth, explicit social influence, implicit social influence, and
media usage. Then, we explore the effect of consumer learning on adoption and post adoption of
mobile payments. We use perceived knowledge and self-efficacy, attitude, and behavioral
intention to represent cognitive outcomes, affective outcome, and behavioral outcome,
respectively, by following the tripartite model of attitude. Then, we discuss the effect of
consumer learning on consumers’ behavior intention toward mobile payments.
Our research contributes to adoption and post-adoption research. This research explores
the similarity and difference across adoption and post adoption. Past research has suggested that
predictors of technology adoption and continuous usage are different (Limayem et al., 2007;
Setterstrom et al., 2013). However, there are some continuous variables that can be used to
predict both technology adoption and continuous usage. Learning outcomes can serve as these
predictors because learning is continuous, and learning outcomes such as affective states,
attitudes, and belief can evolve as environmental factors change (Bandura, 1977b, 1988) or as
individuals obtain new information (Anderson, 1991). This research finds that exposure to
mobile payments and information searching will have a positive relationship with self-efficacy
and perceived knowledge, which affect consumers’ attitude toward mobile payments. Then,
attitude can be used to predict both adoption and post adoption behavior. Meanwhile, past
research focuses on changes in significance of path coefficient while ignoring the differences in
the strength of relationships (Setterstrom et al., 2013). Our research also focuses on differences
in the strength of relationships and finds some differences across the user and the non-user
groups as shown in Tables 13, 14, 15, and 16.

128
This research also contributes to cross cultural research on mobile payments acceptance.
Few prior studies examine cross culture research on mobile payments acceptance. We choose
China and the U.S. to represent the eastern and western cultures, respectively, and explore the
similarities and differences across Chinese and American consumers. The results reveal that
consumers’ exposure to mobile payments will attract their attention and encourage them to
search for information of mobile payments. Exposure to mobile payments and information
searching will affect consumers’ self-efficacy and perceived knowledge in different approaches.
Self-efficacy and perceived knowledge will then affect consumers’ attitude toward mobile
payments, which has a positive relationship with their behavioral intention. We also found
several differences across the Chinese and American consumers as shown in Tables 15 and 16.
This research serves as foundation of cross-culture research on mobile payments acceptance.
Our findings also contribute to research on the theory of planned behavior. Benbasat and
Barki (2007) requested that we lack of exploration of learning behavior in TPB research. In this
study, we use exposure to mobile payments and information searching to represent consumer
learning, and view consumer learning as the source of three types of beliefs in theory of planned
behavior. In addition, attitude is viewed as an important predictor of behavioral intention in
theory of planned behavior (Ajzen, 1991). McKinsey indicates that about 45% of U.S.
consumers have a positive attitude toward using mobile payments, but this number has fallen
since 2011 (McKinsey, 2013). We explore the interactions among attitude, social influence, and
self-efficacy, three predictors of behavioral intention in the theory of planned behavior, as
requested by Wu (2006). Results indicate that self-efficacy and perceived knowledge can serve
as predictors of consumers’ attitude toward using mobile payments. Moreover, we found that the
effect of consumers’ attitude on their behavioral intention is stable while the effect of self-

129
efficacy is not. Perceived knowledge does not have a direct relationship with behavioral
intention, but has an indirect relationship with behavioral intention through attitude.
Implications for Practice
This research deepens our understanding of similarities and differences between users
and non-users of mobile payments. This research provides mobile payments practitioners with
some suggestions on how to attract non-users to adopt mobile payments and retain current users
of mobile payments. First, exposure to mobile payments plays an important role in affecting
consumers’ adoption and use of mobile payments. This research suggests four ways of increasing
users’ exposure to mobile payments, which are positive word of mouth, media usage, explicit
social influence, and implicit social influence. For example, practitioners can provide monetary
bonus to encourage satisfied users to generate more positive word of mouth and social influence.
Second, practitioners should utilize consumers’ curiosity to encourage their information
searching because information searching will increase consumers’ perceived knowledge and
thereafter encourage consumers to form a positive attitude toward mobile payments. For
example, practitioners can initiate exploration in mobile games and encourage consumers to
search for information about mobile payments by providing decent monetary or non-monetary
bonus. Third, consumers should think of how to improve consumers’ self-efficacy because it is
positive related to consumers’ attitude toward mobile payments. Bandura (1977) summarized
four sources of self-efficacy: performance accomplishments (e.g., direct experience), vicarious
experience (e.g., implicit social influence), verbal persuasion (e.g., positive word of mouth,
explicit social influence, and media usage), and physiological states (e.g., relaxation). Fourth,
marketers should efficiently utilize marketing communication to bolster consumers’ perceived

130
knowledge through well-developed marketing messages. Influencing consumers’ perceived
knowledge will lead to positive attitude toward using mobile payments.
Meanwhile, practitioners should aware of the differences between users and non-users in
relevant countries and develop different marketing tactics. In the China mobile payment market,
practitioners should emphasize mechanisms of building self-efficacy to retain current users
because their self-efficacy affects consumers’ behavioral intention directly and indirectly through
attitude toward mobile payments. Practitioners should realize the importance of exposure to
mobile payments in building current users’ self-efficacy. Meanwhile, they should encourage
non-users to search for information about mobile payments because information searching has a
positive relationship with their self-efficacy and thereafter encourages consumers to form a
positive attitude toward mobile payments. Practitioners should consider how to attract non-users’
to search for information about mobile payments. However, this is challenging because non-
users are less interested in mobile payments messages than users. In addition, practitioners
should convey message about usefulness of mobile payments to non-users to attract non-users.
In the U.S. mobile payment market, in order to attract non-users, practitioners should
increase consumers’ exposure to mobile payments, which will encourage consumers to search
for information about mobile payments. In the U.S., users worry about the security of mobile
payments, and institution-based trust plays an important role in affecting their intention to
continue using mobile payments. Thus, practitioners and governments should consider how to
convince current users of the security of mobile payments. There are mainly two ways to build
confidence regarding security: regulation and infrastructure. Governments should facilitate a
legal structure such as enacting well-developed laws relating to mobile payments that can
efficiently settle disputes and strongly protect consumers’ property rights and financial assets.

131
Meanwhile, an industrial standard is needed to operate the industry efficiently. Additionally,
governments should encourage investment in telecommunication sectors and build a secure and
efficient telecommunication system to increase the coverage of mobile internet and penetration
rate of smartphones. At the same time, governments should support the development of mobile
technology to increase the safety of mobile payments technology.
Conclusion
This research serves as an exploration of the relationship between consumer learning and
consumers’ behavioral intention toward mobile payments. We developed a model suggesting that
exposure to mobile payments and information searching affect consumers’ self-efficacy and
perceived knowledge. These two factors have a positive relationship with consumers’ attitude
toward using mobile payments, which positively affects their behavioral intention toward mobile
payments. This research verifies the vital role of consumer learning in encouraging consumers’
to adopt and use mobile payments. We also explore the differences across the user and the non-
user groups and across Chinese and American consumers. When we compared our results across
groups, the similarities and differences in the cognitive processes involved for adoption and post
adoption became apparent. This research deepens our understanding of how consumer learning
can affect consumers’ attitude toward mobile payments and thereafter encourage them to accept
mobile payments.
Reference
AI-Debei, M. M., AI-Lozi, E., & Papazafeiropoulou, A. (2013). Why people keep coming back
to facebook: Explaining and predicting continuance participation from an extended
theory of planned behavior perspective. Decision Support Systems, 55(1), 43-54.
Ajzen, I. (1991). The theory of planned behavior. Organization Behavior & Human Decision
Processes, 50, 179-211.

132
Ajzen, I. (2002). Perceived behavioral control, self-efficacy, locus of control, and the theory
of planned behavior, Journal of Applied Social Psychology, 32 (4), 665–683.
Ajzen, I., & Fishbein, M. (1980). Understanding attitudes and predicting social behavior.
Englewood Cliffs, NJ: Prentice-Hall.
Ajzen, I. & Sexton, J. (1999). Depth of processing, belief congruence, and attitude–behavior
correspondence. In Dual-process theories in social psychology, S. Chaiken and Y. Trope,
eds. New York: The Guilford Press, 117-138.
Alexandrov, A., Lilly, B., & Babakus, E. (2013). The effects of social- and self-motives on the
intentions to share positive and negative word of mouth. Journal of the Academic
Marketing Science, 41(5), 531-546.
Anderson, J. C., & Gerbing, D. W. (1988). Structural equation modeling in practice: A review
and recommended two-step ppproach. Psychological Bulletin, 103(3), 411-423.
Anderson, N. H. (1991). A cognitive theory of judgment and decision. In N.H. Anderson (ed.),
Contributions to information integration theory (Vol. 1: Cognition, pp. 105–144).
Hillsdale, NJ: Lawrence Erlbaum.
Andreev, P., Duane, A., & O’Reilly, P. (2011). Conceptualizing consumer perceptions of
contactless m-payments through smart phones. International Federation for Information
Processing: IFIP WG8.2.
Arndt, S., Feltes, J., & Hanak, J. (1983). Secretarial attitudes towards word processors as a
function of familiarity and locus of control. Behaviour & Information Technology, 2(1),
17-22.
Arnould, E. J., Price, L., & Zinkhan, G. (2001). Consumers. New York: McGraw-Hill.
Au, Y. A., & Kauffman, R. J. (2008). The economics of mobile payments: Understanding
stakeholder issues for an emerging financial technology application. Electronic
Commerce Research and Application, 7, 141-164.
Bagozzi, R. P. (2007). The legacy of the technology acceptance model and a proposal for a
paradigm shift. Journal of the Association for Information Systems, 8(4), 243–254.
Bandura, A. (1977a). Self-efficacy: Toward a unifying theory of behavioral change.
Psychological Review, 84(2), 191-215.
Bandura, A. (1977b). Social learning theory. Englewood Cliffs, NJ: Prentice-Hall.
Bandura, A. (1986). Social foundations of thought and action: A social cognitive theory.

133
Englewood Cliffs, NJ: Prentice-Hall.
Bandura, A. (1988). Organizational applications of social cognitive theory. Australian Journal
of Management, 13(2), 275.
Bandura, A. (1993). Perceived self-efficacy in cognitive development and functioning.
Educational Psychologist, 28(2), 117-148.
Barki, H., Titah, R., & Boffo, C. (2007). Information system use-related activity: An
expanded behavioral conceptualization of individual-level information system use.
Information Systems Research, 18(2), 173-192.
Barry, T. E. (2002). In defense of the hierarchy of effects: A rejoinder to weilbacher. Journal
of Advertising Research, 42(3), 44-47.
Bauer, T. N., Bodner, T., Erdogan, B., & Truxillo, D. M. (2007). Newcomer adjustment during
organizational socialization: A meta-analytic review of antecedents, outcomes, and
methods. Journal of Applied Psychology, 92, 707-721.
Beckers, J. J., Wicherts, J. M., & Schmidt, H. G. (2007). Computer anxiety: “Trait” or “state”?
Computer in Human Behavior, 23, 2851-2862.
Benbasat, I., & Barki, H. (2007). Quo vadis, TAM? Journal of the Association for Information
Systems, 8(4), 211-218.
Berger, I. E., Ratchford, B. T., & Haines Jr., G. H. (1994). Subjective produce knowledge as a
moderator of the relationship between attitudes and purchase intentions for a durable
product. Journal of Economic Psychology, 15, 301-314.
Bettman, J., & Park, C. (1980). Effects of prior knowledge and experience and phase of the
choice process on consumer decision processes: A protocol analysis. Journal of
Consumer Research, 7, 234–248.
Bhattacherjee, A., & Hikmet, N. (2007). Physicians’ resistance toward healthcare information
technology: A theoretical model and empirical test. European Journal of Information
Systems, 16, 725-737.
Brashers, D. E. (2001). Communication and uncertainty management. Journal of
Communication, 51(3), 477-197.
Breckler, S. J. (1984). Empirical validation of affect, behavior, and cognition as distinct
component to attitude. Journal of Personality and Social Psychology, 47(6), 1191-1205.
Broussard, G. (2000). How advertising frequency can work to build online advertising

134
effectiveness. International Journal of Market Research, 42 (4), 439-457.
Browne, G. J., Pitts, M. G., & Wetherbe, J. C. (2007). Cognitive stopping rules for terminating
information search in online tasks. MIS Quarterly, 31(1), 89-104.
Brucks, M. (1985). The effects of product class knowledge on information search behavior.
Journal of Consumer Research, 12(1), 1–16.
Bruyn, A. D., & Lilien, G. L. (2008). A multi-stage model of word-of-mouth influence
through viral marketing. International Journal of Research in Marketing, 25, 151-163.
Business Wire. (2013a). Worldwide surge in smartphone and tablet sales revolutionizes online
content consumption, finds Bain & Company 2013 digital media report. Retrieved
November 18, 2013, from
http://search.proquest.com/abicomplete/docview/1450250576/fulltext/141CFC1DA70648
687F5/2?accountid=8421.
Business Wire. (2013b). Research and markets: Mobile internet report for 2015 the
worldwide penetration rate of mobile Internet will reach 37% - Or 2.67 billion users.
Retrieved November 18, 2013, from
http://search.proquest.com/abicomplete/docview/857997619/fulltext/141CFDE9B4AFF9
9302/44?accountid=8421.
Business Wire. (2012). Global mobile payment market revenues to rise to $998.5 billion in
2016, a CAGR of 83.7%. Retrieved November 18, 2013 from
http://search.proquest.com/docview/920559352?accountid=8421.
Carillo, K. (2012). Understanding IS theory: An interpretation of key IS theoretical
framework using social cognitive theory. In Y.K. Dwivedi et al. (eds.), Information
systems theory: Explaining and predicting our digital society (Vol. 29, pp. 241-280).
New York: Springer.
Chan, R. Y. K., & Lau, L. B. Y. (2002). Explaining green purchasing behavior. Journal of
International Consumer Marketing, 14(2), 9-40.
Chandra, S., Srivastava, S. C., & Theng, Y. (2010). Evaluating the role of trust in consumer
adoption of mobile payment systems: An empirical analysis. Communications of the
Association for Information Systems, 27, 561-588.
Chau, P. Y. K. (2001). Inhibitors to EDI adoption in small businesses: An empirical
investigation. Journal of Electronic Commerce Research, 2(2), 78-88.

135
Chin, W. W. (1998). Issues and opinion on structural equation modeling. MIS Quarterly, 22(1),
7-16.
Chin, W. W. (2000). Multi-group analysis with PLS. Retrieved from http://disc-nt.cba.uh.edu/
chin/plsfaq/multigroup.htm.
Cho, J., & Lee, J. (2006). An integrated model of risk and risk-reducing strategies. Journal of
Business Research, 59, 112-120.
Close-Up Media (2013). Research and markets offers report: Global mobile internet industry
2013-2018: Trends, profits and forecast analysis. Retrieved November 18, 2013, from
http://search.proquest.com/abicomplete/docview/1432347326/fulltext/141CFDA7D284F
D1DAC9/1?accountid=8421.
Compeau, D. R., & Higgins, C. A. (1995). Computer self-efficacy: Development of a measure
and initial test. MIS Quarterly, 19(2), 189-211.
Conrath, D. W. (1967). Organizational decision making behavior under varying conditions of
uncertainty. Management Science, 13, 487-500.
Cronbach, L. J. (1971). Test validation. In Education measurement, R. L. Thorndike (ed.),
Washington, D.C.: American Council on Education, 443-507.
Cruz, P., & Laukkanen, T. (2010). Mobile banking rollout in emerging markets: Evidence from
Brazil. International Journal of Bank Marketing, 28(5), 342-371.
Dahlberg, T., Mallat, N., Ondrus, J., & Zmijewska, A. (2008). Past, present and future of
mobile payments research: A literature review. Electronic Commerce Research and
Applications, 7(2), 165-181.
Dash, S., & Saji, K. B. (2008). The role of consumer self-efficacy and website social-
presence in customers’ adoption of B2C online shopping. Journal of International
Consumer Marketing, 20(2), 33-48.
David, P., Song, M., Hayes, A., & Fredin, E. S. (2007). A cyclic model of information seeking.
In hyperlinked environments: The role of goals, self-efficacy, and intrinsic motivation.
International Journal of Human-Computer Studies, 170-182.
Deng, L., Turner, D. E., Gehling, R., & Prince, B. (2010).User experience, satisfaction, and
continual usage intention of IT. European Journal of Information Systems, 19, 60-75.
Deng, Z., Lu, Y., Wei, K. K., & Zhang, J. (2010). Understanding customer satisfaction and
loyalty: An empirical study of mobile instant messages in China. International Journal

136
of Information Management, 30(4), 289-300.
Derbaix, C., & Vanhamme, J. (2003). Inducing word-of-mouth by eliciting surprise: A pilot
investigation. Journal of Economic Psychology, 24(1), 99-116.
Dewey, J. (1910). How we think. Boston: D.C. Heath.
Dick, A. S., & Basu, K. (1994). Customer loyalty: Toward an integrated conceptual framework.
Journal of the Academy of Marketing Science, 22, 99–113.
Dinev, T., & Hu, Q. (2007). The centrality of awareness in the formation of user behavioral
intention toward protective information technologies. Journal of the Association for
Information Systems, 8(7), 386-408.
Doh, S., & Hwang, J. (2009). Rapid communication: How consumers evaluate eWOM
messages. Cyber Psychology & Behavior, 12(2), 193-197.
Duane, A., O’Reilly, P., & Andreev, P. (2014). Realizing m-payments: Modelling consumers’
willingness to m-pay using smart phones. Behavior & Information Technology, 33(4),
318-334.
Erez, M., & Earley, P. C. (1993). Culture, self-identity, and work. New York: Oxford
University Press.
Falk, R. F., & Miller, N. B. 1992. A primer for soft modeling. Akron, OH: Ohio University of
Akron Press.
Fornell, C., & Larcker, D. F. (1981). Evaluating structural equation models with unobservable
variables and measurement error. Journal of Marketing Research, 18(1), 39-50.
Fuller, R. M., Chelley, V., & Brown, S. A. (2006). E-learning and individual characteristics:
The role of computer anxiety and communication apprehension. Journal of Computer
Information Systems, 46(4), 103-115.
Gangadharbatla, H. (2007). Facebook me: Collective self-esteem, need to belong, and Internet
self-efficacy as predictors of the iGeneartion’s attitudes toward social networking sites.
Journal of Interactive Advertising, 8(2), 1-28.
Gartner Group. (2009). Mobile payment, 2007-2012. Gartner Group, Stamford, CT.
Gefen, D., & Straub, D. (2000). The relative importance of perceived ease-of-use in IS
adoption: A study of e-commerce adoption. Journal of Association for Information
Systems, 8(1), 1-30.
Gerpott, T., & Kornmeier, K. (2009). Determinants of customer acceptance of mobile

137
payment systems. International Journal of Electronic Finance, 3(1), 1–30.
Gershoff, A. D. (2001). Recommendation or evaluation? Task sensitivity in information source
selection. Journal of Consumer Research, 28(3), 418– 39.
Gordon, P. C., & Holyoak, K. J. (1983). Implicit learning and generalization of the “mere
exposure” effect. Journal of Personality and Social Psychology, 45(3), 492-500.
Gravill, J. I., Compeau, D. R., & Marcolin, B. L. (2006). Experience effects on the accuracy of
self-assessed user competence. Information & Management, 43, 378-394.
Gu, J., Lee, S., & Suh, Y. (2009). Determinants of behavioral intention to mobile banking.
Expert Systems with Applications, 36, 11605–11616.
Gupta, S., & Kim, H. W. (2007). The moderating effect of transaction experience on the
decision calculus in online repurchase. International Journal of Electronic Commerce, 12
(1), 127–158.
Hair, J. F., Anderson, R. E., Tatham, R. L., & Black, W. C. (1998). Multivariate data
analysis (5th ed.), Englewood Cliffs, NJ: Prentice Hall.
Hong, W., Thong, J. Y. L., Chasalow, L. C., & Dhillon, G. (2011). User acceptance of agile
information systems: A model and empirical test. Journal of Management Information
Systems, 28(1), 235-272.
Hsieh, J. J. P., Rai, A., & Keil, M. (2011). Addressing digital inequality for the
socioeconomically disadvantaged through government initiatives: Forms of capital that
affect ICT utilization. Information Systems Research, 22(2), 233-253.
Hsu, M., & Chiu, C. (2004). Self-efficacy and electronic service acceptance. Decision Support
Systems, 38, 369-381.
Huang, T., Liu, C., & Chang, D. (2012). An empirical investigation of factors influencing the
adoption of data mining tools. International Journal of Information Management, 32(3),
257-270.
Janz, B. D., & Prasarnphanich, P. (2003). Understanding the antecedents of effective
knowledge management: The importance of a knowledge-centered culture. Decision
Science, 34(2), 351-384.
Jiang, Z., & Benbasat, I. (2007). The effects of presentation formats and task complexity on
online consumers' product understanding. MIS Quarterly, 31(3), 475-500.
Johnston, A. C., & Warkentin, M. (2010). Fear appeals and information security behavior: An

138
empirical study. MIS Quarterly, 34(3), 549-566.
Kaid, L. L. (2001). Political advertising and information seeking: Comparing exposure via
traditional and Internet channels. Journal of Advertising, 31(1), 27 –36.
Kalinoski, Z. T., Steele-Johnson, D., Peyton, E. J., Leas, K. A., Steinke, J., & Bowling, N. A.
(2012). A meta-analytic evaluation of diversity training outcomes. Journal of
Organizational Behavior, 34(8), 1076-1104.
Kang, S., Lim, K. H., Kim, M. S., & Yang, H. (2012). A multilevel analysis of the effect of
group appropriation on collaborative technologies use and performance. Information
Systems Research, 23(1), 214-230.
Khalifa, M., Cheng, S. K. N., & Shen, K. N. (2012). Adoption on mobile commerce: A
confidence model. Journal of Computer Information Systems, 53(1), 14-22.
Kharif, O. (2011). AT&T-Verizon-T Mobile sets $100 million for Google fight: Tech.
bloomberg business week. Retrieved December 2, 2013 from
http://www.businessweek.com/news/2011-08-29/at-t-verizon-t-mobile-sets-100-million-
for-google-fight-tech.html.
Kim, B., & Han, I. (2009). What drives the adoption of mobile data services? An approach
from a value perspective. Journal of Information Technology, 24, 36-45.
Kim, C., Jahng, J., & Lee, J. (2007). An empirical investigation into the utilization-based
information technology success model: Integrating task-performance and social influence
perspective. Journal of Information Technology, 22,152-162.
Kim, C., Mirusmonov, M., & Lee., I. (2010). An empirical examination of factors influencing
the intention to use mobile payment. Computers in Human Behavior, 26 (3), 310-322.
Kim, Y., & Kim, D. (2005). A study of online transaction self-efficacy, consumer trust, and
uncertainty reduction in electronic commerce transaction. Proceedings of the 38th Hawaii
International Conference on System Sciences. Hawwaii, January 03-06.
Klassen, R. M. (2004). Optimism and realism: A review of self-efficacy from a cross-cultural
perspective. International Journal of Psychology, 39(3), 205-230.
Kotler, P., & Keller, K. L. (2008). Marketing management (13th ed). Englewood Cliffs, NJ:
Prentice Hall.
Kraiger, K. K. (2002). Decision-based evaluation. In K. Kraiger (Ed.). Creating, implementing,

139
and managing effective training and development systems in organizations: State-of-the-
art lessons for practice (pp. 331–375). San Francisco, CA: Jossey-Bass.
Kraiger, K. K., Ford, J. K., & Salas, E. (1993). Application of cognitive, skill-based, and
affective theories of learning outcomes to new methods of training evaluation. Journal of
Applied Psychology, 78(2), 311-328.
Kulkarni, G., Kannan, P. K., & Moe, W. (2012). Using online search data to forecast new
product sales. Decision Support Systems, 52, 604-611.
Kwon, O., Choi, K., & Kim, M. (2007). User acceptance of context-aware services: Self-
efficacy, user innovativeness and perceived sensitivity on contextual pressure. Behavior
& Information Technology, 26(6), 483-498.
Lavidge, R. J., & Steiner, G. A. (1961).A model for predictive measurements of advertising
effectiveness. Journal of Marketing, 25, 59-62.
Lee, G., & Xia, W. (2011). A longitudinal experimental study on the interaction effects of
persuasion quality, user training, and first-hand-use on user perceptions of new
information technology. Information & Management, 48, 288-295.
Lee, K., & Koo, D. (2012). Effects of attribute and valence of e-WOM on message adoption:
Moderating roles of subjective knowledge and regulatory focus. Computers in Human
Behavior, 28, 1974-1984.
Li, H., Daugherty, T., & Biocca, F. (2003). The role of virtual experience in consumer
learning. Journal of Consumer Psychology, 13(4), 395-408.
Liang, H., Saraf, N., Hu, Q., & Xue, Y. (2007). Assimilation of enterprise systems: The effect
of institutional pressures and the mediating role of top management. MIS Quarterly,
31(1), 59-87.
Limayem, M., Hirt, S. G., & Cheung, C. M. K. (2007). How habit limits the predictive power
of intention. MIS Quarterly, 31(4), 705-737.
Lin, C., Shih, H., & Sher, P. J. (2007). Integrating technology readiness into technology
acceptance: The TRAM model. Psychology & Marketing, 24(7), 641-657.
Lin, H., & Hwang, Y. (2014). Do feelings matter? The effects of intrinsic benefits on
individuals’ commitment toward knowledge systems. Computers in Human Behavior, 30,
191-198.
Lin, L., & Chen, C. (2006). The influence of the country-of-origin image, product knowledge

140
and product involvement on consumer purchase decisions: An empirical study of
insurance and catering services in Taiwan. Journal of Consumer Marketing, 23(5), 248–
265.
Little, D. C., & John, S. (2002). Theories of human communication. Morgan Hill, CA:
Wadsworth.
Liu, Y. (2006). Word of mouth for movies: Its dynamics and impact on box office revenue.
Journal of Marketing, 70(3), 74-89.
Loibl, C., Cho, S. H., Diekmann, F., & Batte, M. T. (2009). Consumer self-confidence in
searching for information. Journal of Consumer Affairs, 43(1), 26-55.
Lu, H., & Hsiao, K. (2007). Understanding intention to continuously share information on
weblogs. Internet Research, 17(4), 345-361.
Mallat, N. (2007). Exploring consumer adoption of mobile payments-A qualitative study.
Journal of Strategic Systems, 16(4), 413-432.
Marcolin, B. L., Compeau, D. R., Munro, M. C., & Huff, S. L. (2000). Assessing user
competence: Conceptualization and measurement. Information Systems Research, 11(1),
37-60.
Marchionini, G. (1995). Information seeking in electronic environments. Cambridge, UK:
Cambridge University Press.
Martin, W. C., & Lueg, J. E. (2013). Modeling word-of-mouth usage. Journal of Business
Research, 66(7), 801-808.
Mathieson, K., Peacock, E., & Chin, W. W. (2001). Extending the technology acceptance
model: The influence of perceived user resources. DATA BASE for Advances in
Information Systems, 32(3), 86–112.
Mattila, A. S., & Wirtz, J. (2002). The impact of knowledge types on the consumer search
process: An investigation in the context of credence services. International Journal of
Service Industry Management, 13(3), 214-230.
Mayer, R. E. (2003). The promise of multimedia learning: Using the same instructional design
methods across different media. Learning and Instruction, 13, 125-139.
Mazzarol, T., Sweeney, J. C., & Soutar, G. N. (2007). Conceptualizing word-of-mouth activity,
triggers and conditions: An exploratory study. European Journal of Marketing,
41(11/12), 1475-1494.
141
McKinsey. (2013). The 2013 McKinsey mobile payments consumer survey. Retrieved from
www.mckinsey.com/~/media/mckinsey/dotcom/client_service/financial%20services/lates
t%20thinking/payments/mop17_the_2013_mckinsey_mobile_payments_survey.ashx.
McKnight, D. H., Choudhury, V., & Kacmar, C. (2002). Developing and validating trust
measures for e-commerce: An integrative typology. Information Systems Research, 13(3),
334-359.
McKnight, D. H., Cummings, L. L., & Chervany, N. L. (1998). Initial trust formation in new
organizational relationships. Academy of Management Review, 23 (3), 473-490.
Mihaela-Roxana, I. (2010). Analyzing the effects of product label messages on consumers’
attitudes and intentions. Journal of Business & Economics Research, 11(8), 125-136.
Nevid, J. S. (2009). Psychology: Concepts and applications (3rd). Boston, MA: Houghton
Mifflin.
Ng, K. Y, Dyne, L. V., & Ang, S. (2009). From experience to experiential learning: Cultural
intelligence as a learning capability for global leader development. Academy of
Management Learning & Education, 8(4), 511-526.
Nicola´s, C. L., Molina-Castillo, F. J., & Bouwman, H. (2008). An assessment of advanced
mobile services acceptance: Contributions from TAM and diffusion theory models.
Information & Management, 45, 359–364.
Nielsen. (2013). The mobile consumer: A global snapshot. Retrieved April, 2, 2013 from
http://www.nielsen.com/content/dam/corporate/us/en/reports-
downloads/2013%20Reports/Mobile-Consumer-Report-2013.pdf.
Nysveen, H., Pedersen, P. E., & Thorbjornsen, H. (2005). Intentions to use mobile services:
Antecedents and cross-service comparisons. Journal of the Academy of Marketing
Science, 33(3), 330-346.
O’Cass, A. (2004). Fashion clothing consumption: Antecedents and consequences of fashion
clothing involvement. European Journal of Marketing, 38(7), 869-882.
O’Cass, A., & Pecotich, A. (2005). The dynamic of voter behavior and influence processes in
electoral markets: A consumer behavior perspective. Journal of Business Research, 58,
406-413.
Okazaki, S., Molina, F. J., & Hirose, M. (2012). Mobile advertising avoidance: Exploring the
role of ubiquity. Electronic Markets, 22, 169-183.

142
Oliver, R. L. (1999). Whence consumer loyalty. Journal of Marketing, 63, 33–44.
Oliver, T. A., & Shapiro, F. (1993). Self-efficacy and computers. Journal of Computer-Based
Instruction, 20, 81–85.
Park, C. (2001). News media exposure and self-perceived knowledge: The illusion of
knowing. International Journal of Public Opinion Research, 13(4), 419-425.
Park, W.C., Mothersbaugh, D.L. & Feick, L. (1994). Consumer knowledge assessment.
Journal of Consumer Research, 21, 71-82.
Pavlou, P. A., & Fygenson, M. (2006). Understanding and predicting electronic commerce
adoption: An extension of the theory of planned behavior. MIS Quarterly, 30 (1), 115-
143.
Pavlou, P. A., Liang, H., & Xue, Y. (2007). Understanding and mitigating uncertainty in
online exchange relationships: A principal-agent perspective. MIS Quarterly, 31(1), 105-
136.
Pecujlija, M., & Culibrk, D. (2012). Why we believe the computer when it lies. Computers in
Human Behavior, 28, 143-152.
Pelsmacker, P. D., & Janssens, W. (2007). A model for fair trade buying behavior: The role
of perceived quantity and quality of information and of product-specific attitudes.
Journal of Business Ethics, 75, 361-380.
Petter, S., Straub, D., & Rai, A. (2007). Specifying formative constructs in information systems
research. MIS Quarterly, 31(4), 623-656.
Podsakoff, P., MacKenzie, S., Lee, J., & Podsakoff, N. (2003). Common method biases in
behavioral research: A critical review of the literature and recommended remedies.
Journal of Applied Psychology, 88(5), 879-903.
Ramirez, A., Jr., Walther, J. B., Burgoon, J. K., & Sunnafrank, M. (2002). Information seeking
strategies, uncertainty, and computer-mediated communication: Toward a conceptual
model. Human Communication Research, 28, 213–228.
Reber, A. S. (1967). Implicit learning of artificial grammars. Journal of Verbal Learning and
Verbal Behavior, 5, 855-863.
Reichheld, F. F., & Schefter, P. (2000). E-loyalty: Your secret weapon on the web. Harvard
Business Review, 78 (4), 105–113.
Ringle, C. M., Wende, S., & Will, A. (2005). SmartPLS 2.0 M3 (Beta), SmartPLS,

143
Hamburg, Germany.
Rise, J., Sheeran, P., & Hukkelberg, S. (2010). The role of self-identity in the theory of
planned behavior: A meta-analysis. Journal of Applied Social Psychology, 40(5), 1085-
1105.
Roberson, L., Kulik, C. T., & Pepper, M. B. (2001). Designing effective diversity training:
Influence of group composition and trainee experience. Journal of Organizational
Behavior, 22, 871-885.
Rogers, E. M. (2003). Diffusion of innovations (5th). Detroit, MI: Free Press.
Rosenberg, M. J., & Hovland, C. I. (1960). Cognitive, affective, and behavioral components of
attitude. In M.J. Rosenberg, C.I. Hovland, W.J. McGuire, R.P. Abelson, & J.W. Brebm
(Eds.), Attitude organization and change: An analysis of consistency among attitude
components (pp.1-14). New Haven, CT: Yale University Press.
Saga, V., & Zmud, R. (1994). The nature and determinants of IT acceptance, routinization, and
infusion. In L. Levine (ed.), Diffusion, transfer and implementation of information
technology (pp. 67-86). North-Holland, NL: Amsterdam.
Scevak, N. (2010). Forrester research mobile media and messaging forecast, 2010 to 2015
(Western Europe). Retrieved from:
http://www.forrester.com/Forrester+Research+Mobile+Media+And+Messaging+Forecast
+2010+To+2015+Western+Europe/-/E-RES57671?objectid=RES57671.
Schierz, P. G., Schilke, O., & Wirtz, B. W. (2010). Understanding consumer acceptance of
mobile payment services: An empirical analysis. Electronic Commerce Research and
Applications, 9, 209-216.
Setterstrom, A. J., Pearson, J. M., & Orwig, R. A. (2013). Web-enabled wireless technology:
An exploratory study of adoption and continued use intention. Behavior & Information
Technology, 32(11), 1139-1154.
Severin, W. J., & Tankard, J. W. (2000). Communication theories: Origins, methods, and uses
in the mass media. New York, NY: Longman.
Shin, D. (2009). Towards an understanding of the consumer acceptance of mobile wallet.
Computer in Human Behavior, 25, 1343-1354.
Simon, H. A. (1960). The new science of management decision. New York: Harper and
Brothers.

144
Singh, N., Zhao, H., & Hu, X. (2005). Analyzing the cultural content of web sites: A cross-
national comparison of China, India, Japan, and US. International Marketing Review,
22(2), 129-146.
Smith, S. P., Johnston, R. B., & Howard, S. (2011). Putting yourself in the picture: An
evaluation of virtual model technology as an online shopping tool. Information
Systems Research, 22(3), 640-659.
Sohail, M. S., & Al-Jabri, I. M. (2014). Attitudes towards mobile banking: Are there any
differences between users and non-users? Behavior & Information Technology, 33(4),
335-344.
Spiegler, I. (2003). Technology and knowledge: Bridging a “generating” gap. Information &
Management, 40, 533-539.
Suh, K., & Lee, Y. E. (2005). The effects of virtual reality on consumer learning: An
empirical investigation. MIS Quarterly, 29(4), 673-697.
Sun, Y., Fang, Y., Lim, K. H., & Straub, D. (2012). User satisfaction with information
technology service delivery: A social capital perspective. Information Systems
Research, 23(4), 1195-1211.
Tan, F., Yan, L., & Urquhart, C. (2007). The effect of cultural differences on attitude, peer
influence, external influence, and self-efficacy in actual online shopping behavior.
Journal of Information Science & Technology, 4(1), 3-23.
Taylor, S., & Todd, P. A. (1995). Understanding information technology use: A test of
competing models. Information Systems Research, 6(2), 144-176.
Tewksbury, D., Weaver, A. J., Maddex, B. D. (2001). Accidentally informed: Incidental news
exposure on the World Wide Web. Journalism and Mass Communication Quarterly, 78
(3), 533-554.
Turner, A. (2009). M-payment models: Starting to look good, payments cards and mobile.
Retrieved from: http://www.paymentscardsandmobile.com.
van Beuningen, J., de Ruyter, K., & Wetzels, S. (2009). Customer self-efficacy in technology-
based self-service: Assessing between and within person differences. Journal of Service
Research, 11(4), 407-428.
Venkatesan, M. (1973). Cognitive consistency and novelty seeking. In Ward, S. & Robertson,
T. (eds.). Consumer behavior: Theoretical sources. Englewood Cliffs, NJ: Prentice-Hall.

145
Venkatesh, V. (2000). Determinants of perceived ease of use: Integrating control, intrinsic
motivation, and emotion into the technology acceptance model. Information Systems
Research, 11(4), 342-365.
Venkatesh, V., & Brown, S. A. (2001). A longitudinal investigation of personal computers in
homes: Adoption determinants and emerging challenges. MIS Quarterly, 25(1), 71–102.
Venkatesh, V., Morris, M. G., Davis, G. B., & Davis, F. D. (2003). User acceptance of
information technology: Toward a unified view. MIS Quarterly, 27(3), 425-478.
Venkatesh, V., Thong, J. Y. L., & Xu, X. (2012). Consumer acceptance and use of information
technology: Extending the unified theory of acceptance and use of technology. MIS
Quarterly, 36(1), 157-178.
Warkentin, M., Johnston, A.C., & Shropshire, J. (2011). The influence of the informal social
learning environment on information privacy policy compliance efficacy and intention.
European Journal of Information Systems, 20, 267-284.
Wei, Y., Frankwick, G. L., Gao, T., & Zhou, N. (2011). Consumer adoption intentions toward
the Internet in China: The effects of impersonal and interpersonal communication
channels. Journal of Advertising Research, 51(4), 594-607.
Wirtz, J., & Mattila, A. S. (2003). The effects of consumer expertise on evoked set size and
service loyalty. Journal of Services Marketing, 17(7), 649-665.
Wu, S. (2006). A comparison of the behavior of different customer clusters toward Internet
bookstores. Information & Management, 43, 986-1001.
Yang, S., Lu, Y., Gupta, S., Cao, Y., & Zhang, R. (2012). Mobile payment services adoption
across time: An empirical study of the effects of behavioral beliefs, social influence, and
personal traits. Computer in Human Behavior, 28, 129-142.
Yoo, C. Y. (2008). Unconscious processing of web advertising: Effects on implicit memory,
attitude toward the brand, and consideration set. Journal of Interactive Marketing, 22 (2),
2–17.
Zajonc, R. B. (1968). Attitudinal effects of mere exposure. Journal of Personality and Social
Psychology, 9(2, Pt. 2), 1-27.
Zhou, T. (2011). An empirical examination of initial trust in mobile banking. Internet
Research, 21(5), 527-540.
Zhou, T. (2013). An empirical examination of continuance intention of mobile payment

146
services. Decision Support Systems, 54(2), 1085-1091.
Zhu, P. (2004). The relationship among community identification, community trust, and
purchase behavior- The case of RVs communities (Unpublished master’s thesis).
National Dong Hwa University, Shoufeng.

147
APPENDIX 2: Instrument
Table A. Measurement Items for Users
Exposure to Mobile Payments
Media Usage
1. I often obtain information about mobile payments from online newspapers.
2. I often obtain information about mobile payments from printed newspapers.
3. I often obtain information about mobile payments from online magazines.
4. I often obtain information about mobile payments from printed magazines.
5. I often obtain information about mobile payments from TV.
6. I often obtain information about mobile payments from radio.
7. I often obtain information about mobile payments from the Internet (excluding online newspapers and magazines).
Adapted from Loibl et al. (2009) and Wei et al. (2011)
Positive Word of Mouth
1. People say positive things about mobile payments.
2. People recommend using mobile payments to me.
3. Someone else from whom I seek advice recommends mobile payments for me.
Adapted from Alexandrov and Babakus (2013)
Explicit Social Influence
1. People who are important to me think that I should use mobile payments.
2. People who influence my behavior think that I should use mobile payments.
3. People whose opinions that I value prefer that I use mobile payments.
Adapted from Venkatesh et al. (2012)
Implicit Social Influence
1. People who are important to me use mobile payments.
2. People who influence my behavior use mobile payments.
3. People whose opinions that I value use mobile payments.
Adapted from Kim et al. (2007)
Information Searching
1. I have researched, on my own initiative, in order to increase my knowledge of using mobile payments.
2. I have researched, on my own initiative, in order to increase my mastery of using mobile payments.
3. I have explored several information sources, on my own initiative, concerning using mobile payments.
4. I have spent much time and energy learning about using mobile payments.

148
5. I have invested much time and energy in order to better use mobile payments.
Adapted from Barki et al. (2007)
Self-Efficacy
1. I feel comfortable using mobile payments on my own.
2. I can easily use mobile payments on my own.
3. I feel comfortable using mobile payments even if there is no one around me to tell me how to use it.
Adapted from Hsieh et al. (2011)
Attitude
1. Using mobile payments is a good idea.
2. Using mobile payments is wise.
3. Using mobile payments is useful.
4. Using mobile payments is interesting.
Adapted from Schierz et al. (2010)
Perceived Knowledge
1. I feel very knowledgeable about mobile payments.
2. If I continue using mobile payments, I would need to gather very little information in order to make a wise decision.
3. If a friend asked me about mobile payments, I could give them advice about different kinds of mobile payments.
4. I feel very confident about my ability to tell the difference in quality among different kinds of mobile payments.
Adapted from Suh and Lee (2005)
Intention to continue using
1. I intend to continue using mobile payments in the future.
2. I predict that I will continue to use mobile payments frequently in the future.
3. I will strongly recommend that others use mobile payments.
Adapted from Venkatesh et al. (2012)
Disposition to Trust
1. It is easy for me to trust an information technology.
2. I tend to trust an information technology, even though I have little knowledge of it.
3. My tendency to trust information technology is high.
Adapted from Zhou (2011)
Institution-based Trust
1. I believe mobile technology has enough safeguards to make me feel comfortable using it to make mobile payments.

149
2. I feel assured that legal structures adequately protect me from payment problems with mobile technology.
3. I feel assured that technological structures adequately protect me from payment problems with mobile technology.
4. I feel confident that encryption and other technological advances with mobile technology make it safe for me to use mobile payments.
5. In general, the mobile technology provides a robust environment to perform mobile payments.
6. In general, the mobile technology provides a safe environment to perform mobile payments.
Adapted from Setterstrom et al. (2013)
Perceived Usefulness
1. Using mobile payments enables me to pay more quickly.
2. Using mobile payments makes it easier for me to conduct transactions.
3. I find mobile payments a useful possibility for making payments.
Adopted from Kim et al. (2010)

150
Table B. Measurement Items for Non-Users
Exposure to Mobile Payments:
Media Usage
1. I often obtain information about mobile payments from online newspapers.
2. I often obtain information about mobile payments from printed newspapers.
3. I often obtain information about mobile payments from online magazines.
4. I often obtain information about mobile payments from printed magazines.
5. I often obtain information about mobile payments from TV.
6. I often obtain information about mobile payments from radio.
7. I often obtain information about mobile payments from the Internet (excluding online newspapers and magazines).
Adapted from Loibl et al. (2009) and Wei et al. (2011)
Positive Word of Mouth
1. People say positive things about mobile payments.
2. People recommend using mobile payments to me.
3. Someone else from whom I seek advice recommends mobile payments for me.
Adapted from Alexandrov and Babakus (2013)
Explicit Social Influence
1. People who are important to me think that I should use mobile payments.
2. People who influence my behavior think that I should use mobile payments.
3. People whose opinions that I value prefer that I use mobile payments.
Adapted from Venkatesh et al. (2012)
Implicit Social Influence
1. People who are important to me use mobile payments.
2. People who influence my behavior use mobile payments.
3. People whose opinions that I value use mobile payments.
Adapted from Kim et al. (2007)
Information Searching:
1. I have researched, on my own initiative, in order to increase my knowledge of using mobile payments.
2. I have researched, on my own initiative, in order to increase my mastery of using mobile payments.
3. I have explored several information sources, on my own initiative, concerning using mobile payments.
4. I have spent much time and energy learning about using mobile payments.
5. I have invested much time and energy in order to better use mobile payments.

151
Adapted from Barki et al. (2007)
Self-Efficacy:
1. I feel comfortable using mobile payments on my own.
2. I can easily use mobile payments on my own.
3. I feel comfortable using mobile payments even if there is no one around me to tell me how to use it.
Adapted from Hsieh et al. (2011)
Attitude:
1. Using mobile payments is a good idea.
2. Using mobile payments is wise.
3. Using mobile payments is useful.
4. Using mobile payments is interesting.
Adapted from Schierz et al. (2010)
Perceived Knowledge:
1. I feel very knowledgeable about mobile payments.
2. If I adopt mobile payments, I would need to gather very little information in order to make a wise decision.
3. If a friend asked me about mobile payments, I could give them advice about different kinds of mobile payments.
4. I feel very confident about my ability to tell the difference in quality among different kinds of mobile payments.
Adapted from Suh and Lee (2005)
Intention to Use:
1. I intend to use mobile payments in the future.
2. I predict that I will frequently use mobile payments in the future.
3. In the future, I will strongly recommend that others use mobile payments.
Adapted from Gu et al. (2009)
Disposition to Trust:
1. It is easy for me to trust an information technology.
2. I tend to trust an information technology, even though I have little knowledge of it.
3. My tendency to trust information technology is high.
Adapted from Zhou (2011)
Institution-based Trust:
1. I believe mobile technology has enough safeguards to make me feel comfortable using it to make mobile payments.
2. I feel assured that legal structures adequately protect me from payment problems with
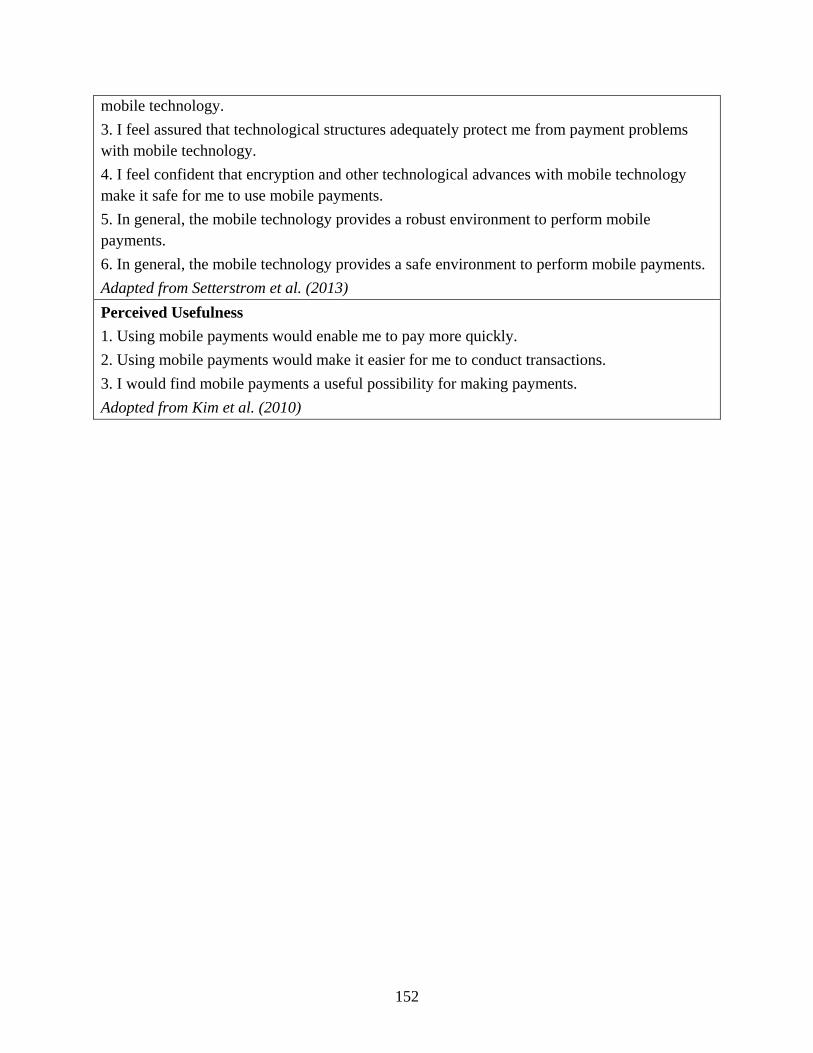
152
mobile technology.
3. I feel assured that technological structures adequately protect me from payment problems with mobile technology.
4. I feel confident that encryption and other technological advances with mobile technology make it safe for me to use mobile payments.
5. In general, the mobile technology provides a robust environment to perform mobile payments.
6. In general, the mobile technology provides a safe environment to perform mobile payments.
Adapted from Setterstrom et al. (2013)
Perceived Usefulness
1. Using mobile payments would enable me to pay more quickly.
2. Using mobile payments would make it easier for me to conduct transactions.
3. I would find mobile payments a useful possibility for making payments.
Adopted from Kim et al. (2010)

153
ESSAY 3: THE EFFECT OF TECHNOLOGY USAGE HABITS AND PRICE DISCOUNT ON CONSUMERS’ INTENTION TO CONTINUE USING MOBILE
PAYMENTS
Introduction
Mobile payments are transactions that use mobile devices to pay for goods, services, and
bills or perform bank transactions by using mobile technology (Dahlberg, Mallat, Ondrus, &
Zmijewska, 2008; Gerpott & Kornmeier, 2009; Mallat, 2007). Today, we are in the era of mobile
commerce. As the popularity of mobile devices increases, mobile payments have become one of
the critical drivers for mobile commerce success (Yang, Lu, Gupta, Cao, & Zhang, 2012).
Mobile payment service providers can achieve success by encouraging consumers to
continuously use mobile payments. This is because continuous usage of mobile payments
encourages consumers to develop loyalty toward mobile payments (Deng et al., 2010) and results
in lower marketing cost and more profit (Gupta & Kim, 2007; Reichheld & Schefter, 2000).
However, the percentage of consumers who frequently use mobile payments is low.
According to a 2012 McKinsey report, in the United States, 3% of mobile payment users
perform mobile payments once to several times a day, and 13% of users perform mobile
payments once a week; in China, 13% of users perform mobile payments once to several times a
day, and 15% of users perform mobile payments once a week (Ewing, Leberman, Mendelsohn,
& Milner, 2012). This is not ideal for the companies who have invested considerable assets in
mobile payments. For example, China Mobile invested US$7 billion in the Shanghai Pudong
Development Bank to prepare for its mobile payments business (Yang et al., 2012); three
154
American wireless carriers, Verizon, AT&T, and T-Mobile, invested US$100 million in Softcard
mobile wallet in order to compete with Google wallet (Kharif, 2011). Companies cannot recover
their investments in mobile payments if consumers do not adopt and use it continuously. Low
continuous usage rate is also not ideal for consumers. They cannot benefit from the
implementation of mobile payments if they do not use it (Setterstrom, Pearson, & Orwig, 2013).
Thus, it is important to explore factors that affect consumers’ intention to continue using mobile
payments.
Some IS acceptance research has focused on the importance of habit, which reflects
consumers’ automatic usage of technology (Limayem, Hirt, & Cheung, 2007; Polites &
Karahanna, 2013; Venkatesh, Thong, & Xu, 2012; Yang et al., 2012). However, Limayem et al.
(2007) noted that there is no convincing argument or a sound theoretical base for the relationship
between habit and behavioral intention. As a response to the criticism of Limayem et al. (2007),
Venkatesh et al. (2012) explored the effect of habit on an individual’s technology usage
behavior. Venkatesh et al. (2012) posited that habit not only has a direct effect on consumers’
technology usage but has an impact on their intention to use technology, which in turn affects
their technology usage. However, Venkatesh et al. (2012) did not explicate the mechanisms
through which habit affects consumers’ behavioral intention. Further research is needed to
investigate the effect of habit on consumers’ mobile payment adoption behavior (Yang et al.,
2012).
Past literature focuses on the effect of consumers’ prior usage of a certain IT innovation
on their future usage of it. The effect of a similar innovation on their future usage of the initial
innovation has been largely neglected. Ajzen (1991) posited that the establishment of the link
between prior and future usage of a certain innovation does not contribute to theoretical

155
understanding of post adoption research. The link simply reflects the stability in consumers’
usage behavior across time (Ajzen, 1991). In this study, technology acceptance is viewed from
the IT ecosystem perspective, and transfer of learning theories serve as the theoretical
background.
IT ecosystem refers to “a subset of information technologies in the IT landscape that are
related to one another in a specific context of use” (Adomavicius, Bockstedt, Gupta, &
Kauffman, 2008a, p. 783). Mobile payments are a type of mobile service. Mobile payments,
mobile services (other than mobile payments), online shopping, and cell phones belong to the
mobile ecosystem (Basole, 2009). This study focuses on four types of technology usage habits,
which are mobile payment usage habit, mobile service usage habit (other than mobile payments),
cell phone usage habit, and online shopping habit. We investigate how different types of
technology usage habits affect consumers’ intention to continue using mobile payments. This
study also explores the moderation effect of price discount on the transference of online
shopping habit, mobile service usage habit, and cell phone usage habit to mobile payment usage
habit. This serves as a response to the request of Shin (2007, 2008) to explore the importance of
moderators that affect technology adoption.
The objective of this research is to explore the effect of technology usage habits and price
discount on consumers’ intention to continue using mobile payments. Our research questions are:
first, do consumers’ technology usage habits affect their intention to continue using mobile
payments; and whether price discount moderates consumers’ transference of three types of
technology usage habits to mobile payment usage habit. The rest of the paper proceeds as
follows. The theoretical background and conceptual model are presented first. Then, the

156
hypotheses are developed. Data collection and analysis are explained next, followed by
presentation of the results. Key findings and implications are then discussed.
Theoretical Background and Research Model
IT Ecosystem View
There has been extensive research on adoption of innovations, and there are many
theories to guide IS adoption research such as theory of planned behavior and the united theory
of acceptance and use of technology. A critique of past research and theories is that they consider
the innovation individually (Adomavicius, Bockstedt, Gupta, & Kauffman, 2008b), and thus the
effect of other innovations on the adoption of the object innovation is neglected. The IT
ecosystem view suggests that similar or related technologies interact with each other (Swanson,
1994). In addition, it highlights dynamic and interdependent relationships among interrelated
technologies in the IT ecosystem (Adomavicius et al., 2007). Thus, the IT ecosystem view is
adopted to explore the effect of technology usage habits on the adoption of mobile payments.
Adomavicius, Bockstedt, Gupta, and Kauffman (2007) defined a technology ecosystem
as “a system of interrelated technologies that influence each other’s evolution and development”
(p. 201). They distinguished three roles of technologies in the ecosystem: component, product
and application, and support and infrastructure roles. The component role describes basic
technologies that are necessary to perform functions of focal technology in the given context of
use; the product and application role that includes the focal technology and other competing
technologies in a certain usage context; and the support and infrastructure role that describes
technologies that “enable or work in conjunction with product and application role technologies
in an IT ecosystem” (Adomavicius et al., 2008a, p. 784). These three technology roles interact
with each other in a triadic causal framework that contains both within-level and cross-level

157
interactions (Adomavicius, Bockstedt, & Gupta, 2012). Within-level interaction refers to the
effect of a technology role on its future development (Adomavicius et al., 2012). For example,
infrastructure technologies will drive subsequent development of future infrastructure
technologies. Cross-level interaction refers to the effect of a technology role on future
development of other technology roles (Adomavicius et al., 2012). For example, infrastructure
technologies will drive subsequent development of future product technologies.
The IT ecosystem view emphasizes the mutual influence of technologies in the
ecosystem. Adomavicius et al. (2007, 2008) explored the mutual influence of different
technologies from the perspective of technology roles. They defined paths of influence to
represent “the impacts of innovation across technology roles within an IT ecosystem”
(Adomavicius et al., 2008a, p. 784) and summarized nine paths of influence. For example, the
component role may take on the product/application role in the future. Adomavicius et al. (2008)
built an IT ecosystem of digital music and mapped its evolution by considering paths of
influences among three technology roles.
Basole (2009) developed the mobile ecosystem by converging different firms in the
ecosystem. There are fourteen segments in the ecosystem such as device manufacturers,
application & software providers, and mobile network operators (Basole, 2009). Mobile
payments are a component of the mobile ecosystem. In this research, we focus on four relevant
technologies: online shopping, mobile service excluding mobile payment, cell phone, and mobile
payment. Mobile payment infrastructure serves as the focal technology in the ecosystem. Mobile
services other than mobile payments can play two different roles: the component role and the
product & application role. For example, remote mobile payments are based on mobile apps

158
while mobile banking is similar to mobile payments. Online shopping and cell phones play the
support and infrastructure role in the ecosystem.
Transfer of Learning Theories
Desse (1958) suggested that transfer of learning is the most important topic in the
psychology of learning because a central goal of education is to teach students to transfer
previously learned knowledge from their initial learning to similar or new situations (Lobato,
2006). Past literature on transfer of learning focuses primarily on two topics: first, what is
transfer of learning and which factors affect it; second, how can factors that affect transfer of
learning be measured (Holton, Bates, & Ruona, 2000).
Definitions and types of transfer of learning.
There are different definitions of transfer of learning. Perkins and Salomon (1992)
suggested that transfer of learning refers to the process whereby learning occurring in one
context enhances or undermines a related performance in another area. Byrnes (1996) and
Bransford et al. (2000) defined transfer of learning as the application of knowledge learned in
one context to a new context. The most popular definition may be the one proposed by Haskell
(2001), who defined transfer of learning as the use of past learning when learning something new
and the application of that learning to both similar and new situations; thus transfer of learning is
the ability to apply previously learned skills, processes, or content to new or different situations.
Although there are multiple definitions of transfer of learning, it is generally agreed that transfer
of learning involves the application, generalizability, and maintenance of previously learned
knowledge and skills (Ford & Weissbein, 1997). In this research, transfer of learning is defined
as the process during which consumers’ habits of using various technologies enhances or
undermines their formation of habits of using similar or new technologies.

159
Haskell (2001) summarized six levels of transfer, which are nonspecific transfer,
application transfer, context transfer, near transfer, far transfer, and creative transfer. Nonspecific
transfer refers to learning that “depends on some connection to past learning” (Haskell, 2001, p.
29), application transfer refers to the application of past learning to a specific situation (Haskell,
2001), context transfer refers to “applying what one has learned in a slightly different situation”
(p. 29), near transfer refers to “when previous knowledge is transferred to new situations that are
closely similar but not identical to previous situations” (p. 29), far transfer refers to “applying
learning to situations that are quite dissimilar to the original learning” (p. 29), and creative
transfer refers to transferring past learning to new situation in a creative approach (Haskell,
2001). Haskell (2001) further suggested that “nonspecific transfer and application transfer are
essentially simple learning, not transfer proper at all; context transfer is simply the application of
learning, reserving level four as near transfer, and far transfer and creative transfer as far
transfer” (p. 30). The effect of consumers’ mobile payment usage habit on their future usage of
mobile payments pertains to the first three levels of learning transfer, and the effect of their
online shopping habit, mobile service usage habit, and cell phone usage habit on behavioral
intention pertains to the latter three levels of learning transfer.
Models of transfer of learning.
There are three streams of learning transfer models. The first one is the classic stream.
This stream emphasizes the importance of environmental factors such as similarity between the
learning situation and the transfer situation. The identical element model is one representative
model of this stream (Lobato, 2006). This model emphasizes the importance of identical
elements between the learning situation and the transfer situation in affecting transfer of learning
(Thorndike, 1924; Thorndike & Woodworth, 1901). Butterfield and Nelson (1989) suggested

160
that similarities or connections between past experience and the current situation support transfer
of learning. The more similarity between the learning situation and transfer situation, the greater
the transfer of learning (Yorks et al., 1998). There are two types of similarity, surface similarity
and deep similarity (Day & Goldstone, 2012; Juvina et al., 2013). Deep similarity facilitates
transfer of learning while surface similarity can either facilitate or hinder transfer of learning
depending on whether the similarity leads individuals toward an optimal or sub-optimal solution
in the target situation (Juvina et al., 2013). However, the classic stream does not address the
intrinsic factors of people.
Since 1985, transfer of learning theorists have become interested in exploring transfer of
learning mechanisms from the field of cognitive psychology and other areas that are related to
information processing (Haskell, 2001). This stream of learning transfer theories refers to the
cognitive perspective and emphasizes the impact of individuals’ intrinsic factors on transfer of
learning. This stream is built on information processing theory and puts the active learner at the
center of the learning process (Macaulay & Cree, 1999). It suggests that individuals should
retrieve a relevant skill or knowledge to transfer what they have previously learned to new
situations (Royer, 1979). According to information processing theory, learners transfer their
experience and previously obtained information into knowledge or a skill that will affect their
performance or behavior (Newell & Simon, 1972). Knowledge is stored in memory as schemata,
which is a hypothetical structure by which information and knowledge is thought to be organized
and processed (Haskell, 2001; Macaulay & Cree, 1999). When a learner is faced with new tasks
to perform or new concepts to learn, he or she will interpret new information in terms of relevant
existing schemata (Haskell, 2001). Thus, previously learned knowledge will be accessed and
retrieved to solve problems in transfer situations.

161
The classic perspective emphasizes similarities between learning and transfer situations
and the cognitive perspective emphasizes the vital role of learners’ prior knowledge or skills in
affecting transfer of learning. Each of these two perspectives focuses only on one set of factors
that affect transfer of learning. Baldwin and Ford (1988) were among the first researchers to
introduce a holistic model to explain transfer of learning. They proposed three sets of factors that
will affect transfer of training: trainee characteristics, training design factors, and work
environment. Trainee characteristics include skill or ability, personality factors, and motivation;
training design includes a strong transfer design and appropriate content; and working
environment includes support and opportunity to use (Baldwin & Ford, 1988). Some researchers
consider these factors a generalized transfer climate (Holton & Baldwin, 2000). Holton (1996)
and Holton et al. (2000) developed the learning transfer system inventory scale, which can be
used to measure transfer climate. There are four sets of factors in the instrument: motivational
factors, such as extrinsic reward, trainee characteristics, such as learner readiness and self-
efficacy, environmental factors, such as supervisor support for transfer and supervisor sanctions,
and ability factors, such as perceived knowledge (Holton et al., 2007). Price discount, the price
reduction that consumers obtain if they choose to make a purchase using mobile payments, is an
example of extrinsic motivation to transfer (Yeung, Yee, & Morris, 2010). In this research, we
explore the moderation effect of price discount on consumers’ transfer of learning.
Summary
The combination of the IT ecosystem view and transfer of learning theories may enhance
our understanding of consumers’ mobile payment adoption. The IT ecosystem view coincides
with transfer of learning theories, which suggest that consumers’ past usage of different
technologies will enhance or undermine their potential usage of similar or new technologies

162
(Haskell, 2001). The IT ecosystem view has some shortcomings. For example, the IT ecosystem
view emphasizes the positive relationship between technologies in the ecosystem (Adomavicius
et al., 2008), but does not explore factors that affect the strength of those paths of influence.
Transfer of learning theories make up for the shortcomings of the IT ecosystems view.
For example, the classic stream of learning transfer models emphasizes the importance of
similarity between learning and transfer situations (Lobato, 2006). Deep similarity will boost
transfer of learning while surface similarity can either facilitate or hinder transfer of learning
(Juvina et al., 2013). In addition, the holistic stream of learning transfer models addresses factors
that affect transfer of learning. Holton (1996) and Holton et al. (2000) proposed four sets of
factors that affect transfer of learning, one of which is motivation factors such as monetary
reward. In this research, we explore the effects of four relevant technologies and discuss the
moderation effect of price discount on transfer of learning. Combining the IT ecosystem view
and transfer of learning theories may enhance our understanding of the relationships among these
factors.
Research Model
Dowrick (2012) posited that an individual’s future behavior is affected by his or her past
specific and relevant behaviors. A theoretical model was developed based on the IT ecosystem
view and transfer of learning theories to explore the impact of price discount and consumers’
technology usage habits on their future behavior intention (Figure 1). According to the model,
online shopping habit, mobile service usage habit, and cell phone usage habit will have a positive
relationship with consumers’ mobile payment usage habit, which will positively impact their
intention to continue using mobile payments. In addition, price discount will positively moderate

163
consumers’ transference from online shopping, mobile service usage, and cell phone usage habits
to mobile payment usage habit.
Figure 1. Research Model
Hypotheses Development
Effect of Online Shopping Habit
Online shopping has become an important part of our daily lives. Online shopping habit
reflects the extent to which consumers tend to automatically shop online (Limayem et al., 2007).
Consumers shop online because, at least to some extent, it is convenient (Beauchamp & Ponder,
2010). Consumers who have formed online shopping habits prefer to shop online anytime and
anywhere (Jiang et al., 2013). This requires availability of flexible payment approaches because
payment is a necessary stage for consumers to complete transactions (Jiang et al., 2013). Mobile
payments are an effective payment option (Yang et al., 2012) because they are notable for their
mobility, reachability, compatibility, and convenience (Kim et al., 2010). Mobile payments
provide consumers with ubiquitous payment services (Lu et al., 2011), allowing consumers to
shop online and make payments anytime and anywhere if they have access to mobile internet.
H5b:+
H5a:+
H5c:+
H1:+
H3:+
H2:+ H4:+ Mobile Payment Usage Habit
Behavioral Intention
Mobile Service Usage Habit
Online Shopping Habit
Cell phone Usage Habit
Price Discount

164
Thus, mobile payments become attractive and important for consumers who have an online
shopping habit. Consumers who consider mobile payments attractive and important are more
likely to develop a mobile payment usage habit (Lankton, Wilson, & Mao, 2010). Thus,
consumers who shop online frequently may consider mobile payments important, encouraging
them to form a mobile payment usage habit. A similar conclusion can be found in Hoffman and
Novak (1996) and Novak et al. (2000), who posited that importance has a positive relationship
with consumers’ increased use of information technologies.
Additionally, people with a strong online shopping habit will make online purchase more
frequently than those with a weak one. Most e-commerce companies provide different payment
options in the payment stage for their consumers, one of which is mobile payments. Thus,
consumers who shop online frequently have more chances to use mobile payments than those
who shop online less frequently. An individual’s frequency of mobile payment use is a good
predictor of his/her mobile payment usage habit (Jolley, Mizerski, Olaru, 2006). In addition, Lim
and Johnson (2002) posited that opportunity to use is an important reason for high transfer and
lack of opportunity to use is an important reason for low transfer. The extent of transfer is
reflected as the strength of relationship between online shopping habit and mobile payment
usage habit. Thus, the more frequently consumers shop online, the more frequently they have the
opportunity to use mobile payments, and the more likely they will develop a mobile payment
usage habit.
Hypothesis 1. Consumers’ online shopping habit will have a positive relationship with
their mobile payment usage habit.
Effect of Mobile Service Usage Habit

165
Mobile service usage habit refers to the extent to which consumers tend to automatically
use different types of mobile services (Limayem et al., 2007). There are many types of mobile
services such as downloading ring tones and pictures, location navigation, instant messaging, and
mobile banking (Zhao, Lu, Zhang, & Chau, 2012). Mobile payments are a type of mobile
service. However, we focus on the adoption of mobile payments and explore the effect of mobile
service usage habit (other than mobile payments) on consumers’ mobile payment acceptance.
Mobile services refer to services other than mobile payments in this study. Mobile payments are
similar to other types of mobile services because all of them are based on mobile technology. For
example, remote mobile payments may be based on mobile applications such as mobile instant
messaging. Similarity and compatibility between mobile services and mobile payments may
encourage consumers to adopt mobile payments (Roger, 2003). Transfer of learning theories also
support that similarity between mobile services and mobile payments encourages consumers to
form or strengthen their mobile payment usage habit (Butterfield & Nelson, 1989; York et al.,
1998).
Past experience of using mobile services has a positive relationship with accepting
mobile payments (Giovanis, Binioris, & Polychronopoulos, 2012). Experience with using mobile
services will boost consumers’ self-efficacy of using mobile payments (Giovanis et al., 2012).
Consumers that have a high level of self-efficacy are more likely to use mobile payments
repeatedly (Ajzen, 1991). Thus, people with a stronger mobile service usage habit are more
likely to have a higher level of self-efficacy and feel more familiar with mobile payment
services, encouraging the formation of a mobile payment usage habit (Chiu, et al., 2010).
Moreover, mobile payments involve a high level of uncertainty and different types of risks
(Zhou, 2014). Frequent usage of mobile services will encourage consumers to decrease their
166
perceived uncertainty toward mobile technologies, which is positively related with their
institution-based trust in mobile technology. Institution-based trust refers to an individual’s
perceived trust in the institutional environment such as mobile technology in this study
(McKnight et al., 2002). Mobile payments are operated on mobile technology. Consumers that
have a lower level of perceived uncertainty and a higher level of institution-based trust in mobile
technology are more likely to trust mobile payments and thereafter use them repeatedly
according to the initial trust building theory (McKnight et al., 1998, 2002). This logic is
supported by past literature such as Kim and Han (2009), who posited that consumers’ trust in an
innovation is positively related to their intention to use the innovation habitually. In view of the
above, we posit that
Hypothesis 2. Consumers’ mobile service usage habit will have a positive relationship
with their mobile payment usage habit.
Effect of Cell Phone Usage Habit
People use their smartphones for surfing the Internet, checking social networking sites,
playing games, using apps, sending texts, and making phone calls. This leads to the formation of
a high-level cell phone usage habit, which refers to the extent to which consumers tend to
automatically use cell phones (Limayem et al., 2007). Mobile payments are closely related to cell
phones because payments are initiated and performed on mobile devices such as cell phones. As
cell phone usage expands, the possibility that consumers can rely on their cell phones as primary
payment devices increases (Au & Kauffman, 2008). This can be explained from several aspects.
First, consumers with a stronger cell phone usage habit tend to explore potential usage of their
cell phones (Au & Kauffman, 2008). Mobile payments make smartphones flexible payment

167
devices and thus realize a potential commercial value of smartphones (Andreev, Duane, &
O’Reilly, 2011). Consumers will consider mobile payments useful because it helps them move
beyond the limitation of using computers to surf on the internet, pay bills, and purchase items.
Thus, consumers who have formed the habit of using cell phones are more likely to be interested
in mobile payments.
Additionally, cell phone usage habit allows consumers to be more familiar with mobile
technology. Consumers who use cell phones frequently can learn to use mobile payments easily
and know how to avoid risk issues such as fraud while performing mobile payments. Thus,
frequent use of cell phones makes it easier for consumers to use mobile payments. Behaviors are
prone to be repeated if individuals can perform them quickly and relatively effortlessly
(Lindbladh & Lyttkens, 2002). Thus, cell phone usage habit will reduce consumers’ effort to
learn how to habitually use mobile payments and thus encourage consumers to use mobile
payments. In view of the reasons mentioned above, it is anticipate that
Hypothesis 3. Consumers’ cell phone usage habit will have a positive relationship with
their mobile payment usage habit.
Effect of Mobile Payment Usage Habit
The majority of people’s actions are executed on a routine basis (Aarts & Dijksterhuis,
2000). We cannot often explain why we are willing to perform a certain kind of behavior; rather,
the behavior is a habit. Habit in our context refers to the extent to which people tend to use
mobile payments automatically (Limayem et al., 2007). After the formation of a mobile payment
usage habit, consumers tend to continue using mobile payments as a matter of automated action.
This relationship is reasonable because consumers’ habit encourages resistance to change

168
(Polites & Karahanna, 2012), which has a positive relationship with their intention to continue
using a certain innovation. In addition, habitual behaviors are effortless and cognitively easier to
perform than other behaviors (Lankton et al., 2010). Consumers are more likely to repeat
behaviors that can be performed with less effort (Lindbladh & Lyttkens, 2002). Thus, mobile
payment usage habit will encourage consumers to continue using mobile payments. The positive
relationship between habit and behavioral intention is also supported by the extended unified
theory of acceptance and use of technology (Venkatesh et al., 2012). Hence, we posit that
Hypothesis 4. Consumers’ mobile payment usage habit will have a positive relationship
with their intention to continue using mobile payments.
Moderation Effect of Price Discount
Mobile payments can be used to make payments in different areas such as shopping
online, purchasing mobile tickets, transferring money, paying credit bills, buying lottery, paying
power bills, and paying taxi bills. Comprehensiveness of usage refers to “the extent to which an
individual makes use of the various applications offered under the umbrella of a single IS
system” (Limayem et al., 2007, p. 715). In order to encourage users to use mobile payments and
increase their comprehensiveness of usage, service providers may offer their consumers with
different types of price discount. For example, Tecent Company, one of the largest mobile
payment service providers and IT companies, offers a seven to nine percent discount for
consumers who use their mobile payment services to purchase their virtual products (Tenpay,
2014). Price discount may motivate consumers to use mobile payments because they can save
money. Thus, a price discount should encourage consumers to use mobile payments (Haaker, de
Vos, & Bouwman, 2006).

169
Past literature of learning transfer summarizes four sets of factors that will affect transfer
of learning: motivational factors (e.g., extrinsic reward), trainee characteristics (e.g., self-
efficacy), environmental factors (e.g., supervisor support), and ability factors (e.g., perceived
knowledge) (Holton et al., 2007). Extrinsic motivation refers to behaviors that are performed for
externally reward such as pay and promotion (Deci et al., 1991). Price discount is an extrinsic
motivation to transfer (Burke & Hutchins, 2007; Yeung, Yee, & Morris, 2010). In this research,
we explore learning transfer from three types of technology usage habits, online shopping habit,
mobile service usage habit, and cell phone usage habit, to mobile payment usage habit. As a
component of extrinsic motivation to transfer, price discount is anticipated to encourage
consumers to learn to use mobile payments (Haskell, 2001; Haskell et al., 2007). Thus, price
discount will encourage the transfer from three technology usage habits to mobile payment usage
habit, which means that price discount positively moderates the relationship between online
shopping usage habit and mobile payment usage habit, between mobile service usage habit and
mobile payment usage habit, and between cell phone usage habit and mobile payment usage
habit.
For consumers who have an online shopping habit, price discount means saving for them
if they use mobile payments to complete online transactions. Meanwhile, consumers with a high
level of mobile service and cell phone usage habits can enjoy the price discount with little
learning cost (Chiu et al., 2012; Lankton et al., 2010). This is because they know how to use
mobile phones and mobile services and do not need to spend much time learning how to use
mobile payments. Price discount boosts consumers’ perceived usefulness of mobile payments
(Warr & Bunce, 1995), which motivates consumers to transfer their online shopping, cell phone,

170
and mobile service habits to use mobile payment regularly (Joo, Joung, & Son, 2014). Thus, we
anticipate that:
Hypothesis 5a. Price discount will positively moderate the relationship between online
shopping habit and mobile payment usage habit.
Hypothesis 5b. Price discount will positively moderate the relationship between mobile
service usage habit and mobile payment usage habit.
Hypothesis 5c. Price discount will positively moderate the relationship between cell
phone usage habit and mobile payment usage habit.
Methodology
Data Collection
A survey based research was used to develop an understanding of the effects of
technology usage habits and price discount on consumers’ intention to continue using mobile
payments. Two sets of data were collected. The first dataset was collected from the general
public in China. Two hundred and thirty one questionnaires were collected. Eleven
questionnaires were excluded from the dataset during data screening, making the final sample
size 220. The second dataset was collected from the general public in the United States. Two
hundred and twenty questionnaires were collected from the U.S. Eighteen questionnaires were
excluded during the data screening, making the final sample size 202. We randomly selected 202
questionnaires from the China dataset in order to compare Chinese and American respondents.
Table 1 summarizes the demographic information of the participants.
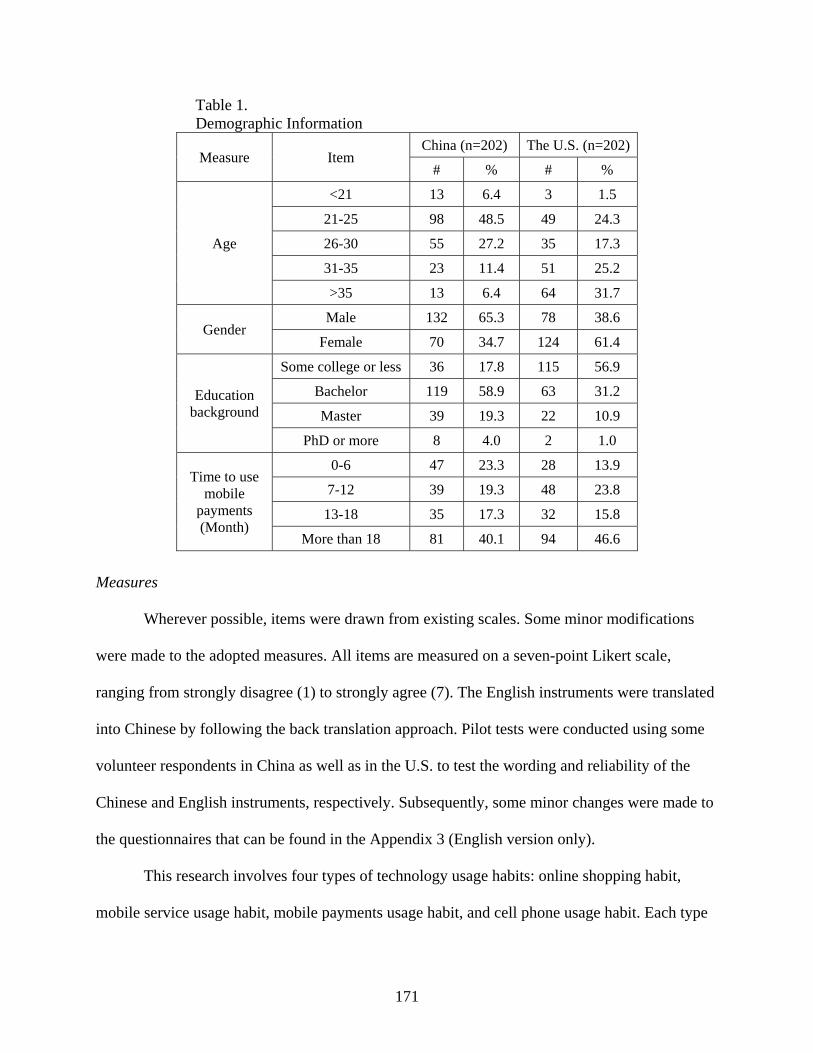
171
Table 1. Demographic Information
Measures
Wherever possible, items were drawn from existing scales. Some minor modifications
were made to the adopted measures. All items are measured on a seven-point Likert scale,
ranging from strongly disagree (1) to strongly agree (7). The English instruments were translated
into Chinese by following the back translation approach. Pilot tests were conducted using some
volunteer respondents in China as well as in the U.S. to test the wording and reliability of the
Chinese and English instruments, respectively. Subsequently, some minor changes were made to
the questionnaires that can be found in the Appendix 3 (English version only).
This research involves four types of technology usage habits: online shopping habit,
mobile service usage habit, mobile payments usage habit, and cell phone usage habit. Each type
Measure Item China (n=202) The U.S. (n=202)
# % # %
Age
<21 13 6.4 3 1.5
21-25 98 48.5 49 24.3
26-30 55 27.2 35 17.3
31-35 23 11.4 51 25.2
>35 13 6.4 64 31.7
Gender Male 132 65.3 78 38.6
Female 70 34.7 124 61.4
Education background
Some college or less 36 17.8 115 56.9
Bachelor 119 58.9 63 31.2
Master 39 19.3 22 10.9
PhD or more 8 4.0 2 1.0
Time to use mobile
payments (Month)
0-6 47 23.3 28 13.9
7-12 39 19.3 48 23.8
13-18 35 17.3 32 15.8
More than 18 81 40.1 94 46.6

172
of technology usage habit was assessed with three items adapted from Setterstrom et al. (2013).
Price discount was assessed with three items adapted from Yeung et al. (2010) and Pavlou and
Fygenson (2006). Users’ intention to continue using mobile payments was assessed with three
items adapted from Venkatesh et al. (2012). Perceived usefulness was measured with three items
adapted from Kim, Mirusmonov, and Lee (2010). Perceived ease of use was measured with three
items adapted from Lin et al. (2011). Disposition to trust was measured with three items adapted
from Zhou (2011). Institution-based trust was assessed with six items adapted from Setterstrom
et al. (2013).
The technology acceptance model and the initial trust building model support the effect
of perceived ease of use, perceived usefulness, disposition to trust, and institution-based trust on
behavioral intention (Lin, Shih, & Sher, 2007; McKnight et al., 1998, 2002). Therefore,
perceived ease of use, perceived usefulness, disposition to trust, and institution-based trust were
used as control variables in this study.
Data Analysis and Results
SmartPLS (Ringle, Wende, & Will, 2005) was used to analyze the data. PLS was chosen
for its ability to handle non-normality in the data and because the goal of this research is to
explain variance in the outcome variable (Gefen & Straub, 2000).
Common Method Bias
All data was collected through a self-report survey. Thus, there is a potential of common
method bias (Podsakoff et al. 2003). This research examined common method bias using three
tests. First, the Harmon’s single factor test was performed. Common method bias may exist if a
single factor emerges from the unrotated factor solution or one general factor accounts for the
majority of the covariance in the variables (Podsakoff et al. 2003). All the construct items were

173
cast into principal components factor analysis. For the China group, the result yielded six factors
with eigenvalues greater than 1.0, which accounted for 75 percent of the total variance. The first
factor captured only 37 percent of the variance in the data. For the U.S. group, the result yielded
six factors with eigenvalues greater than 1.0, which accounted for 81 percent of the total
variance. The first factor captured only 48 percent of the variance in the data. The results indicate
that no factor accounts for the majority of variance.
Second, researchers compared correlations among constructs by following the procedure
established by Pavlou, Liang, and Xue (2007). The results revealed no constructs with
correlations over 0.8.
Third, the unmeasured latent method construct (ULMC) technique (Liang et al. 2007)
was performed. For the China group, the results demonstrate that the average substantively
explained variance of the indicators is 0.785, while the average method-based variance is 0.005.
The ratio of substantive variance to method variance is about 150:1. In addition, the results
revealed that 22 method factor loadings (out of 24) were not significant at a 95 percent
confidence level. For the U.S. group, the results demonstrate that the average substantively
explained variance of the indicators is 0.856, while the average method-based variance is 0.008.
The ratio of substantive variance to method variance is about 110:1. In addition, the results
revealed that 19 method factor loadings (out of 24) were not significant at a 95 percent
confidence level. All results indicate that common method bias is unlikely to be a serious
concern for this research.
Measurement Model
Perceived ease of use and disposition to trust did not have a significant relationship with
consumers’ intention to continue using mobile payments, and are not represented in the results

174
reported below. This research adopted the two-stage analytical procedure (Anderson & Gerbing,
1988; Hair et al., 1998). Confirmative factor analysis was first conducted to assess the
measurement model; then, the structural relationships were examined. As shown in Tables 2 and
3, Cronbach’s alpha ranged from 0.827 to 0.942 for the China group and from 0.860 to 0.955 for
the U.S. group, providing evidence of measure reliability (Cronbach, 1971). Meanwhile,
composite reliability (CR) ranged from 0.897 to 0.963 for the China group and from 0.915 to
0.970 for the U.S. group, indicating valid internal consistency reliability (Chin, 1998). All AVEs
are larger than 0.5, indicating that convergent validity is met (Fornell & Larcker, 1981).
Additionally, as shown in Tables 2 and 3, all squared roots of AVEs are greater than the
correlation shared between the construct and other constructs in the model. As shown in Tables 4
and 5, all items load appropriately on their intended construct. All these results indicate
discriminant validity. Jointly, these findings suggest adequate convergent and discriminant
validity. We also checked the variance inflation factors (VIFs) of all the independent variables.
VIF ranged from 1.455 to 2.330 for the China group and from 1.445 to 4.034 for the U.S. group.
None of the VIFs exceed 5, suggesting that multicollinearity is not a concern (Petter et al. 2007).
Table 2. Measurement Validity for the China Group
R2 CR Cronbach’s AVE OSH MSH MPH CH BI IBT PU
OSH N/A 0.897 0.827 0.745 0.863
MSH N/A 0.963 0.942 0.896 0.453 0.946
MPH 0.309 0.938 0.901 0.836 0.452 0.458 0.914
CH N/A 0.909 0.847 0.770 0.467 0.609 0.456 0.877
BI 0.554 0.904 0.840 0.760 0.434 0.430 0.555 0.411 0.871
IBT N/A 0.937 0.919 0.712 0.277 0.202 0.449 0.185 0.493 0.844
PU N/A 0.931 0.889 0.819 0.404 0.340 0.399 0.472 0.655 0.405 0.905
Note: bold values are the square roots of average variance extracted; OSH=online shopping habit, MSH=mobile service usage habit, MPH=mobile payment usage habit, CH=Cell phone usage habit, BI=behavioral intention, IBT=institution-based trust, and PU=perceived usefulness.

175
Table 3. Measurement Validity for the U.S. Group
R2 CR Cronbach’s AVE OSH MSH MPH CH BI IBT PU
OSH N/A 0.915 0.860 0.782 0.884
MSH N/A 0.970 0.953 0.914 0.391 0.956
MPH 0.438 0.966 0.946 0.903 0.517 0.513 0.950
CH N/A 0.944 0.910 0.849 0.401 0.366 0.494 0.921
BI 0.749 0.958 0.935 0.885 0.433 0.427 0.740 0.360 0.941
IBT N/A 0.964 0.955 0.817 0.371 0.361 0.656 0.317 0.773 0.904
PU N/A 0.933 0.893 0.822 0.427 0.453 0.680 0.455 0.778 0.680 0.907
Note: bold values are the square roots of average variance extracted; OSH=online shopping habit, MSH=mobile service usage habit, MPH=mobile payment usage habit, CH=Cell phone usage habit, BI=behavioral intention, IBT=institution-based trust, and PU=perceived usefulness. Structural Model
We first tested the main effect without considering the moderation effects and then tested
the differences between the China and the U.S. datasets. Then, moderation effects were tested
separately for the China and the U.S. datasets.
Main effect.
The path coefficients and explained variances of the structural model are shown in Figure
2. The PLS model use R2 to assess the explanatory power of a structural model. The model
explained 55.4% of the variance in users’ intention to continue using mobile payments for the
China group (adjusted R2=0.540) and explained 74.9% of the variance in users’ intention to
continue using mobile payments for the U.S. group (adjusted R2=0.741). Therefore, the
predictive power of the model is validated.
The results indicate that online shopping habit (China: b=0.258, p<0.01; the U.S.:
b=0.293, p<0.001), mobile service usage habit (China: b=0.217, p<0.05; the U.S.: b=0.301,
p<0.001), and cell phone usage habit (China: b=0.203, p<0.05; the U.S.: b=0.266, p<0.001) each
have a positive relationship with users’ mobile payment usage habit, supporting H1, H2, and H3.

176
In addition, consumers’ mobile payment usage habit has a positive relationship with their
intention to continue using mobile payments (China: b=0.290, p<0.001; the U.S.: b=0.262,
p<0.001). Hence, H4 is supported. Two control variables, institution-based trust (China:
b=0.172, p<0.01; the U.S.: b=0.360, p<0.001) and perceived usefulness (China: b=0.470,
p<0.001; the U.S.: b=0.355, p<0.001) each have a positive relationship with users’ intention to
continue using mobile payments.
Table 4. Cross Loading for the China Group
OSH MSH MPH CH BI IBT PU
OSH1 0.883 0.351 0.394 0.389 0.343 0.254 0.326
OSH2 0.919 0.405 0.423 0.414 0.384 0.217 0.328
OSH3 0.782 0.423 0.349 0.410 0.402 0.250 0.402
MSH1 0.450 0.946 0.447 0.585 0.424 0.201 0.337
MSH2 0.426 0.970 0.450 0.554 0.414 0.163 0.329
MSH3 0.409 0.923 0.402 0.593 0.380 0.212 0.297
MPH1 0.455 0.385 0.917 0.408 0.501 0.396 0.378
MPH2 0.443 0.410 0.944 0.383 0.539 0.414 0.386
MPH3 0.340 0.462 0.879 0.462 0.481 0.420 0.330
CH1 0.438 0.551 0.460 0.920 0.395 0.232 0.445
CH2 0.441 0.564 0.383 0.936 0.363 0.161 0.457
CH3 0.343 0.484 0.346 0.767 0.315 0.073 0.330
BI1 0.391 0.485 0.503 0.465 0.875 0.420 0.578
BI2 0.428 0.386 0.521 0.371 0.922 0.419 0.612
BI3 0.310 0.243 0.422 0.229 0.815 0.453 0.520
IBT1 0.259 0.154 0.428 0.168 0.458 0.828 0.328
IBT2 0.121 0.091 0.318 0.053 0.423 0.835 0.303
IBT3 0.201 0.133 0.377 0.156 0.371 0.836 0.365
IBT4 0.220 0.162 0.297 0.079 0.397 0.859 0.341
IBT5 0.268 0.224 0.405 0.209 0.411 0.858 0.372
IBT6 0.324 0.257 0.438 0.268 0.424 0.848 0.344
PU1 0.357 0.360 0.412 0.495 0.616 0.388 0.914
PU2 0.304 0.258 0.302 0.370 0.548 0.338 0.920
PU3 0.428 0.298 0.362 0.409 0.609 0.369 0.881
Note: OSH=online shopping habit, MSH=mobile service usage habit, MPH=mobile payment usage habit, CH=Cell phone usage habit, BI=behavioral intention, IBT=institution-based trust, and PU=perceived usefulness.

177
Table 5. Cross Loading for the U.S. Group
OSH MSH MPH CH BI IBT PU
OSH1 0.910 0.318 0.468 0.351 0.386 0.318 0.389
OSH2 0.897 0.391 0.485 0.386 0.422 0.370 0.366
OSH3 0.844 0.326 0.416 0.323 0.335 0.292 0.381
MSH1 0.400 0.959 0.514 0.342 0.424 0.360 0.467
MSH2 0.384 0.963 0.494 0.365 0.425 0.360 0.467
MSH3 0.335 0.946 0.462 0.341 0.374 0.311 0.359
MPH1 0.537 0.469 0.947 0.501 0.731 0.655 0.685
MPH2 0.483 0.498 0.963 0.458 0.698 0.615 0.622
MPH3 0.452 0.498 0.941 0.446 0.678 0.599 0.629
CH1 0.377 0.299 0.435 0.938 0.313 0.283 0.421
CH2 0.375 0.330 0.457 0.947 0.333 0.286 0.399
CH3 0.355 0.377 0.470 0.877 0.345 0.305 0.437
BI1 0.405 0.389 0.714 0.347 0.956 0.745 0.792
BI2 0.433 0.425 0.717 0.347 0.957 0.742 0.747
BI3 0.382 0.393 0.655 0.320 0.909 0.693 0.650
IBT1 0.340 0.333 0.566 0.332 0.706 0.882 0.632
IBT2 0.327 0.305 0.592 0.281 0.660 0.924 0.575
IBT3 0.340 0.303 0.607 0.250 0.696 0.942 0.606
IBT4 0.371 0.324 0.587 0.228 0.705 0.911 0.600
IBT5 0.313 0.323 0.585 0.258 0.679 0.835 0.639
IBT6 0.320 0.361 0.619 0.362 0.740 0.924 0.629
PU1 0.347 0.394 0.597 0.447 0.636 0.553 0.898
PU2 0.432 0.409 0.636 0.411 0.673 0.596 0.937
PU3 0.380 0.424 0.614 0.386 0.788 0.683 0.885
Note: OSH=online shopping habit, MSH=mobile service usage habit, MPH=mobile payment usage habit, CH=Cell phone usage habit, BI=behavioral intention, IBT=institution-based trust, and PU=perceived usefulness.

178
Note: upper coefficients are for the China group, and lower coefficients are for the U.S. group; *p<0.05, **p<0.01, ***p<0.001; IBT=institution-based trust, and PU=perceived usefulness.
Figure 2. Structural Model (Main Effect)
Cross-culture comparison.
In the structural model, the path coefficients vary across the China and the U.S. groups,
promoting a multi-group analysis with PLS to test whether these differences are significant
(Chin, 2000; Keil et al., 2000). As shown in Table 6, only the link between institution-based trust
and intention to continue using mobile payments is different across the two groups.
Table 6. Result of Parametric Multi-Group Analysis for Users of China and the U.S.
Path b:China b:the U.S. Equal variance
P (one tail) Different variance
P (one tail)
H1: OSH -> MPH 0.258* 0.293* 0.386 0.386
H2: MSH -> MPH 0.217* 0.301* 0.221 0.222
H3: CH -> MPH 0.203* 0.266* 0.277 0.278
H4: MPH -> BI 0.290* 0.262* 0.368 0.368
Control: PU -> BI 0.470* 0.355* 0.074 0.075
Control: IBT -> BI 0.172* 0.360* 0.010 0.010
Note: Bolded indicates differences between groups; *are significant path coefficients; OSH=online shopping habit, MSH=mobile service usage habit, MPH=mobile payment usage habit, CH=Cell phone usage habit, BI=behavioral intention, IBT=institution-based trust, and PU=perceived usefulness.
0.470*** 0.355***
0.172** 0.360***
R2=0.309 R2=0.438 R2=0.554
R2=0.749
0.258** 0.293***
0.203* 0.266***
0.217* 0.301*** 0.290***
0.262*** Mobile Payment Usage Habit
Behavioral Intention
Mobile Service Usage Habit
Online Shopping Habit
Cell phone Usage Habit
IBT PU

179
Moderation of price discount for the China group.
To test our hypotheses pertaining to the moderating effects, we conducted a multi-group
analysis with a median split to separate each dataset according to price discount (Tsai & Bagozzi,
2014). We built separate structural models for the high and the low price discount groups (Figure
3) and performed a multi group analysis to identify any difference in the coefficients of the
hypothesized paths as shown in Table 7. Three path coefficients are different across the two
groups: mobile service usage habit to mobile payment usage habit, cell phone usage habit to
mobile payment usage habit, and institution-based trust to behavioral intention.
Note: upper coefficients are for high price discount, and lower coefficients are for low price
discount; *p<0.05, **p<0.01, ***p<0.001, n.s.=not significant; IBT=institution-based trust, and PU=perceived usefulness.
Figure 3. Structural Model (China)
Moderation of price discount for the U.S. group.
To test our hypotheses pertaining to the moderating effects, we conducted multi-group
analyses with a median split to separate the groups according to price discount (Tsai & Bagozzi,
2014). We built separate structural models for the high and the low price discount groups (Figure
4) and performed a multi group analysis to identify any difference in the coefficients of the
0.438*** 0.509***
0.217** 0.091n.s.
R2=0.244 R2=0.382
R2=0.438 R2=0.584
0.322* 0.244*
0.171 n.s. 0.251*
0.107 n.s. 0.249* 0.264***
0.310*** Mobile Payment Usage Habit
Behavioral Intention
Mobile Service Usage Habit
Online Shopping Habit
Cell phone Usage Habit
IBT PU

180
hypothesized paths as shown in Table 8. Two path coefficients are different across the two
groups: online shopping habit to mobile payment usage habit and cell phone usage habit to
mobile payment usage habit.
Table 7. Comparison of the Low and the High Price Discount Groups for China
Path b: High b: Low Equal variance
P (one tail) Different variance
P (one tail)
H1: OSH -> MPH 0.322* 0.244* 0.330 0.330
H2: MSH -> MPH 0.107 0.249* 0.194 0.195
H3: CH -> MPH 0.171 0.251* 0.312 0.313
H4: MPH -> BI 0.264* 0.310* 0.350 0.350
Control: PU -> BI 0.438* 0.509* 0.258 0.259
Control: IBT -> BI 0.217* 0.091 0.128 0.129
Note: Note: Bolded indicates statistically differences between groups; italic indicates differences because one is significant and the other is not; *are significant path coefficients; OSH=online shopping habit, MSH=mobile service usage habit, MPH=mobile payment usage habit, CH=Cell phone usage habit, BI=behavioral intention, IBT=institution-based trust, and PU=perceived usefulness.
Note: upper coefficients are for high price discount, and lower coefficients are for low price
discount; *p<0.05, **p<0.01, ***p<0.001, n.s.=not significant; IBT=institution-based trust, and PU=perceived usefulness.
Figure 4. Structural Model (the U.S.)
0.374*** 0.333***
0.281*** 0.407***
R2=0.458 R2=0.415 R2=0.683
R2=0.766
0.371** 0.224 n.s.
0.143 n.s. 0.335***
0.319** 0.298*** 0.312***
0.238** Mobile Payment Usage Habit
Behavioral Intention
Mobile Service Usage Habit
Online Shopping Habit
Cell phone Usage Habit
IBT PU

181
Table 8. Comparison of the Low and the High Price Discount Groups for the U.S.
Path b: High b: Low Equal variance
P (one tail) Different variance
P (one tail)
H1: OSH -> MPH 0.371* 0.224 0.188 0.189
H2: MSH -> MPH 0.319* 0.298* 0.442 0.442
H3: CH -> MPH 0.143 0.335* 0.066 0.067
H4: MPH -> BI 0.312* 0.238* 0.278 0.279
Control: PU -> BI 0.374* 0.333* 0.361 0.362
Control: IBT -> BI 0.281* 0.407* 0.133 0.134
Note: Bolded indicates differences between groups; *are significant path coefficients; OSH=online shopping habit, MSH=mobile service usage habit, MPH=mobile payment usage habit, CH=Cell phone usage habit, BI=behavioral intention, IBT=institution-based trust, and PU=perceived usefulness.
Discussion
Key Findings
Overall, four out of five hypotheses are fully supported, and the moderation hypothesis is
mixed and partially supported (see Table 9). The results of our research provide insight into the
effect of consumers’ technology usage habits and price discount on their intention to continue
using mobile payments.
Table 9. Summary of Hypotheses Tests
Hypotheses China The U.S.
H1. Online Shopping Habit Mobile Payment Usage Habit Supported Supported
H2. Mobile Service Usage Habit Mobile Payment Usage Habit Supported Supported
H3. Cell phone Usage Habit Mobile Payment Usage Habit Supported Supported
H4: Mobile Payment Usage Habit Behavioral Intention Supported Supported
H5a. Price discount moderates Online Shopping Habit Mobile Payment Usage Habit
Not Supported Supported
H5b. Price discount moderates Mobile Service Usage Habit Mobile Payment Usage Habit
Support the Reverse Hypothesis
Not Supported
H5c. Price discount moderates Cell phone Usage Habit Mobile Payment Usage Habit
Support the Reverse Hypothesis
Support the Reverse Hypothesis
Control: Perceived Usefulness Behavioral Intention Supported Supported
Control: Institution-Based Trust Behavioral Intention Supported Supported

182
Results indicate that users’ mobile payment usage habit has a positive relationship with
their intention to continue using mobile payments. Those users who have formed the habit to use
mobile payments will be more likely to continue using mobile payments in the future. This
finding is consistent with the model of UATUT2 (Venkatesh et al., 2012), which suggests that
consumers’ habit will directly affect their behavioral intention in the future.
This research distinguishes three predictors of mobile payment usage habit: online
shopping habit, mobile service usage habit, and cell phone usage habit. Online shopping, mobile
services, mobile payments, and cell phone belong to the mobile ecosystem (Adomavicius et al.,
2008a). These innovations are mutually dependent, forming an ecology (Adomavicius et al.,
2007; Swanson, 1994). The IT ecosystem perspective posits that consumers’ past usage of
different technologies will enhance or undermine their potential usage of similar or new
technologies (Haskell, 2001). According to the results, users’ online shopping habit, mobile
service usage habit, and cellphone usage habit are positively related to their mobile payment
usage habit. Those who frequently shop online, use mobile services, and use cellphones are more
likely to use mobile payments habitually than those who perform these behaviors less frequently.
We also find a difference between American and Chinese users. The results indicate that
American users’ institution-based trust, one of the control variables, has a stronger positive
influence than Chinese users’ institution-based trust on their intention to continue using mobile
payments. One possible reason is that Chinese consumers have a higher level of uncertainty
avoidance than American consumers (Singh et al., 2005). The higher the level of uncertainty
avoidance, the lower the effect of trust on behavioral intention (Yoon, 2009). Thus, the
relationship between trust and behavioral intention of Chinese consumers is weaker than that of
American consumers.

183
Our findings regarding the effect of price discount on consumers’ transference from
online shopping habit, mobile service usage habit, and cell phone usage habit to mobile payment
usage habit is interesting. For the U.S. group, price discount positively moderates the
relationship between online shopping habit and mobile payment usage habit, supporting H5a.
This means that price discount will strengthen the effect of online shopping habit on mobile
payment usage habit. One possible reason is that consumers perform learning transference to
pursue price equity in their transactions (Noe & Schmitt, 1986). The payment stage is necessary
to finish online shopping, and consumers may enjoy the price discount that is available just
because mobile payments are used. Thus, price discount will motivate consumers to transfer their
online shopping habit to mobile payment usage habit to enjoy the price discount and achieve
price equity. Although H5a is not supported in the China group, the coefficient of the path
between online shopping habit and mobile payment usage habit for the high price discount group
is larger than that of low price discount group as shown in Table 7.
Moreover, for the China group, price discount negatively moderates the relationship
between mobile service usage habit and mobile payment usage habit and price discount
negatively moderates the relationship between cell phone usage habit and mobile payment usage
habit in both the China and the U.S. groups, both of which are opposite to what was expected.
Apparently, price discount may not always entice consumers, especially those in China, to
engage with mobile payments. A similar conclusion was found by Deci et al. (1999) and Lepper
and Greene (1978), who posited that extrinsic motivators such as price discount may be
temporarily effective, but will undermine future motivation and performance. Kontoghiorghes
(2001) also found that extrinsic motivation such as pay has a negative or weak association with
transfer of learning. Thus, practitioners do not need to provide consumers with a high level of

184
price discount to attract consumers to continue using mobile payments if they have formed a
strong habit of using cell phone and mobile services (other than mobile payments).
Limitations and Future Research
As with all research, there are some limitations that should be considered when
interpreting the results of this research. First, data was collected by using a self-report survey.
Hence, there is a potential for common method biases (Podsakoff et al., 2003). However,
common method bias is not a significant problem in this research. Second, a mobile ecosystem is
a complex system with many segments (Basole, 2009). Cell phones, mobile payments, mobile
services (other than mobile payments), and online shopping are just some of technologies in the
mobile ecosystem. Future research is needed to examine the interrelationships among
technologies in the mobile ecosystem. Third, non-monetary promotions such as free gifts are
becoming more important (Palazon & Delgado-Ballester, 2009). However, we explore only the
effect of price discount on users’ intention to continue using mobile payments. Future research is
needed to explore the effects of non-monetary promotions on behavioral intention toward mobile
payments.
Implication for Theory
This research highlights the role of technology usage habits and price discount in
affecting consumers’ intention to continue using mobile payments, contributing to IT acceptance
research.
This research explores the post adoption of mobile payments from the perspective of an
IT ecosystem and transfer of learning theories. IT innovations are not independent but are
interrelated (Swanson, 1994). Online shopping, cell phones, mobile payments, and mobile
services are interrelated components of mobile ecosystems. In this research, we discuss the

185
interrelationships among different types of technology usage habits, and found that consumers’
online shopping habit, mobile service usage habit, and cell phone usage habit each have an
indirect relationship with intention to continue using mobile payments through mobile payment
usage habit. This research also validates the reasonability of using transfer of learning theories
and the IT ecosystem perspective as background theories to explain the effect of different types
of technology usage habits on consumers’ behavioral intention. Thus, this study serves as a
response to the criticism of Limayem et al. (2007) that there is a lack of theory bases to discuss
the effect of habit on consumers’ behavior intention.
The research also contributes to research on technology usage habit. Habit has attracted
academics’ attention to explain human behaviors (Polites & Karahanna, 2013; Venkatesh et al.,
2012). This research distinguishes three predictors of consumers’ mobile payment usage habit:
online shopping habit, mobile service usage habit, and cell phone usage habit. Results indicate
that consumers’ online shopping habit, mobile service usage habit, and cell phone usage habit
each have a positive relationship with their mobile payment usage habit. These findings are
consistent with the IT ecosystem perspective (Swanson, 1994) and transfer of learning theories
(Holton et al., 2000, 2007).
This research sheds light on how to find the most loyal mobile payment users and how to
retain current users. Results indicate that loyal mobile payment users have a high level of online
shopping habit, mobile service usage habit, and cell phone usage habit. Results also indicate that
mobile payment usage habit and perceived usefulness each have a direct impact on consumers’
intention to continue using mobile payments. Thus, these two factors matter in retaining current
mobile payments users.

186
Our research also contributes to research on the effect of price discount on consumers’
transfer of learning and intention to continue using mobile payments. According to the results,
price discount positively moderates the relationship between American users’ online shopping
habit and mobile payment usage habit. In addition, price discount negatively moderates the
relationship between Chinese users’ mobile service usage habit and mobile payment usage habit.
Price discount also negatively moderates the relationship between consumers’ cell phone usage
habit and mobile payment usage habit. Results indicate that price discount has a mixed effect on
the transfer of learning. More research are needed to clarify the effect of price discount on the
adoption of individual innovations, especially innovations related to financial services.
Implication for Practice
Practical implications for industry can be drawn from these findings. Based on the
conclusions of this study, we can distinguish current users who are more likely to continue using
mobile payments. Results demonstrate that consumers’ who frequently shop online, use mobile
services, and use cell phones are more likely to continue using mobile payments. Practitioners
can observe consumers’ technology usage habits by analyzing information that consumers
disclose in social media. Then, practitioners can distinguish loyal users who are more likely to
continue using mobile payments. Thereafter, practitioners can send user-specific advertising
messages to consumers’ wireless devices.
In addition, perceived usefulness influences consumers’ intention to continue using
mobile payments. Thus, practitioners should highlight the usefulness of mobile payments in their
marketing activities such as advertising. They should also pay attention to the information
quality of their user interfaces to encourage consumers to realize the usefulness of their mobile
payment services. Meanwhile, as one critical driver for mobile commerce success (Yang et al.,

187
2012), mobile payments will positively affect economic development. Governments should
cooperate with mobile payment service providers to boost the safe and robust development of the
mobile payment industry, taking advantage of institution-based trust.
Consumers are familiar with online shopping, mobile services, and cell phones.
Practitioners should encourage consumers to develop a mobile payment usage habit. The
identical element model posits that similarity between learning and transfer situations supports
consumers’ ability to learn in new situations (Lobato, 2006). Thus, practitioners should cue
consumers to the similarities and connections between mobile payment services and other well-
accepted technologies such as online shopping, mobile services other than mobile payments, and
cell phones.
Price discount is another factor that affects transfer of learning. However, practitioners
should use it carefully because its effect on consumers’ post adoption of mobile payments is
complex. Past literature also supports our conclusions. For example, Dodds et al. (1991) posited
that price discount has a negative effect on perceived quality, but a positive effect on perceived
value and willingness to buy. In this research, we find that price discount positively moderates
the relationship between online shopping habit and mobile payment usage habit, particularly for
American users. Thus, marketers should provide a price discount for those who shop online
frequently to encourage them to continue using mobile payments. However, marketers do not
need to provide a price discount for those who use mobile services and cell phone frequently
because it may undermine the effect of mobile service and cell phone habits on use of mobile
payments. Correspondingly, marketers should consider providing a price discount for those who
use mobile services and cell phones less frequently to encourage their use of mobile payments.
Generally speaking, marketers should consider how to frame price discount because it will affect

188
consumers’ perception of it (Darke & Chung, 2005). While our research invokes a new research
topic in the post adoption of mobile payments, more research is necessary to explore the optimal
balance between technology usage habits and price discount.
Conclusion
Repeat customers can bring companies five times more profit with lower marketing cost
(Gupta & Kim, 2007). It is of great importance to explore factors that will encourage consumers
to use mobile payments repeatedly. This research serves as an exploration of the impact of price
discount and consumers’ technology usage habits on their intention to continue using mobile
payments. Drawing on the IT ecosystem view and transfer of learning theories, we developed a
model suggesting that consumers’ online shopping habit, mobile service usage habit, and cell
phone usage habit will affect their mobile payment usage habit, which in turn positively impacts
their intention to continue using mobile payments. In addition, price discount moderates the
transference from these three types of technology usage habits to mobile payment usage habit.
This research verifies the vital role of consumers’ technology usage habits in encouraging them
to continue using mobile payments. Results indicate that consumers who shop online and use
mobile services and cell phones frequently are more likely to use mobile payments regularly,
which has a positive relationship with their intention to continue using mobile payments. This
research is the foundation of an understanding of the impact of price discount and consumers’
technology usage habits on their intention to continue using mobile payments, and contributes to
research on the role of individual differences in affecting consumers’ behavioral intention toward
mobile payments.

189
Reference
Aarts, H., & Dijksterhuis, A. (2000). Habits as knowledge structures: Automaticity in goal-
directed behavior. Journal of Personality and Social Psychology, 78 (1), 53-63.
Adomavicius, G., Bockstedt, J. C., & Gupta, A. (2012). Modeling supply-side dynamics of IT
components, products, and infrastructure: An empirical analysis using vector
autoregression. Information Systems Research, 23(2), 397-417.
Adomavicius, G., Bockstedt, J. C., Gupta, A., & Kauffman, R. J. (2008a). Making sense of
technology trends in the information technology landscape: A decision science approach.
MIS Quarterly, 32(4), 779-809.
Adomavicius, G., Bockstedt, J. C., Gupta, A., & Kauffman, R. J. (2007). Technology roles and
paths of influence in an ecosystem model of technology evolution. Information
Technology Management, 8, 185-202.
Adomavicius, G., Bockstedt, J. C., Gupta, A., & Kauffman, R. J. (2008b). Understanding
evolution in technology ecosystems. Communications of the ACM, 51(10), 117-122.
Ajzen, I. (1991). The theory of planned behavior. Organization Behavior & Human Decision
Processes, 50, 179-211.
Anderson, J. C., & Gerbing, D. W. (1988). Structural equation modeling in practice: A review
and recommended two-step approach. Psychological Bulletin, 103(3), 411-423.
Andreev, P., Duane, A., & O’Reilly, P. (2011). Conceptualizing consumer perceptions of
contactless m-payments through smart phones. International Federation for Information
Processing: IFIP WG8.2.
Au, Y. A., & Kauffman, R. J. (2008). The economics of mobile payments: Understanding
stakeholder issues for an emerging financial technology application. Electronic
Commerce Research and Application, 7, 141-164.
Baldwin, T. T., & Ford, J. K. (1988). Transfer of training: A review and directions for future
research. Personnel Psychology, 41, 63-105.
Basole, R. C. (2009). Visualization of interfirm relations in a converging mobile ecosystem.
Journal of Information Technology, 24, 144-159.
Beauchamp, M. B., & Ponder, N. (2010). Perceptions of retail convenience for in-store and
online shoppers. Marketing Management Journal, 20(1), 49-65.
Bransford, J. D., Brown, A. L., & Cocking, R. R. (Eds.). (2000). Learning and transfer. In How
190
people learn: Brain, mind, experience, and school (pp. 31-78). Washington, DC:
National Academy Press.
Burke, L. A., & Hutchins, H. M. (2007). Training transfer: An integrative literature review.
Human Resource Development Review, 6(3), 263-296.
Butterfield, E. C., & Nelson, G. D. (1989). Theory and practice of teaching for transfer.
Educational Technology, Research and Development, 37 (3), 5–38.
Byrnes, J. P. (1996). Cognitive development and learning in instructional contexts. Boston,
MA: Allyn & Bacon.
Chin, W. W. (1998). Issues and opinion on structural equation modeling. MIS Quarterly, 22(1),
7-16.
Chiu, C., Hsu, M., Lai, H., & Chang, C. (2010). Exploring online repeat purchase intentions: The
role of habit. Proceeding of Pacific Asia Conference on Information Systems.
Cronbach, L. J. (1971). Test Validation. In Education measurement, R. L. Thorndike (ed.),
Washington, D.C.: American Council on Education, 443-507.
Dahlberg, T., Mallat, N., Ondrus, J., & Zmijewska, A. (2008). Past, present and future of
mobile payments research: A literature review. Electronic Commerce Research and
Applications, 7(2), 165-181.
Darke, P. R., & Chung, C. M. Y. (2005). Effects of pricing and promotion on consumer
perceptions: It depends on how you frame it. Journal of Retailing, 81(1), 35-47.
Day, S. B., & Goldstone, R. L. (2012). The import of knowledge export: Connecting findings
and theories of transfer of learning. Educational Psychologist, 47(3), 153-176.
Deci, E. L., Koestner, R., & Ryan, R. M. (1999). A meta-analytic review of experiments
examining the effects of extrinsic rewards on intrinsic motivation. Psychological
Bulletin, 125, 627-668.
Deci, E. L., R. J. Vallerand, L. G. Pelletier, and R. M. Ryan. 1991. Motivation and education:
The self-determination perspective. Educational Psychologist, 26, 325–346.
Deng, L., Turner, D. E., Gehling, R., & Prince, B. (2010).User experience, satisfaction, and
continual usage intention of IT. European Journal of Information Systems, 19, 60-75.
Desse, J. (1958). Transfer of training: The psychology of learning. New York: McGraw-Hill.
Dodds, W. B., Monroe, K. B., & Grewal, D. (1991). Effect of price, brand, and store

191
information on buyers’ product evaluations. Journal of Marketing Research, 28, 307-319.
Dowrick, P. W. (2012). Self modelling: Expanding the theories of learning. Psychology in the
Schools, 49(1), 30-41.
Ewing, D., Leberman, D., Mendelsohn, J., & Milner, J. (2012). Understanding consumer
adoption drivers: Insights from the McKinsey global mobile payments consumer survey.
Retrieved from www. csi.mckinsey.com/Home/Knowledge_by_region/Global/~/media/
extranets/consumer%20shopper%20insights/reports/2012/global_mobile_payments.ashx.
Ford, J. K., & Weissbein, D. A. (1997). Transfer of training: An updated review and analysis.
Performance Improvement Quarterly, 10, 22-41.
Fornell, C., & Larcker, D. F. (1981). Evaluating structural equation models with unobservable
variables and measurement error. Journal of Marketing Research, 18(1), 39-50.
Gefen, D., & Straub, D. (2000). The relative importance of perceived ease-of-use in IS
adoption: A study of e-commerce adoption. Journal of Association for Information
Systems, 8(1), 1-30.
Gerpott, T., & Kornmeier, K. (2009). Determinants of customer acceptance of mobile
payment systems. International Journal of Electronic Finance, 3(1), 1–30.
Giovanis, A. N., Binioris, S., & Polychronopoulos, G. (2012). An extension of TAM model with
IDT and security/privacy risk in the adotpion of Internet banking services in Greece.
EuroMed Journal of Business, 7(1), 24-53.
Gupta, S., & Kim, H. W. (2007). The moderating effect of transaction experience on the decision
calculus in online repurchase. International Journal of Electronic Commerce, 12 (1),
127–158.
Haaker, T., de Vos, H., & Bouwman, H. (2006). Mobile service bundles: The example of
navigation services. The proceeding of 19th Bled eConference, Bled, Slovenia, June 5-
7.Hair, J. F., Anderson, R. E., Tatham, R. L., & Black, W. C. (1998). Multivariate Data
Analysis (5th ed.), Englewood Cliffs, NJ: Prentice Hall.
Haskell, R. E. (2001). Transfer of learning: Cognition, instruction and reasoning. San Diego,
CA: Academic Press.
Hoffman, D. L., & Novak, T. P. (1996). Marketing in hypermedia computer-mediated
environments: Conceptual foundations. Journal of Marketing, 60(7), 50-68.
Holton, E. F. (1996). The flawed four-level evaluation model. Human Resource Development

192
Quarterly, 7, 5-21.
Holton, E. F., Bates, R. A., Bookter, A. I., & Yamkovenko, B. V. (2007). Convergent and
divergent validity of the learning transfer system inventory. Human Resource
Development Quarterly, 18(3), 385-419.
Holton, E. F., & Baldwin, T. T. (2000). Making transfer happen: An action perspective on
learning transfer systems. Advances in Developing Human Resources, 8, 1-6.
Holton, E. F., Bates, R. A., & Ruona, W. E. A. (2000). Development of a generalized learning
transfer system inventory. Human Resource Development Quarterly, 11(4), 333-360.
Jiang, L., Yang, Z., & Jun, M. (2013). Measuring consumer perceptions of online shopping
convenience. Journal of Service Management, 24(2), 191-214.
Jolley, B., Mizerski, R., & Olaru, D. (2006). How habit and satisfaction affects player
retention for online gambling. Journal of Business Research, 59, 770-777.
Joo, Y. J., Joung, S., & Son, H. S. (2014). Structural relationships among effective factors on
e-learners’ motivation for skill transfer. Computers in Human Behavior, 32, 335-342.
Juvina, I., Saleem, M., Martin, J. M., Gonzalez, C., & Lebiere, C. (2013). Reciprocal trust
mediates deep transfer of learning between games of strategic interaction. Organizational
Behavior and Human Decision Processes, 120, 206-215.
Kharif, O. (2011). AT&T-Verizon-T Mobile sets $100 million for google fight: Tech.
Bloomberg Business week. Retrieved December 2, 2013 from
http://www.businessweek.com/news/2011-08-29/at-t-verizon-t-mobile-sets-100-million-
for-google-fight-tech.html.
Kim, B., & Han, I. (2009). The role of trust belief and its antecedents in a community-driven
knowledge environment. Journal of the American Society for Information Science and
Technology, 60(5), 1012-1026.
Kim, C., Mirusmonov, M., & Lee, I. (2010). An empirical examination of factors influencing
the intention to use mobile payment. Computers in Human Behavior, 26 (3), 310-322.
Kontoghiorghes, C. (2001). Factors affecting training effectiveness in the context of the
introduction of new technology – A US case study. International Journal of Training and
Development, 5, 248–260.
Lankton, N. K., Wilson, E. V., & Mao, E. (2010). Antecedents and determinants of information
technology habit. Information & Management, 47, 300-307.
193
Lepper, M. R., & Greene, D. (1978). Overjustification research and beyond: Toward a means-
ends analysis of intrinsic and extrinsic motivation. In M. R. Lepper & D. Greene (Eds.),
The hidden costs of reward: New perspectives on the psychology of human motivation
(pp. 109–148). Hillsdale, NJ: Erlbaum.
Liang, H., Saraf, N., Hu, Q., & Xue, Y. (2007). Assimilation of enterprise systems: The effect
of institutional pressures and the mediating role of top management,” MIS Quarterly,
31(1), 59-87.
Lim, D. H., & Johnson, S. D. (2002). Trainee perceptions of factors that influence learning
transfer. International Journal of Training and Development, 6(1), 36-48.
Limayem, M., Hirt, S.G., & Cheung, C. M. K. (2007). How habit limits the predictive power of
intention. MIS Quaterly, 31(4), 705-737.
Lin, C., Shih, H., & Sher, P. J. (2007). Integrating technology readiness into technology
acceptance: The TRAM model. Psychology & Marketing, 24(7), 641-657.
Lin, J., Lu, Y., Wang, B., and Wei, K.K. (2011). The role of inter-channel trust transfer in
establishing mobile commerce trust. Electronic Commerce Research and Applications,
10, 615-625.
Lindbladh, E., & Lyttkens, C. H. (2002). Habit versus choice: The process of decision-making in
health-related behavior. Social Science & Medicine, 55(3), 451–465.
Lobato, J. (2006). Alternative perspectives on the transfer of learning: History, issues, and
challenges for future research. Journal of the Learning Sciences, 15(4), 431-449.
Lu, Y., Yang, S., Chau, P. Y. K., & Cao, Y. (2011). Dynamics between the trust transfer process
and intention to use mobile payment services: A cross-environment perspective.
Information & Management, 48, 393-403.
Macaulay, C., & Cree, V. E. (1999). Transfer of learning: Concept and process. Social Work
Education, 18(2), 183-193.
Mallat, N. (2007). Exploring consumer adoption of mobile payments-A qualitative study.
Journal of Strategic Systems, 16(4), 413-432.
McKnight, D. H., Choudhury, V., & Kacmar, C. (2002). Developing and validating trust
measures for e-commerce: an integrative typology. Information Systems Research, 13(3),
334-359.
McKnight, D. H., Cummings, L. L., & Chervany, N. L. (1998). Initial trust formation in new

194
organizational relationships. Academy of Management Review, 23 (3), 473-490. Journal
of Strategic Information Systems, 16, 413-432.
Newell, A., & Simon, H. A. (1972). Human problem solving. Englewood Cliffs, N.J.: Prentice-
Hall.
Noe, R. A., & Schmitt, N. (1986). The influence of trainees’ attitudes on training effectiveness:
Test of a model. Personnel Psychology, 39, 497–523.
Novak, T. P., Hoffman, D. L., Ynng, Y. F. (2000). Measuring the customer experience in online
environments: A structural modeling approach. Marketing Science, 19 (1), 22–42.
Palazon, M., & Delgado-Ballester, E. (2009). Effectiveness of price discounts and premium
promotions. Psychology and marketing, 26(12), 1108-1129.
Pavlou, P. A., & Fygenson, M. (2006) Understanding and predicting electronic commerce
adoption: An extension of the theory of planned behavior. MIS Quarterly, 30 (1), 115-
143.
Pavlou, P. A., Liang, H., & Xue, Y. (2007). Understanding and mitigating uncertainty in online
exchange relationships: A principal-agent perspective. MIS Quarterly, 31(1), 105-136.
Perkins, D. N., & Salomon, G. (1992). Transfer of learning. In T. N., Postlethwaite, and T.,
Husen (Eds.). International encyclopedia of education (2nd ed.). Oxford, UK: Pergamon
Press.
Petter, S., Straub, D., & Rai, A. (2007). Specifying formative constructs in information systems
research. MIS Quarterly, 31(4), 623-656.
Podsakoff, P., MacKenzie, S., Lee, J., & Podsakoff, N. (2003). Common method biases in
behavioral research: A critical review of the literature and recommended remedies.
Journal of Applied Psychology, 88(5), 879-903.
Polites, G. L., & Karahanna, E. (2012). Shackled to the status quo: The inhibiting effects of
incumbent system habit, switching costs, and inertia on new system acceptance. MIS
Quarterly, 36(1), 21-42.
Polites, G. L., & Karahanna, E. (2013). The embeddedness of information systems habits in
organizational and individual level routines: Development and disruption. MIS Quarterly,
37(1), 221-246.
Reichheld, F. F., & Schefter, P. (2000). E-loyalty: Your secret weapon on the Web. Harvard
Business Review, 78 (4), 105–113.

195
Ringle, C. M., Wende, S., & Will, A. (2005). SmartPLS 2.0 M3 (Beta), SmartPLS,
Hamburg, Germany.
Royer, J. M. (1979). Theories of the transfer of learning. Educational Psychologist, 14, 53–69.
Setterstrom, A. J., Pearson, J. M., & Orwig, R. A. (2013). Web-enabled wireless technology: An
exploratory study of adoption and continued use intention. Behavior & Information
Technology, 32(11), 1139-1154.
Shin, D. (2007). User acceptance of mobile Internet: Implication for convergence
technologies. Interacting with Computers, 19(4), 45–59.
Shin, D. (2008). Understanding purchasing behaviors in virtual economy: Consumer behavior
of virtual currency in Web2.0 communities. Interacting with Computers, 20(4), 433–446.
Singh, N., Zhao, H., & Hu, X. (2005). Analyzing the cultural content of web sites: A cross-
national comparison of China, India, Japan, and US. International Marketing Review,
22(2), 129-146.
Swanson, B. E. (1994). Information systems innovation among organizations. Management
Science, 40, 1069–1092.
Tenpay. (2014). Advantages of mobile payments. Retrieved from https://www.tenpay.com/v2/
bank/bank_ydt.shtml?ADTAG=TENPAY_V2.HOME.TUIJIANAPP.KUAIJIE
Thorndike, E. L. (1924). Mental discipline in high school studies. Journal of Educational
Psychology, 15, 83-98.
Thorndike, E. L., & Woodworth, R. S. (1901). The influence of improvement in one mental
function upon the efficiency of other functions. Psychological Review, 8, 247–261.
Tsai, H., & Bagozzi, R. P. (2014). Contribution behavior in virtual communities: Cognitive,
emotional, and social influences. MIS Quarterly, 38(1), 143-163.
Venkatesh, V., Thong, J. Y. L., & Xu, X. (2012). Consumer acceptance and use of information
technology: extending the unified theory of acceptance and use of technology. MIS
Quarterly, 36(1), 157-178.
Warr, P., & Bunce, D. (1995). Trainee characteristics and the outcomes of open learning.
Personnel Psychology, 48, 347-376.
Yang, S., Lu, Y., Gupta, S., Cao, Y., & Zhang, R. (2012). Mobile payment services adoption
across time: An empirical study of the effects of behavioral beliefs, social influence, and
personal traits. Computer in Human Behavior, 28, 129-142.

196
Yeung, R., Yee, W., & Morris, J. (2010). The effects of risk-reducing strategies on consumer
perceived risk and on purchase likelihood. British Food Journal, 112 (3), 306-322.
Yoon, C. (2009). The effects of national culture values on consumer acceptance of e-
commerce: Online shoppers in China. Information & Management, 46, 294-301.
Yorks, L., O’Neil, J., Marsick, V. J., Lamm, S., Kolodny, R., & Nilson, G. (1998). Transfer of
learning from an action reflection learning program. Performance Improvement
Quarterly, 11(1), 59–73.
Zhao, L., Lu, Y., Zhang, L., & Chau, P. Y. K. (2012). Assessing the effects of service quality
and justice on customer satisfaction and the continuance intention of mobile value-added
services: An empirical test of a multidimensional model. Decision Support Systems,
52(3), 645-656.
Zhou, T. (2011). An empirical examination of initial trust in mobile banking. Internet Research,
21(5), 527-540.
Zhou, T. (2014). An empirical examination of initial trust in mobile payment. Wireless
Personal Communication. DOI 10.1007/s11277-013-1596-8.

197
APPENDIX 3: Instrument
Table A. Measurement Items Online Shopping Habit 1. Shopping online has become automatic to me. 2. Shopping online is natural to me. 3. When faced with a particular need, shopping online is an obvious choice to me. Adapted from Setterstrom et al. (2013) Mobile Service Usage Habit 1. Using mobile services other than mobile payments has become automatic to me. 2. Using mobile services other than mobile payments is natural to me. 3. When faced with a particular need, using mobile services other than mobile payments is an obvious choice to me. Adapted from Setterstrom et al. (2013) Cell Phone Usage Habit 1. Using cellphones has become automatic to me. 2. Using cellphones is natural to me. 3. When faced with a particular need, using a cellphone is an obvious choice to me. Adapted from Setterstrom et al. (2013) Mobile Payment Usage Habit 1. Using mobile payments has become automatic to me. 2. Using mobile payments is natural to me. 3. When faced with a particular need, using mobile payments is an obvious choice to me. Adapted from Setterstrom et al. (2013) Price Discount 1. I can save money on purchases if I pay by using mobile payments. 2. I will purchase products at a bargain price if I pay by using mobile payments. 3. I can purchase products with a price reduction if I pay by using mobile payments. Adapted from Yeung et al. (2010) and Pavlou & Fygenson (2006) Intention to continue using 1. I intend to continue using mobile payments in the future. 2. I predict that I will continue to use mobile payments frequently in the future. 3. I will strongly recommend that others use mobile payments. Adapted from Venkatesh et al. (2012) Disposition to Trust 1. It is easy for me to trust an information technology. 2. I tend to trust an information technology, even though I have little knowledge of it. 3. My tendency to trust information technology is high. Adapted from Zhou (2011) Institution-based Trust 1. I believe mobile technology has enough safeguards to make me feel comfortable using it to make mobile payments. 2. I feel assured that legal structures adequately protect me from payment problems with mobile technology. 3. I feel assured that technological structures adequately protect me from payment problems with mobile technology.

198
4. I feel confident that encryption and other technological advances with mobile technology make it safe for me to use mobile payments. 5. In general, the mobile technology provides a robust environment to perform mobile payments. 6. In general, the mobile technology provides a safe environment to perform mobile payments. Adapted from Setterstrom et al. (2013) Perceived Ease of Use 1. Learning to use mobile payments was easy for me. 2. It was easy for me to become skillful at using mobile payments. 3. Overall, I find mobile payments easy to use. Adapted from Lin et al. (2011) Perceived Usefulness 1. Using mobile payments enables me to pay more quickly. 2. Using mobile payments makes it easier for me to conduct transactions. 3. I find mobile payments a useful possibility for making payments. Adopted from Kim et al. (2010)

199
APPENDIX 4:
INFORMATION LETTER for a Research study entitled
“Factors Affecting Consumers’ Behavioral Intentions toward Mobile Payments” You are invited to participate in a research study to help better understand the technology acceptance under individual usage context. The study is being conducted by Mr. Lin Jia, a doctoral student, under the direction of Dr. Dianne Hall, an associate professor, from the Department of Aviation & Supply Chain Management, Auburn University. You were selected as a possible participant because you are currently users or potential users of mobile payment and are age 19 or older.
Your participation is completely voluntary. If you decide to participate in this research study, you will be asked to rate the importance of numerous items about your behavior intention of mobile payment. Your total time commitment will be approximately 10-15 minutes.
There are no discomforts associated with participating in this study. No personal information will be collected, nor do we collect URLs or IP addresses that could be used to discover your identity. If you decide to participate, having read the information above, please click on the link below.
If you change your mind about participating, you can withdraw at any time by simply closing your browser window. Your decision about whether to participate or to stop participating will not jeopardize your future relations with Auburn University, or the Department of Aviation and Supply Chain Management.
Any data obtained in connection with this study will remain anonymous. We will protect your privacy and the data you provide by storing on secured servers. Information collected through your participation may be used to publish in academic journals, and/or present at a professional meetings.
If you have any questions, please contact me by e-mail at [email protected] or my advisor, Dr. Dianne Hall at [email protected].
If you have questions about your rights as a research participant, you may contact the Auburn University Office of Human Subjects Research or the Institutional Review Board by phone 334-844-5966 or e-mail at [email protected] or [email protected].
IF YOU DECIDE TO PARTICIPATE, PLEASE CLICK ON THE LINK BELOW. YOU MAY PRINT A COPY OF THIS LETTER TO KEEP.
Survey Link: https://auburn.qualtrics.com/SE/?SID=SV_e3e3HzebKZD7vJH
Lin Jia 12.12.2013 Investigator Date The Auburn University Institutional Review Board has approved this document for use from November 3, 2013 to November 2, 2016. Protocol #13-376 EX 1311.