Embed Size (px)
Citation preview

How to face the future?
- a model for scenario planning at VLC
Matilda Karlsson
Karin Leander
Examensarbete LIU-IEI-TEK-A--07/00231--SE Institutionen för ekonomisk och industriell utveckling
Logistik

How to face the future?
- a model for scenario planning at VLC
Matilda Karlsson
Karin Leander
Handledare vid Linköpings Universitet: Magnus Berglund Handledare hos Volvo Logistics Corporation: Dan Geyer och Mats Boll
Examensarbete LIU-IEI-TEK-A--07/00231--SE Institutionen för ekonomisk och industriell utveckling
Logistik

Abstract In this report a model for logistics activities at Volvo Logistics Corporation, VLC, in the future has been constructed. The study is part of a project called Vision 2015 & Beyond, which started in the beginning of 2006, and focuses on what changes in the business environment that VLC as a TPL provider faces in the future. Within the scope of this project threats in the business environment as well as internal issues that are considered as concerns for the future are identified. The already identified threats are complemented and investigated by the researchers and further structured into a model in this report. The model shall be used as a tool in scenario planning within VLC. As to guide the practitioners in using the model a manual which describes the construction of the model and how it is going to be used has been set up. The model is adapted to VLC's activities within the automotive industry and their directives have continuously been taken into account, resulting in a model specific for VLC. Theories in scenario planning and modelling has been revised as to construct the model, and as a result of this four types of components has been determined as to constituting in the model. Those components are; targets, scenario agenda, variables and driving forces. The process of identifying the different components was conducted step wisely, starting with the targets. The targets of the model represent what VLC want to focus on in the future, i.e. what is considered as important performance indicators. Transportation costs, Customer satis-faction, Security & Safety, Environment and Market Share have been chosen as the targets in the model. Next the components which VLC have a concern about, and that have an impact on those targets, are identified and decomposed starting with the areas on the scenario agenda and ending with determining the driving forces. The model is built in two dimensions, one external part that represents the business environment, i.e. what VLC can not affect, and the second, the internal part, which represents the organisation itself. Both parts are constructed out of the type of components mentioned earlier and are connected by the targets In each part of the model relations among the components exist, however it is only the most important out of VLC’s perspective that takes part in the final network in the model. The manual explains to the practitioner the concept behind the model and how it should be used. To verify the guidelines in the manual a mini-scenario was constructed. The mini-scenario is a fictitious case, which is thought to resemble those that VLC will use the model for in the future. In the mini-scenario presented in this report a future where the Kyoto Protocol implies transports are set up. The mini-scenario has an impact on a certain number of driving forces in the business environment, and by following the manual areas of recommendations for VLC's behaviour as to face this change will be generated. The result of the study is a kit consisting of a model and an accompanying manual for VLC to use in scenario planning. The researchers have focused on constructing a model that is easy to understand for those that work within VLC, however to be able to use it in a proper way it is necessary to be familiar with VLC’s logistic activities. It is preferable to work in teams when using the model since the model is based on qualitative reasoning. Limits in time and resources has left quantification out of the scope in this report, but the researchers believe that the model could be improved and extended in that direction if it is found desirable in the future. The model is not static, rather the framework that exist today should be complemented in the future when new concerns are discovered, old ones can be disregarded etcetera. The model offers VLC a structured methodology as to consider and respond to changes in the business environment.

Preface It started a rainy summer and ended in the late autumn, our master thesis at VLC in Göteborg. We have enjoyed our time at VLC, tackling an assignment that out of many aspects has been a true challenge for us. We have experienced both ups and downs, and would like to take the opportunity to direct special thanks to those that has been especially supportive during our work at VLC. At first we would like to direct special thanks to our supervisors Mats Boll and Dan Geyer at VLC, with whom we have had endless discussions during the progress and whose patience we are ever grateful for. Special thanks we also would like to give to “our own”, secret phantom at VLC and the chic lady in the candy shop, who both have enlightened our days at Volvo. Further we would like to thank our supervisor, Magnus Berglund, at Linköping University and our opponents, Sofie and Ida, who has given us useful feed-back. And finally we want to thank our families and friends who have been supportive and understanding during this period.
“I’m sending you an S.O.S…..” O.Svensson (2007)
____________________________ ____________________________ Matilda Karlsson Karin Leander
Table of content
1 INTRODUCTION ............................................................................................................. 1 1.1 Background .......................................................................................................................... 2 1.2 Purpose ................................................................................................................................. 2 1.3 Directives .............................................................................................................................. 2 1.4 Methodology approach........................................................................................................ 2
2 PRESENT SITUATION ................................................................................................... 5 2.1 VLC ....................................................................................................................................... 6 2.2 Vision 2015 & Beyond ......................................................................................................... 7
2.2.1 Infrastructure ................................................................................................................................... 7 2.2.2 Supply Chain Development ............................................................................................................ 7 2.2.3 Transport Development................................................................................................................... 8 2.2.4 Customers Business Concept .......................................................................................................... 8 2.2.5 Competence..................................................................................................................................... 9
2.3 Automotive industry ............................................................................................................ 9 3 FRAME OF REFERENCE............................................................................................ 11
3.1 TPL...................................................................................................................................... 12 3.1.1 What do customers want? ............................................................................................................. 12 3.1.2 Branch, market and future ............................................................................................................. 12
3.2 Key performance indicators.............................................................................................. 14 3.3 Modelling ............................................................................................................................ 14
3.3.1 Different types of models .............................................................................................................. 14 3.3.2 Constructing model ....................................................................................................................... 15 3.3.3 Questioning the model .................................................................................................................. 16
3.4 Scenario planning............................................................................................................... 16 3.4.1 Scenario features ........................................................................................................................... 16 3.4.2 Scenario projects’ focus and purpose ............................................................................................ 17 3.4.3 Scenario project process................................................................................................................ 18 3.4.4 TAIDA – a model for scenario planning....................................................................................... 20 3.4.5 Figuring scenarios ......................................................................................................................... 21
3.5 PEST-analysis..................................................................................................................... 22 3.6 Porter’s five forces of competition.................................................................................... 23
4 ASSIGNMENT DISCUSSION....................................................................................... 25 4.1 Assignment definition ........................................................................................................ 26 4.2 Scope ................................................................................................................................... 27 4.3 System approach ................................................................................................................ 28 4.4 The studied system............................................................................................................. 28
4.4.1 Studied system - Create model...................................................................................................... 29 4.4.2 Studied system - Mini-scenario case ............................................................................................. 30
5 RESEARCH DESIGN .................................................................................................... 31 5.1 Planning stage..................................................................................................................... 32
5.1.1 Developing the problem................................................................................................................ 33 5.1.2 Choice of study direction .............................................................................................................. 33 5.1.3 Choice of study approach.............................................................................................................. 34 5.1.4 Establishment of Assignment decomposition................................................................................ 35

5.1.5 Sources of error in the Planning stage........................................................................................... 35 5.2 Performing stage ................................................................................................................ 36
5.2.1 Data collection .............................................................................................................................. 36 5.2.2 Sources of error in the Performing stage....................................................................................... 39
5.3 Completion stage................................................................................................................ 40 5.3.1 Model completion and report writing............................................................................................ 40 5.3.2 Sources of error in the Completion stage ...................................................................................... 40
5.4 Quality of research design................................................................................................. 41 6 ASSIGNMENT DECOMPOSITION Create Model ...................................................... 45
6.1 Steps in Create model ........................................................................................................ 46 6.2 VLC Today ......................................................................................................................... 46 6.3 Identify targets ................................................................................................................... 47 6.4 Set up external and internal scenario agenda.................................................................. 48 6.5 Variables and driving forces ............................................................................................. 48 6.6 Modelling ............................................................................................................................ 49 6.7 Questioning the model ....................................................................................................... 50
7 CREATE MODEL........................................................................................................... 53 7.1 Identification of targets ..................................................................................................... 54 7.2 The external scenario agenda............................................................................................ 55 7.3 External variables and driving forces .............................................................................. 57
7.3.1 Why does OEMs behave as they do? ............................................................................................ 58 7.3.2 Which legislations have an impact on VLC? ................................................................................ 61 7.3.3 What creates congestions? ............................................................................................................ 63 7.3.4 What changes the fuel policy?....................................................................................................... 66 7.3.5 What does the external competition look like? ............................................................................. 67
7.4 External modelling............................................................................................................. 68 7.4.1 Connections in the network........................................................................................................... 69 7.4.2 Connections to targets ................................................................................................................... 74
7.5 The internal scenario agenda ............................................................................................ 77 7.6 Internal variables and driving forces ............................................................................... 78
7.6.1 What affect VLC’s presence?........................................................................................................ 78 7.6.2 What affect VLC’s competence? .................................................................................................. 78 7.6.3 What affect VLC’s business concept?........................................................................................... 80 7.6.4 What affect VLC’s competitiveness?............................................................................................ 81
7.7 Internal modelling.............................................................................................................. 83 7.7.1 Connections in the network........................................................................................................... 83 7.7.2 Connections to targets ................................................................................................................... 87
8 QUESTIONING THE MODEL ..................................................................................... 91 8.1 Focus and purpose with model ......................................................................................... 92 8.2 Porter’s five forces identified in the model ...................................................................... 92 8.3 PEST factors identified in the model................................................................................ 93 8.4 Fulfilment of criteria.......................................................................................................... 94
9 ASSIGNMENT DECOMPOSITION Create manual.................................................... 97 9.1 Create manual .................................................................................................................... 98

10 CREATE MANUAL.................................................................................................... 99 10.1 Description of model ........................................................................................................ 100 10.2 Manual .............................................................................................................................. 101
11 ASSIGNMENT DECOMPOSITION Mini-scenario case..................................... 103 11.1 Steps in Mini-scenario case ............................................................................................. 104 11.2 Construct mini-scenario .................................................................................................. 104 11.3 Mini-scenario in model .................................................................................................... 105 11.4 Questioning the manual................................................................................................... 105
12 MINI-SCENARIO CASE.......................................................................................... 107 12.1 Mini-scenario.................................................................................................................... 108 12.2 Mini-scenario in model .................................................................................................... 109 12.3 Questioning the manual................................................................................................... 109
13 CONCLUSIONS........................................................................................................ 111 13.1 Result................................................................................................................................. 112 13.2 Discussion.......................................................................................................................... 115 13.3 Recommendations for future work ................................................................................ 116
14 REFERENCES ......................................................................................................... 117
Definitions ............................................................................................................................. 124
Appendix 1 ............................................................................................................................. 125

Table of figures FIGURE 2-1 – VLC’S ORGANISATION.. .................................................................................................................... 6 FIGURE 2-2– SHARES IN WORLD TRADE IN AUTOMOTIVE PRODUCTS...................................................................... 10 FIGURE 3-1 – FREQUENCY OF TPL SERVICES CATEGORIES. ................................................................................... 13 FIGURE 3-2 – METHOD FOR CONSTRUCTING A MODEL. .......................................................................................... 15 FIGURE 3-3 – DIFFERENT PURPOSE AND FOCUS WITH SCENARIO PROJECTS ........................................................... 18 FIGURE 3-4 – TRILEMMA TRIANGELS..................................................................................................................... 21 FIGURE 4-1 – CONCEPT FOR MODEL....................................................................................................................... 26 FIGURE 4-2 – DECOMPOSITION OF ASSIGNMENT INTO PARTS. ................................................................................ 27 FIGURE 4-3 – THE TOTAL STUDIED SYSTEM. .......................................................................................................... 29 FIGURE 4-4 – THE STUDIED SYSTEM FOR PART I..................................................................................................... 29 FIGURE 4-5 – THE STUDIED SYSTEM FOR PART III. ................................................................................................. 30 FIGURE 5-1 – THE U-MODEL .................................................................................................................................. 32 FIGURE 6-1 – PARTITION OF PART ONE INTO STEPS. ............................................................................................... 46 FIGURE 7-1 – THE IDENTIFIED TARGETS................................................................................................................. 55 FIGURE 7-2 – THE EXTERNAL SCENARIO AGENDA.................................................................................................. 56 FIGURE 7-3 – CONCEPT FOR DECOMPOSITION FROM SCENARIO AGENDA TO DRIVING FORCES. .............................. 57 FIGURE 7-4 – WHAT AFFECT OEMS’ BEHAVIOUR? ................................................................................................ 60 FIGURE 7-5 – WHAT AFFECT LEGISLATIONS?......................................................................................................... 63 FIGURE 7-6 – WHAT AFFECT CONGESTIONS? ......................................................................................................... 65 FIGURE 7-7 – WHAT AFFECT THE FUEL POLICY? .................................................................................................... 66 FIGURE 7-8 – WHAT AFFECT EXTERNAL COMPETITION. ........................................................................................ 68 FIGURE 7-9 – THE EXTERNAL SCENARIO AGENDA, VARIABLES AND DRIVING FORCES............................................ 73 FIGURE 7-10 – THE LEFT (EXTERNAL) SIDE OF THE MODEL. ................................................................................... 76 FIGURE 7-11 – THE INTERNAL SCENARIO AGENDA................................................................................................. 77 FIGURE 7-12 – WHAT AFFECT VLC’S PRESENCE?.................................................................................................. 78 FIGURE 7-13 – WHAT AFFECT VLC’S COMPETENCE? ............................................................................................ 79 FIGURE 7-14 – WHAT AFFECT VLC’S BUSINESS CONCEPT? ................................................................................... 81 FIGURE 7-15 – WHAT AFFECT VLC’S COMPETITIVENESS?..................................................................................... 83 FIGURE 7-16 – THE INTERNAL SCENARIO AGENDA, VARIABLES AND DRIVING FORCES. ......................................... 86 FIGURE 7-17 – THE RIGHT (INTERNAL) SIDE OF THE MODEL................................................................................... 89 FIGUR 7-18 - THE ENTIRE MODEL........................................................................................................................... 90 FIGURE 11-1 – PARTITION OF PART THREE INTO STEPS......................................................................................... 104 FIGURE 13-1 – THE ENTIRE MODEL. ..................................................................................................................... 114

Table of tables TABLE 2-1 – EXPORTS OF AUTOMOTIVE PRODUCTS IN 2004. ................................................................................... 9 TABLE 3-1 – BIGGEST BUYERS OF TPL SERVICES. ................................................................................................. 13 TABLE 8-1 – PRESENTATION OF PEST-ANALYSIS. ................................................................................................. 93 TABLE 12-1 – DRIVING FORCES AFFECTED IN THE MINI-SCENARIO. ..................................................................... 109
-1-
1 INTRODUCTION
In this chapter the background and the purpose of the assignment in this report are presented. Moreover theories considering methodology approaches are given as to motivate and present the choice of approach used for this study.
INTRODUCTION
-2-
1.1 Background Volvo Logistics Corporation, further on in this report referred to as VLC, is a part of the Volvo Group. VLC is a third party logistics, TPL, provider which sells transportation services to companies within the Volvo Group as well as to external companies. The customers are mostly operating within the automotive industry, and the largest customer outside the Volvo Group is Ford. VLC possess assets in the form of emballage and terminals, but in this report they are considered as an asset-free company since they do not own any transport equipment. They contract different transport companies to offer suitable logistics solutions to their customers. Every service offered is customized and all transport modes can be part of the logistic solution. Apart from the operational services VLC also provide guidance in the customer’s logistics management and development. VLC’s activities are divided into three processes; Emballage, Inbound and Outbound. The processes refer to their work with emballage and transports, from supplier to producer as well as from producer to end-customer. The transport market is continuously under great pressure, with increasing demands from the customers (Carter & Maloni, 2006) and with a competition between the actors on the market reaching new levels. As Davidson (2005) wrote: “What works today may not work tomorrow.” Just as in other businesses it exist a desire to predict the activities on the market in the future. By constructing and working with realistic scenarios for the future an organisation can be better prepared for dealing with what to come next. Transportation is today often outsourced to TPL providers as VLC. Through outsourcing a company can attain economies of scale and only focus on their core values. VLC as an actor on the competitive TPL market (Carter & Maloni, 2006) is confronting a challenge, eager to ensure that they are striving towards a bright future at the transport market. They have started a project called Vision 2015 & Beyond as to face this challenge. As a step in VLC’s work to become the first choice for managing transports in the future they are interested in developing a model that in certain aspects will indicate the impact on their activities in a visualized future.
1.2 Purpose The purpose of this report is to construct a model that indicates how a certain set of variables affect VLC’s performance in the future.
1.3 Directives VLC states that the model has to be easy to understand and user-friendly. They also want the model to be adapted to VLC and their business environment. Additional directives will be presented in the report as they occur.
1.4 Methodology approach According to Arbnor & Bjerke (1994) there are three different methodology approaches to use when doing a study within the topics of business economics and management; the Analytical approach, the System approach and the Actor approach. Depending on the purpose of a study and which explanations and results that are sought for, the different approaches are more or less suitable. Since the three approaches are very different from one another the choice of methodology approach will have a great affect on the procedure of the study. Because of that
INTRODUCTION
-3-
it is important to choose methodology approach for a study in the beginning. (Arbnor & Bjerke, 1994). In the analytical approach the reality is seen as a whole constructed of different fractions and where the whole is the exact sum of those fractions. Users of this approach are striving for explaining the reality as objective and complete as possible. (Björklund & Paulsson, 2003). The prerequisite for the procedure is to use existing theories and techniques to verify or falsify different posed hypotheses (Arbnor & Bjerke, 1994). Also in the system approach the reality is seen as a whole constructed of different fractions, but here they are not equal to the whole as in the previous approach (Björklund & Paulsson, 2003). The researcher first defines the system and its components, which will then be examined (Arbnor & Bjerke, 1994). By studying the components and their connections with each other, underlying factors to the system’s behaviour are discovered (Björklund & Paulsson, 2003). For the study to be correct, according to the system approach, existing theories about the system are to be used, but differently from the analytical approach those theories can not be used as generally. Both the analytical and the system approach assume the reality to be objective, but in the actor approach the reality is a social construction. Therefore the description in such a study is no longer objective but depends on the researchers’ experiences and actions. How people can interpret given original data differently need to be studied when following the actor approach. The results of such a study are typical cases and models for interpreting specific situations. (Arbnor & Bjerke, 1994). In this research it is not suitable to use the analytical approach because when constructing a model for predicting the future logistics it is not likely to be able to use existing theories to verify or falsify certain hypotheses. There are many components that affect the result and it is not possible to say that the performance of those components can be summarized and equal to the behaviour of the reality being studied. Nor is it appropriate to use the actor approach since the intention is to do the research as objectively as possible to reach a result with a high reliability. The system approach is found to be the most suitable methodology approach to use for the study presented in this report. It is appropriate to consider our studied system as to be constructed of a certain number of components that affect and interact with one another. Some fractions of it can probably be generalized but the entirety will be adapted to fit VLC’s distribution structure. Certain aspects are left outside the system, in its environment, affecting the system but which themselves can not be affected by the activities of the system or its components.

-4-

-5-
2 PRESENT SITUATION
In this chapter VLC’s organisation, activities, customers and business relations are briefly presented. In addition work done by VLC within areas of interest for this report, i.e. within the project Vision 2015 & Beyond, and the automotive market is introduced.
PRESENT SITUATION
-6-
Global Support Functions
Global Business Functions Embal-
lage
In-bound
Out-bound
CEO
Global Marketing & Sales
Global Logistics
Global Procurement
Global IS/IT
Strategic Planning & Core Values
HR & Communication
Finance, Legal, Risk Management & Global Customs
Deputy CEO
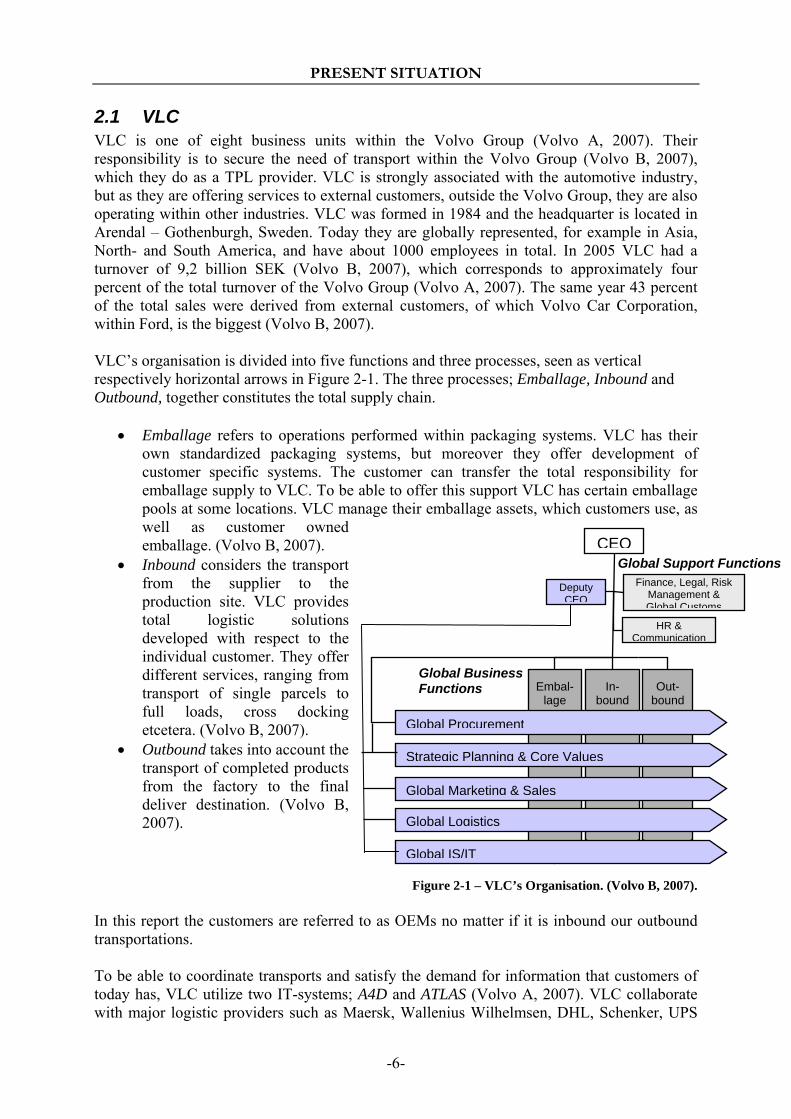
2.1 VLC VLC is one of eight business units within the Volvo Group (Volvo A, 2007). Their responsibility is to secure the need of transport within the Volvo Group (Volvo B, 2007), which they do as a TPL provider. VLC is strongly associated with the automotive industry, but as they are offering services to external customers, outside the Volvo Group, they are also operating within other industries. VLC was formed in 1984 and the headquarter is located in Arendal – Gothenburgh, Sweden. Today they are globally represented, for example in Asia, North- and South America, and have about 1000 employees in total. In 2005 VLC had a turnover of 9,2 billion SEK (Volvo B, 2007), which corresponds to approximately four percent of the total turnover of the Volvo Group (Volvo A, 2007). The same year 43 percent of the total sales were derived from external customers, of which Volvo Car Corporation, within Ford, is the biggest (Volvo B, 2007). VLC’s organisation is divided into five functions and three processes, seen as vertical respectively horizontal arrows in Figure 2-1. The three processes; Emballage, Inbound and Outbound, together constitutes the total supply chain.
• Emballage refers to operations performed within packaging systems. VLC has their own standardized packaging systems, but moreover they offer development of customer specific systems. The customer can transfer the total responsibility for emballage supply to VLC. To be able to offer this support VLC has certain emballage pools at some locations. VLC manage their emballage assets, which customers use, as well as customer owned emballage. (Volvo B, 2007).
• Inbound considers the transport from the supplier to the production site. VLC provides total logistic solutions developed with respect to the individual customer. They offer different services, ranging from transport of single parcels to full loads, cross docking etcetera. (Volvo B, 2007).
• Outbound takes into account the transport of completed products from the factory to the final deliver destination. (Volvo B, 2007).
Figure 2-1 – VLC’s Organisation. (Volvo B, 2007). In this report the customers are referred to as OEMs no matter if it is inbound our outbound transportations. To be able to coordinate transports and satisfy the demand for information that customers of today has, VLC utilize two IT-systems; A4D and ATLAS (Volvo A, 2007). VLC collaborate with major logistic providers such as Maersk, Wallenius Wilhelmsen, DHL, Schenker, UPS

PRESENT SITUATION
-7-
and TNT, hence they can offer their customers transportation by all transport modes (Volvo B, 2007). VLC share the same core values as the rest of the Volvo Group, namely quality, safety and environmental care. With respect to these values VLC is certified within quality, ISO 9001:94, and environment, ISO 14001:96.
2.2 Vision 2015 & Beyond VLC started the project Vision 2015 & Beyond in 2006, which treats questions about the future logistics. Responsible for this project are Dan Geyer, Corporate Outlook Development, and Mats Boll, Project manager, further on in this report also referred to as the supervisors at VLC. As part of their work they have identified parameters that they have found appropriate to examine because of their impact on the logistics in the future. The parameters have been divided into five different groups, namely Infrastructure, Supply Chain Development, Transport Development, Customers Business Concept and Competence. These groups, decomposed into parameters, are presented out of VLC’s perspective in separate documents. At present the content for all of the parameters are not defined, and the states of the docu-ments are therefore varying. The three first groups are treated in a greater extent than the others.
2.2.1 Infrastructure The following parameters are set up within Infrastructure:
• World Trade & Growth • Industrial Structures • Logistic Structures • Region West Sweden • Region Gent • Region Lyon • Region Europe • Between Volvo/VLC area of interests • Regions Global excl Europe
The main focus of this group of parameters is the world trade growth and how different regions, identified as important for the business of VLC, are thought to change in the sense of infrastructure in the future. Lack of capacity in certain ports, on roads etcetera that are to be seen in the future due to augmented transportation and non-sufficient investments to meet this need are brought to the surface in the document. Industrial- and logistic structures are also discussed. Industrial structures focus on the automotive industry and how mergers and locations of producers and markets are thought to change in the future, having an affect on the need of transportation. (Volvo B, 2007).
2.2.2 Supply Chain Development The group Supply Chain Development contains the following parameters:
• Logistic Providers Business • OEMs’ Concepts & Requirements • IS/IT Information Systems • Packaging (Emballage)

PRESENT SITUATION
-8-
• Event Management / Scenario Planning • E-Procurement • Environment • Security
This group of parameters focuses on how logistic providers will have to adapt to be prepared for the increasing demands from customers on the automotive market. This concern both the inbound and outbound processes at VLC and as mentioned VLC refer to their customers as OEMs in both cases. The demand of information is identified as increasing even more in the future in the document considering Supply Chain Development. (Volvo B, 2007).
2.2.3 Transport Development Within the group of Transport Development, the following parameters are set up:
• Transport modes o Rail Europe o Rail North America o Air Freight o On road Europe o On road North America o Barges Europe – Inland Waterways o Short Sea Shipping Europe o Deep Sea Shipping
• Intermodal solutions • Fiscal, Customs • Fuel availability • Capacity
These parameters treat the development within transport modes regionally as well as globally. Development in motor techniques and how processes in terminals etcetera can be improved are discussed here. Intermodal solutions are identified as an efficient transport solution and thus its advantages and prerequisites are discussed within the chapter. (Boll, 2007).
2.2.4 Customers Business Concept Customer Business Concept contains five parameters:
• OEM Logistic Concepts • Logistic Suppliers Concept • Customers Logistic Concepts • Added Values • Sales and Marketing Approach
Within this group of parameters the customers’ location of production and market is discussed. Further their requirements such as leadtime, costs and environmental aspects are presented. In this chapter strategies for gaining a competitive advantage is also discussed, something that is referred to as added value. (Boll, 2007).
PRESENT SITUATION
-9-
2.2.5 Competence The last group of parameters, Competence, implies:
• Competence Demographics • Competence Profiles • Employee Profiles
The parameters within this chapter treat VLC's competence and how it is distributed in the world. The competence profile and skills that the personnel possess are also studied here. (Boll, 2007).
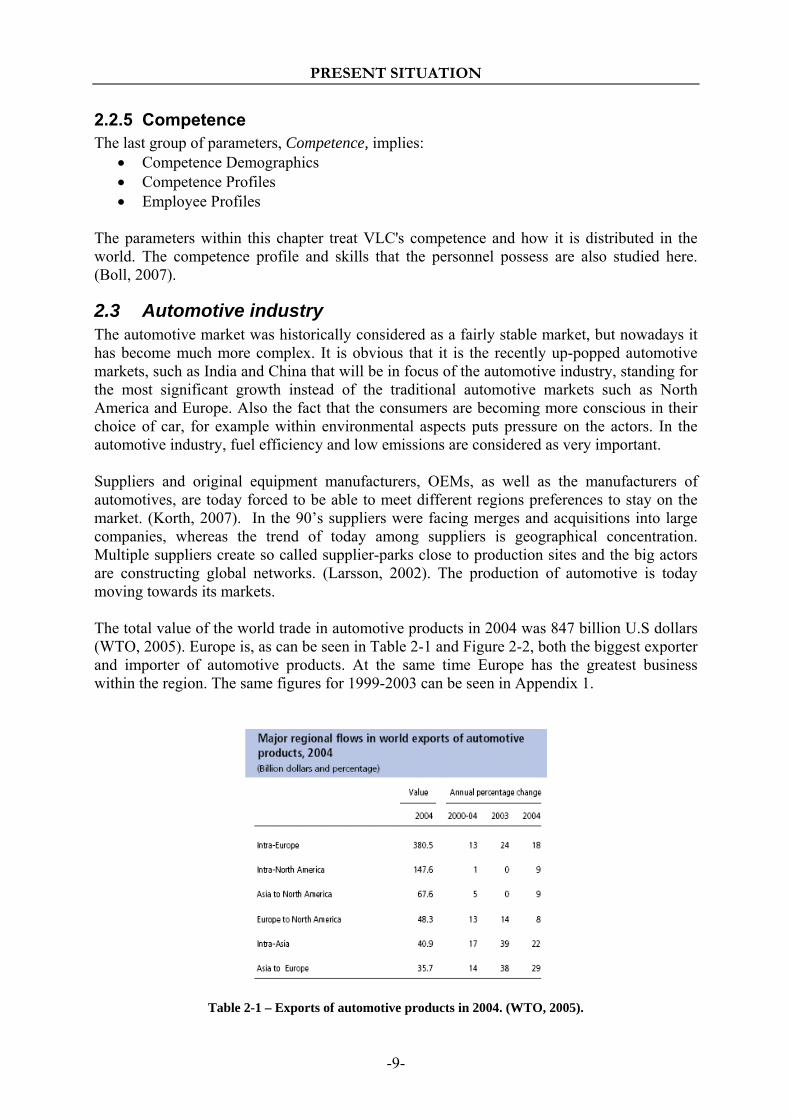
2.3 Automotive industry The automotive market was historically considered as a fairly stable market, but nowadays it has become much more complex. It is obvious that it is the recently up-popped automotive markets, such as India and China that will be in focus of the automotive industry, standing for the most significant growth instead of the traditional automotive markets such as North America and Europe. Also the fact that the consumers are becoming more conscious in their choice of car, for example within environmental aspects puts pressure on the actors. In the automotive industry, fuel efficiency and low emissions are considered as very important. Suppliers and original equipment manufacturers, OEMs, as well as the manufacturers of automotives, are today forced to be able to meet different regions preferences to stay on the market. (Korth, 2007). In the 90’s suppliers were facing merges and acquisitions into large companies, whereas the trend of today among suppliers is geographical concentration. Multiple suppliers create so called supplier-parks close to production sites and the big actors are constructing global networks. (Larsson, 2002). The production of automotive is today moving towards its markets. The total value of the world trade in automotive products in 2004 was 847 billion U.S dollars (WTO, 2005). Europe is, as can be seen in Table 2-1 and Figure 2-2, both the biggest exporter and importer of automotive products. At the same time Europe has the greatest business within the region. The same figures for 1999-2003 can be seen in Appendix 1.
Table 2-1 – Exports of automotive products in 2004. (WTO, 2005).

PRESENT SITUATION
-10-
Figure 2-2– Shares in world trade in automotive products. (WTO, 2005).

-11-
3 FRAME OF REFERENCE
In this chapter relevant theories for this study are presented. TPL providers’ concept and activities are presented as to explain VLC’s business. To construct a model relevant theories in modelling are reviewed. The modelling theories are complemented by theories in scenario planning since this is what the model should be constructed for. In benchmarking purpose two other organisations’ scenarios are studied. Two analysing methods, PEST-analysis and Porter’s five forces of competition, are presented as they are useful when analysing a business’ environment.

FRAME OF REFERENCE
-12-
3.1 TPL TPL providers offer a large amount of services to their customers, e.g controlling distribution centres and deliveries through the entire transport network (Christopher, 2005). TPL can be described as the subcontracting of logistics operations to an external service supplier (Berglund, 1997). The relation between the buying company and the TPL provider is often very deep and long lasting. It is common that such relations imply operational activities such as transport and warehousing but there are also many TPL cooperations that involve the implementation of information systems and the development of logistic systems and distribution structures. (Andersson et al 2002).
3.1.1 What do customers want? Among the companies which take into service a TPL provider there is often a strive for focusing on their own core competence. By outsourcing the logistic activities companies are able to put more efforts and resources into their core activities. Companies’ logistic networks become more and more complex through increasing globalisation, which makes logistics activities more complex and at the same time more important and competitive. Further there is the fact that the end customers are demanding better delivery services which the producing companies are willing to accept but without any increase in their logistic costs. That is why the logistics is very important for companies and, when offering an efficient one, can be very competitive. There is a need to put more effort and resources on developing those complex and cost efficient logistic systems and because TPL providers are specialized in logistics, companies contract them to handle logistic activities. (Andersson et al 2002). Other reasons why companies contract TPL providers are directly related to their financial results. By outsourcing logistic activities a company may decrease its share fixed costs and can leave out certain investments that are related to its logistics. (Andersson 1997). Because of the TPL provider’s specialisation and size they may accomplish important economies of scale. By using its assets and personnel to serve many companies the utilisation of capacity can be very high. Those economies of scale might even reduce the service buyer’s logistics costs. (Schary & Skjött-Larsen, 2001). It is rare that small companies hire TPL providers, but those who do often strive for cost reductions and an increase in the service offered to customers. For big companies the most important reasons for hiring TPL providers are the need of strengthening the strategic flexibility and ability of handling changes in the logistics. (Andersson et al 2002). For a company that contract a TPL provider changes in strategic logistic conditions can be handled more cost efficiently and faster (Pruth, 2002). By engaging a TPL provider the buying company reaches access to their former experience, know-how and specialized knowledge (Berglund, 1997).
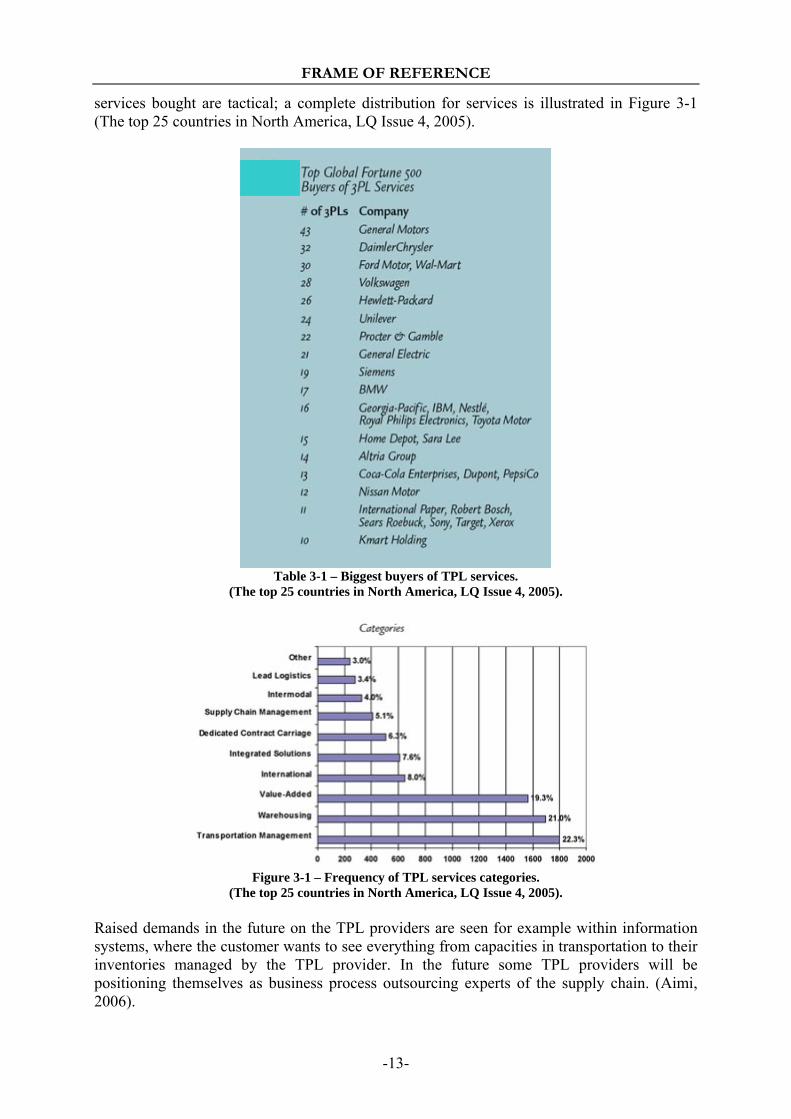
3.1.2 Branch, market and future The concept behind TPL was invented in the 1980’s (Carter & Maloni, 2006). Today actors in all kinds of industries outsource their need for logistic services to TPL providers and the biggest customers of today are the major automotive companies, seen in Table 3-1. TPL providers have experienced an annual growth of five to ten percent the last decade (Carter & Maloni, 2006). This is seen even though during the last two decades, from the 1980’s to 2000, the total percentage of growth domestic product, GDP, in USA spent on logistics decreased from approximately 16 to nine percent (Mentzer & Stank, 2006). Almost two-thirds of the
FRAME OF REFERENCE
-13-
services bought are tactical; a complete distribution for services is illustrated in Figure 3-1 (The top 25 countries in North America, LQ Issue 4, 2005).
Table 3-1 – Biggest buyers of TPL services.
(The top 25 countries in North America, LQ Issue 4, 2005).
Figure 3-1 – Frequency of TPL services categories.
(The top 25 countries in North America, LQ Issue 4, 2005). Raised demands in the future on the TPL providers are seen for example within information systems, where the customer wants to see everything from capacities in transportation to their inventories managed by the TPL provider. In the future some TPL providers will be positioning themselves as business process outsourcing experts of the supply chain. (Aimi, 2006).

FRAME OF REFERENCE
-14-
3.2 Key performance indicators According to Bean & Geraghty (2003) measurements within service, quality and financials frame a company and will be of great importance for its future. A balanced scorecard can be used to identify the most important key performance indicators, KPIs, ranked due to their compatibility with the business strategy. Once selected the KPIs, a quantified target for them should be determined. (Bean & Geraghty, 2003). Service-related KPIs are for example lead time, delivery reliability and stock availability. Lead time is a measurement on the time it takes from order to delivery and is especially important in branches where it is important to get a delivery fast. Delivery reliability refers to how reliable the promised lead-time is. This measurement is very important for example within industries where only small buffers exist in the production. Stock availability is a measurement on how many orders that can be directly delivered from the stock when a customer places an order. (Aronsson et al., 2004). Financial performance is critical for success (Bean & Geraghty, 2003). Cash flow, financial stability and liquidity are examples on financial performance indicators (Shinn, 2007).
3.3 Modelling Modelling is a common used method to determine production and distribution strategies (Sussams, 1992). Sussams (1992) sets the following definition of logistics modelling: “For the logistician a ‘model’ is a symbolic representation of features of the real world, which are relevant to and sufficiently accurate for the purposes that the model user has in mind” (Sussams, 1992, p. 3) Rothery (1990) considers the purpose of modelling as to describe components and visualize these components impact on each other.
3.3.1 Different types of models Models can be very different, but the intention of all models is to visualize a simplification and a hypothetic alternative for describing and understanding a phenomenon (Wallén, 1996). Pidd (1998) points out certain aspects that should be considered by the researcher in his/hers choice of modelling approach:
• Time handling • Stochastic or deterministic durations • Discrete or continuous change
Time handling refers to how the model should handle the time-aspect. Time-slicing, when time is divided into equal intervals, and next-event simulations can be used. The choice of Stochastic or deterministic durations considers whether the system is entirely predictable, i.e. deterministic, or not. In a stochastic model there must be a probability distribution for the specific event. A discrete change takes place at a certain point in time, and can come either at predefined intervals or randomly, differentiated from continuous change. (Pidd, 1998). Different approaches results in a wealth of models mentioned and discussed in the literature. Two conceptions of models according to Wallén (1996) are normative and instrumentalistic. The normative model is descriptive, but not always totally founded on real facts. It can reflect
FRAME OF REFERENCE
-15-
how it is supposed to be instead of the reality, i.e. giving an unrealistic picture. The instrumentalistic model is not a realistic presentation, rather a tool for mapping out the connections between variables. This model can be very simplified and just take into consideration certain aspects of the system. (Wallén, 1996). For a user to be able to better analyze and question the result a model generates, it is helpful to understand the underlying principles of it. For the constructor of a model it is preferable if the total system, which is to be modelled, can be fractioned into subsystems. The model building process is then facilitated if those subsystems can be handled as individual standard modules. A second part of the model building process is then to find the connections between those subsystems and consequently create the linkages between the modules. (Sussams, 1992).
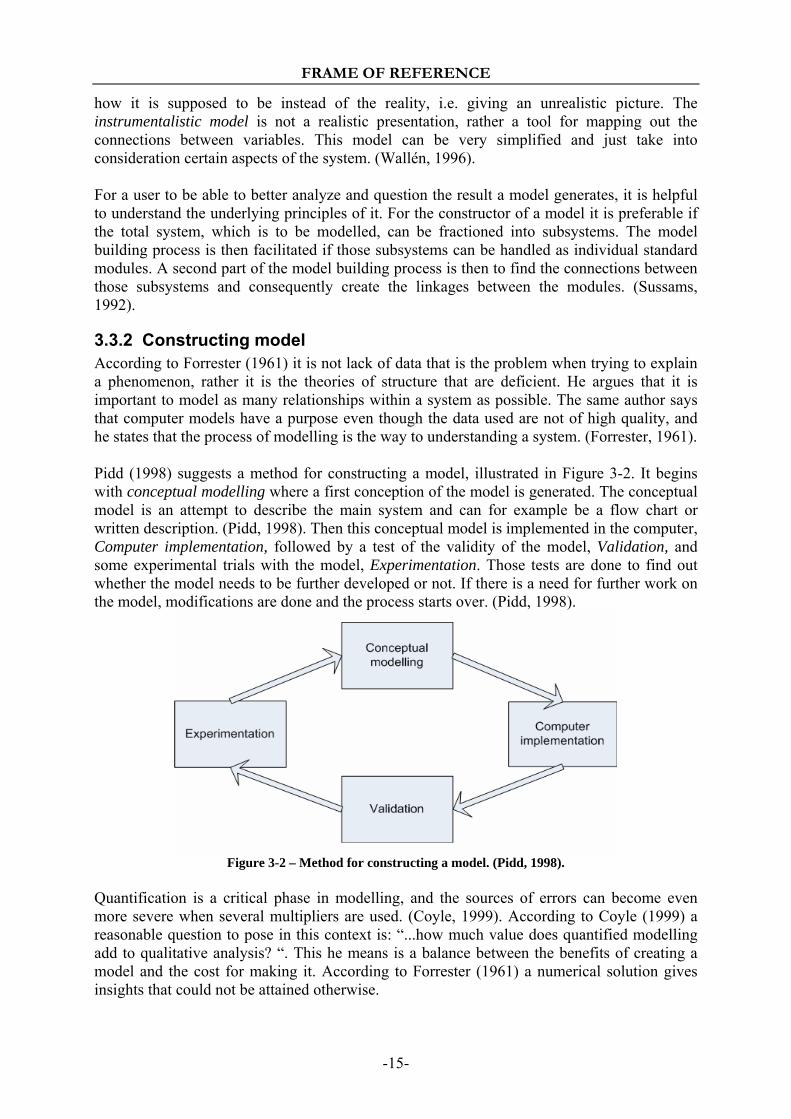
3.3.2 Constructing model According to Forrester (1961) it is not lack of data that is the problem when trying to explain a phenomenon, rather it is the theories of structure that are deficient. He argues that it is important to model as many relationships within a system as possible. The same author says that computer models have a purpose even though the data used are not of high quality, and he states that the process of modelling is the way to understanding a system. (Forrester, 1961). Pidd (1998) suggests a method for constructing a model, illustrated in Figure 3-2. It begins with conceptual modelling where a first conception of the model is generated. The conceptual model is an attempt to describe the main system and can for example be a flow chart or written description. (Pidd, 1998). Then this conceptual model is implemented in the computer, Computer implementation, followed by a test of the validity of the model, Validation, and some experimental trials with the model, Experimentation. Those tests are done to find out whether the model needs to be further developed or not. If there is a need for further work on the model, modifications are done and the process starts over. (Pidd, 1998).
Figure 3-2 – Method for constructing a model. (Pidd, 1998).
Quantification is a critical phase in modelling, and the sources of errors can become even more severe when several multipliers are used. (Coyle, 1999). According to Coyle (1999) a reasonable question to pose in this context is: “...how much value does quantified modelling add to qualitative analysis? “. This he means is a balance between the benefits of creating a model and the cost for making it. According to Forrester (1961) a numerical solution gives insights that could not be attained otherwise.
FRAME OF REFERENCE
-16-
3.3.3 Questioning the model There are some general requirements that a model needs to fulfil to be considered a good model. According to Wallén (1996) there are five such criteria:
• Systematic • Validity • Efficiency • Model conditions • Generalisation
The first criterion, systematic, concerns the structure of the model. The structure needs to be logic and free from contradictions and the model must be consequent. Regarding the next criterion, validity, the model must fulfil both the theoretical and the conceptual validity to prove that there are no systematically errors. The theoretical validity means that all the incoming variables and parameters are relevant and the conceptual validity implies that all the conceptions used in the model needs to be defined. There is also an empirical validity, which can be examined by testing whether or not the model can predict an experimental outturn. The model can be tested with historical data where the outturn is already known. (Wallén, 1996). The efficiency is about the model being efficient in prognosticating and its accessibility. It is important to keep in mind that when doing simplifications to increase the efficiency there is a risk that the model no longer presents a correct image of the reality. (Wallén, 1996). According to Wallén (1996) the fourth criterion, model conditions, means that simplifications, assumptions, area of validity and additional conditions must be mentioned in the context. The author also state generalisation as a criterion and give two examples on how the generalisation can be examined. Either can it be examined empirically, by comparing different study cases or it can be examined theoretically by discussing the limitations which are generated by the model conditions being set. (Wallén, 1996).
3.4 Scenario planning Scenario planning is a method where possible futuristic visions are set up and further used for action. It is used in strategic purposes and to test the characteristics of an organisation in a possible future. (van der Heijden, 1997). Herman Kahn introduced the modern version of scenario planning in the 1950s. During certain periods since then it has attained extreme focus, nevertheless also being a criticized and forgotten methodology at others. After the turbulence during the 1990s scenario planning once more regained interest and became an important tool for business management. (Lindgren & Bandhold, 2003).
3.4.1 Scenario features A scenario is a visualisation of something in the future (MIT, 2007). Scenarios can be of an exploratory art, focusing on possible events under certain circumstances, or aspirational, aiming to sort out how specific futures can be achieved alternatively avoided. Since scenarios are considering the future it deals with uncertainties. (van der Heijden, 1997). From a strategist’s perspective it is important to be able to distinguish the organisation itself, which is controllable, from the transactional and the contextual environment. The trans-actional environment is what to some extent is possible to influence and control by the strategist and his or hers organisation, whereas the contextual environment represent what can not be affected. The transactional environment should be contemplated and acted on as to

FRAME OF REFERENCE
-17-
create competitive advantages for the organisation. The contextual environment on the other hand is something that the organisation has to learn to deal with, regardless of its turns, to stay on the market. Scenarios are built up out of events identified from the contextual environment in a way that they are thought of as equally plausible. (van der Heijden, 1997). Scenario planning is thus a method used as to handle the uncertainties in the business environment (Lindgren &Bandhold, 2003). The external issues are illustrated by chains of causes and effects, resulting in an identification of the actual driving forces that are pushing the organisation in a certain direction. The internal issues, which are not included in the scenarios, are the strategic options that the organisation can develop. (van der Heijden, 1997). To summarize, the following three components is always part of a scenario project (van der Heijden, 1997):
• Internal issue(s) that need to be clarified. • Scenarios describing the future of the external business environment that will affect
the selected issue(s). • Interaction between scenarios and internal issues, which constructs the so called
testbed for the strategic discussion.
3.4.2 Scenario projects’ focus and purpose According to van der Heijden (1997) are scenarios the best tool for strategic discussions. By Schwartz (1991) scenarios is explained as a tool for structuring insights about different futures as to use in decision-making. To Lindgren & Bandhold (2003) scenario techniques are used in four different dimensions. Those dimensions depend on the organisations’ focus, old or new business, and their purpose with the exercise, action or prerequisite for change. A scenario project thus has different purpose and focus on different things, resulting in four quadrants, seen in Figure 3-3. (Lindgren & Bandhold, 2003)

FRAME OF REFERENCE
-18-
Figure 3-3 – Different purpose and focus with scenario projects (Lindgren & Bandhold, 2003). In the first quadrant focus is on new business and the purpose is to identify and consider the changes that have occurred and continue to do so in the surroundings. It is thus called the New thinking/paradigm shift. In the second quadrant there is also focus on new business, however the organisation has already identified changes in the surroundings and is more action-oriented than in the precedent quadrant. This area is called Business development/concept development. In the next quadrant the organisation is also action-oriented but here focus stays on the old business, thus the purpose is to prepare the organisation for the future. This quadrant is called Strategy development/organisational development. In the last quadrant, Risk consciousness/need for renewal, focus stays on the old business however here it is a process of identifying the need for change rather than act for change as in the precedent quadrant. (Lindgren & Bandhold, 2003).
3.4.3 Scenario project process To illuminate important issues in a scenario project it is desirable to use internal as well as external competences. (van der Heijden, 1997). According to van der Heijden (1997) it is appropriate to early on in the process decide what the scenarios should be constructed as to test, i.e. point out the target(s). Also Lindgren & Bandhold (2003) means that focusing is important, they call it focal questions and states that the more focused these are the better the answers will be. The business idea, which is thought to address the driving forces of success of a company, is often a good base for finding the important issues. The act of focusing the scenario project to a limited number of targets is necessary to be able to disregard from factors in the business environment that is considered as to have secondary importance. (van der Heijden, 1997).

FRAME OF REFERENCE
-19-
Except for this type of focus on certain issues it is important to determine an appropriate time horizon for the scenario project (Lindgren & Bandhold, 2003). This should be done by considering the strategic issues that are in focus in the scenario project and the state of the business (van der Heijden, 1997). By identifying the important areas in the business environment that is to be considered in a certain scenario project, a so called scenario agenda is constructed. These areas, which typically range between four and five, are the ones which impact the organisation have the most concern about, and thus they are often identified through interviews with the management of the organisation. PEST-analysis and Porter’s five forces of competition described in 3.5 and 3.6, is two types of analyses that are of great use for the identification of important areas in the business environment of an organisation. They consider the political, economical, social and technological issues as well as the structure of the industry where the organisation operates. (van der Heijden, 1997). Besides the external scenario agenda that are to be set up van der Heijden (1997) mentions the internal agenda as a second step in the scenario project. The internal agenda is a mapping of the fundamentals of the organisation itself. Leaving out the external business environment a scenario planner is analysing which is the most important problems and concerns within the organisation itself. (van der Heijden, 1997). When having proposed an external- and an internal scenario agenda, knowledge in these areas must be achieved to find the driving forces for the development on those areas (van der Heijden, 1997). This can be done by literature research, through competence within the organisation in question as well as by external experts according to van der Heijden (1997). All information found in this phase is gathered into appropriate clusters, which in hand can be explained by a certain number of driving forces. The definition of a driving force according to van der Heijden (1997) is “…a variable which has a relatively high level of explanatory power in relation to the data displayed in the cluster.” (p.189). Studies on patterns and trends, further constructing influence diagrams are used to find these driving forces. The level used throughout the process should not be too specified because of the desire to generalise, at the same time as it can not be at a too general level either. As an example the author mentions that it is not appropriate to look at the demand for gold in a world-wide perspective, at the same time as it does not make sense to do it on a level where every gold buyer is considered either. (van der Heijden, 1997).
Scenario construction By scenario construction the complexity is reduced to a manageable level of information since it is not feasible to explore all possible futures (Lindgren & Bandhold, 2003). There are multiple techniques for constructing scenarios. Expert teams, simulation models and scenario workshops are examples of such methods (Miles, 2004). A good complement is often to do a media scanning (Lindgren & Bandhold, 2003). Scenario techniques are often qualitative and origin in reasoning and intuitive pattern making considering the particular issues. (Lindgren & Bandhold, 2003). Out of the information gathered in the earlier process of the scenario project the scenarios should be constructed. van der Heijden (1997) says that at least two but that at the most four scenarios which is plausible and internally consistent should be constructed in a scenario project. Both the criteria for plausibility and internally consistent refers to the cause and effect
FRAME OF REFERENCE
-20-
relations, which should be logic and built on arguments that can not be flawed. (van der Heijden, 1997) There are three different methods for constructing scenarios: inductive, deductive and incremental. In the inductive method the frames for the scenarios are set during the scenario building process whereas in the deductive method the framework is already set from the available data. The inductive method is time consuming but very useful in groups with divergent opinions and high tolerance, whereas a deductive method is to prefer when time is a scarce resource and the group is thinking in a similar way and thereby must be pushed out of the box into new areas. The incremental method is used in a cohesive group which does not like the forcing approach used in the deductive method and takes things at its on pace, something that in comparison to the deductive method makes it rather time consuming. It is not necessary to use the same approach throughout the whole scenario building process. (van der Heijden, 1997).
3.4.4 TAIDA – a model for scenario planning TAIDA is a model for scenario planning that has been frequently used in scenario projects the past ten years. The model has been used by experts as well as in scenario projects of a more amateur-character where most of the work is conducted in workshops. Each letter in TAIDA represents one of the steps in the process that the model refers to, namely Tracking, Analysing, Imagining, Deciding and Acting. The process proposed in TAIDA shall start first when the purpose and focus of the scenario project is clear, thus what is discussed in 3.4.2 Scenario projects’ focus and purpose. (Lindgren & Bandhold, 2003).
• In the Tracking-step the business environment is scanned for trends and uncertainties that are of importance for the focal questions. There are multiple ways for identifying trends, but it is suggested to choose simpler ones in the beginning, and if needed to complement with advanced methods if deeper analysis is needed. For example brainstorming, media scanning, expert panels and focus groups can be used for the identification process. Once trends are identified it can be useful to prioritise them, as to reduce the complexity by disregard some trends in the further work. This can be done by estimating the predictability and the impact on the focal questions by the different trends and do a selection based on this material. (Lindgren & Bandhold, 2003).
• Analysing refers to the process where driving forces and consequences of the trends
are mapped. In this step it often becomes clear that there exist connections between certain trends, which further are necessary to map as to create scenarios of the future. A cross-impact analysis could be used as to identify those connections. Once the preparatory work is done scenarios shall be constructed, which is explained in Scenario construction. (Lindgren & Bandhold, 2003).
• In the step called Imagining the organisation itself is introduced. Here a vision of the
future should be set up as to represent what the organisation desires for the future, something that can be easier to do when probable future scenarios are constructed. The vision should be realistic but still challenging and it is important that it is supported within the organisation. (Lindgren & Bandhold, 2003).
• Deciding refer to the step where the constructed scenarios of the future and the vision
are linked together as to create alternative strategies for the future. Trends and driving
FRAME OF REFERENCE
-21-
forces that are described in scenarios is often useful in strategy generation since they help identifying success factors. To study the core competences within an organisation can also be of great use as to create strategies. (Lindgren & Bandhold, 2003).
• The last step in the TAIDA-model, Acting, considers when the organisation transforms the strategy into action, and further their continuous work within scenario planning. The continuous work is a type of up-date work, as to identify early warning signals and identify new trends and changes in existing scenarios. (Lindgren & Bandhold, 2003).
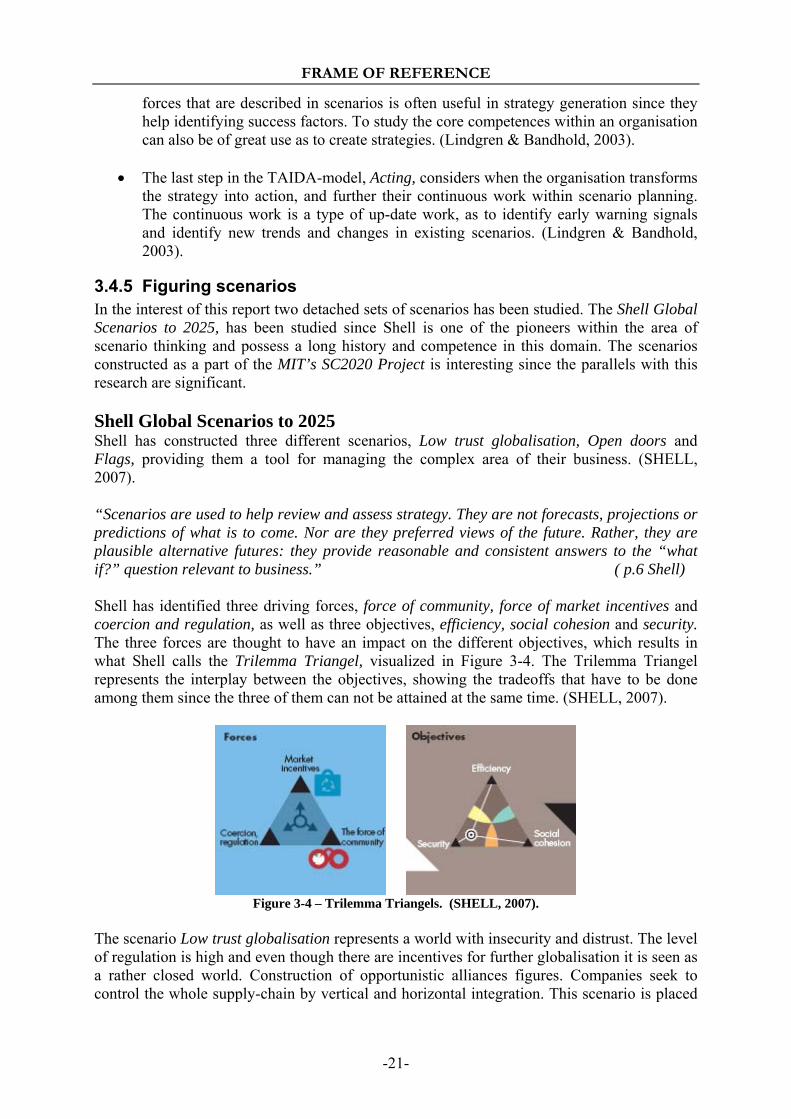
3.4.5 Figuring scenarios In the interest of this report two detached sets of scenarios has been studied. The Shell Global Scenarios to 2025, has been studied since Shell is one of the pioneers within the area of scenario thinking and possess a long history and competence in this domain. The scenarios constructed as a part of the MIT’s SC2020 Project is interesting since the parallels with this research are significant. Shell Global Scenarios to 2025 Shell has constructed three different scenarios, Low trust globalisation, Open doors and Flags, providing them a tool for managing the complex area of their business. (SHELL, 2007). “Scenarios are used to help review and assess strategy. They are not forecasts, projections or predictions of what is to come. Nor are they preferred views of the future. Rather, they are plausible alternative futures: they provide reasonable and consistent answers to the “what if?” question relevant to business.” ( p.6 Shell) Shell has identified three driving forces, force of community, force of market incentives and coercion and regulation, as well as three objectives, efficiency, social cohesion and security. The three forces are thought to have an impact on the different objectives, which results in what Shell calls the Trilemma Triangel, visualized in Figure 3-4. The Trilemma Triangel represents the interplay between the objectives, showing the tradeoffs that have to be done among them since the three of them can not be attained at the same time. (SHELL, 2007).
Figure 3-4 – Trilemma Triangels. (SHELL, 2007).
The scenario Low trust globalisation represents a world with insecurity and distrust. The level of regulation is high and even though there are incentives for further globalisation it is seen as a rather closed world. Construction of opportunistic alliances figures. Companies seek to control the whole supply-chain by vertical and horizontal integration. This scenario is placed

FRAME OF REFERENCE
-22-
on the left side of the Trilemma Triangel, showing greater impact on the objectives for efficiency and security than social cohesion. (SHELL, 2007). Open doors represent a world with further globalisation and resolved issues considering security and distrust. It is a global community with rather free flows of people, information, capital, goods and services. The Open door-scenario is placed on the right side of the Trilemma Triangel, mostly affecting efficiency and social cohesion. (SHELL, 2007). The scenario called Flags is a mix of internationalism and nationalism with discernible features of patronage. It is not uncommon with incompatible national regulations. It exist problems with trust and security something that shows in what they prefer to call a gated community. As a scenario situated at the base of the Trilemma Triangel it is mostly affecting the objectives of the social cohesion and security. (SHELL, 2007). The scenarios are further explicated in so called Trilemmaps, showing differences between the scenarios regarding certain aspects. (SHELL, 2007). MIT’s SC2020 – Scenarios SC2020 Project at MIT is a project considering the logistics in the future, and is a cooperation between the university and multiple companies all over the world. They are trying to construct an analysing tool for managing the challenges within logistics in the future. As one step in their work they have constructed three different scenarios for the future to come, namely Alien Nations, Spin City and Synchronicity. These scenarios focus on the relations between countries, energy issues and demographics. (MIT, 2007). The scenario called Alien Nations refers to a nationalistic world and in that sense reduced globalisation. Each state is expected to deal with their energy issues and the price of oil is thought to fluctuate according to a cycle. There is focus on terrorism and war in this scenario due to suspicion between countries. Companies focus on the domestic market and there is little possibility to create economies of scale between countries since the countries is thought of as rather closed. (MIT, 2007). In the Spin City-scenario economic growth is driven by the globalisation, however thought of as slow. There are restrictions in the level of openness between countries and governments focus on national security. At the same time there is concern about the environment and the depletion of natural resources. The oil price in this scenario is high. (MIT, 2007). The Synchronicity-scenario shows a strong culture of democracy. The level of globalisation is gradually increasing and the trust among actors in comparison with the other scenarios is high. Environment, healthcare as well as safety are thought of as very important factors in the society, reflecting the aim of higher quality of life. The market is almost fully integrated and joint ventures between companies are common. To provide customized products as well as high quality services are key factors for success on the market. The price of oil is relatively high and volatile, although not showing any greater impact on the citizens. (MIT, 2007).
3.5 PEST-analysis According to Jobber & Fahy (2006) the factors having an impact on a company’s operations can be divided into forces from the microenvironment and from the macroenvironment. The microenvironment implies actors such as suppliers, customers and competitors in the close business environment to a company whereas the macroenvironment refers to forces that have

FRAME OF REFERENCE
-23-
an impact on all the actors in the microenvironment. The forces in the macroenvironment can be divided into four types; political/legal, economic, social and technological, thereof the name PEST-analysis. (Jobber & Fahy, 2006). Political/legal forces set the rules for companies. For example restrictions and codes for practice are triggered by governmental activities. (Jobber & Fahy, 2006). The main purpose with the legislations regulating business is to protect consumers and the society but further it is also meant to enhance fair competition on the market. The number of legislations having an impact on businesses is steadily increasing. (Kotler, 2003). Economic factors among other things refer to the economic growth, interest and exchange rates and the development of economic areas. (Jobber & Fahy, 2006). Within the economic environment the income distribution is also considered. (Kotler, 2003). The social forces are according to Jobber & Fahy (2006) divided into four groups, demo-graphic, cultural, social responsibility and consumer movements. Together they consider for example changes in growth of population and their preferences, and further groups’ values, beliefs and attitudes. (Jobber & Fahy, 2006). The technological development is taken into account within the technological forces, and considers the advancement in information technology, product development etcetera (Jobber & Fahy, 2006).
3.6 Porter’s five forces of competition According to Porter (2004) there exist five forces that influence an industry and thus must be considered in strategic work. Those identified forces are Degree of rivalry, Threat of substitutes, Buyer- and Supplier power and Barriers to entry. (Porter, 2004). The Degree of rivalry considers the competition on the market and is among other things characterized by the number of firms, market growth and cost distribution. If a market had perfect competition none of the firms would gain a profit, however such markets does not exist and it is rather the competitive advantage that a firm possesses over its rivals that is referred to in this force. Multiple strategies are used as to gain competitive advantage, for example prices changes, differentiation, vertical integration and cooperation and change of distribution channels. (Porter, 2004). Threat of substitutes refers to the competition that an industry faces from another industry’s products. The substitutes have an impact on the demand since they are alternatives that could be used instead. The more alternatives that can be found the harder the competition, and further the closer the substitute product the bigger the impact. (Porter, 2004). The Buyer power takes into account the impact that the buyers have on the producing firms within the industry. If there only exist a few buyers or if certain buyers purchase great parts of the output in an industry they are often rather powerful and have great influence on the providers. Buyers can be threatened for example by changes in the distribution channel and has little power if there does not exist any substitutes. (Porter, 2004). Supplier power refers to the power that the suppliers have in a buyer-supplier relationship. If an industry is dependent on a supplier they exert great power, and they can further become

FRAME OF REFERENCE
-24-
powerful if the customers has specific requirements on how the final product is produced or likely. On the other hand if there exist a lot of suppliers they are rather weak. (Porter, 2004). The last force identified by Porter (2004), Barriers to entry, treats the market equilibrium. There are different characteristics of a market that signifies whether it is hard or easy to enter. It is for example considered as easy to enter a market with common technology and little brand franchise, and on the contrary hard if there is patent issues and difficulties to switch brand. (Porter, 2004).

-25-
4 ASSIGNMENT DISCUSSION
In this chapter the assignment is introduced and further divided into parts. Also the scope of the study and the studied system according to the system approach are presented here.

ASSIGNMENT DISCUSSION
-26-
4.1 Assignment definition The assignment in this report is to construct a model that considers the future logistics at VLC. In studies of the future scenario planning processes are common approaches. The working process for managing this assignment will thus be heavily influenced by scenario processes and in particular the ones proposed by van der Heijden (1997) and the TAIDA-model. The future logistics is a very wide expression and need to be more specified. van der Heijden (1997) declares the importance of defining what the scenario project should test, i.e. what targets are to be taken into consideration. He states that it is important to do this early on in the working process. One aspect in this assignment is therefore to choose what targets should define the expression future logistics. The model in this assignment should take into account selected variables and the connections among them, indicating which of the chosen targets that will be affected. Each variable will correspond to or be part of areas, the so called scenario agenda, where VLC find themselves vulnerable in the future and thereby is identified as having an impact on the targets. Because of the level of specification that is wanted in this model the researchers in association with the supervisors at VLC have decided to examine and decompose those variables one step further than what van der Heijden (1997) does. Therefore will the identified variables be explained by a number of driving forces. The concept behind the model is thereby to some extent different from van der Heijden’s (1997) scenario project process. The actual concept is visualized in Figure 4-1 as to clarify the different expressions that are used and to facilitate for the reader when reading the coming chapters. The driving forces, variables, scenario agenda and targets are in this report referred to as components of the model.
Driving forces Variables Scenario agenda Target
Figure 4-1 – Concept for model.
Together with the model follows a manual for how to use it. The construction of a manual will be done in order to explain for persons at VLC how it should be used. It is important that the creators of the model in a proper way transfer the concept behind the model and how it should be used. The manual will be a part of this report but still need to be free-standing. The goal is that the model and the manual can be separated from the report once the user is familiar with the justifications behind the connections and components. According to Wallén (1996) and Pidd (1998) it is a good idea to test the model once it is created, something that can be done by experimentation. The model that is to be created in this assignment is decided not to be a computer based simulating model. Still the criteria that Wallén (1996) proposes will be applied on the model.

ASSIGNMENT DISCUSSION
-27-
The model will be complex and testing the entire model would imply creating scenarios including every driving force identified. Thus focus in this report is rather to test the manual and the working process. A mini-scenario that considers specific changes in the external business environment will be created as to do the testing of the manual. The reason for calling it a mini-scenario is that the researchers want to distinguish this from the types of scenarios often referred to in other sources. The scenarios created by Shell and MIT, which are presented briefly in 3.4.5 Figuring scenarios, are of a more general character and discusses changes in a more unspecified way, something that would be hard to use in a focused model like the one VLC wants. The mini-scenarios used in the model must be more specific and directly adapted to VLC’s business environment and their concerns. The mini-scenario will be interpreted in the model following the manual and if needed the manual will be revised. The assignment will be executed according to theories in scenario planning and modelling, and it has been broken down into three parts; Create model, Create manual and Mini-scenario case. This partition of the assignment has been found appropriate by the researchers as to explain the progress of the study. Further to point out that what is referred to as the third part can not start before a conceptual model and a manual has been constructed in part one respectively part two. The partition will also prevent misunderstandings such as that the model and manual was built up around a certain mini-scenario and not separately on beforehand which is the case. To demonstrate this by a partition of the assignment credibility to the result of the study will be given. Misconception in this aspect would be fatal for the research since the model and the manual constructed would not be trustful. The decomposition into parts is visualized in Figure 4-2, and each part is further presented in chapter 6 9 and 11 The difference in size for the three parts, which shows in Figure 4-2, represent the fact that the parts are not equally big, something that further will show when comparing the chapters considering the different parts.
Figure 4-2 – Decomposition of assignment into parts.
4.2 Scope The model, which will be constructed in this assignment, will focus on the automotive industry out of VLC’s perspective and it will be simplified as to meet the directives from the company. Both the number of targets for VLC’s activities and the number of components thought to influence them will be limited according to recommendations in the literature on scenario planning. Also limits in time for this assignment and VLC’s directives will be considered as to find an appropriate complexity for the model. The manual, which will be constructed, will be tested by one mini-scenario due to the restrict-tions in time and directives from VLC. At this initial stage of scenario planning VLC only finds it useful to investigate the model by using one fictitious case, and wants the researchers
ASSIGNMENT DISCUSSION
-28-
to focus on constructing the model and the manual. VLC wants the manual to be simplified and easy to follow.
4.3 System approach For a researcher who is using the system approach it is important to find out and define the entire system and its environment. Goals and key performance indicators for the system as well as for its components and how different activities affect those goals and indicators should be set up. (Churchman, 2002). An important point of departure is to define the goals of the studied system. When defining the goals it is essential to identify the real goals which the system is obviously striving for. That sometime means that, e.g. a researcher who is studying an organisation can not only listen to what the leaders of the organisation say is their goals, but need to find out what they are really striving for and willing to give up other things for. Key performance indicators are concrete goals and when studying an organisation one can often use their indicators to set the system goals. (Churchman, 2002). The fixed surroundings outside the studied system are called the system environment. In the environment there are factors that can affect the system in different ways but the system itself or the activities of its components can not have any impact on the behaviour of those factors. An example of such a factor is when a studied organisation has a fixed budget that can not be modified by the organisation itself. (Churchman, 2002). A system can be divided into components where each component represents an activity or assignment. The performance of each component should be able to measure and it is important to find such components which performance indicators have an actual impact on the indicators for the entire system. When having found a component it is desirable to be able to prove that if a certain performance indicator for that component raises the same indicator for the entire system also rise. (Churchman, 2002).
4.4 The studied system The studied system for this assignment implies two divisions, each corresponding to one part of the assignment. Part two, Create manual, will not have an own studied system like the other two parts. Some of the components in the total studied system belong to both of the divisions, but conflicts concerning what should be considered as inside or outside the system during the two separate parts could not be compromised in any other way than by using two divisions. Some components left outside the system in part one will be studied in part three and vice versa. A mini-scenario such as the one to be constructed and used in the model in part three will initiate a deeper study on a focused area, forcing components to change side of the system limits compared to part one. Figure 4-3 is an illustration of the total studied system, a system which will be explained in its divisions by referring to two of the parts of the assignment.

ASSIGNMENT DISCUSSION
-29-
Figure 4-3 – The total studied system.
4.4.1 Studied system - Create model The studied system in Figure 4-4, consisting of VLC’s situation today and the so called trans-formation line illustrates the system for the first part of the assignment, Create model.
Figure 4-4 – The studied system for part I.
The transformation line illustrates changes in the targets of the model, due to changes in driving forces considered in a mini-scenario. The driving forces that are thought to be able to change in a mini-scenario of the future are selected as to have an important impact on the targets and are represented by the small boxes in Figure 4-4. The number of boxes in this picture, as well as in the other pictures considering the studied system, should not be seen as a fix number of driving forces for the model, rather as an image of the concept behind the driving forces. Leaving the boxes outside the system here illustrates that this part does not imply any study on how the driving forces will change in the future, only which target they will affect in case of a change. The goal of this studied system is to get a complete image of how a certain set of driving forces impact on VLC’s performance in the future. This studied system is going to generate the most correct and valid image of which components that will affect the targets that VLC has set up. The intention is to be able to use this model for deeper investigations on how a certain mini-scenario affects the targets. The performance indicators of this studied system is accuracy in outturn and the completeness, i.e that all the important driving forces and their impacts has been included. The driving forces will be identified but not further investigated and is therefore left in the studied system’s environment. The boxes on top of the picture are representing the external driving forces, which mean those variables that VLC can not influence. The boxes at the

ASSIGNMENT DISCUSSION
-30-
bottom are the ones representing VLC’s own actions having an impact on the targets. The arrows inside the studied system demonstrate the impact of the driving forces on the targets. These arrows go through variables and scenario agendas on their way to the targets. The arrows imply also the possible connections among the variables and among the areas on the scenario agendas. Every arrow is a component of the studied system and will be examined individually. The goals of those components are, as for the total studied system, the accuracy and in some extent also the weight, i.e. the “size” of each driving force’s and variable’s impact on the transformation line. VLC Tomorrow at the right side of the picture represents the targets chosen to focus on. They are left in the system’s environment because no studies or quantifications of the targets in the future will be done here, only the road towards changes in them will be focused.
4.4.2 Studied system - Mini-scenario case When constructing a mini-scenario, investigating its affect on selected targets and working out the areas for recommendations by following the manual, the studied system from the first part must be modified. Its new appearance is visualized in Figure 4-5.
Figure 4-5 – The studied system for part III.
Included in this system are those boxes, corresponding to the driving force(s), which is/are included in the mini-scenario. Also those boxes representing VLC’s actions in response to this external change are included. Excluded are thereby boxes representing driving forces that neither are considered in the actual mini-scenario nor in the areas of recommendations for VLC. The number of boxes on either side of the system limit shall once again not be seen as a fix number, only as an illustration of the concept. The mini-scenario will consider an external affect on the targets of the model, in the picture seen as a box on the top included in the system. As external driving forces change possible changes in the targets will be studied, parts of VLC Tomorrow are for this reason included in the studied system. The possible changes in the targets will eventually be faced by VLC’s own actions. These internal actions, as to meet a change in the business environment, are represented by including a box at the bottom in the studied system. It is this box that represents the area of recommendations in case of a certain mini-scenario. The goals of this studied system are a true image on what impact a certain scenario has on VLC’s future and a response from the internal agenda that indicates how VLC should act in order to cope with the external change. Performance indicators for this system are trust-worthiness and realistic impacts and recommendations.

-31-
5 RESEARCH DESIGN
In this chapter the design of the study in its entirety is presented. There are multiple theories, however not to differentiated, on how a study should be performed. According to Jacobsen (2002) a study should be decomposed into phases. Lekvall & Wahlbin (2001) also advocate the decomposition of a study, distinguishing steps and their relations, to get an overview of the study to be performed. The choices made in a phase (or step) will further affect and have consequences for the subsequent work (Jacobsen, 2002). This study is divided into three different stages, the Planning stage, the Performing stage and the Completion stage. Each stage’s content and possible sources of error are discussed in this chapter, ending with a section considering quality of research design.

RESEARCH DESIGN
-32-
● Recommendations for decision Target of decision ●
Analyse of situation
Need of information and ● purpose of research
Specifying the assignment
Specified research assignment ●
Choice of approach, method etc. Planning
Plan for research ●
Work in field Data collection
● Database
Analyse of database
● Result from data
Further interpretation and analyse
● Conclusions
Progressing recommendations for decision
Reporting
5.1 Planning stage Jacobsen (2002) claims that the first three phases in a study are the same irrespective of later chosen approaches. These three phases are known as developing the problem, choice of study direction and choice of study approach (Jacobsen, 2002). These phases are more or less also seen in the model by Lekvall & Wahlbin (2001), seen in Figure 5-1.
Figure 5-1 – The U-model
RESEARCH DESIGN
-33-
The content of the left part in the U-model in Figure 5-1 and the three phases in Jacobsen (2002) are very similar. First the problem should be concretised and it should be distinguished what is of interest for the study (Jacobsen, 2002). Depending on the initial specification of the given assignment, a lot of effort sometimes has to be done to specify the assignment. Concretisation of the assignment is vital for further planning and data collection. (Lekvall & Wahlbin, 2001). Also a classification, with respect to the study direction and method approach, should be done. The direction of the study; explorative, descriptive, explanative or normative, is decided by which conclusions that should be drawn from the study. Whereas method approaches, case- or cross sectional- and quantitative- or qualitative study, are determined with respect to the working process on how to come to these conclusions. (Lekvall & Wahlbin, 2001).
5.1.1 Developing the problem The assignment in this report was given by VLC. During information sessions with the supervisors at the company the focus of the study was decided and its purpose and directives were developed. The scope and assignment definition, explained in chapter 4 has been set in discussion with the supervisors at VLC and the supervisor at LiTH. Before setting the final scope some preliminary research was done in order to understand the situation at VLC, its activities and the work already done by the supervisors. This research gave an insight in what data was accessible and somewhat also an indication of the complexity of the assignment. An important question to pose before setting the purpose and scope of this study was how VLC wanted the result to look like and how they wanted it to be used. When this was cleared up the scope and studied system was set.
5.1.2 Choice of study direction Björklund & Paulsson (2003) and Lekvall & Wahlbin (2001) both state exploratory, descriptive, explanative and normative as different directions of a study, depending on the researcher’s level of knowledge in the specific case. A study is often a combination of more than one of these, and they are thought of as gradually augmenting the knowledge within the studied area (Lekvall & Wahlbin, 2001). The exploratory study aims to give the researcher a basic insight within the frames of the study and is used when the level of knowledge is rather low (Björklund & Paulsson, 2003). The exploratory study is therefore often seen as a first phase in a deeper revision (Lekvall & Wahlbin, 2001). According to Jacobsen (2002) the purpose with an exploratory study is to augment the understanding for a phenomenon, resulting in the ability to concretise it and set up possible hypotheses to try out. An increase in knowledge develops clarity for the problem (Jacobsen, 2002). Since the area of knowledge for this assignment in many aspects are unknown for the researchers, it has been found appropriate in some extent to have an explorative direction in the initial stage of the study. By an explorative direction the researchers will attain a certain level of knowledge, something that is desired to decompose the problem and pose the right questions to complete the assignment. The descriptive study can be conducted when the researcher has a basic knowledge and under-standing within the area of the study (Björklund & Paulsson, 2003). It is meant to describe the phenomenon and answer to questions that are previously set up although the explanations behind are left out (Lekvall & Wahlbin, 2001). The descriptive form of a study is often well defined in time (Jacobsen, 2002). Whereas the assignment of this report is to construct a model, focus will partly be on explaining cause and effect-relations, something that is out of

RESEARCH DESIGN
-34-
the scope of the descriptive study direction. To map out cause and effect-relations, in other words searching for explanations behind phenomenon, are instead considered as within the frames of an explanative study. The explanative study is meant to explain connections between certain variables and further how they affect one another, and can with advantage be illustrated in a model showing causes and effects (Jacobsen, 2002). In general an explanative study focuses on the relations between a few variables, reducing the complexity compared to the descriptive study. Questions in an explorative study direction are differentiated from the ones in a descriptive study as to be more why-oriented. (Lekvall & Wahlbin, 2001) The last direction of a study, the normative study, can only be performed when there is knowledge about the system and what affects it. The purpose with this type of study is to be able to predict and make forecasts for the future to come. (Lekvall & Wahlbin, 2001) Output from a normative study is meant as material for supervising and making measures for the future (Björklund & Paulsson, 2003). But according to Lekvall & Wahlbin (2001) it is not necessary to master all the connections between causes and effects to be able to do a forecast. This direction of a study is also relevant for this assignment since the model should handle the future logistics at VLC. However it is not decided in what extent the model will be used for forecasts and likely. An important remark is that all the causes and effects do not have to be mapped out, something that will be the case of this study since appropriate limitations has to be done along the way. Above three of the four directions of a study has been identified as appropriate for this study. A combination, as mentioned earlier, is possible and it is by the researchers found as the best way of performing this study. The study directions, performed after each other, are thought of as a natural approach to the assignment. They will gradually augment the researchers’ know-ledge within the area, and together they contain all the aspects to be considered to complete the assignment and fulfil the purpose.
5.1.3 Choice of study approach As mentioned the study approaches should be chosen as to be able to come to conclusions. Two dimensions of a study, case- or cross sectional and quantitative- or qualitative, are considered in this section. A case study considers thoroughly one or a few selected cases (Lekvall & Wahlbin, 2001). The target of a case study is delimited in room and time and is an appropriate method to use when a deeper understanding of a certain phenomenon is desired. A case study is often used when the study has an explorative direction (Jacobsen, 2002) and there is no desire to make generalisations (Lekvall & Wahlbin, 2001). The cross sectional study is on the other hand a comparison between multiple cases (Lekvall & Wahlbin, 2001), studying the reality at a certain point in time and found suitable when the study has a descriptive direction (Jacobsen, 2002). This study is considering a number of variables, as mentioned in 4.4, for one target, namely VLC, which are characteristics for a case study. The variables to be considered is thought of as having a complex way of influencing each other, further favouring a case study approach according to Lekvall & Wahlbin (2001). The distinction between a quantitative- and a qualitative approach is often hard to define (Lekvall & Wahlbin, 2001). The quantitative study focuses on numeric data and should be used when interest in explaining underlying causes to the obtained data is low. Rather there should be an interest in making extensive generalisations, containing groups and situations not encountered in the actual study. (Bryman & Bell, 2003) A quantitative study is called to be

RESEARCH DESIGN
-35-
extensive since the purpose is to investigate a small number of variables over a great population. (Jacobsen, 2002). A qualitative study is based on explanations to courses of events and their development over time due to influencing variables (Bryman & Bell, 2003). This projection is used when a deeper understanding is desired and when the possibility to make generalisations is of less importance (Björklund & Paulsson, 2003). The qualitative study has an intensive approach, investigating several variables for a small population (Jacobsen, 2002). A qualitative approach is often used in exploratory studies with case study approach (Lekvall & Wahlbin, 2001). Since this is a single case study and since lack of time and resources make numerical analyses impossible this study will have a qualitative approach.
5.1.4 Establishment of Assignment decomposition As a final step in the planning phase three assignment decompositions have been composed. As mentioned in Chapter 4 the total scope of this research is divided into three parts. In the two first parts the model and the manual is created and afterwards comes the part where the manual is to be tested trough a mini-scenario. The result of this process is further explained in Chapter 6, 9 and 11. Before setting the examination questions and work processes for finding the answers to them a literature research in scenario planning and modelling was done. The research in scenario planning gave a good foundation to constructing a work process and decomposition of this assignment. van der Heijden (1997) and Lindgren & Bandhold (2003) both speak of methods for how to work with scenario planning in a structured way and much of their ideas have been used for this assignment. Further have Shell’s and MIT’s scenario projects been studied in order to create ideas on how to build a scenario, especially when the mini-scenario was to be created. Those two scenario projects, the one from Shell and the other one from MIT, were already known at VLC and it was the supervisors there that gave as recommendation to study them in order to maybe find something to benchmark. The other two sources, van der Heijden (1997) and Lindgren & Bandhold (2003), was found at the library when using the search word scenario. Different sources considering modelling were used in order to find a suitable course of action when constructing a model. Those were found at the library using modelling as search word and also by revising other reports where different models were to be created. When establishing the assignment decomposition a lot of concern has been on the time and resources available. Also the fulfilment of validity and reliability has been kept in mind when the plan for how this assignment should be completed was created. Thereby was it inserted in the plan how data was to be collected, how interviews were to be conducted, how documentation was to be done and similar aspects.
5.1.5 Sources of error in the Planning stage According to Lekvall &Wahlbin (2001) the biggest error that may occur in the planning stage is that the purpose is not carefully thought out and clearly formulated. In this report the purpose is very shortly formulated which makes it a source of risk for the reader’s personal interpretation, which may not be the same as the researchers’. Such a short and poorly detailed purpose makes it at the same time easier to fulfil. The purpose of this report is to “construct a model that indicates how a certain set of variables affect VLC’s performance in the future” so to fulfil it only a model which includes a random number of variables and in some way indicates how the logistics at VLC will be affected in the future need to be constructed. There are no indications on how the model will be used, how detailed it ought to be, if there should be about three-four variables or a hundred of them, in what way the performance are to be affected and so on.

RESEARCH DESIGN
-36-
Another source of error is forgotten directives. There is a risk that directives that actually exist have accidentally been left out in this report. This might make the reader confused and pose questions and criticism that actually are not justified. If aspects and perspectives in the analyse have been left out it might be an actual error made by the researcher but it might also be the supervisors at VLC who have given directives to only follow certain perspectives and if such a directive accidentally has been left out in the introduction chapter the reader might have objections. In the planning stage a pre-study is done in order to be able to define the actual assignment and to set up a research method. As discussed earlier this pre-study has an explorative direction. By an exploratory direction the researchers will attain a certain level of knowledge, which is needed to decompose the problem and pose the right questions to complete the assignment (Björklund & Paulsson, 2003). In this research much time has been used in order to get a deep understanding about the assignment and VLC’s situation before defining the assignment but still there is a risk that information has been left out and the assignment definition has another twist than what the employer had hoped for. When decomposing the assignment there is a risk that the way to reaching the end result become tricky and twisted. It is easy to lead into sidetracks and to loose focus of what really is relevant. Another source of error concerns the theories used to create the assignment decom-position. Like every time references are used there is always the question whether or not the sources are reliable and relevant for the assignment. The relevance of the sources is even harder to be sure of in the planning stage since the researchers then have not got the exact image of what the research will result in. In this report, in order to make the scarlet thread shine through, the decomposition and the underlying references have been changed whereas the research has proceeded. This has resulted in a more relevant decomposition and frame of references than the one in the draft report.
5.2 Performing stage In what the researchers refer to as the Performing stage the data collection, specified in the previous stage, was performed. All the data collected was gathered in a so called database for further analysing. According to Lekvall & Wahlbin (2001) there are no defined way of how to put together the collected data and how to interpret and analyze it; this should rather be adapted to the specific study. This stage is visualised as the bottom and the beginning of the right side of the U-model in Figure 5-1 on page 32.
5.2.1 Data collection Data that is collected directly by the researcher is called primary data (Lekvall & Wahlbin, 2001). Primary data is gathered for the specific study and can for example be in the form of interviews and observations (Jacobsen, 2002). Secondary data is collected by someone else than the researcher and is therefore mainly used for another investigation (Jacobsen, 2002). All written material, such as books and articles, that the researcher uses for his/hers investi-gation is secondary data (Björklund & Paulsson, 2003). Secondary data is often of great use for a study, and sometimes it is the only material needed for a study, whereas it is very unusual that a study is based only on primary data (Lekvall & Wahlbin, 2001). Data collected throughout this study are both primary and secondary. Primary data is for example collected by interviews, which is discussed further on in this section together with methods for secondary data collection.

RESEARCH DESIGN
-37-
Interviews Bryman & Bell (2003) mentions structured, semi-structured and unstructured interviews as different forms of interviews. Apart from the approach chosen it is also important to select the persons to be interviewed carefully and to conduct the interview under appropriate circum-stances, considering as well the context of the interview and the questionnaire as the behaviour of the interviewer. Bryman & Bell (2003) states six sources as the most prominent for errors during interviews, which can increase the validity of a research and should be considered when to choose the appropriate interviewing method:
• A poorly worded question. • The way the question is asked by the interviewer. • Misunderstanding on the part of the interviewee. • Memory problems on the part of the interviewee. • The way the information is recorded by the interviewer. • The way the information is processed, either when answers are coded or when data are
entered in the computer. A structured interview follows questions that are constructed in advance and posed in a defined order by the researcher (Björklund & Paulsson, 2003). Predefined alternatives for responding, which simplifies the coding and analyze of answers, can be used (Lekvall & Wahlbin, 2001). By having predefined questions and answers two of the sources of error mentioned above will be reduced, expectantly increasing the total validity of the research. If predefined answers are not used, it is of great importance that the answers given from different respondents can be easily compiled. Structured interviews are often used for quanti-tative studies. (Bryman & Bell, 2003). The semi-structured interview is held considering certain questions, but the order of them is not predefined. In comparison with a structured interview the questions are more general and there is room for formulating extra questions during the interview to follow up interesting tracks. The semi-structured interview is frequently used within the frames of a qualitative study. (Bryman & Bell, 2003). The unstructured interview resembles a conversation (Björklund & Paulsson, 2003). It has a predefined theme, often called an interview guide, and is often used in qualitative studies. Both the semi-structured and the unstructured interviews are flexible and depend on what the interviewee considers as important. To be able to address more specific issues in a qualitative study the researcher should choose a semi-structure interview (Bryman & Bell, 2003). An interview can be conducted in person, individually or in group, or over the telephone. It can also take form as an inquiry. To decide convenient forms of interviewing for a specific study, time and other scarce resources should be taken into consideration. The subject of the interview also has an impact on the form of interview to use; sometimes it is of significance to be able to note how the respondent acts during the interview, and if needed to support with further explanations etcetera, yet sometimes it is more important that the respondent are not affected by the researcher. The information given to the respondent before the actual interview and the attitude of the researcher are additional factors that affect the respondent. (Björklund & Paulsson, 2003). The way of registering the information can affect the quality of the outcome. By using a recorder all information will be registered, but with possible negative consequences on the interviewees’ way of answering. If only notes are taken under an interview the answers might

RESEARCH DESIGN
-38-
come more unhindered from the respondent, but it is more probable that the interviewer might miss important information than when a recorder is used. (Jacobsen, 2001). As a researcher it is also central to be able to confirm that the questions to be used during an interview cover the total area of interest for the study and further that the questions are posed in a specific but not leading manner. (Bryman & Bell, 2003). It is hard to define how long an interview should be, but it is recommended to last for between one hour and one hour and a half. To long interviews are tiring and has negative effects on both the interviewer and the interviewee. (Jacobsen, 2002). In this study different kinds of interviews have been carried out. Mostly have there been about one hour long unstructured interviews where there has been a theme to discuss but no strict questions set up. The fact that the interviews have last only one hour is both a result by lack of time in the interviewee’s schedule and knowledge that longer interviews might only lead to inconsiderate answers. When different aspects of the same questions were sought a more semi-structured interview was conducted where the questions was composed before the first person was interviewed. The other persons then had the exact same questions to answer. All of the interviews have been held in person except one that was conducted via email. Only the interviews with the supervisors have been held in group, all of the others individually. The registration of the interviewees’ answers has been made written, as both of the interviewers have taken notes on a piece of paper. Those notes have then been documented into a word document right after the interview took place in order not to forgive anything of interest.
Selection The selection of interviewees is made on certain criteria. Criteria such as a random sampling, using the typical respondent or focusing on the extremities in a population are mentioned. If it is not possible to distinguish any criteria of this art on beforehand a chain method for selection can be convenient to use. (Jacobsen, 2002). The chain method for selection, also called a snowball selection, is a method where the researcher initially focus on a few selected respondents, from whom he/she get in contact with other persons that will be of interest for the study. (Bryman & Bell, 2003). A selection of convenience is another method mentioned in the context of selection. This selection is based on which respondents that is available to the researcher at the time of the study. Simultane-ously it can also take into account economical-, time and practical issues. (Lekvall & Wahlbin, 2001). These characteristics for a selection can also appear as integrated in other criteria mentioned above. (Bryman & Bell, 2003). The number of respondents used for a study is a compromise between the time and money available to the researcher. On the same time the number should be adapted to the purpose of the study and its direction. The focus on generalisation when conducting a quantitative study initiates the use of a much greater number of respondents in comparison with a qualitative study. (Lekvall & Wahlbin, 2001). In this study the method for selection of interviewees has been a mixture of the snowball selection and selection of convenience. When interviewing one person he/she has recom-mended another one to speak to or another source of information. In that way a chain has been built up, but in order to widen the perspectives the researchers have wanted to look for information even outside this chain. This has been done with regard to fulfilling a certain level of generalisation and validity of the research.

RESEARCH DESIGN
-39-
Since there has been a limitation in time and financial resources the researchers have been forced to only use those respondents that have been available. Therefore have focus been on persons within VLC. External experts at the Linköping University and the Chalmers University of Technology have also been interviewed. They were selected because of their interest and knowledge in the actual subject and because of the ease to reach them at a convenient time and place.
Written material Secondary data is found in all types of written material. The library at the Linköping University, HumSam and other branches at the university such as the TekNat library have been used. Their searching engine, Libris, has been used to search for books, ancient theses as well as articles in journals. Like wisely the University library in Gothenburg and its searching engine, Gunda, has been used. Search words have been TPL, modelling, scenario, scenario planning, logistics, logistic management, strategic management, automotive industry, core values and KPI. Further has information concerning the different scenario agendas, variables and driving forces been found using search words that had to do with each of them, e.g. environment and congestion. Only material that has seemed reliable and convenient for this assignment has been chosen. The articles used come from journals where the articles need a certain level of academical elevation to be published, or at least a certain level of research accuracy and reliability.
5.2.2 Sources of error in the Performing stage This study is qualitative, but if there had not been limitations in time and resources one would have been able to do a more quantitative research where more calculations and wider surveys in form of questionnaires and likely could have been performed. In this study focus has instead been on finding the most relevant sources of information to be able to draw as realistic conclusions as possible. Since there has been a limitation in time and financial resources the range of people to interview has been scarce. It has not been possible to interview the very true world leading experts in every area but within the available range the most relevant persons have been chosen. People outside VLC have been interviewed in order to widen the perspectives. Other conclusions might have had been drawn if other interviewees or more of them had been interviewed. During the interviews notes have been taken by at least one, and many times, two inter-viewers. Those notes have then been documented in word files. Because of this method of registration there is a risk that information told by the interviewees has been neglected along the way. Additionally is there a risk that the answers from the interviewees have been mis-understood and/or noted incorrectly. Those kinds of error are difficult to prevent and may lead to incorrect conclusions. Still this method has been used since the researchers have found it to be the best alternative. Because of the use of unstructured, rather short interviews information might have been left out since the interviewee have been able to talk about other items then the actual subject and therefore had not have time to explain what actually was relevant. When it comes to the written sources of information a lot of articles have been used. Since many of those articles come from the same journal or at least journals focusing on the same business area there is a risk that one author have been heavily influenced by another. If articles from both of those
RESEARCH DESIGN
-40-
authors then have been used there is a risk that the thoughts behind come directly or indirectly from the same source. Such a chance would affect on the validity in such a way that what was thought of as to be two different sources motivating the same aspect now actually is only one. Those kinds of hidden influences among authors are difficult to find and may be prevented by choosing articles from totally different journals that the researchers have tried to do.
5.3 Completion stage In the final phase, in this report referred to as the Completion stage, the conclusions from the study shall be drawn and discussed (Lekvall & Wahlbin, 2001). The quality of the results and possible errors of interpretation shall be analysed (Jacobsen, 2002). Depending on the art of the study this stage can also imply that the researcher present his/her recommendations to the client (Lekvall & Wahlbin, 2001).
5.3.1 Model completion and report writing In this stage the final model has been created and tested by a mini-scenario. Much focus has been on forming a model that is not too complex but still reaches a certain level of validity. Connections inside the model have been motivated carefully both using sources within VLC and external ones. Collected data has also been used to classify the connections so that only the most relevant ones are included in the model. Because of the complexity in a business’s environment connections can be found between almost every impacting component in its surrounding but in order to make the model usable only the most important connections have been sorted out. This has been done in discussions with the supervisors at VLC as well as by analysing other collected data. When the report was written much force has been used in order to prevent misunderstanding from the reader. Since the model created implies such complexity the researchers have tried to find a structured way of explaining it. Only those connections, targets, agendas, variables and driving forces that have been sorted out in the analysing phase have been presented in the report. Those that have been left out are not mentioned because there would then have been an augmented risk of confusing the reader. When the connections were to be explained only those from free-standing variables were first declared. After all of those had been stated the connections from variables that had already been connected to either another variable or a scenario agenda were explained.
5.3.2 Sources of error in the Completion stage There is a risk of having left out connections, targets, agendas, variables and driving forces that are relevant. Again this is due to the level of complexity that has been tried to be mapped out in the model created in this study. Since the people at VLC have a very good insight in their business and its environment they have been asked many times to verify the analyses being made. Further have PEST analysing and Porter’s five forces been kept in mind in order to decrease the risk of leaving out important aspects of VLC’s business environment. Although those actions have been taken the risk of having left out important aspects is impossible to prevent. In some cases where the collected information not directly touches upon the area that are to be analysed there is a certain risk of decrease in validity in the conclusions drawn from that information. Further is there a risk that many connections among variables have been left out. That could have been prevented by doing a much more complex quantitative study. One would then have been able to calculate more exactly the different changes and impacts that a

RESEARCH DESIGN
-41-
certain driving force gave rise to. That would have taken a lot of resources and time and still there would have been a risk that conclusions would have been inaccurate.
5.4 Quality of research design According to Yin (2003) there are four tests for judging the quality of a research design. These four tests are Construct validity, Internal validity, External validity and Reliability. For each of them there are a certain number of tactics to use throughout the entire research so that they can be met. (Yin, 2003). Construct validity is about establishing correct operational measures for the items being studied and also about the study to be as objective as possible. This is to minimize the researcher’s subjective judgment when collecting data. Yin (2003) exemplifies three tactics to increase the construct validity of a research. Two of those tactics are to be applied when doing the data collection and the third one in the report composition phase: (Yin, 2003).
• Use multiple sources of evidence. • Establish chain of evidence. • Have key informants review draft case study report.
It is important as a researcher to understand that the outcome is totally dependent on the data collection of the study. Thereby the quality of information collected is essential for the rest of the study. (Jacobsen, 2002). Yin (2003) states that it is important to use multiple sources of evidence, but on the same time Jacobsen (2001) appoints the difficulty to find multiple sources. Moreover is it important that the sources of evidence are independent of each other, which can be further a problem for the researcher due to limited resources. A source’s close-ness to the phenomenon is thought to be an indication of how reliable the given information is; the closer to the actual phenomenon the higher evaluated is the source. The knowledge and experience of the source as well as alternative motives of the source is aspects that also should be considered in evaluating the source. Written material is evaluated on the author’s competence and knowledge on the area or the institution where it comes from. (Jacobsen, 2001). Throughout this entire research multiple sources have been used in order to motivate the analyses being done. Information has been collected both through literature research and interviews. Much information comes from the supervisors at VLC wherefore they have been identified as key informants and have read the draft report at several occasions. The initial objective of this study is to analyse what external and internal parameters affect VLC’s performance. Therefore has it been set up a certain number of targets that measure the performance. This has been done in discussion with VLC in order to find the most suitable performance indicators for their specific activities. Throughout the data collection the studied targets have been kept in mind and information have been selected to only touch upon those targets. When articles have been sought search words have been either the actual target or something in close relation to the target. Sources that have been used have mostly been found in different journals where the authors of the articles often are researchers at different universities. Moreover have experts in certain areas been identified and interviewed and websites from different reliable organisations such as the European Union have been used. When sources have been sought there have been a strive for finding independent sources. Sources that refer to another one that has already been taken in consideration have been disregarded in order to gain independency among the

RESEARCH DESIGN
-42-
sources. Though is it in most cases impossible to know whether or not an author have been influenced by another one without directly refer to him or her. Such hidden dependency among sources might exist and is very hard to avoid. Since the data collection has been done in order to fulfil independency, reliability and multiplicity, and the draft report have been read by key informants, a certain level of construct validity has been built up. The Internal validity means that there have to be an agreement between the researcher’s observations and the theories he or she brings out of the research. There is disunity among researchers whether or not the validity is relevant for a qualitative study since validity mostly touches on measuring. (Bryman & Bell, 2003). However, if the research is an exploratory one there are some important factors to have in mind so that the internal validity can be met. The internal validity concerns the problems that can arise in the data analysis phase and Yin (2003) therefore stresses the importance of having a plan for analyzing before starting. One tactic to use to improve the internal validity is pattern matching, where the researcher compares an empirically based pattern with a predicted one. (Yin, 2003). Internal validity mainly concerns quantitative studies and as this study only consists of qualitative analyses the internal validity need not to be fulfilled. Though has it been kept in mind during the beginning of the study when the best method for the research was to be found. Theories were sought concerning how this kind of research had been done earlier. The method set up for this scenario project has been compared to other similar projects in order to see what result has been generated in those projects. This was done to see what kind of result could be expected from this study’s method. The External validity concerns whether or not the study’s findings can be generalized, and can be hard to attain when doing a case study. Yin (2003) claims that a case study can rely on an analytical generalisation, which means that the investigator is trying to generalize a certain set of results instead of the total findings. Two tactics can be applied in the research design phase: (Yin, 2003).
• Use theory in single case studies. • Use replication logic in multiple case studies.
Since this research heavily focuses on VLC it can only partly be generalized. It takes VLC’s activities into concern and centre of attention is the driving forces affecting their logistic system. Many of those driving forces are global and affect other companies as well, and thus there will be a certain level of generalisation in this study result. It has therefore been important to use external sources such as articles and experts outside the Volvo Group to verify conclusions and analyses drawn from studies and interviews at VLC. In order to further fulfil the external validity similar cases dealing with scenarios have been studied and been questioned and analysed in a repeated way so that the conclusions drawn from each of them considered had the same approach. Whereas the different validities handle the problem of how to measure the right things, the reliability concerns the difficulties of measuring them in a right way (Yin, 2003). To fulfil the reliability, which is necessary to be able to attain the different types of validity (Bryman & Bell, 2003), there is a need for the researcher to prove that the different operations of a study can be repeated and generate the exact same result (Yin, 2003), in other words be stable (Bryman & Bell, 2003). Therefore it is important to document all the procedures and to make
RESEARCH DESIGN
-43-
as many steps as standardized as possible. Two tactics for strengthen the reliability: (Yin, 2003).
• Use case study protocol. • Develop case study database.
Reliability is especially an issue in quantitative studies (Bryman & Bell, 2003) and can be decreased due to factors such as the personal state of an interviewee and other situational factors (Lekvall & Wahlbin, 2001). Before the data collection and the analysing started a planning report was composed. That report contained the introduction, purpose, frame of reference and the decomposition of the assignment and also a plan for which data was to be collected and the methods for collecting it. Through discussions with the supervisors at VLC a plan for which people to interview and what to discuss with whom was composed. All of this preparation, especially the planning report, is to be seen as a case study protocol and contains many of the aspects which are mentioned by Yin (2002), that is an introduction, purpose and a plan for the data collection. Further has data collected throughout the entire study been saved in folders in what can be seen as a database. Interviews have been transcribed to word documents and saved and other sources such as articles have been carefully referred to in order to make clear where different data come from. The sources have been documented in detail so that the readers of this report have a got chance to find the same material.

-44-
-45-
6 ASSIGNMENT DECOMPOSITION Create Model
In this chapter the first part of the assignment, Create Model, is presented. This part is divided into six steps, which will be briefly introduced in the first section. Each step is then decomposed into questions and appropriate methods as to answer them in separate sections.
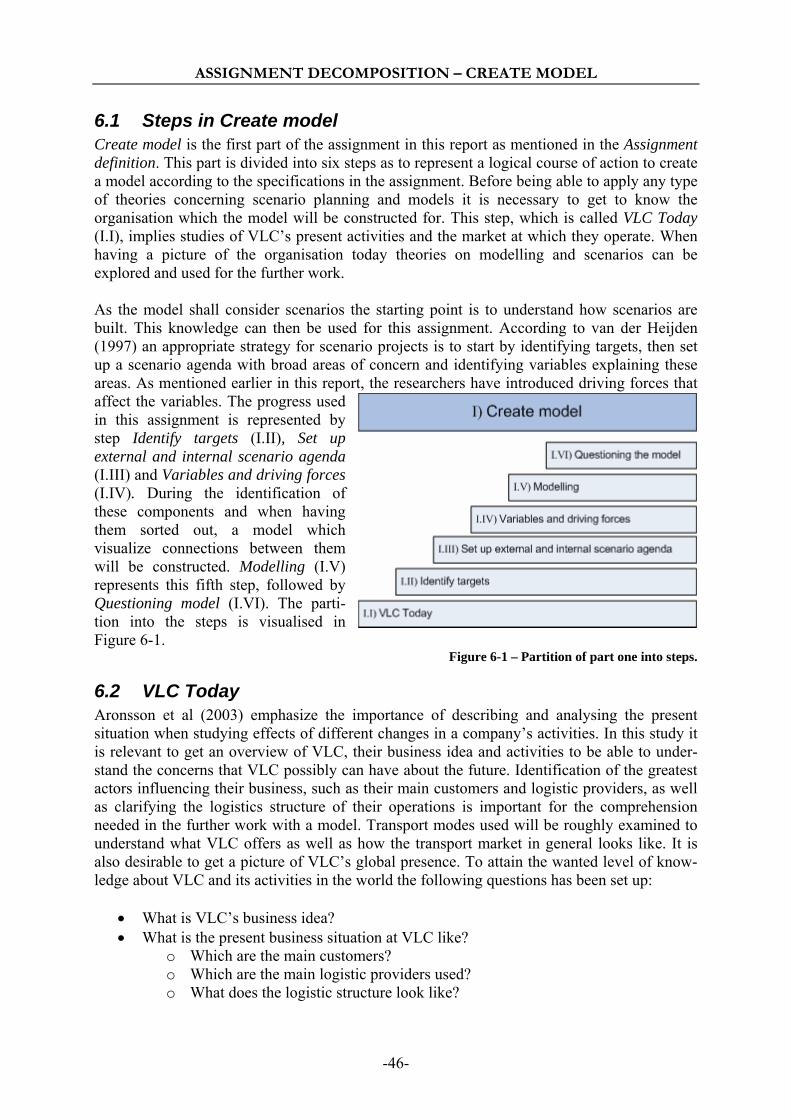
ASSIGNMENT DECOMPOSITION – CREATE MODEL
-46-
6.1 Steps in Create model Create model is the first part of the assignment in this report as mentioned in the Assignment definition. This part is divided into six steps as to represent a logical course of action to create a model according to the specifications in the assignment. Before being able to apply any type of theories concerning scenario planning and models it is necessary to get to know the organisation which the model will be constructed for. This step, which is called VLC Today (I.I), implies studies of VLC’s present activities and the market at which they operate. When having a picture of the organisation today theories on modelling and scenarios can be explored and used for the further work. As the model shall consider scenarios the starting point is to understand how scenarios are built. This knowledge can then be used for this assignment. According to van der Heijden (1997) an appropriate strategy for scenario projects is to start by identifying targets, then set up a scenario agenda with broad areas of concern and identifying variables explaining these areas. As mentioned earlier in this report, the researchers have introduced driving forces that affect the variables. The progress used in this assignment is represented by step Identify targets (I.II), Set up external and internal scenario agenda (I.III) and Variables and driving forces (I.IV). During the identification of these components and when having them sorted out, a model which visualize connections between them will be constructed. Modelling (I.V) represents this fifth step, followed by Questioning model (I.VI). The parti-tion into the steps is visualised in Figure 6-1.
Figure 6-1 – Partition of part one into steps.
6.2 VLC Today Aronsson et al (2003) emphasize the importance of describing and analysing the present situation when studying effects of different changes in a company’s activities. In this study it is relevant to get an overview of VLC, their business idea and activities to be able to under-stand the concerns that VLC possibly can have about the future. Identification of the greatest actors influencing their business, such as their main customers and logistic providers, as well as clarifying the logistics structure of their operations is important for the comprehension needed in the further work with a model. Transport modes used will be roughly examined to understand what VLC offers as well as how the transport market in general looks like. It is also desirable to get a picture of VLC’s global presence. To attain the wanted level of know-ledge about VLC and its activities in the world the following questions has been set up:
• What is VLC’s business idea? • What is the present business situation at VLC like?
o Which are the main customers? o Which are the main logistic providers used? o What does the logistic structure look like?

ASSIGNMENT DECOMPOSITION – CREATE MODEL
-47-
These are questions that are somewhat pre-study examination questions which are to be answered before the real examination begins. They are questions that are out of the scope of this research so the target of this report is not to answer these questions. Method I.I Material given by VLC, homepages and Volvo’s intranet will be searched for this informa-tion. Then primarily the supervisors at VLC will be interviewed as to answer remaining questions. The interviews will be unstructured, leaving space for eventual follow-up questions. If certain questions can not be answered by the supervisors they will be asked to recommend other persons within the organisation which can be of help, according to the snow-ball selection.
6.3 Identify targets Once having a picture of VLC today the creation of the model begins. The purpose of this report is to “…construct a model that indicates how a certain set of variables affect VLC’s performance in the future.” Performance mentioned there is though a very wide and diffuse expression which can be measured in different ways, and therefore must be specified for this assignment. Logistic activities can be measured in a number of ways and as for a company like VLC where the main activity is logistics there might be even more aspects to look upon when considering performance. Therefore is there a need to examine what aspects of future logistics that are the most convenient for VLC’s business situation. This examination will generate a certain set of targets that are to be included in the model. What is determined as the targets has a great impact on choosing incoming components for a model. The targets of the model, i.e. what should be measured about the future logistics, must therefore be appointed at this initial stage to enable decisions concerning the incoming variables. This is something that van der Heijden (1997) also suggests as one of the first actions in scenario projects. He continues by mentioning the business idea as a source of success factors for a company. At VLC as well as within the entire Volvo Group there are some core values that are followed up continuously (Hvittfeldt, 2007). Those will be examined in order to find out if they are suitable to be included in the model. Further will there be an examination considering whether or not there may be other performance indicators that ought to be included. Examination questions for this step will be:
• Which will be the targets of the model in this report? o What are the core values at VLC? o Which ones, if any, of those are suitable for this model? o Are there other performance indicators that might be important to take into
consideration in the future? Method I.II To be able to decide what should be the targets of the model the authors of this report will search through the information already given about VLC. Also information in literature and journals about success factors in general for TPL providers will be searched for as to identify targets that are important in the future but that are not at the moment considered within VLC. The researchers own conclusions about which the appropriate targets for the model are will then be discussed with the supervisors. The supervisors’ opinions will be taken into account when deciding the final targets of the model. According to van der Heijden (1997) strategists are often involved in scenario projects since it is very useful when mapping out strategies. To verify that the right targets has been set up an unstructured interview with, preferably, some-

ASSIGNMENT DECOMPOSITION – CREATE MODEL
-48-
one who has not taken part in this discussion and who is familiar with VLC’s strategies will be held.
6.4 Set up external and internal scenario agenda The next step, after selecting the targets of the model, is to identify important broad areas in the business environment that affect the targets, the so called external scenario agenda. The reason for setting such an agenda is to create focus on certain areas and disregard from information that is of secondary importance in relation to the chosen targets (van der Heijden, 1997). To find the appropriate external agenda an examination of the greatest threats and hinders in VLC’s business environment need to be done. Also areas of concern mentioned in other sources of information will be of interest, both in order to verify the relevance in ones mentioned by VLC and to widen the perspective in order to make the model more general. Besides the external scenario agenda there is also an internal agenda, which implies areas of concern inside the organisation (van der Heijden, 1997). Companies may hold a concern not only of what is happening in its surrounding but also what occur in the organisational structure, the business concept or other aspects on which the managers of the company have a certain impact. Because the internal agenda is going to be VLC specific most of this examina-tion will be done within the organisation. Only aspects that impact on the decided targets will be chosen. Examination questions for finding the external and internal agenda are therefore:
• Which are the areas in the business environment of which VLC holds a great concern? • What seem to be the main areas of concern for companies similar to VLC? • Which are the most important areas of concern within the organisation?
Method I.III As proposed by van der Heijden (1997) these areas are identified through discussion with the management of a company. Most familiar with the subject at VLC is the supervisors of this report, who in their project Vision 2015 & Beyond have identified areas which affect the organisation. Therefore, by studying documents within that project and discussing with the supervisors the scenario agendas, external as well as internal, will be set up. The external agenda set up will also be motivated by external sources in order to make the conclusions more general. Also the internal agenda will be motivated by external sources but since they are to be VLC specific the main focus will be on the information given by VLC.
6.5 Variables and driving forces Identification of variables and driving forces can be seen as a decomposition of the scenario agenda into components that can be considered in scenarios. First the variables, as the content of the areas defined in the scenario agenda, will be identified. Driving forces are then identi-fied as to trigger changes in these variables. The personnel at VLC are very familiar with what aspects that influence on their performance, but in order to widen the perspectives a bit information should also come from external sources. Further it is important that the variables and driving forces that are identified is named in accordance with the vocabulary used within VLC.

ASSIGNMENT DECOMPOSITION – CREATE MODEL
-49-
• For each scenario agenda, which are the incoming variables? o What aspects do VLC claim to be incoming variables? o What seem to be the incoming variables according to external sources?
• For each of the incoming variables, what seem to be the underlying driving forces? o What seem to be the driving forces according to VLC o What seem to be the driving forces according to external sources?
Method I.IV It would be easy to identify many variables and driving forces as explaining the scenario agenda at a more specified level. But during this identification process it is important to keep focus on VLC’s targets and the closest surroundings affecting them. All variables and driving forces identified should be relevant for VLC and the model. To be able to use the model it is also important to reduce the complexity as much as possible, something that has to be done without loosing credibility. PEST-analysis and Porter’s five forces of competition will be kept in mind when identifying the variables and driving forces. Once again documents written in the project Vision 2015 & Beyond will be reviewed. These documents will give a picture of what VLC on their own has identified as important parameters, but necessary is also to use other sources of information. By using other sources the authors of this report will be able to identify important variables and driving forces that VLC missed due to their inability to look outside old patterns. This is one of the directives from the supervisors since they want people with fresh eyes to come with new input for the work to progress. Once the supervisors are satisfied with what has been found, meaning that the number of variables and driving forces according to VLC covers the important areas and are defined on a level that can be generalised, this search will be ended. VLC claim that it is their decision to make when this has been fulfilled since this search otherwise could continue endlessly, not contributing further to the model. The most appropriate names for the different variables and driving forces will be decided upon in discussion with the supervisors for this assignment. It is important that the chosen name reflects the content of the component as well as it easy to understand for the people within VLC.
6.6 Modelling When having performed the four steps explained above, targets for VLC has been identified and the business environment’s as well as the organisation’s direct impact on those targets has been examined. The external impact in relation to the internal actions creates the total affect on the targets. This interaction between internal and external impact on the targets is what should be visualized in the model, an interaction that according to van der Heijden (1997) symbolizes the testbed for the strategic discussion. Left to study are thus if there are any connections between the identified variables, between different scenario agenda themes and between variables and scenario agendas for those variables and driving forces that are already connected to another scenario agenda theme. Once having information both considering the business environment and internal actions that affect the targets the visualisation of the model can start. This is a crucial part of the assignment since it is of great importance to find, except for individual variables impact on the targets, the connections that can contribute to an impact on the targets.
• Which connections can be found between variables? • Which connections can be found between scenario agendas?

ASSIGNMENT DECOMPOSITION – CREATE MODEL
-50-
• Are there any connections between variables and scenario agendas that have not already been taken into consideration?
Method I.V By studying the concept behind TPL providers and their factors for success a picture of what is affecting general targets for their organisations is identified. Literature considering TPL providers will be studied and the internet will be searched for information in this context. Once the authors of this report has found these general factors an adaptation to VLC’s organi-sation and identified targets will be selected as to take part in the model. Since the information found and the adaptation to VLC can be incorrect this must be verified with someone more familiar with VLC possibilities and capability to act. Once again the supervisors will be consulted. To be able to find connections between the different components that will be part of the model the researchers will do a thorough study, starting at the targets and working its way out to the variables and driving forces. Literature and articles will be revised to identify connec-tions. To be able to see the gradually growing model and the structure of it a conceptual model will be drawn on a big paper. During the progress new connections will be found and drawn in the model and every connection will be questioned when new information is discovered. The model is at this stage constantly changing and it is not impossible that some variables and driving forces that have been set up will be clustered if it is inappropriate to distinguish them from each other. During the process building the conceptual model the supervisors at VLC will be frequently asked for feed-back and input.
6.7 Questioning the model In this step the model will be evaluated according to the five criteria set up by Wallén (1996):
• Systematic • Validity • Efficiency • Model conditions • Generalisation
Wallén (1996) suggests that a model to be considered as a good model should fulfil these criteria, explained in section 3.3.3. Further on will the model be evaluated according to a PEST analyse and Porter’s five forces of competition described in section 3.5 and 3.6. This will be done in order to examine whether the model is covering the wide range of factors in VLC’s business environment that are stated in the PEST analyse and Porter’s five forces of competition.
• Will the model fulfil the criteria? • Does the model imply the different aspects stated in the PEST analyse and Porter’s
five forces of competition?
Method II.III Which of the criteria that is appropriate for this model will be decide by studying the explana-tions of them given by their inventor Wallén. A lot of theories considering modelling refer to simulation models. Since the model constructed here will not be able to perform simulations or such operations in the computer it is possible that some of the criteria proposed by Wallén
ASSIGNMENT DECOMPOSITION – CREATE MODEL
-51-
can not be used for questioning this model. The model will be based on qualitative reasoning for cause and effect relations, and therefore criteria involving any type of quantification can not be tested. For each of the criteria that have been found appropriate to test a method will be set up. To decide whether the model fulfils the criteria called systematic a person within the organisation that has not taken part in any of the earlier steps of the assignment should be presented to the model. After an introduction he or she should be asked to evaluate if the model seems structured in a way so that it is easy to understand. If the model is consequent and free from contradictions is up to the authors of this report and the supervisors to decide. The theoretical validity will be tested continually when constructing the model since the relevance to VLC will always be taken into account when deciding variables and driving forces. And as to the conceptual validity it will be a matter of verifying that all the terms used in the model are appropriately explained in the context. Since there has been frequent discussions with the supervisors at VLC it is reasonable to believe that everything has been defined so as to secure that they are having the same definitions as the researchers. To fulfil this criterion it should be verified that all these definitions are found in the report. The efficiency will be discussed with the supervisors. It will be kept in mind to keep the desired level of complexity even though the efficiency is to be optimised. To confirm whether all the model conditions are presented in the report will be verified by the authors. They will have to confirm on their own, in consultation with the supervisors if this is fulfilled. At the same time the scope of the model will be studied as to verify the criteria generalisation. The second part of the evaluation of the model will be done by first constructing a table containing the four different areas in the PEST analyse and add the different driving forces identified in the model. The driving forces will be added in the area that is the most convenient for each of them. Thereby will an evaluation be executed by checking that all the areas have been covered by at least one driving force. The Porter’s five forces of competition will be used in the same way, checking that there is at least one driving force contributing to each of Porter’s five forces of competition.

-52-

-53-
7 CREATE MODEL
In this chapter the result of all steps, except for VLC Today and Questioning the model, in the first part of the assignment, Create model, are presented. VLC Today is presented in chapter 2 since this background is useful to provide the reader already in the beginning of the report and Questioning the model are done in chapter 8 . The steps are presented in the same order as the decomposition given earlier, however first the external part is treated and then the internal.
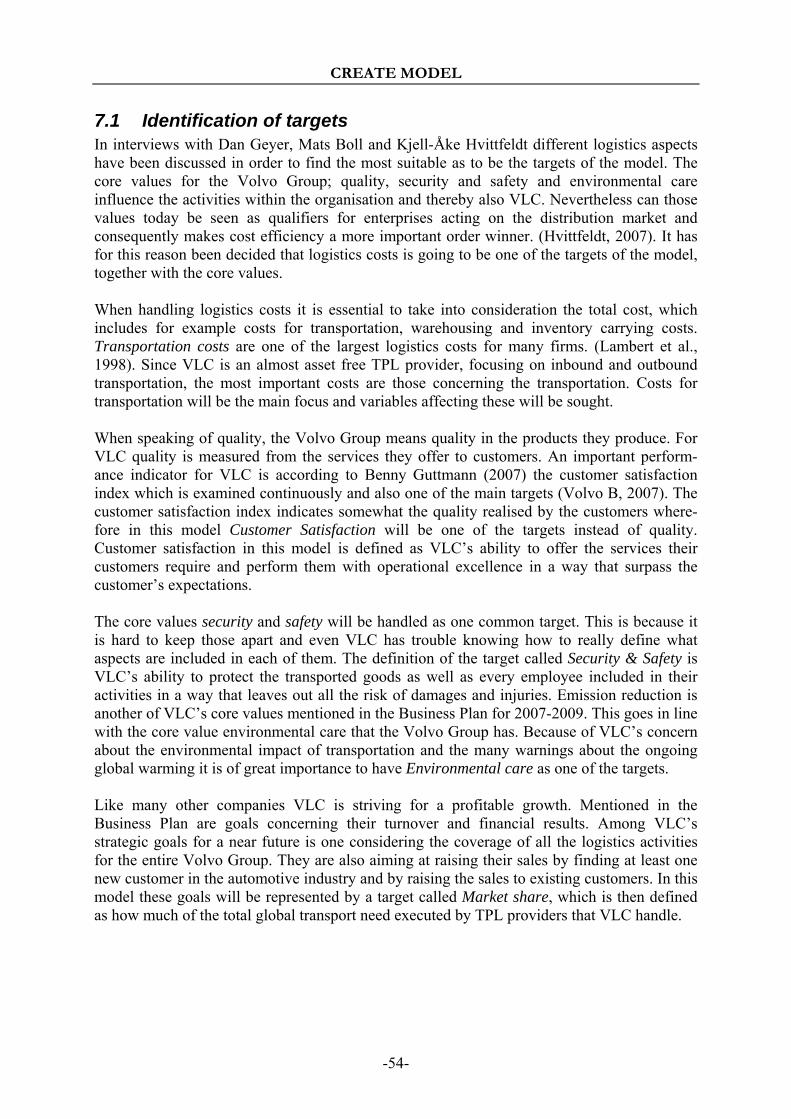
CREATE MODEL
-54-
7.1 Identification of targets In interviews with Dan Geyer, Mats Boll and Kjell-Åke Hvittfeldt different logistics aspects have been discussed in order to find the most suitable as to be the targets of the model. The core values for the Volvo Group; quality, security and safety and environmental care influence the activities within the organisation and thereby also VLC. Nevertheless can those values today be seen as qualifiers for enterprises acting on the distribution market and consequently makes cost efficiency a more important order winner. (Hvittfeldt, 2007). It has for this reason been decided that logistics costs is going to be one of the targets of the model, together with the core values. When handling logistics costs it is essential to take into consideration the total cost, which includes for example costs for transportation, warehousing and inventory carrying costs. Transportation costs are one of the largest logistics costs for many firms. (Lambert et al., 1998). Since VLC is an almost asset free TPL provider, focusing on inbound and outbound transportation, the most important costs are those concerning the transportation. Costs for transportation will be the main focus and variables affecting these will be sought. When speaking of quality, the Volvo Group means quality in the products they produce. For VLC quality is measured from the services they offer to customers. An important perform-ance indicator for VLC is according to Benny Guttmann (2007) the customer satisfaction index which is examined continuously and also one of the main targets (Volvo B, 2007). The customer satisfaction index indicates somewhat the quality realised by the customers where-fore in this model Customer Satisfaction will be one of the targets instead of quality. Customer satisfaction in this model is defined as VLC’s ability to offer the services their customers require and perform them with operational excellence in a way that surpass the customer’s expectations. The core values security and safety will be handled as one common target. This is because it is hard to keep those apart and even VLC has trouble knowing how to really define what aspects are included in each of them. The definition of the target called Security & Safety is VLC’s ability to protect the transported goods as well as every employee included in their activities in a way that leaves out all the risk of damages and injuries. Emission reduction is another of VLC’s core values mentioned in the Business Plan for 2007-2009. This goes in line with the core value environmental care that the Volvo Group has. Because of VLC’s concern about the environmental impact of transportation and the many warnings about the ongoing global warming it is of great importance to have Environmental care as one of the targets. Like many other companies VLC is striving for a profitable growth. Mentioned in the Business Plan are goals concerning their turnover and financial results. Among VLC’s strategic goals for a near future is one considering the coverage of all the logistics activities for the entire Volvo Group. They are also aiming at raising their sales by finding at least one new customer in the automotive industry and by raising the sales to existing customers. In this model these goals will be represented by a target called Market share, which is then defined as how much of the total global transport need executed by TPL providers that VLC handle.
CREATE MODEL
-55-
In Figure 7-1 all the identified targets are visualized. These will constitute a central part of the model. The targets are independent except Transportation costs which have a connection to Market share. This is due to the definition of Market share which in this assignment mean the part of the total TPL market that VLC has gained. The connection is explained by the fact that if VLC gain more market shares then they will ship more goods and therefore will the total costs for the transportation increase. This must not be interfered with the costs per shipped entity which are not said to increase. Further, it is not said to be equal to a decrease in the financial result or in the profitability. An increase in market share, in most cases, result in an increase in the income, but this analyse has been left out in this assignment. Scenario agendas and variables that have an impact on one or more of those will now be sought and analysed. Afterwards, the connections between the targets and the scenario agendas and variables are presented.
7.2 The external scenario agenda Within the project Vision 2015 & Beyond the supervisors at VLC has written five chapters about areas of concern considering VLC’s future on the TPL-market. These chapters are briefly introduced in section 2.2. Four of them, namely Infrastructure, Supply Chain Development, Transport Deve-lopment and Customers Business Concept, consider the external business environment. The development of the business environment is important for VLC to follow since it has a great impact on their success in the future. However it is not feasible to consider all different aspects in the business environment and a qualitative selection must therefore be conducted as to reduce the complexity. Four to five broad themes are proposed by van der Heijden (1997) as to constitute the external scenario agenda, and VLC has thus done an intern ranking as to select those areas for which they have the greatest concern. Areas that VLC wants to give extra priority to in relation to the targets identified in the previous section are determined as the external scenario agenda for the model in this report, and they are briefly introduced here. The first thing for VLC to consider is their customers, also referred to as OEMs in this report. The customers are mostly active within the automotive industry, and their strategies and acivities has a strong impact on VLC. (Boll, 2007). The OEMs choice of production site will for example be of importance to consider for VLC since it is essential for them to be present and acquire a network at eventual new locations. (Volvo B, 2007). Also to be able to satisfy the changing requirements that OEMs has puts pressure on a TPL provider (Boll, 2007). To catch OEMs’ changes that have an impact on VLC OEMs’ behaviour are chosen to take place on the external scenario agenda. Another area that has a great impact on companies today is legislations, and further development and stricter restrictions are to be seen in many areas (Boll, 2007). Many of the laws that VLC needs to consider are closely related to their core values; security and safety, environmental care and quality. Legislations considering emissions, road taxes, security and safety etcetera must be followed by a TPL provider and are by this reason important steering functions in VLC’s organisation (Boll, 2007). Continuously changes in legislations and regulations globally as well as on a regional basis, hereafter named legislations, is a concern for VLC as a globally present TPL provider since they must keep track of and follow laws at
Figure 7-1 – The identified targets.

CREATE MODEL
-56-
different locations. Changes put pressure on VLC and the transport providers that they use. (Boll, 2007; Geyer, 2007). Legislations are thus identified as a theme on the external scenario agenda. Transportation all over the world is increasing, and in many regions to an extent that the infra-structure can not handle according to VLC. Congestions in ports, on roads etcetera that are of interest for VLC’s activities are identified. (Volvo B, 2007). Since congestions already today affect VLC’s performance, and there is nothing in the near future seen to heave this negative development, it is important to pay attention to congestions. (Boll, 2007). Congestions are therefore part of the external scenario agenda. Dan Geyer and Mats Boll (2007) are of the opinion that it is important that Congestions in this model does not only refer to traffic-jam and likely, but all kinds of disruptions in flow of goods. Security and clearance controls can cause such disruptions (Boll, 2007; Geyer, 2007). The critical question about energy sources in the future is discussed within the EU as well as within the project Vision 2015 & Beyond. In the plan of action for energy efficiency released by the European commission (2006) it is stated that there are a concern about the augmenting need of importing energy to the union and the global supply of fossil fuels. The transport sector consumes approximately one fifth of the total energy, whereof 98 percent are fossil fuels (European Commission, 2006). Fuel is identified as one of the areas of concern that VLC will give extra priority to. Boll (2007) says that development within the fuel-area is necessary in a near future. So far customers and three areas in the business environment that has an impact on TPL providers in general has taken place on VLC’s external scenario agenda. However to come closer to VLC the specific market must be considered. Three different actors on VLC’s market, all having an impact on VLC in the future are identified; customers, logistic providers and competitors. (Boll, 2007; Geyer, 2007). So far customers has been discussed, however the other two will now be treated. The logistic providers are the ones that VLC contract as to perform the actual transport. Their behaviour has a major impact on VLC’s offer, whilst they also can be seen as a potential competitor. The offer will be further discussed in relation to the internal part of the model in section 7.5, whereas the logistic provider as a potential competitor will be considered here. If a transport provider changes its strategy towards a more independent business, not using VLC as a connection to the customers, they become a threat to VLC’s business. (Boll, 2007). The development of transport providers is though not the only source of competition that VLC faces. The already existing competitors and possible new entrants on the market must be considered as well (Porter, 2004). The competition on the market that VLC faces in the future is considered within External Competition on the scenario agenda. According to Mats Boll and Dan Geyer (2007) it is of great importance to pay attention to all the existing and potential competitors’ movements on the market to prevent being pushed out of the market in the future. In Figure 7-2 the areas selected as to be part of the external scenario agenda is visualized. Still in the Vision 2015 & Beyond-documents other aspects in the business environment that has an impact on VLC in the future are
Figure 7-2 – External scenario agenda.
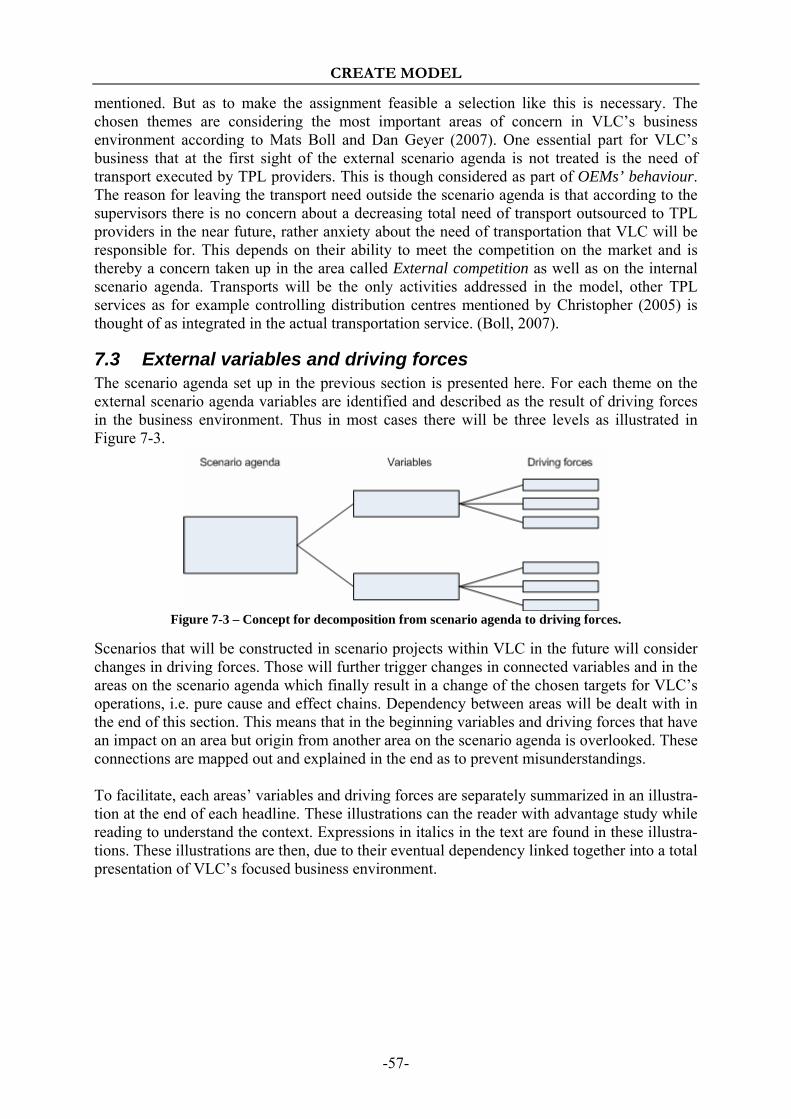
CREATE MODEL
-57-
mentioned. But as to make the assignment feasible a selection like this is necessary. The chosen themes are considering the most important areas of concern in VLC’s business environment according to Mats Boll and Dan Geyer (2007). One essential part for VLC’s business that at the first sight of the external scenario agenda is not treated is the need of transport executed by TPL providers. This is though considered as part of OEMs’ behaviour. The reason for leaving the transport need outside the scenario agenda is that according to the supervisors there is no concern about a decreasing total need of transport outsourced to TPL providers in the near future, rather anxiety about the need of transportation that VLC will be responsible for. This depends on their ability to meet the competition on the market and is thereby a concern taken up in the area called External competition as well as on the internal scenario agenda. Transports will be the only activities addressed in the model, other TPL services as for example controlling distribution centres mentioned by Christopher (2005) is thought of as integrated in the actual transportation service. (Boll, 2007).
7.3 External variables and driving forces The scenario agenda set up in the previous section is presented here. For each theme on the external scenario agenda variables are identified and described as the result of driving forces in the business environment. Thus in most cases there will be three levels as illustrated in Figure 7-3.
Figure 7-3 – Concept for decomposition from scenario agenda to driving forces.
Scenarios that will be constructed in scenario projects within VLC in the future will consider changes in driving forces. Those will further trigger changes in connected variables and in the areas on the scenario agenda which finally result in a change of the chosen targets for VLC’s operations, i.e. pure cause and effect chains. Dependency between areas will be dealt with in the end of this section. This means that in the beginning variables and driving forces that have an impact on an area but origin from another area on the scenario agenda is overlooked. These connections are mapped out and explained in the end as to prevent misunderstandings. To facilitate, each areas’ variables and driving forces are separately summarized in an illustra-tion at the end of each headline. These illustrations can the reader with advantage study while reading to understand the context. Expressions in italics in the text are found in these illustra-tions. These illustrations are then, due to their eventual dependency linked together into a total presentation of VLC’s focused business environment.

CREATE MODEL
-58-
7.3.1 Why does OEMs behave as they do? OEMs have an impact on TPL providers since it is their strategies and requirements that have to be met. How the OEMs handle their logistic activities, where their production and market is located and which requirements they pose are what VLC and other TPL providers must conform to. Three variables in OEMs’ behaviour are distinguished by VLC as to have an impact on them, namely OEMs’ manufacturing concept, OEMs’ logistics concept and OEMs’ service requirements. These variables will initially have an impact on the need of transport executed by TPL providers, which moreover is the source for VLC’s business. The transport need executed by TPL providers is a result of OEMs’ behaviour, whether they decide to outsource or not and how much goods they need to transport and which distances, and thus there is a connection between Transport need executed by TPL providers and OEMs’ behaviour, which will be visualized later on in this chapter. OEMs’ behaviour as a concern identified as to take place on the external scenario agenda is primarily related to VLC’s ability to meet the requirements that OEMs pose.
OEMs’ manufacturing concept OEMs’ manufacturing concept refers to the strategies OEMs within the automotive industry have for their production. In particular the location of production in relation to suppliers and customers are of interest for VLC. It has a great impact on OEMs’ total transport need and is crucial information as to judge whether VLC is present at the right locations and further indicates opportunities for expansion (Boll, 2007). From where OEMs purchase and where their customers are located is in this report thought of as integrated in the manufacturing concept. From VLC’s perspective purchasing, manufacturing and selling strategies first and foremost is a question about localisation of suppliers, production and markets, since it is the distances that arise between them that are the source of their business. Manufacturing strategies have gained most focus here since the OEMs are believed to be more powerful than the suppliers and can thereby affect them in many of their decisions (Geyer 2007). As con-cerning the customers and their location, VLC do not see them as necessary to use in their model because of their in many cases known behaviour following global business prerequisites. (Boll, 2007; Geyer 2007). According to MacCarthy (2003) there are multiple factors that affect the decision of location for a manufacturer. Costs, labour characteristics, economic factors, proximity to markets/ customers, quality of life, and social and cultural factors are the major factors having an impact on this decision (MacCarthy, 2003). These factors are also important in this context since the location of production in relation to suppliers and customers affect the transport need. But according to the supervisors some factors are too specific to consider for VLC which will use them in another purpose. So as to meet the request of simplicity and adaptation to VLC and their purpose the authors of this report have chosen to reorganize and rename some of the factors given by MacCarthy (2003). The supervisors judge costs and proximity to markets/customer as straightforward factors also for VLC as a TPL provider, wanting to study the transport need in the future instead of the optimal production site. Costs, which refers to labour costs, manufacturing costs, land costs etcetera, are the top decision criteria when choosing production location (MacCarthy, 2003), wherefore Low-cost countries is chosen as a driving force. In the same way the proximity to markets/customers mentioned by MacCarthy (2003) gives the model in this report the driving

CREATE MODEL
-59-
force Proximity to markets/customers. By taking the proximity to customers into considera-tion, the location of customers earlier discussed as to create a need of transport is integrated in the decision of production location. Labour characteristics, quality of life and social and cultural factors in brief refer to the quality of the labour force and their attitude and motivation to work, further how the society is built up and which norms that exists (MacCarthy et al., 2003). According to Baldwin et al. (2001) the industrial revolution creates a widespread change and technical progress in many industries, which further causes increases in incomes and change in trading behaviour, something that the authors of this report mean characterizes changes in the three factors mentioned by MacCarthy et al. (2003). Industrialisation changes the society and its citizens’ behaviour due to new technologies, higher incomes and different trade behaviour as stated by Baldwin et al. (2001). In a strive for reducing the complexity of the model while also adapting it to VLC, Industrialisation will be chosen as driving force instead of the three factors. The last factor, the economical, also having an impact on the location of production, refers to tax structure and tax incentives, inflation, strength of currency against US dollar and so on (MacCarthy et al., 2003). Wälde & Wood (2004) write that a society with lower trade barriers has increased imports and exports, in other words according to the researchers changes in economical factors such as strength against US dollar and tax incentives affect the world trade. World trade is thereby chosen as a driving force for the location of production and further OEMs’ manufacturing concept. Moreover World Trade reflect supplier, production and market locations since it reports the trade between different nations, and if closely studied can be broken down into a trade network within a certain industry. Four of the factors mentioned in MacCarthy et al.’s report (2003) have thus been adapted to the model in this report. The authors of this report means that two driving forces, World Trade and Industrialisation, in this context better represents these four factors as they reduce the complexity and are easier to relate to when considering the transport need. By using World Trade as a driving force the authors of this report also means that they catch the geographic distribution of suppliers, production and customers within the automotive industry. Accept for the localisation issues, changes in production system will trigger a change in transport need. Europe has gone from a typical make-to-stock system to a flow production system, which further is considered as one of the greatest reasons for the increasing need of transport. (European Commission, 2001). Change in the production system contributes to a mismatch in demand and supply of transports since the demand is finely-divisible and the supply is lumpy (D’Este, 1996). Nowadays it is considered as less accepted to have stocks within the production, and thus the production system is not prepared for any bigger fluctuations in demand. The performance of a production system relies on its supply chain (Coronado Mondragon et al. 2006). Production system is therefore chosen as a driving force.
OEMs’ logistics concept With the variables and driving forces triggering a total transport need, identified as primarily dependent on OEMs’ location of production and their production system, VLC as a TPL provider must consider the need of transport that will be outsourced to TPL providers. Not all OEMs outsource their logistics activities and thus should not be part of the need of transports executed by TPL providers which VLC competes for. OEMs’ logistics concept refers to how OEMs handle the need of transports that they have and is a variable for OEMs’ behaviour.
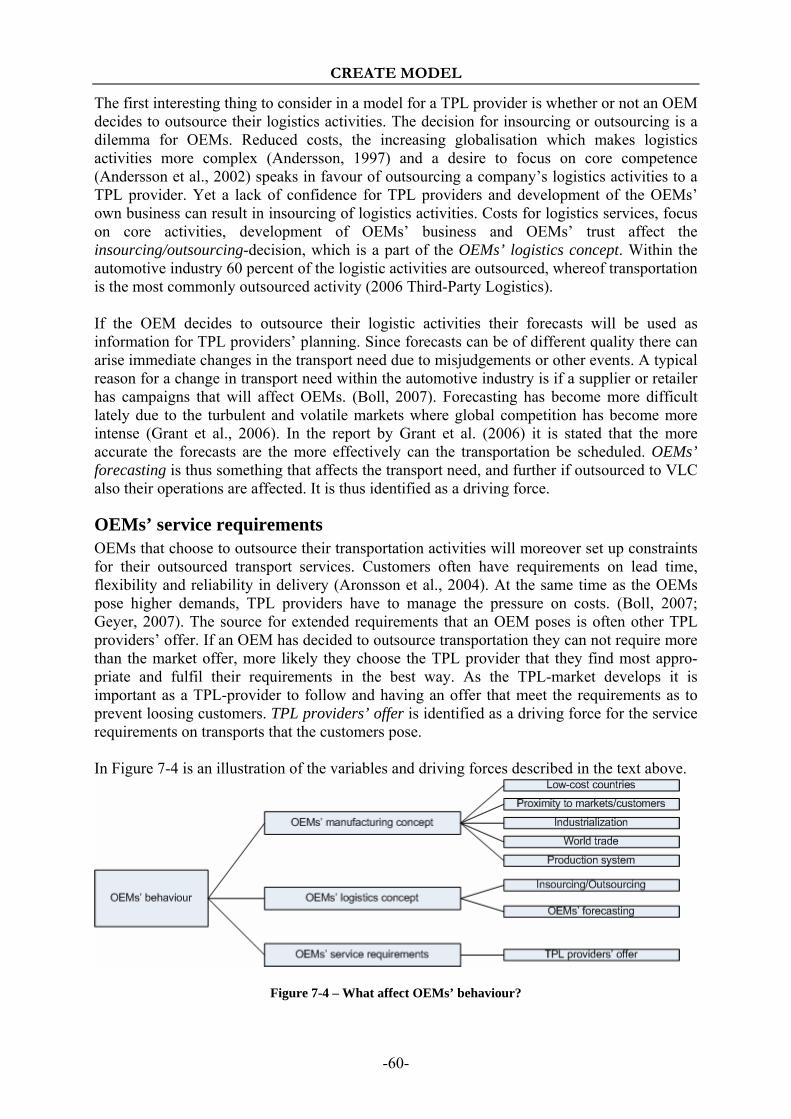
CREATE MODEL
-60-
The first interesting thing to consider in a model for a TPL provider is whether or not an OEM decides to outsource their logistics activities. The decision for insourcing or outsourcing is a dilemma for OEMs. Reduced costs, the increasing globalisation which makes logistics activities more complex (Andersson, 1997) and a desire to focus on core competence (Andersson et al., 2002) speaks in favour of outsourcing a company’s logistics activities to a TPL provider. Yet a lack of confidence for TPL providers and development of the OEMs’ own business can result in insourcing of logistics activities. Costs for logistics services, focus on core activities, development of OEMs’ business and OEMs’ trust affect the insourcing/outsourcing-decision, which is a part of the OEMs’ logistics concept. Within the automotive industry 60 percent of the logistic activities are outsourced, whereof transportation is the most commonly outsourced activity (2006 Third-Party Logistics). If the OEM decides to outsource their logistic activities their forecasts will be used as information for TPL providers’ planning. Since forecasts can be of different quality there can arise immediate changes in the transport need due to misjudgements or other events. A typical reason for a change in transport need within the automotive industry is if a supplier or retailer has campaigns that will affect OEMs. (Boll, 2007). Forecasting has become more difficult lately due to the turbulent and volatile markets where global competition has become more intense (Grant et al., 2006). In the report by Grant et al. (2006) it is stated that the more accurate the forecasts are the more effectively can the transportation be scheduled. OEMs’ forecasting is thus something that affects the transport need, and further if outsourced to VLC also their operations are affected. It is thus identified as a driving force.
OEMs’ service requirements OEMs that choose to outsource their transportation activities will moreover set up constraints for their outsourced transport services. Customers often have requirements on lead time, flexibility and reliability in delivery (Aronsson et al., 2004). At the same time as the OEMs pose higher demands, TPL providers have to manage the pressure on costs. (Boll, 2007; Geyer, 2007). The source for extended requirements that an OEM poses is often other TPL providers’ offer. If an OEM has decided to outsource transportation they can not require more than the market offer, more likely they choose the TPL provider that they find most appro-priate and fulfil their requirements in the best way. As the TPL-market develops it is important as a TPL-provider to follow and having an offer that meet the requirements as to prevent loosing customers. TPL providers’ offer is identified as a driving force for the service requirements on transports that the customers pose. In Figure 7-4 is an illustration of the variables and driving forces described in the text above.
Figure 7-4 – What affect OEMs’ behaviour?

CREATE MODEL
-61-
7.3.2 Which legislations have an impact on VLC? It exist many legislations in our society that have an impact on how transports shall be conducted. Those legislations consider for example speed limits, alcohol consumption, how different types of goods shall be handled and which external activities that must be performed when transporting from one point to another, especially when crossing nation borders. Many laws originate in anxiety about security and safety, but lately also care about the environment has become an important influencer. Geerlings & Stead (2003) writes that the European Union, EU, has the ambition to integrate environmental issues into other policy areas. Integrating decisions of land use planning, transport and environmental policy are necessary for sustainable development (Geerlings & Stead, 2003). In this report the theme Legislations on the scenario agenda has been divided into three different types of legislations. The legislations to be considered are those related to Security and safety, Environment and Charges, and refer to legislations in the business environment that VLC and other transport companies must follow and thus having an impact on VLC’s targets. Legislations within Security and safety implies laws that are set up as to safeguard the security and safety of persons as well as the transported goods, the Environment legislations as to protect the environment and Charges those laws that primarily results in a cost for the practitioner. Each type of law is triggered by a number of driving forces in the business environment, whereof the most important out of VLC’s perspective is introduced in the model.
Security and safety Within the EU 40 000 persons is killed in traffic each year. To reduce traffic accidents and augment the safety stricter legislations is founded. More severe consequences and regular controls are also introduced, in hope to decrease the misfortunes. (European Comission, 2001). One recent attempt in trying to reduce accidents on the roads, are the stricter limits for drivers hours in service (Hvittfeldt, 2007). Clearly the number of accidents triggers stricter legislations, Reduce accidents is therefore identified as a driving force. Reduce accidents will in this context refer to all types of accidents, human mishaps as well as material damages and destruction. Lately a new threat to transports and trading has arisen, which has extended the procedure of custom clearances. The terrible act of terror in the United States, 9/11, made vehicles targets for brutal criminality. As to protect humans and goods against these crimes in the future in particular the United States has pronounced increased demands for security controls of goods as necessary. Just recently the United States put forward a bill declaring that in five years all imported maritime-cargo to the United States ports should be scanned. The bill also includes requirements on air cargo. (Berman, 2007). As the bill considers all the imported goods it will have an impact on the global transport network, which has to adapt to these requirements in case of a new law. Terror is identified as a driving force that creates new laws as to increase the security and safety of the transport networks in the world. This driving force implies additional custom clearance activities.
Environment The impact on the environment that transports causes due to air pollution and noise is an increasing problem. To turn around this negative development everybody has to contribute;

CREATE MODEL
-62-
governments and legislative authorities as well as companies. (Aronsson & Huge Brodin, 2006). A lot of attention is given to the global warming, which is a result of the so called green house gases. Carbon dioxide is the main gas responsible for the greenhouse effect, and 60 percent of the humans’ impact on the greenhouse effect origins from this gas (Sathiendrakumar, 2003). In Sweden the transport sector alone stands for approximately one third of the country’s total carbon dioxide emissions. (Woxenius, 2005). Methane, nitrous oxide and carbon monoxide are examples of other gases except carbon dioxide that have an impact on global warming (Sathiendrakumar, 2003). Global warming has been chosen as a driving force for legislations considering the environment, but in this context it solely refers to emissions of carbon dioxide. Scientists does not totally agree on which gases that contribute to the global warming (Sathiendrakumar, 2003), and to avoid such a discussion here only carbon dioxide emissions are thought to result in global warming. All other emissions, green house gases or not, are considered in a driving force called Emissions. Transportation still causes more problems than the impact of emissions on the environment, noise is claimed to be such a problem (Aronsson & Huge Brodin, 2006). Noise and distur-bances in general that transports generate can result in laws as to protect the environment and its inhabitants, animals as well as humans, and will therefore be accounted for in a driving force, namely Natures sensitivity. Limits for which hours during a day that traffic are allowed are examples of this type of legislations (Boll, 2007).
Charges Both legislations considering Security and safety and Environment can secondarily result in costs for a transporting company, still there are legislations that primarily cause costs and that does not necessarily originate in anxiety about security and safety or the environment. Customs clearance, which gives governments insights about goods crossing a nation border, is obligatory commotions in transporting services (Sawhney & Sumukadas, 2005). Initially customs clearance was a process for securing that stated quantities of goods was the physical goods actually crossing the borders, and to assure that companies paid for their trading. In developing countries custom clearance still has this as primarily purpose, but yet in other regions customs clearance has become more an issue of security and safety as mentioned in Security and safety (Geyer, 2007). Customs clearance as a driving force for charges refers to the initial types of custom-related activities, which mainly was a matter of charging for goods transported across nation borders. It is though in many countries today difficult to distinguish this customs clearance-activity from the security controls triggered by anxiety about terror actions. In the White Paper (2001) it is written that an effective law-system for charges must be set up within the transport sector as to force the practitioners to pay for what they use. As it is today external costs for transportation such as infrastructural costs are not paid by the users (European Commission, 2001). In 1996 some countries within the EU introduced a fee-system, Eurovignette, which charges trucks of a certain size for using the motorway network during a certain period (McKinnon, 2006). The vignette system is a time-based toll system, (Einbock, 2006) and though the biggest deficiency is that it does not take into account the distance travelled (McKinnon, 2006; Einbock 2006). This implies that all infrastructural costs are not accounted for (McKinnon, 2006). In Switzerland, Germany and Austria so called distance-based tolls are explored, as an attempt to charge for the actual external costs. At present toll-systems is a rather unexplored domain, but it is predicted to become more important and imply more cost dimensions in the future. It is for example not impossible that
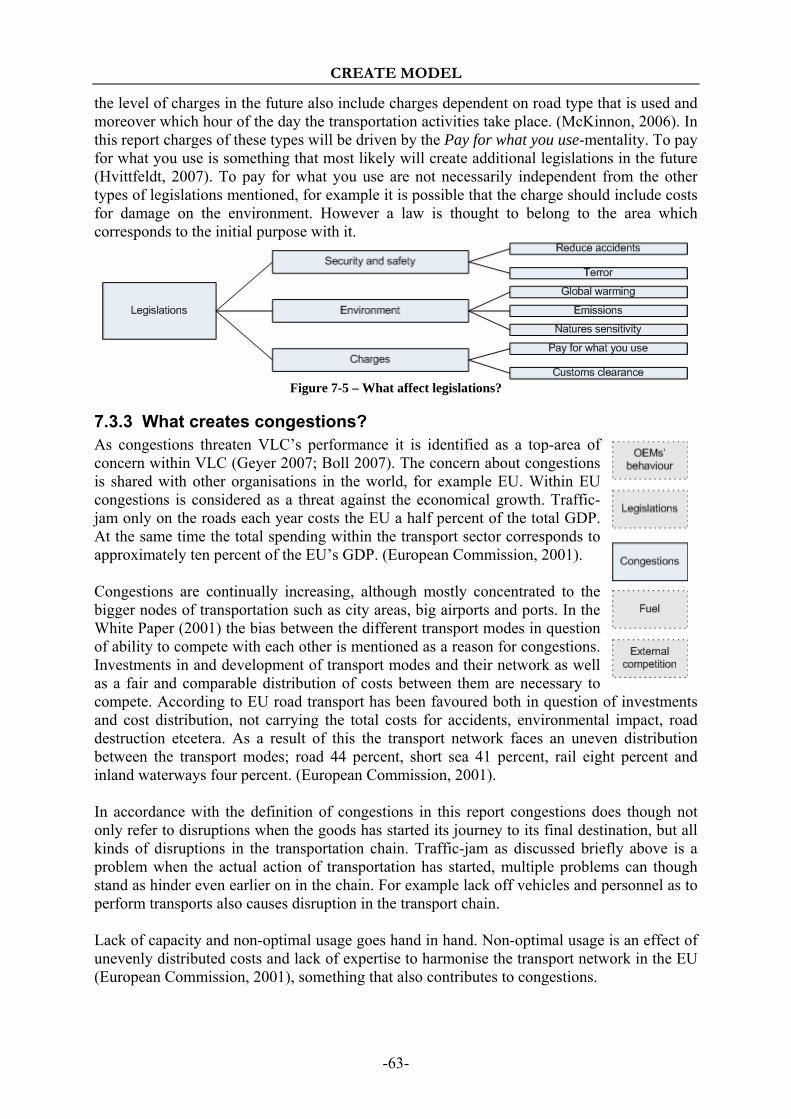
CREATE MODEL
-63-
the level of charges in the future also include charges dependent on road type that is used and moreover which hour of the day the transportation activities take place. (McKinnon, 2006). In this report charges of these types will be driven by the Pay for what you use-mentality. To pay for what you use is something that most likely will create additional legislations in the future (Hvittfeldt, 2007). To pay for what you use are not necessarily independent from the other types of legislations mentioned, for example it is possible that the charge should include costs for damage on the environment. However a law is thought to belong to the area which corresponds to the initial purpose with it.
Figure 7-5 – What affect legislations?
7.3.3 What creates congestions? As congestions threaten VLC’s performance it is identified as a top-area of concern within VLC (Geyer 2007; Boll 2007). The concern about congestions is shared with other organisations in the world, for example EU. Within EU congestions is considered as a threat against the economical growth. Traffic-jam only on the roads each year costs the EU a half percent of the total GDP. At the same time the total spending within the transport sector corresponds to approximately ten percent of the EU’s GDP. (European Commission, 2001). Congestions are continually increasing, although mostly concentrated to the bigger nodes of transportation such as city areas, big airports and ports. In the White Paper (2001) the bias between the different transport modes in question of ability to compete with each other is mentioned as a reason for congestions. Investments in and development of transport modes and their network as well as a fair and comparable distribution of costs between them are necessary to compete. According to EU road transport has been favoured both in question of investments and cost distribution, not carrying the total costs for accidents, environmental impact, road destruction etcetera. As a result of this the transport network faces an uneven distribution between the transport modes; road 44 percent, short sea 41 percent, rail eight percent and inland waterways four percent. (European Commission, 2001). In accordance with the definition of congestions in this report congestions does though not only refer to disruptions when the goods has started its journey to its final destination, but all kinds of disruptions in the transportation chain. Traffic-jam as discussed briefly above is a problem when the actual action of transportation has started, multiple problems can though stand as hinder even earlier on in the chain. For example lack off vehicles and personnel as to perform transports also causes disruption in the transport chain. Lack of capacity and non-optimal usage goes hand in hand. Non-optimal usage is an effect of unevenly distributed costs and lack of expertise to harmonise the transport network in the EU (European Commission, 2001), something that also contributes to congestions.
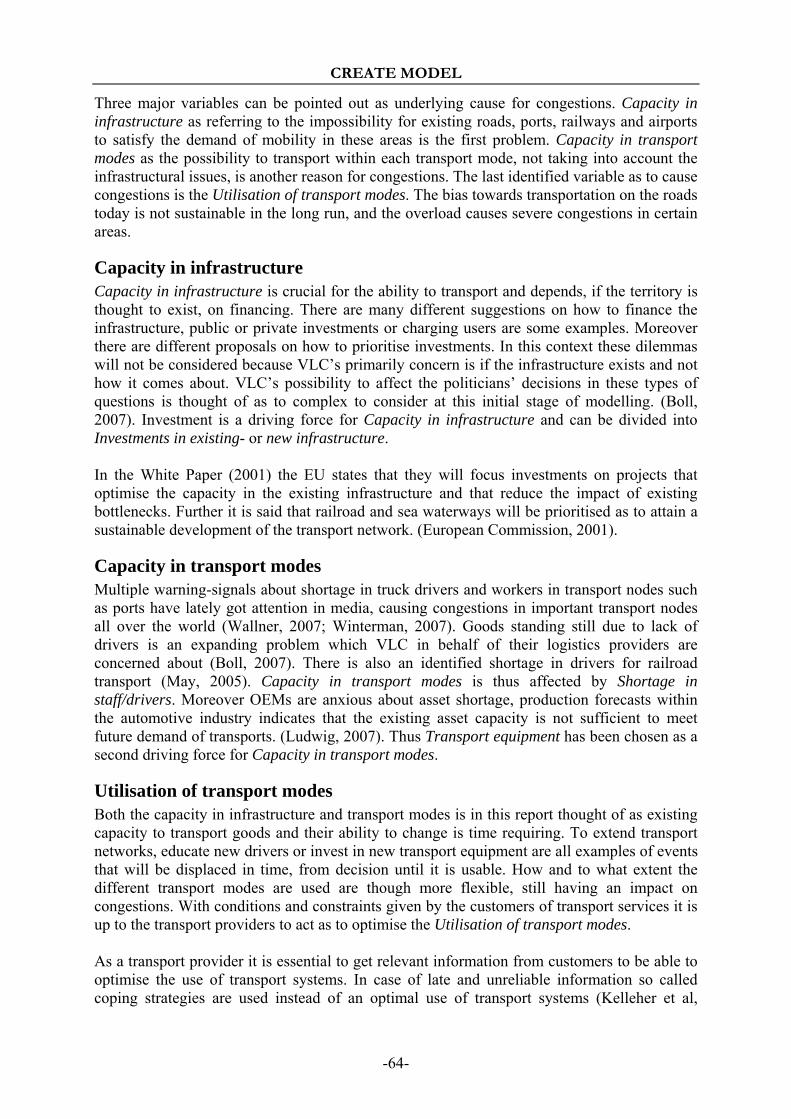
CREATE MODEL
-64-
Three major variables can be pointed out as underlying cause for congestions. Capacity in infrastructure as referring to the impossibility for existing roads, ports, railways and airports to satisfy the demand of mobility in these areas is the first problem. Capacity in transport modes as the possibility to transport within each transport mode, not taking into account the infrastructural issues, is another reason for congestions. The last identified variable as to cause congestions is the Utilisation of transport modes. The bias towards transportation on the roads today is not sustainable in the long run, and the overload causes severe congestions in certain areas.
Capacity in infrastructure Capacity in infrastructure is crucial for the ability to transport and depends, if the territory is thought to exist, on financing. There are many different suggestions on how to finance the infrastructure, public or private investments or charging users are some examples. Moreover there are different proposals on how to prioritise investments. In this context these dilemmas will not be considered because VLC’s primarily concern is if the infrastructure exists and not how it comes about. VLC’s possibility to affect the politicians’ decisions in these types of questions is thought of as to complex to consider at this initial stage of modelling. (Boll, 2007). Investment is a driving force for Capacity in infrastructure and can be divided into Investments in existing- or new infrastructure. In the White Paper (2001) the EU states that they will focus investments on projects that optimise the capacity in the existing infrastructure and that reduce the impact of existing bottlenecks. Further it is said that railroad and sea waterways will be prioritised as to attain a sustainable development of the transport network. (European Commission, 2001).
Capacity in transport modes Multiple warning-signals about shortage in truck drivers and workers in transport nodes such as ports have lately got attention in media, causing congestions in important transport nodes all over the world (Wallner, 2007; Winterman, 2007). Goods standing still due to lack of drivers is an expanding problem which VLC in behalf of their logistics providers are concerned about (Boll, 2007). There is also an identified shortage in drivers for railroad transport (May, 2005). Capacity in transport modes is thus affected by Shortage in staff/drivers. Moreover OEMs are anxious about asset shortage, production forecasts within the automotive industry indicates that the existing asset capacity is not sufficient to meet future demand of transports. (Ludwig, 2007). Thus Transport equipment has been chosen as a second driving force for Capacity in transport modes.
Utilisation of transport modes Both the capacity in infrastructure and transport modes is in this report thought of as existing capacity to transport goods and their ability to change is time requiring. To extend transport networks, educate new drivers or invest in new transport equipment are all examples of events that will be displaced in time, from decision until it is usable. How and to what extent the different transport modes are used are though more flexible, still having an impact on congestions. With conditions and constraints given by the customers of transport services it is up to the transport providers to act as to optimise the Utilisation of transport modes. As a transport provider it is essential to get relevant information from customers to be able to optimise the use of transport systems. In case of late and unreliable information so called coping strategies are used instead of an optimal use of transport systems (Kelleher et al,

CREATE MODEL
-65-
2003). According to Kelleher et al. (2003) problems in transfer of reliable information leads to unnecessary transports, which result in increased costs, additional environmental impact etcetera. Today most information is treated electronically and information technology and information systems are therefore necessary to be able to optimise the Utilisation of transport modes. IS/IT has for that reason been chosen as a driving force. The Utilisation of transport modes in a global perspective is also dependent on politics. In the White Paper (1992) EU states that in striving for a unified development of transportation the transport market must be deregulated. As a result of this it is under certain conditions allowed for a transport company to perform domestic transportation on roads in a foreign country, so called cabotage activity (European Commission, 2001). This possibility results in a more optimal Utilisation of transport modes since for example a truck does not have to go empty on its way back to its origin destination after unloading, it can stay active within the foreign country while waiting for an order of transport to return with. This is seen as cooperation within the member states in EU with the purpose to augment the utilisation of transport modes and reduce non-value adding transports. Another type of cooperation that has an impact on Utilisation of transport modes is horizontal cooperation between logistics service providers (LSPs). Horizontal cooperation is collabora-tion between companies operating at the same level. This type of collaboration between LSPs can increase the utilisation of vehicle capacity (Cruijssen et al., 2007). Collaboration has a great importance on the Utilisation of transport modes, wherefore LSP collaboration has been chosen as driving force. Many LSPs consider collaboration of this art as interesting since they believe that this can increase their customer service, still they see obstacles such as difficulties with distribution of costs and profits between the different actors (Cruijssen et al., 2007). In Figure 7-6 below is an illustration of the variables and driving forces described in relation to the area Congestions on the scenario agenda.
Figure 7-6 – What affect congestions?

CREATE MODEL
-66-
7.3.4 What changes the fuel policy? According to Reynolds (2000) the life-cycle of energy in the society can be reflected by a chain existing of four links, the so called energy utilisation chain. The following links are distinguished; energy source, energy conversion, energy consumption and energy service. The last link refers to the last step in the chain where energy is consumed as to provide services to society, transportation is an example of such a service. (Reynolds, 2000). For transportation services oil is the most prominent resource, accounting for 90 percent of the transport fuel (Aleklett & Campbell, 2003). Oil is nevertheless identified as a scarce resource, and within 30 years it is estimated by some experts that the supply will be deficient. This is though not just a problem within the transport sector; it will propagate into other areas such as the economical growth since it is dependent on the possibility to transport. (Reynolds, 2000). Supply of oil is a great issue on the transportation market as well as within welfare politics, and is chosen as a driving force for the model in this report. This driving force will refer to both the risk that there is no oil to be found and that the supply is insufficient because of lack in capacity to process oil into gasoline. Approximately 25-30 percent of the total transportation costs are due to fuel costs (Ramaswami, 2006). The price on oil is set in relation to the availability of the marginal barrel (Aleklett & Campbell, 2003). There are however many other parameters that influence the market price on gasoline that consumers such as transport companies face. In Sweden there are for example fuel duties and fees for carbon dioxide content and VAT that regulates the price (Vägverket, 1997). Surcharges on fuel accounts for an increasing share of the total transportation cost (The 3PL Origin and Evolution, 2006). Boll (2007) and Geyer (2007) among others are of the opinion that it is to cheap to transport. If the oil price were higher there would probably exist alternatives to oil since this would be an incentive for technological development of alternative fuels (Reynolds, 2000). Price on fossil fuels is a driving force for fuel policy, just as Alternative fuels. As long as there is a satisfying supply of fossil fuels to a price less than alternative fuels it is most probable that is continues to be the prime energy source within the transport sector, wherefore Aleklett & Campbell (2003) in their report states that a better system for pricing oil is to do it on costs for substitute fuels. The price shocks on oil that the world so far has experienced have shown that the society is not sensitive to its price changes. The society is still dependent on oil and has so far not prioritised advancement in technology. (Reynolds, 2000). However there are progresses within alternative fuel techno-logies, hybrids and biofuels are two advancing research areas (fuel: Diesel & Beyond, 2007). If an alternative to oil are not to be found in a near future a change in the society will most definitely be seen (Reynolds, 2000). In Figure 7-7 Fuel from the scenario agenda are visualized.
Figure 7-7 – What affect the fuel policy?

CREATE MODEL
-67-
7.3.5 What does the external competition look like? As mentioned already in the scenario agenda VLC faces competition from other TPL providers at the market as well as from transport providers in case of development of their business. Nevertheless another threat to VLC’s existence on the market is new entrants. These three groups of actors are focused within External competition.
Development TPL providers The TPL market has experienced many acquisitions, mergers and consolida-tions between TPL providers lately (2006 Third-party logistics), which has resulted in global TPL provider giants (Atkinson, 2003). This change is driven by globalisation, ability to broaden service lines and industry specialisation. Beside this development among TPL providers there is a trend among TPL buyers to reduce the number of TPL providers that they use. (2006 Third-party logistics). This development can create a threat against small TPL providers that can not meet the customers’ requirements for global presence and wide service lines. Yet some means that while the giants adapt their services to the large customers, the smaller TPL providers can compete since they can offer services to customers’ specific needs. (Atkinson, 2003). Development TPL providers has thus a great impact on the competition that VLC faces. Different TPL providers’ offer creates competition on the market which is driven by efficiency, transportation expertise and the ability to connect with customers (Seideman, 2003). Costs and quality of services are the most important factors when choosing TPL provider, followed by the range of logistics services that are offered (2006 Third-party logistics). It will be to complex to consider all the different aspect in other TPL providers’ development that can give them a competitive advantage. Therefore has only Transport solutions been selected as a driving force for Development TPL providers. The Transport solutions offered are the sum of the activities within the company, whereof VLC wants to highlight three different aspects. These components of the transport solution have been identified as especially important as for TPL providers to differentiate themselves and gain market shares in the future. Information technology has achieved increased attention on the TPL-market, it is considered as a necessary part in TPL providers’ expertise. Development of technology is accelerating and the customers expect high performance. (2006 Third-party logistics). Within VLC development of technology has been recognized as one of the three most important aspects of the transport solutions. They believe that this will become even more important for the customers in the future, and it is thereby essential to stay updated on this area (Boll 2007; Geyer 2007). IS/IT refers to the development within technology and is chosen as an important aspect in Transport solutions due to its expected importance in the future. In connection to the globalisation of the industry, focusing on new markets and moving production to low-cost countries, TPL provider’s ability to serve its customers in a global perspective has become an issue. Domestic and global TPL providers exist, but to distinguish a domestic TPL provider from a global one is not straightforward. According to Underwood (2007) a distinguishing factor is whether the provider is present in the most important trade nodes in the world and what their expertise looks like. To manage an international supply
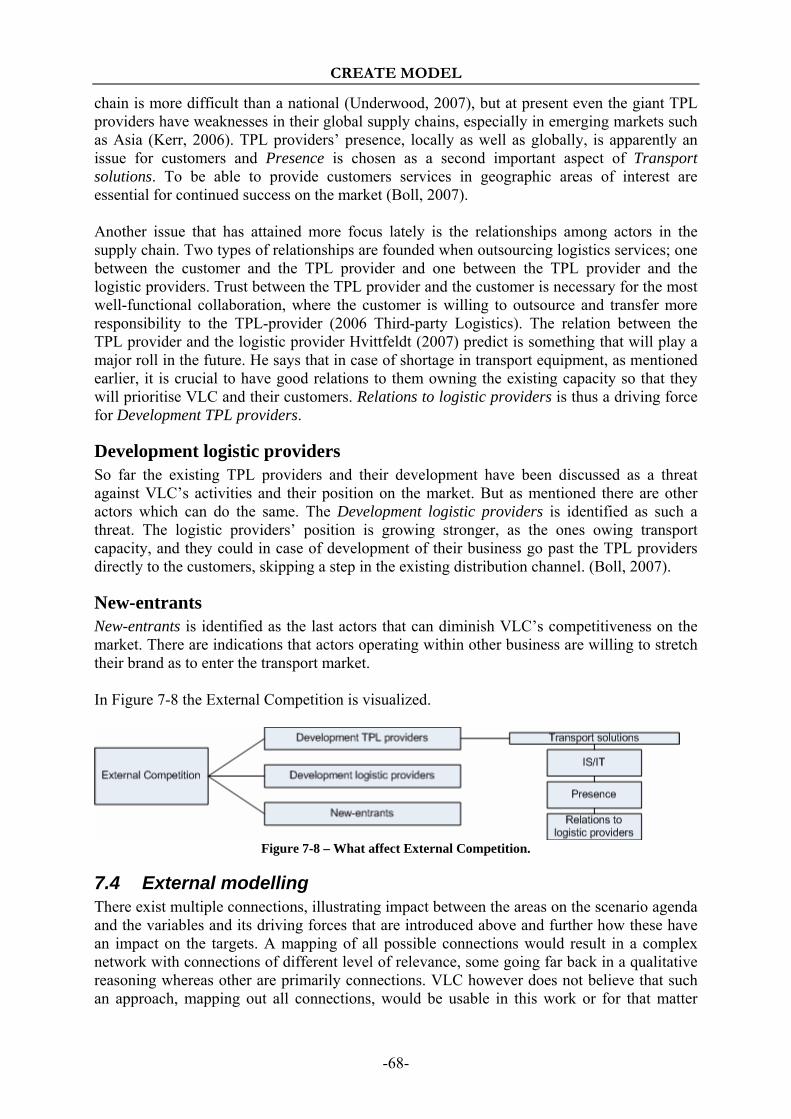
CREATE MODEL
-68-
chain is more difficult than a national (Underwood, 2007), but at present even the giant TPL providers have weaknesses in their global supply chains, especially in emerging markets such as Asia (Kerr, 2006). TPL providers’ presence, locally as well as globally, is apparently an issue for customers and Presence is chosen as a second important aspect of Transport solutions. To be able to provide customers services in geographic areas of interest are essential for continued success on the market (Boll, 2007). Another issue that has attained more focus lately is the relationships among actors in the supply chain. Two types of relationships are founded when outsourcing logistics services; one between the customer and the TPL provider and one between the TPL provider and the logistic providers. Trust between the TPL provider and the customer is necessary for the most well-functional collaboration, where the customer is willing to outsource and transfer more responsibility to the TPL-provider (2006 Third-party Logistics). The relation between the TPL provider and the logistic provider Hvittfeldt (2007) predict is something that will play a major roll in the future. He says that in case of shortage in transport equipment, as mentioned earlier, it is crucial to have good relations to them owning the existing capacity so that they will prioritise VLC and their customers. Relations to logistic providers is thus a driving force for Development TPL providers.
Development logistic providers So far the existing TPL providers and their development have been discussed as a threat against VLC’s activities and their position on the market. But as mentioned there are other actors which can do the same. The Development logistic providers is identified as such a threat. The logistic providers’ position is growing stronger, as the ones owing transport capacity, and they could in case of development of their business go past the TPL providers directly to the customers, skipping a step in the existing distribution channel. (Boll, 2007).
New-entrants New-entrants is identified as the last actors that can diminish VLC’s competitiveness on the market. There are indications that actors operating within other business are willing to stretch their brand as to enter the transport market. In Figure 7-8 the External Competition is visualized.
Figure 7-8 – What affect External Competition.
7.4 External modelling There exist multiple connections, illustrating impact between the areas on the scenario agenda and the variables and its driving forces that are introduced above and further how these have an impact on the targets. A mapping of all possible connections would result in a complex network with connections of different level of relevance, some going far back in a qualitative reasoning whereas other are primarily connections. VLC however does not believe that such an approach, mapping out all connections, would be usable in this work or for that matter

CREATE MODEL
-69-
realistic to do. On the contrary they are of the opinion that it would interfere with the main intention with the model, to get a simplified but still complete picture of the business environment. To construct a model that is easy to understand and to work with VLC wants to focus those connections that are identified as the most important and probable in the future, i.e. those that will have the greatest impact on the targets. VLC have prioritised among connections in an otherwise complex network, resulting in a network of connections adapted to their present situation and visions of the future. First and foremost VLC have chosen to prioritise the primarily connections that are the closest related to their activities. VLC prioritise to reduce the complexity of the model and if possible prevent loops. The final network shall though not be seen as static, rather something that is adaptable in case of a changed business environment. There has been a continuous discussion about which connections that shall constitute the final network in the model. Many of the connections that have been prioritised are closely related to the definitions of variables and driving forces that are introduced earlier. VLC means that during the process where these have been identified much information about eventual connections has been explored as well. As mentioned earlier only those connections that are included in the model will be presented.
7.4.1 Connections in the network From the OEMs’ point of view characteristics for each transport mode make them attractive in different contexts. Transit time is an important criterion in choosing transport mode. (Ribbink et al., 2005). Road transport has lately been favoured among customers and EU states that without rationalizing the use of different transport modes the usage of heavy trucks will increase with 50 percent from 1998 to 2010. (European Commission, 2001). Intermodal transport solutions, a process where multiple transport modes are used as to complete one delivery, are identified as efficient solutions to meet the customers’ demand (D’Este, 1996). It can thus be used as to decrease the utilisation of one particular transport mode, still meeting the customers’ requirements. TPL providers’ dilemma is just this, to satisfy the demand of transportation that OEMs poses at the same time as they optimise the use of transport modes (Boll, 2007). The ability to schedule transports to optimise the use of transport modes is as mentioned dependent particularly on TPL providers’ IS/IT. OEMs’ service requirements and OEMs’ forecasting in relation to the transport need executed by TPL providers is used as input in TPL providers’ scheduling process and can not be neglected, it has a major impact since it states the conditions and constraints. (Boll, 2007). According to Mats Boll (2007) OEMs’ service requirements is something that VLC can not overlook when optimising the usage of transportation modes, they must choose transport mode as to meet the customer requirements. Further he states that unreliable forecasts from OEMs are a hinder for optimal usage of transport modes. A fluctuating demand of transport will always be a struggle for the transport providers, and the cooping strategies that are often used when the actual transport need differs from the original will not necessary result in optimised solutions in question of use of transport modes (Boll, 2007).

CREATE MODEL
-70-
The transport need executed by TPL providers’ along with OEMs’ service requirements and OEMs’ forecasting is identified as to have an impact on Utilisation of transport modes, further having an impact on Congestions. This connection will be seen as a line between OEMs’ behaviour and Utilisation of transport modes.
Custom clearance activities have experienced high development during the last years at many borders in the world. It has gone from a labour intensive, so called paper-shuffling world, into a technological process where goods can be cleared electronically. Standardisation of custom clearance activities are a fact and it has become an area with differentiating possibilities for transport providers. (Appels & Satruye de Swieland, 1998). In many developing countries the customs-related infrastructure is though still ancient, something that causes uncertainties in the transportation chain. The customs process in these countries is considered as severe logistics barriers. It is uncertain for how long goods are stuck at such borders. (Sawhney & Sumukadas, 2005). Customs clearance is today often also an issue of security. The threat of terror actions has triggered increased security controls, such as proposed in a bill by the United States, which further creates pressure on the customs clearance activities. In the article by Berman (2007) a president of Trade Innovations stated that a law considering 100 percent scanning on maritime cargo will strain the port infrastructure in the world. Increased controls and deficient customs-related infrastructure are thus issues that cause uncertainties in the supply chain (Sawhney & Sumukadas, 2005). These uncertainties are reasons for disruptions in the transportation chain and hence it is reasonable to create a connection between Legislations and Congestions in the model. This connection is further confirmed by the fact that restrictions considering driving hours, addressed in the driving force Reduce accidents, can cause disruptions in the transport chain. More restrictive limits for driving hours reduce driver productivity (Natter, 2007) which according to the researchers results in disruptions in the transport chain if not additional drivers can raise productivity to precedent levels.
With strict governmental restrictions as to protect the environment it is possible that the transport system used today has to change. For examples restrictions for usage of certain roads or stricter laws considering emission will force transport practitioners to re-optimize the existing transport network. Therefore a connection is drawn between Environment and Utilisation of transport modes.
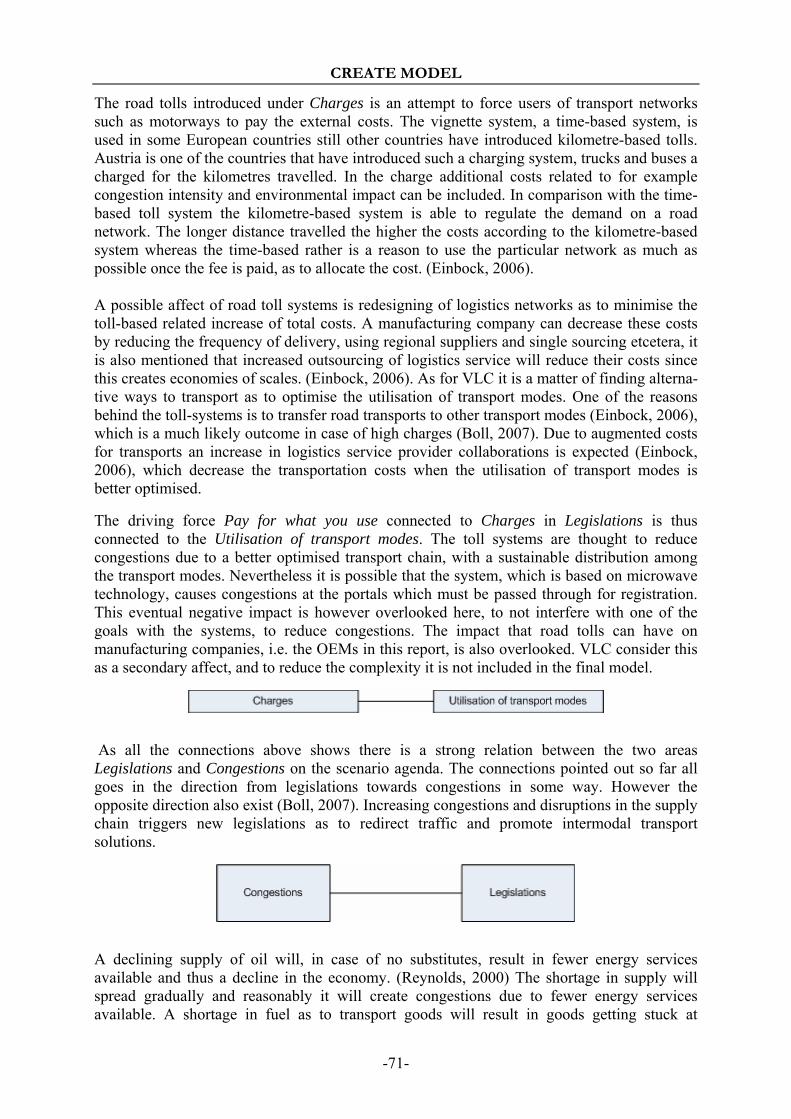
CREATE MODEL
-71-
The road tolls introduced under Charges is an attempt to force users of transport networks such as motorways to pay the external costs. The vignette system, a time-based system, is used in some European countries still other countries have introduced kilometre-based tolls. Austria is one of the countries that have introduced such a charging system, trucks and buses a charged for the kilometres travelled. In the charge additional costs related to for example congestion intensity and environmental impact can be included. In comparison with the time-based toll system the kilometre-based system is able to regulate the demand on a road network. The longer distance travelled the higher the costs according to the kilometre-based system whereas the time-based rather is a reason to use the particular network as much as possible once the fee is paid, as to allocate the cost. (Einbock, 2006). A possible affect of road toll systems is redesigning of logistics networks as to minimise the toll-based related increase of total costs. A manufacturing company can decrease these costs by reducing the frequency of delivery, using regional suppliers and single sourcing etcetera, it is also mentioned that increased outsourcing of logistics service will reduce their costs since this creates economies of scales. (Einbock, 2006). As for VLC it is a matter of finding alterna-tive ways to transport as to optimise the utilisation of transport modes. One of the reasons behind the toll-systems is to transfer road transports to other transport modes (Einbock, 2006), which is a much likely outcome in case of high charges (Boll, 2007). Due to augmented costs for transports an increase in logistics service provider collaborations is expected (Einbock, 2006), which decrease the transportation costs when the utilisation of transport modes is better optimised. The driving force Pay for what you use connected to Charges in Legislations is thus connected to the Utilisation of transport modes. The toll systems are thought to reduce congestions due to a better optimised transport chain, with a sustainable distribution among the transport modes. Nevertheless it is possible that the system, which is based on microwave technology, causes congestions at the portals which must be passed through for registration. This eventual negative impact is however overlooked here, to not interfere with one of the goals with the systems, to reduce congestions. The impact that road tolls can have on manufacturing companies, i.e. the OEMs in this report, is also overlooked. VLC consider this as a secondary affect, and to reduce the complexity it is not included in the final model.
As all the connections above shows there is a strong relation between the two areas Legislations and Congestions on the scenario agenda. The connections pointed out so far all goes in the direction from legislations towards congestions in some way. However the opposite direction also exist (Boll, 2007). Increasing congestions and disruptions in the supply chain triggers new legislations as to redirect traffic and promote intermodal transport solutions.
A declining supply of oil will, in case of no substitutes, result in fewer energy services available and thus a decline in the economy. (Reynolds, 2000) The shortage in supply will spread gradually and reasonably it will create congestions due to fewer energy services available. A shortage in fuel as to transport goods will result in goods getting stuck at
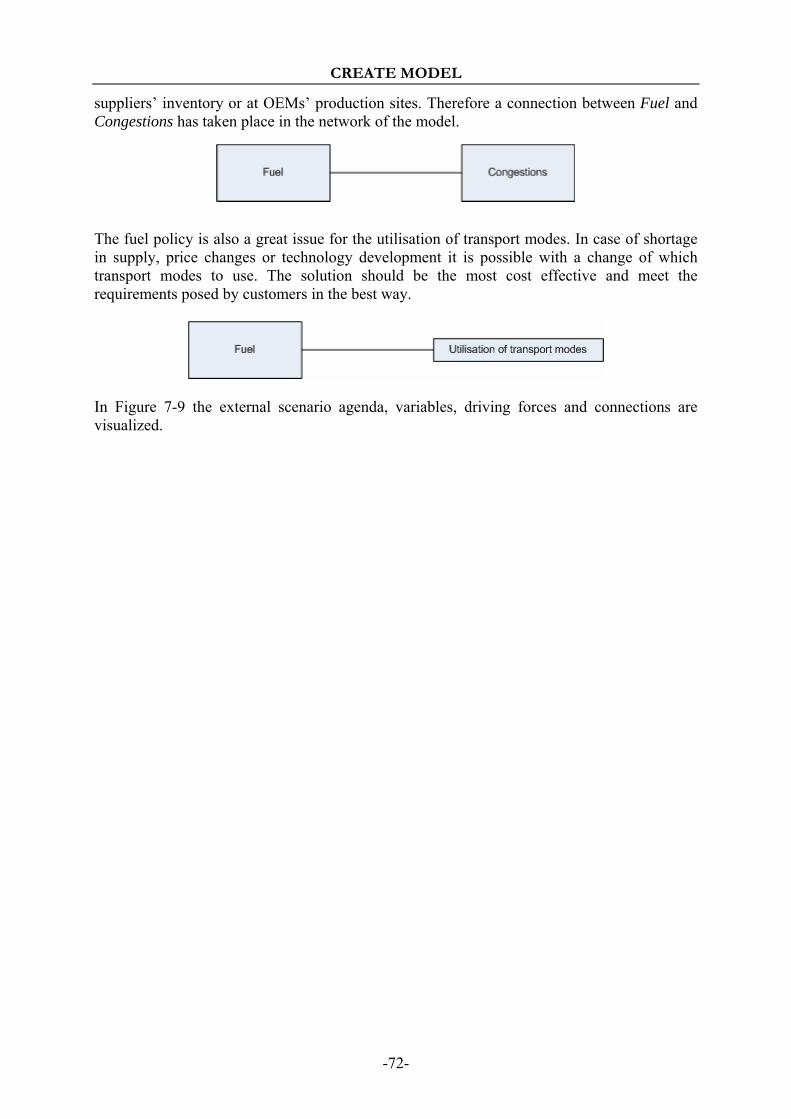
CREATE MODEL
-72-
suppliers’ inventory or at OEMs’ production sites. Therefore a connection between Fuel and Congestions has taken place in the network of the model.
The fuel policy is also a great issue for the utilisation of transport modes. In case of shortage in supply, price changes or technology development it is possible with a change of which transport modes to use. The solution should be the most cost effective and meet the requirements posed by customers in the best way.
In Figure 7-9 the external scenario agenda, variables, driving forces and connections are visualized.
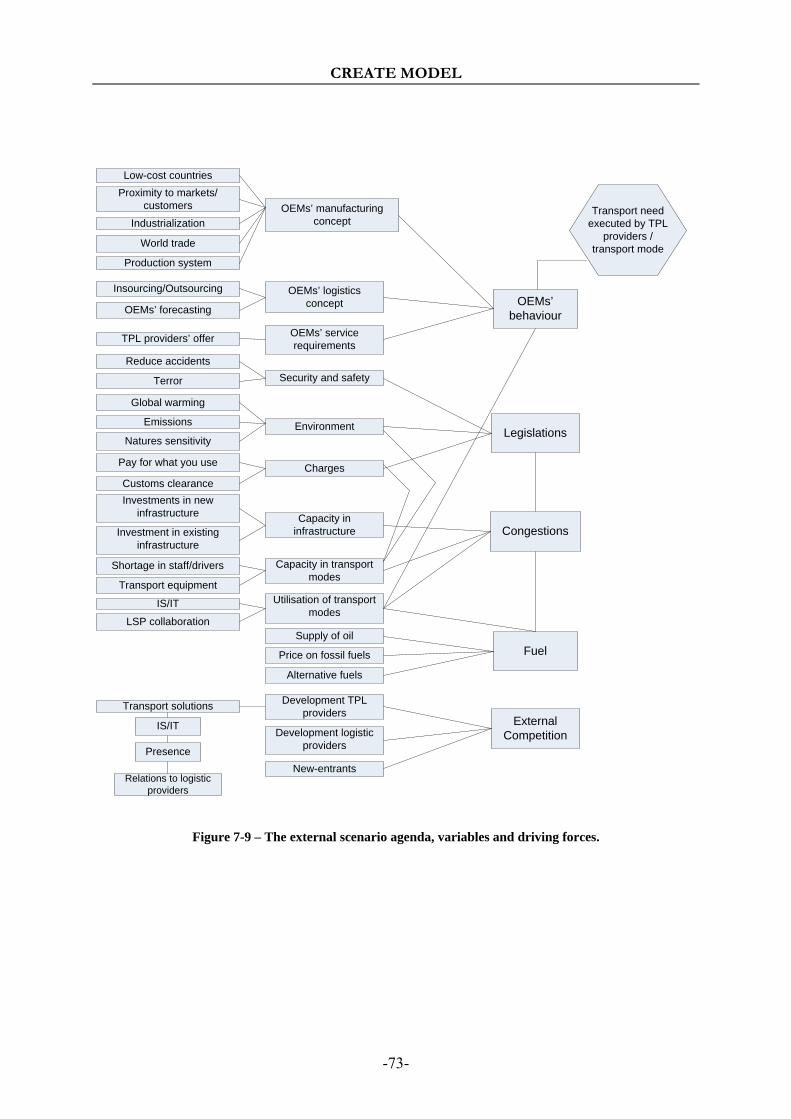
CREATE MODEL
-73-
OEMs’ logistics concept
OEMs’ manufacturing concept
OEMs’ service requirements
Low-cost countriesProximity to markets/
customers
Industrialization
World trade
Production system
Insourcing/Outsourcing
OEMs’ forecasting
TPL providers’ offer
Environment
Security and safety
Charges
Global warming
Reduce accidents
Terror
Natures sensitivity
Pay for what you use
Emissions
Customs clearance
Capacity in transport modes
Capacity in infrastructure
Utilisation of transport modes
Shortage in staff/drivers
Investments in new infrastructure
Investment in existing infrastructure
Transport equipment
IS/IT
LSP collaboration
Price on fossil fuels
Supply of oil
Alternative fuels
Development logistic providers
Development TPL providers
New-entrants
Transport solutions
Relations to logistic providers
IS/IT
Presence
OEMs’ behaviour
Congestions
Legislations
Fuel
External Competition
Transport need executed by TPL
providers /transport mode
Figure 7-9 – The external scenario agenda, variables and driving forces.

CREATE MODEL
-74-
7.4.2 Connections to targets Figure 7-9 illustrates the network of identified trends and development in VLC’s business environment that is considered as relevant in relation to the selected targets. This map thus connects to the targets in the following way.
Transportation costs According to Aronsson et al. (2004) there is a strong connection between logistics costs and logistic service. The OEMs requirements when it comes to logistic service has therefore an impact on the transports and thus a connection between OEMs’ behaviour and Transportation costs is necessary. As 25-30 percent of the total transportation costs at present is fuel costs (Ramaswami, 2006) it is further justified to connect Fuel and Transportation costs in the model. Transportation costs can also be affected due to events in the surrounding such as mentioned in Congestions, and they are thereby linked together. Congestions can for example lead to increased transit times or changes in distribution channels as to avoid bottlenecks, something that can create additional transportation costs. This target are also affected by different legislations of charges, since as stated before it is predicted that charges for transportation in the future will be a bigger part of the total transportation costs than it is today. In the model a connection between Legislations and Transportation costs shows this affect.
Customer satisfaction How VLC meet customers requirements are measured in the target Customer satisfaction, and as to be able to do this it is necessary to identify what the customers want. In OEMs’ behaviour the requirements that the customers has is addressed and therefore it is justified to have a connection from there to the target Customer satisfaction.
Security & Safety The target Security & Safety which refers to VLC’s ability to protect the transported goods and their employees are affected by different legislations considering these aspects. It is thus reasonable to draw a connection between Legislations and its legislation considering just security and safety and this target. Different types of disruptions in the distribution channel are further identified as to have an impact on the Security & Safety. Whether the impact is positive or negative depends on the type of disruption. Traffic-jam can for example reduce the number of accidents; however it can also have the opposite affect if drivers are not attentive. Disruption in the disruption channels stated to arise because of increased security controls however have a positive impact on the target. Apparently there exists a connection between Congestions and Security & Safety.
Environment The target Environment is affected in many ways because of changes in the business environment. Emissions and disturbances is a result of transports and thus the customers of transportation services have an impact on the target. This impact is illustrated by the connection OEMs’ behaviour and Environment. The fuel used which results in emissions when combusted are the biggest influencer on the environment and thus there is a connection between Fuel and this target. In different ways the society tries to protect the environment by posing new legislations, also seen as a connection in the model, Legislations affect the Environment. The congestions that have arisen lately have in certain cases a negative impact
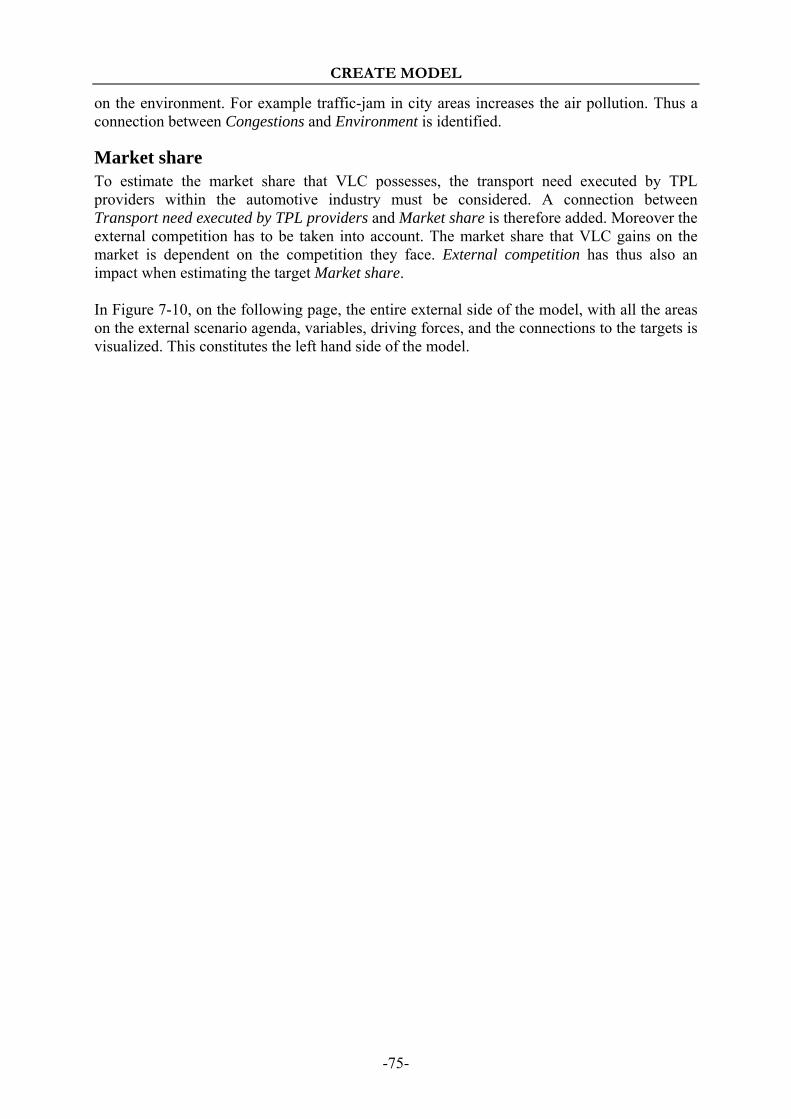
CREATE MODEL
-75-
on the environment. For example traffic-jam in city areas increases the air pollution. Thus a connection between Congestions and Environment is identified.
Market share To estimate the market share that VLC possesses, the transport need executed by TPL providers within the automotive industry must be considered. A connection between Transport need executed by TPL providers and Market share is therefore added. Moreover the external competition has to be taken into account. The market share that VLC gains on the market is dependent on the competition they face. External competition has thus also an impact when estimating the target Market share. In Figure 7-10, on the following page, the entire external side of the model, with all the areas on the external scenario agenda, variables, driving forces, and the connections to the targets is visualized. This constitutes the left hand side of the model.
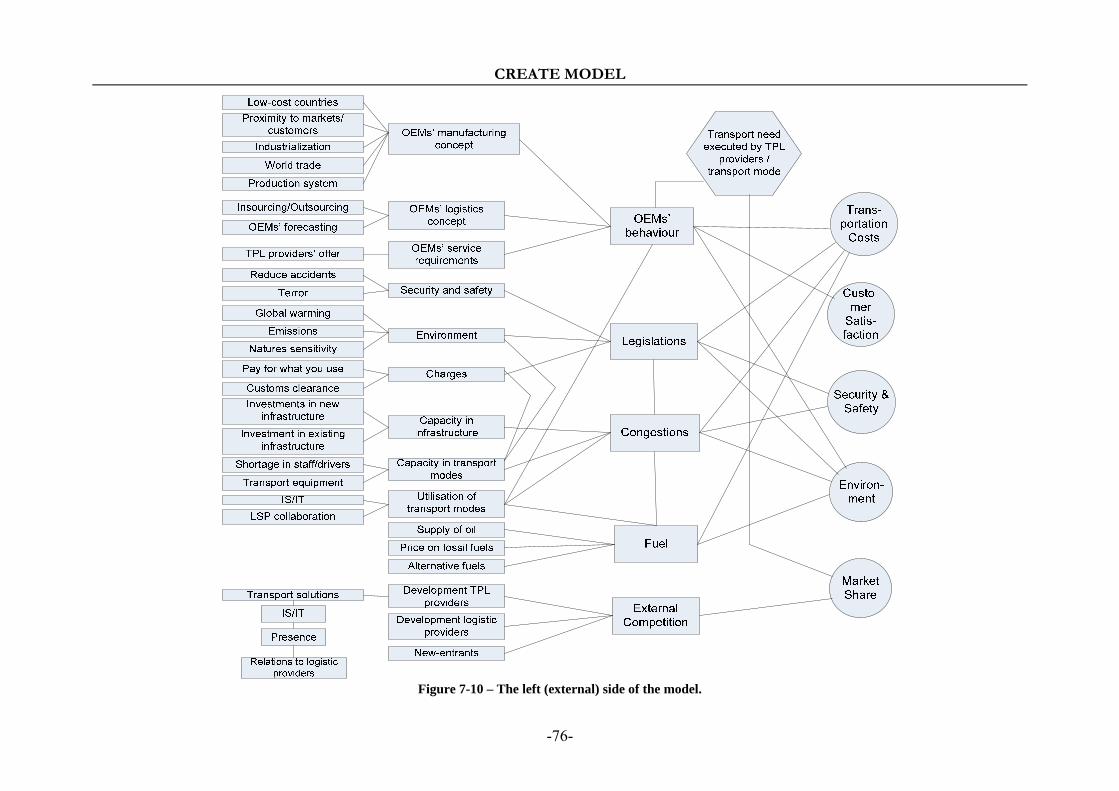
CREATE MODEL
-76-
Figure 7-10 – The left (external) side of the model.

CREATE MODEL
-77-
7.5 The internal scenario agenda As van der Heijden (1997) proposes a scenario project to test the business characteristics against the external environment, the model will have a two-dimensional approach with one external and one internal part. In the same way as the external scenario agenda was set up an internal scenario agenda will be introduced here. The internal scenario agenda will be the opposite to the external part of the model, i.e. a mapping of the fundamentals of the organi-sation itself. Some issues within the organisation are discussed within the project Vision 2015 & Beyond, particularly in the chapter called Competence. Areas about which VLC has the most concern when thinking about the future and which are close related to the targets are chosen to take place on the internal scenario agenda. The selected internal agenda is briefly introduced here. At VLC there is a concern about being able to meet the customers’ demands in the future (Geyer, 2007). In OEMs’ behaviour on the external scenario agenda OEMs’ logistic concept, requirements etcetera is traced, and it is changes in those areas that VLC needs to have the right competence for as to follow. In the project Vision 2015 & Beyond the chapter called Competence treats VLC’s competence profile; what sort of competence the organisation has and what knowledge that is predicted as required in the near future. Also competence demographics are discussed and it refers to the geographical competence distribution and how this needs to be developed in the future as to satisfy the customers’ needs. Evidently there is a concern within the organisation about the internal competence and thus VLC’s Competence is chosen as to take part on the internal scenario agenda. Moreover it is a question of being present in the right areas and having access to the transportation network (Boll, 2007), VLC’s Presence is thereby also a theme for the internal scenario agenda since VLC are anxious about this in the future. Another aspect that is discussed in relation to the customers and their requirements is VLC’s market approach and thus their strategic position. In recent years it has become common that TPL providers focus on a certain branch instead of a geographic area which was the case earlier. Like many other companies TPL providers want to be specified and trigger expertise in a certain segment in order to gain customers. (Hvittfeldt, 2007). VLC needs to find their specific segment and keep up with the changes and trends that arise on the TPL market. Since VLC is an asset-free TPL provider they are strongly dependent on their logistic providers, which may lead to reduction in flexibility (Boll, 2007). Hvittfeldt (2007) among others at VLC discuss the question whether VLC ought to invest in assets or not, something that will reduce the dependency on other actors. Strategic issues of these types are a concern within VLC and therefore it is chosen as an area referred to as VLC’s business concept on the internal scenario agenda. With three areas on the internal scenario agenda discussing VLC and their resources and strategies Boll (2007) and Geyer (2007) wants to highlight the concern about their competitiveness on the TPL-market. On the external scenario agenda External competition represents threats from other actors on the TPL-market, and this will be measured against VLC’s own ability to perform and meet customers’ requirements. VLC have thus chosen VLC’s competitiveness as to take place on the internal scenario agenda.
Figure 7-11 – The Internal scenario agenda.
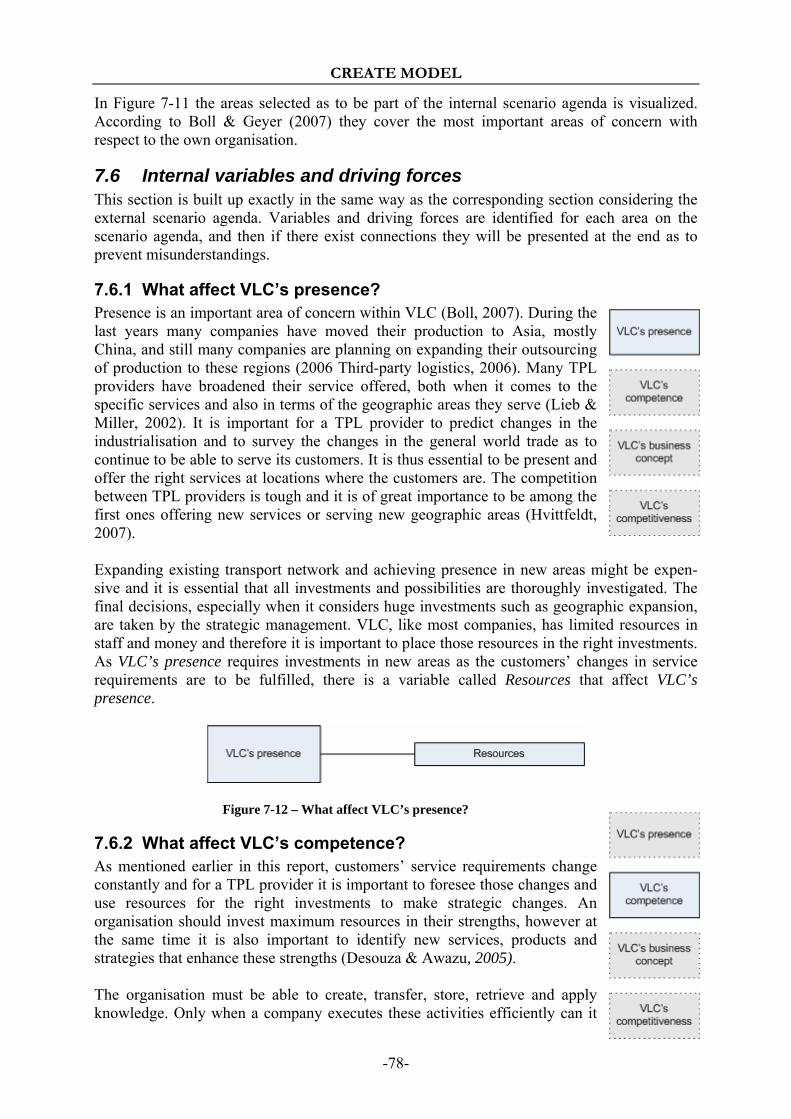
CREATE MODEL
-78-
In Figure 7-11 the areas selected as to be part of the internal scenario agenda is visualized. According to Boll & Geyer (2007) they cover the most important areas of concern with respect to the own organisation.
7.6 Internal variables and driving forces This section is built up exactly in the same way as the corresponding section considering the external scenario agenda. Variables and driving forces are identified for each area on the scenario agenda, and then if there exist connections they will be presented at the end as to prevent misunderstandings.
7.6.1 What affect VLC’s presence? Presence is an important area of concern within VLC (Boll, 2007). During the last years many companies have moved their production to Asia, mostly China, and still many companies are planning on expanding their outsourcing of production to these regions (2006 Third-party logistics, 2006). Many TPL providers have broadened their service offered, both when it comes to the specific services and also in terms of the geographic areas they serve (Lieb & Miller, 2002). It is important for a TPL provider to predict changes in the industrialisation and to survey the changes in the general world trade as to continue to be able to serve its customers. It is thus essential to be present and offer the right services at locations where the customers are. The competition between TPL providers is tough and it is of great importance to be among the first ones offering new services or serving new geographic areas (Hvittfeldt, 2007). Expanding existing transport network and achieving presence in new areas might be expen-sive and it is essential that all investments and possibilities are thoroughly investigated. The final decisions, especially when it considers huge investments such as geographic expansion, are taken by the strategic management. VLC, like most companies, has limited resources in staff and money and therefore it is important to place those resources in the right investments. As VLC’s presence requires investments in new areas as the customers’ changes in service requirements are to be fulfilled, there is a variable called Resources that affect VLC’s presence.
Figure 7-12 – What affect VLC’s presence?
7.6.2 What affect VLC’s competence? As mentioned earlier in this report, customers’ service requirements change constantly and for a TPL provider it is important to foresee those changes and use resources for the right investments to make strategic changes. An organisation should invest maximum resources in their strengths, however at the same time it is also important to identify new services, products and strategies that enhance these strengths (Desouza & Awazu, 2005). The organisation must be able to create, transfer, store, retrieve and apply knowledge. Only when a company executes these activities efficiently can it

CREATE MODEL
-79-
claim that it has a satisfactory knowledge management. An organisation must be able to seek and create knowledge, by e.g. examining data and harvesting information from expertise in the surroundings. (Desouza & Awazu, 2005). Benchmarking is a traditional method for a company to improve its performance and competitiveness by identifying and adopting best practices form other companies. Nowadays it is also common that two or more companies collaborate and develop the best practices together. (Kyrö, 2004). One of the most important challenges for TPL providers in the future are capacity manage-ment and innovation. Costumers of TPL services will in the future expect continuous improvements in service levels and information technology (2006 Third-party logistics, 2006) and thus VLC is concerned about having the right competence in the right places to be able to meet these requirements (Geyer, 2007). In general TPL providers act reactively and do not anticipate and identify opportunities to improve. (2006 Third-party logistics, 2006). But when competition is tough it is of great importance to act proactively or be flexible and easily adapt to new changes. Ackoff (2006) mentions two kinds of mistakes that often occur in an organi-sation; the errors of commission, which he defines as doing something that should not have been done, and the errors of omission, which refers to an action that should have been done but that for some reason were not conducted. To find and implement a solution the “what”, the “why” and the “how” questions need to be answered (Baladi, 1999). From these questions the first variable that affects VLC’s competence has been identified, namely one called Know what to do. This driving force includes the identifying, analysing and strategic decisions that answers questions like what will be the new requirements that customers pose and what should VLC do in the future as to meet those, in what should they invest etcetera. Moreover this variable will also, accept for the what-question, imply the why-question that is the understanding of why changes and investments need to be done. Once it is decided what to do the third question “how” needs to be answered, this is addressed in a variable called Know how to do. An organisation must have a resource of capabilities that it can deploy and the nature of capabilities possessed by an organisation differentiates it from others in the environment (Desouza & Awazu, 2005). For VLC it is important to map the knowledge within the organisation so that they know what kind of competence that is available and how it is spread. For global companies there is a matter of managing the competence throughout the entire business in a way so that the knowledge within the company is as widespread as possible (Baladi, 1999). The variable Know how to do refers to these issues.
Figure 7-13 – What affect VLC’s competence?

CREATE MODEL
-80-
7.6.3 What affect VLC’s business concept? According to Porter (2004) an industry is influenced by five forces where supplier power is one. The supplier may affect the costs and differentiation (Porter, 2004). In VLC’s case the suppliers, further on referred to as the logistics providers, have a major impact on the services VLC can offer. Because of this major impact Logistics providers’ concept has been chosen as a variable for VLC’s business concept. Though Logistics providers’ concept is a something that VLC can not entirely manage and therefore an external variable, in this model it will be placed on the internal part since it has an impact on an internal scenario agenda theme. Companies seek to change their business concept; one way to do that implies organic development (Johnson & Yip, 2007). When wanting to expand without losing the core competence one method is to identify the wanted competence within another firm and take the decision to bring them in house through mergers or acquisitions (Parry et al., 2006). VLC’s business concept is therefore affected by a variable called Business relations. As stated in the introduction to this theme on the internal scenario agenda there is an ongoing discussion within VLC whether or not to become an asset-based TPL provider. Assets in this context refer first and foremost to transport equipment. Since VLC at present is very dependent on their logistic providers and owning or not owning assets is an aspect that affects the services they can offer their customer, Assets is a variable affecting VLC’s business concept.
Logistics providers’ concept The logistics providers’ offer and capacity and the relation between VLC and the provider result in which services and to what extent VLC can offer their customers (Hvittfeldt, 2007). Acquisitions have been a trend among logistics providers the last years and it is predicted to continue. These acquisitions are mostly made to promote intermodal solutions which make transportation more efficient (Volvo B, 2007) and are a development as to reduce congestions and biases between transport modes which is explained in the external scenario agenda. Such activities among logistics providers have an impact on the logistic solutions that VLC can offer their customers (Geyer, 2007). With this background three driving forces has been identified as to affect Logistics providers’ concept; Logistics providers’ presence, -development and products and services.
Business relations As market demands changes over time strategic innovations are important to be a successful player on the market. In well-protected markets companies willing to expand their business need to come up with innovative strategies by introducing new products or services or addressing towards the needs of new customers. (Geroski, 1998). Business relations such as acquisitions and joint ventures are examples of methods that companies use as to stretch their concept. (Johnson & Yip, 2007). The different types of business relations that can be used as to develop VLC’s business concept has been chosen as driving forces for the variable Business relations. Alliances, Mergers and Acquisitions are identified as possibilities, but due to the important role that the logistic providers have in VLC’s ability to offer customers innovative and competitive logistics solutions those relations is chosen as a fourth driving force called Relations to logistic providers.

CREATE MODEL
-81-
Assets Some TPL providers have their own assets such as trucks and warehouses while others are completely asset free. Today VLC is an asset-free TPL provider while some of their main competitors, such as DHL, own much of the transport equipment and logistic centres that they utilise. According to Hvittfeldt (2007) it might be important for a TPL provider to own its proper transport equipment in the future as the competition tightens and there is an expected deficiency in capacity of transport modes. The capacity in transport modes does not increase at the same growing rate as the world trade, an issue addressed in the external business environment. Thus it is even more important for an asset-free TPL provider to have good relations with the logistics providers who owns the capacity or if preferred to possess their own assets. According to Hvittfeldt (2007) there are both advantages and disadvantages with being a non-asset-based TPL provider. They obey high assets related costs but they are much more dependent on an external part, namely the logistic providers. As a non-asset-based TPL provider they have an additional responsibility, the one for the service levels of the external logistic providers. If something goes wrong it is the TPL provider that will be held as responsible by the customer since they are not in direct contact with the logistic provider. Thus they are forced to have a good relation to the logistic providers and trust their ability. As mentioned earlier in this report there is a heavy concern about the capacity of transport modes in the future, which might make VLC considering buying their own assets in order to be able to offer their customers the right services. (Hvittfeldt, 2007). According to Hvittfeldt (2007) the decision of having assets or not are affected by other TPL’s development and the future development of capacity in transport modes. Development of TPL providers and Capacity in transport modes are thus chosen as driving forces for the decision considering assets.
Figure 7-14 – What affect VLC’s business concept?
7.6.4 What affect VLC’s competitiveness? A strategy within VLC as to gain competitive advantage on the market is to enhance their core values. Core values considering security and safety and environment is important in the society and thereby relevant for many customers of TPL services. (Boll, 2007). By setting own directives for the transportation conducted by VLC’s logistics providers VLC believe they show their benevolence and due to that can attract customers by setting up a public relation (Boll, 2007; Geyer, 2007). They judge that they by these actions differentiate from the other TPL providers on the market, which further is important for a competitive advantage (Johnson & Yip, 2007). Directives
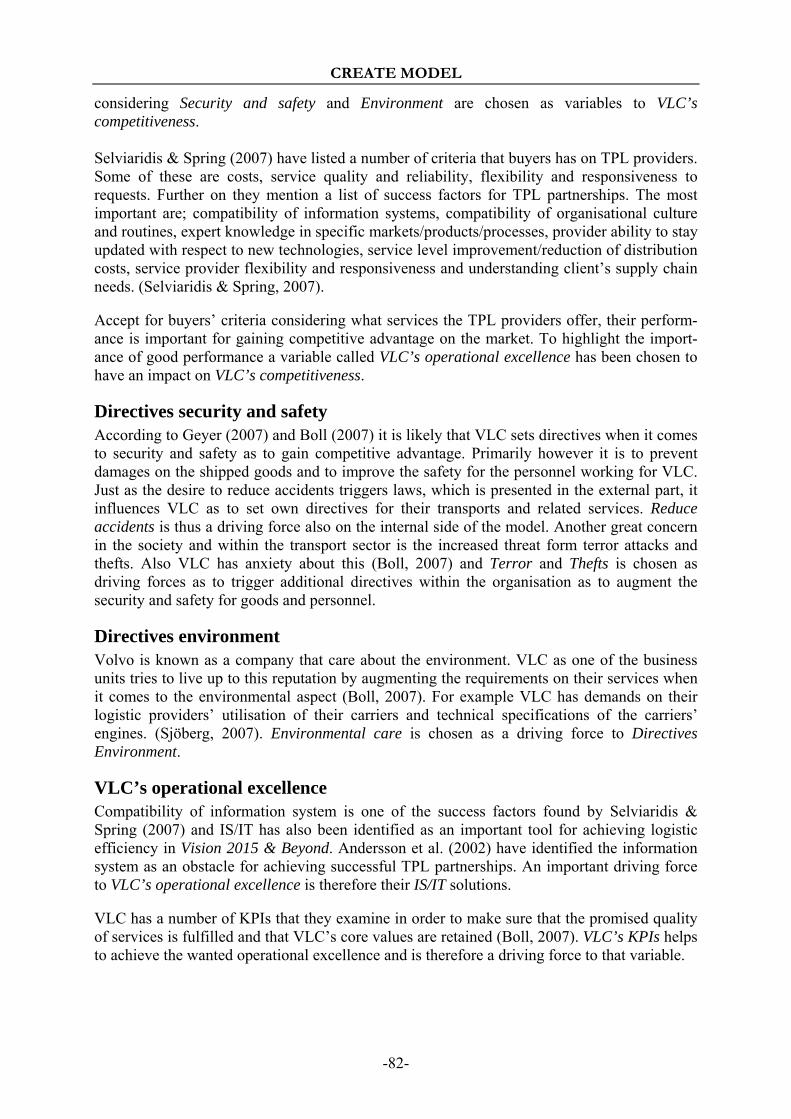
CREATE MODEL
-82-
considering Security and safety and Environment are chosen as variables to VLC’s competitiveness. Selviaridis & Spring (2007) have listed a number of criteria that buyers has on TPL providers. Some of these are costs, service quality and reliability, flexibility and responsiveness to requests. Further on they mention a list of success factors for TPL partnerships. The most important are; compatibility of information systems, compatibility of organisational culture and routines, expert knowledge in specific markets/products/processes, provider ability to stay updated with respect to new technologies, service level improvement/reduction of distribution costs, service provider flexibility and responsiveness and understanding client’s supply chain needs. (Selviaridis & Spring, 2007). Accept for buyers’ criteria considering what services the TPL providers offer, their perform-ance is important for gaining competitive advantage on the market. To highlight the import-ance of good performance a variable called VLC’s operational excellence has been chosen to have an impact on VLC’s competitiveness.
Directives security and safety According to Geyer (2007) and Boll (2007) it is likely that VLC sets directives when it comes to security and safety as to gain competitive advantage. Primarily however it is to prevent damages on the shipped goods and to improve the safety for the personnel working for VLC. Just as the desire to reduce accidents triggers laws, which is presented in the external part, it influences VLC as to set own directives for their transports and related services. Reduce accidents is thus a driving force also on the internal side of the model. Another great concern in the society and within the transport sector is the increased threat form terror attacks and thefts. Also VLC has anxiety about this (Boll, 2007) and Terror and Thefts is chosen as driving forces as to trigger additional directives within the organisation as to augment the security and safety for goods and personnel.
Directives environment Volvo is known as a company that care about the environment. VLC as one of the business units tries to live up to this reputation by augmenting the requirements on their services when it comes to the environmental aspect (Boll, 2007). For example VLC has demands on their logistic providers’ utilisation of their carriers and technical specifications of the carriers’ engines. (Sjöberg, 2007). Environmental care is chosen as a driving force to Directives Environment.
VLC’s operational excellence Compatibility of information system is one of the success factors found by Selviaridis & Spring (2007) and IS/IT has also been identified as an important tool for achieving logistic efficiency in Vision 2015 & Beyond. Andersson et al. (2002) have identified the information system as an obstacle for achieving successful TPL partnerships. An important driving force to VLC’s operational excellence is therefore their IS/IT solutions. VLC has a number of KPIs that they examine in order to make sure that the promised quality of services is fulfilled and that VLC’s core values are retained (Boll, 2007). VLC’s KPIs helps to achieve the wanted operational excellence and is therefore a driving force to that variable.

CREATE MODEL
-83-
Figure 7-15 – What affect VLC’s competitiveness?
7.7 Internal modelling Just as for the mapping of the business environment, with starting point in the external scenario agenda, there will be connections in the internal part of the model. The reasoning here is the same as for the external part.
7.7.1 Connections in the network According to Boll (2007), and as visualised in the external part of the model, VLC continuously analyses the business environment as to predict where production sites are thought to evolve in the future. Boll (2007) mentions Africa as a new potential area for companies to place their production facilities, partly because of their strive after establishing in low cost countries where it is cheap to produce. VLC’s ability to foresee new changes in the world trade is an important variable that has an impact on the area VLC’s presence on the internal agenda. There is thus an connection between VLC’s competence and VLC’s presence, which as mentioned above refers to their ability to know what to do, which implies the question of whereto expand in the future.
Among TPL users the most frequently outsourced service is transportation followed by ware-housing, customs clearance and brokerage. One of the users’ major concerns is the lack of consistency in core services among the TPL providers. They have noticed a lack of consist-ency in the service levels each TPL provider offers across different geographies. Just to be big and global is not good enough if there is a lack of location expertise and global consistency. (2006 Third-party logistics, 2006). For achieving strategic success it is important to choose an attractive industry, the right position or strategic group in an industry. A company needs a certain level of diversification. Stretching the business too far and try to succeed in a multi-tude of related business activities is not a good strategy for a company to reach success. It is better to use a focused strategy and build the business idea around the resources and compe-tences that already exist in the organisation. (Johnson & Yip, 2007). VLC’s competence and VLC’s presence are therefore two variables that affect VLC’s business concept.

CREATE MODEL
-84-
As mentioned the relation between a non-asset based TPL provider and the logistic provider is essential for the TPL provider (Boll, 2007). The logistic providers’ competence, presence and products and services are all factors that affect a TPL providers’ decision considering assets. If they are able to provide the needed capacity and perform the services at an satisfying level there is less reasons for a TPL provider to have their own assets. However there are trends indicating that logistic providers with whom VLC cooperate develop into TPL provider themselves (Boll, 2007). Such a development makes VLC’s suppliers become asset-based competitors instead. This makes VLC loose certain capacity availability which might trigger them to get their own assets. It is thus clear that Logistics providers’ concept has an impact on Assets and thereby there is a connection in-between them justified.
The key to a firm’s success is associated with its ability to create, manage and transfer knowledge (Greening & Turban, 2000). Thus to perform satisfyingly it is essential with competence, further justified by Selviaridis & Spring (2007) who have identified expert knowledge in specific markets/products/processes as an important success factor. To show this impact in the model there is a connection between VLC’s competence and VLC’s operational excellence.
Much of the criteria that buyer set on the TPL provider have to do with the services they offer and how well they perform these services. Therefore is the variable called VLC’s business concept something that has a great impact on VLC’s competitiveness.
VLC is as mentioned dependent on its relations to other actors as to serve its customers. Primarily it is the logistic providers that set the limits for where VLC can be present; they are dependent on their transport network and capacity (Boll, 2007). VLC as an asset-free company is totally dependent on logistic providers as to conduct transport services and thus Logistic providers’ concept affects VLC’s presence.
According to Makukha & Gray (2004) logistics partnerships can expand an organisation’s ability to develop strategies as to deal with new markets. The authors of this report have inter-preted this as business relations have an important impact on which markets that can be served and thus the variable Business relations is connected to VLC’s presence in the model.

CREATE MODEL
-85-
In Figure 7-16 the internal scenario agenda, variables, driving forces and all the connections are visualized.
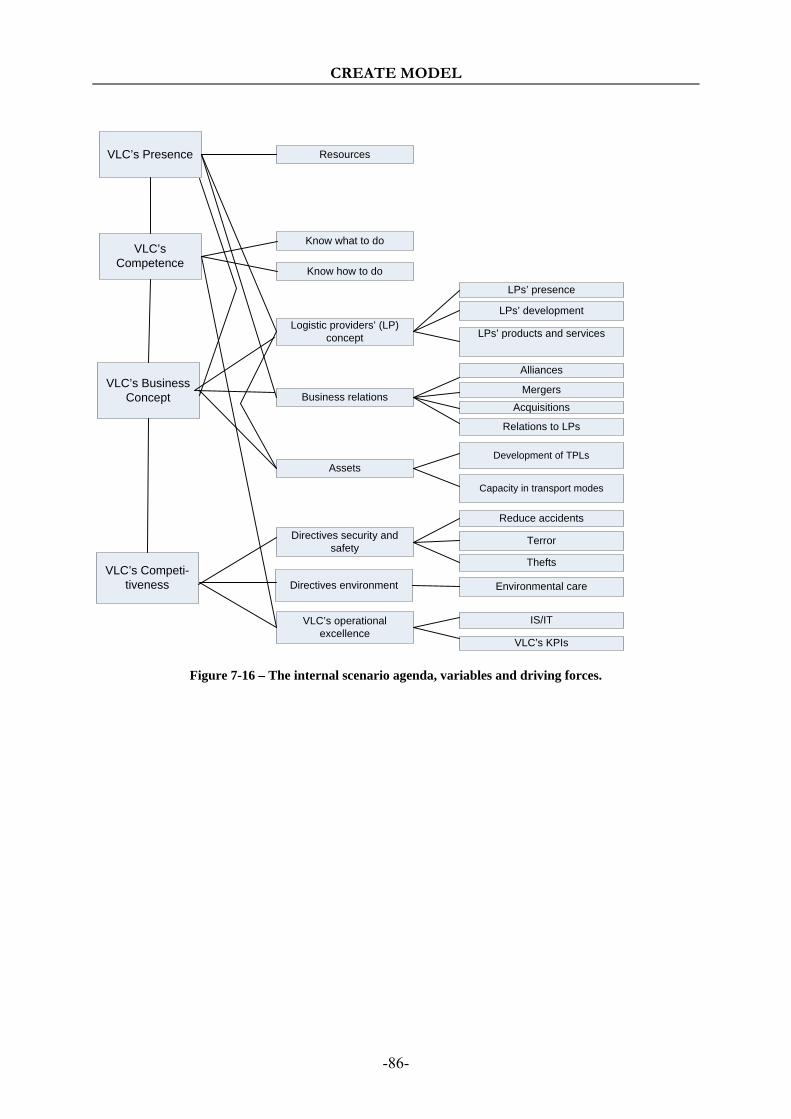
CREATE MODEL
-86-
VLC’s Presence
VLC’s Competence
VLC’s Business Concept
Resources
LPs’ development
Know what to do
Know how to do
Logistic providers’ (LP) concept
Business relations
Assets
LPs’ presence
LPs’ products and services
Alliances
MergersAcquisitions
Relations to LPs
Development of TPLs
Capacity in transport modes
VLC’s Competi-tiveness
Directives security and safety
Directives environment
VLC’s operational excellence
Terror
Thefts
Reduce accidents
Environmental care
IS/IT
VLC’s KPIs
Figure 7-16 – The internal scenario agenda, variables and driving forces.
CREATE MODEL
-87-
7.7.2 Connections to targets The internal scenario agendas and variables are connected to the targets in the following way.
Transportation costs According to Aronsson et al (2004) there is a strong connection between logistic costs and service level. A higher service level often results in increased logistic costs. It is reasonable to claim that higher service requirements such as door-to-door service and shorter lead times impacts on the transportation costs. For VLC to accomplish operational excellence they need to not only fulfil the customers’ service requirements but in some way even surpass the expectations. Since this high level of logistic service surely has an impact on the transporta-tion costs it is justified to have a connection between the variable VLC’s operational excel-lence and the target Transportation costs. When VLC sets its own directives considering security and safety as well as environment it is reasonable to believe that it may have an impact on the transportation costs. In order to achieve higher level of security and safety the consequences may be that the transport take longer time, that the loading and unloading is not as efficient as before, that there is a need to use a certain transport mode or other equipment and other similar matters. When thinking of those consequences it is likely to justify that there is a connection between the variables Directives security and safety and Directives environ-ment and the target Transportation costs.
Customer satisfaction VLC’s presence and VLC’s competence are important variables when it comes to fulfilling the customers’ requirements. Those variables are, in some way, connected to the target Customer satisfaction. Since those variables are connected to the agenda VLC’s business concept which implies many other variables that impact on the customer satisfaction it is this agenda that is connected to the target Customer satisfaction. VLC’s presence and VLC’s competence then do not have a direct connection to Customer satisfaction but an indirect one going through VLC’s business concept.
Security & Safety The target Security & safety concerns what level of security and safety that VLC accomplish and if those levels are good enough according to the directives that are set up. It has already been discussed that this target is affected by the legislations concerning security and safety in such a way that if governmental regulations changes for example the directives for this target changes which affect VLC’s ability to fulfil them. It is also reasonable to believe that if VLC on their own changes the variable Directives security and safety it has an impact on the level that they accomplish. Therefore is there a connection between Directives security and safety and Security & safety.
Environment With the same discussion as for the Security & safety above it is reasonable to have a connection between the variable Directives environment and the target Environment.
Market share To gain market share a company needs to be stronger than its competitors in some way. Either it needs to be cheaper, offer better quality, be more flexible or be better in another way that the customers request. VLC’s competitiveness concerns VLC’s ability to meet the customers’
CREATE MODEL
-88-
requirements and implies therefore their ability to gain new customers and to keep the old ones. This justifies a connection from VLC’s competitiveness to Market share. Basically, to gain new customers a company needs to offer the products or services the new customers require. Companies enter new markets in order to gain market share. This is done either by serving new geographical areas or by offering new products or services. For a TPL provider such as VLC there is a question on what geographical areas to serve. Further has there been identified certain trends in what TPL providers focus on, it has been common that they focus on a certain geographical area but now it is more common to focus on a certain industry, e.g. the automotive industry (Hvittfeldt, 2007). Thereby is it reasonable to think that VLC’s presence and VLC’s competence have a certain impact on the Market share. VLC’s presence is the foundation to where in the world VLC can offer their services. If they widen the geographical area where they operate they can fulfil new customers’ requests. They might also increase their services offered to present customer by start operating in new geographical areas. This might also be done by an increase in the portfolio of services offered which require a certain level of competence at VLC. The buying companies require more complex IT solutions and efficient logistic solutions and VLC need to put a lot of effort to keep up with those requirements. In Figure 7-17 on the following page the total right hand side of the model and the connections to the targets are visualized. Further is the entire model with both the external and internal parts visualised in Figur 7-18 on page 90.
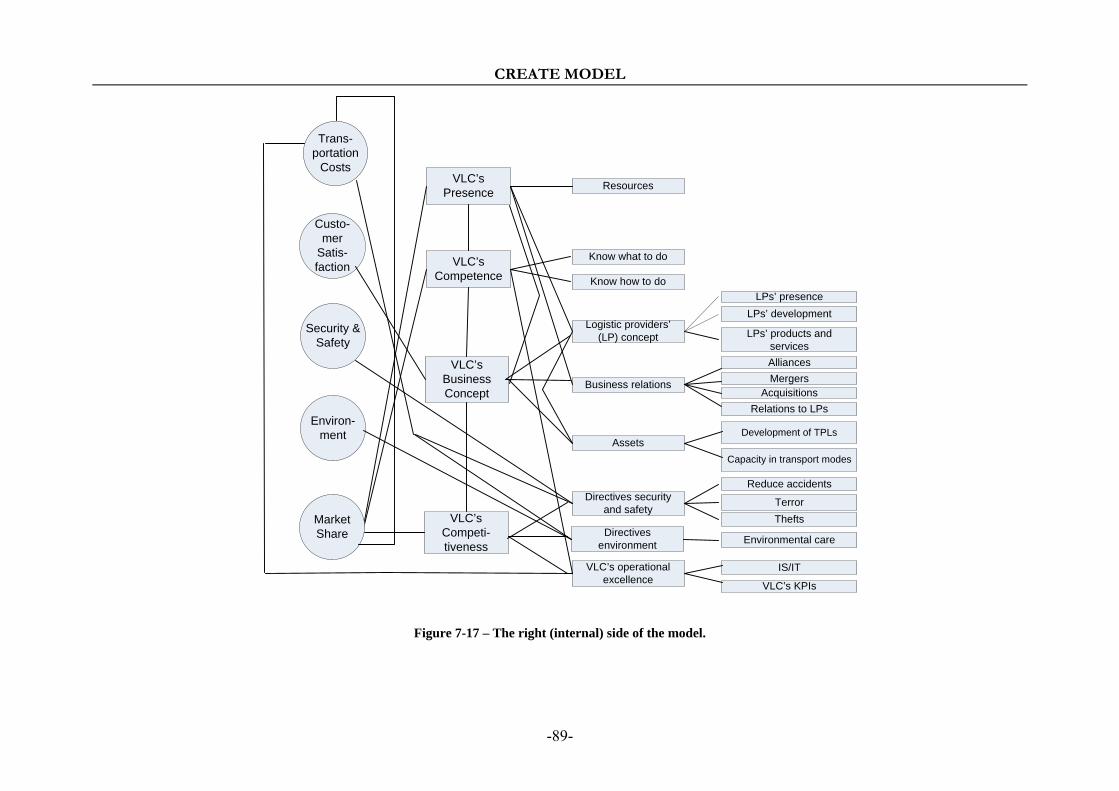
CREATE MODEL
-89-
VLC’s Presence
VLC’s Competence
VLC’s Business Concept
Resources
LPs’ development
Know what to do
Know how to do
Logistic providers’ (LP) concept
Business relations
Assets
LPs’ presence
LPs’ products and servicesAlliancesMergers
AcquisitionsRelations to LPs
Development of TPLs
Capacity in transport modes
VLC’s Competi-tiveness
Directives security and safety
Directives environment
VLC’s operational excellence
TerrorThefts
Reduce accidents
Environmental care
IS/IT
VLC’s KPIs
Security & Safety
Environ-ment
Custo-mer
Satis-faction
Trans-portation
Costs
Market Share
Figure 7-17 – The right (internal) side of the model.
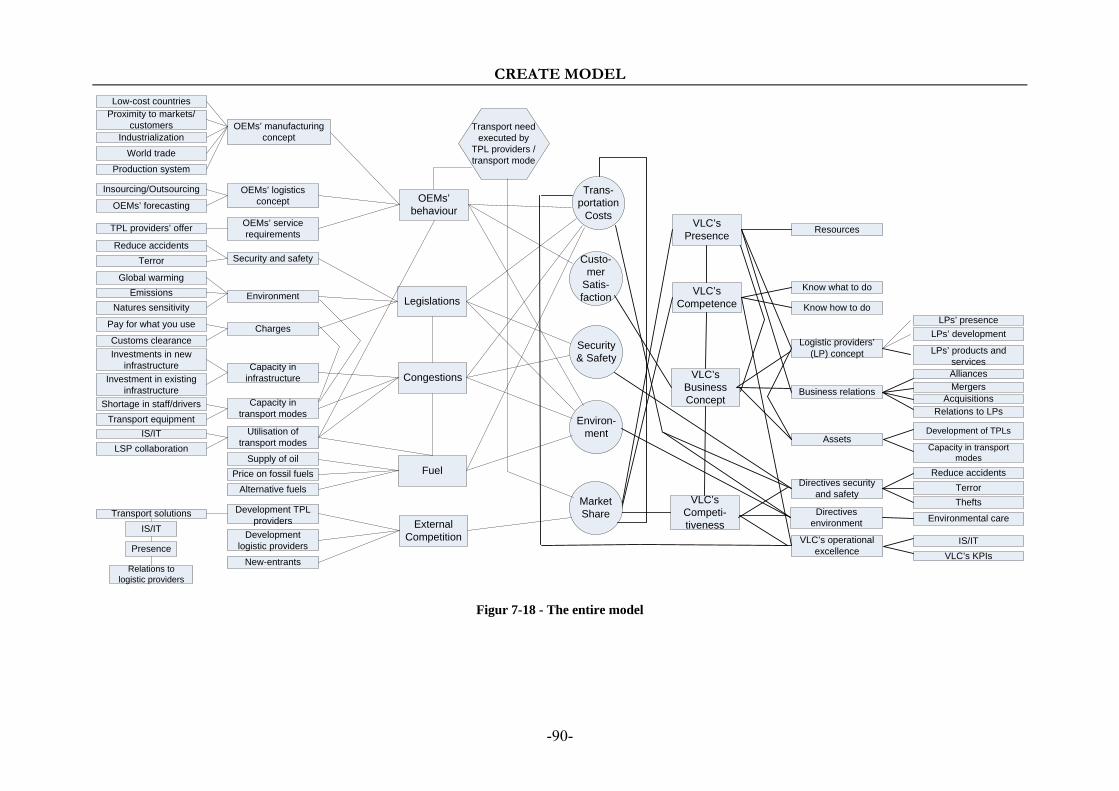
CREATE MODEL
-90-
VLC’s Presence
VLC’s Competence
VLC’s Business Concept
Resources
LPs’ development
Know what to do
Know how to do
Logistic providers’ (LP) concept
Business relations
Assets
LPs’ presence
LPs’ products and servicesAlliancesMergers
AcquisitionsRelations to LPs
Development of TPLs
Capacity in transport modes
VLC’s Competi-tiveness
Directives security and safety
Directives environment
VLC’s operational excellence
TerrorThefts
Reduce accidents
Environmental care
IS/ITVLC’s KPIs
Security & Safety
Environ-ment
Custo-mer
Satis-faction
Trans-portation
Costs
OEMs’ logistics concept
OEMs’ manufacturing concept
OEMs’ service requirements
Low-cost countriesProximity to markets/
customersIndustrialization
World trade
Production system
Insourcing/Outsourcing
OEMs’ forecasting
TPL providers’ offer
Environment
Security and safety
Charges
Global warming
Reduce accidentsTerror
Natures sensitivity
Pay for what you use
Emissions
Customs clearance
Capacity in transport modes
Capacity in infrastructure
Utilisation of transport modes
Shortage in staff/drivers
Investments in new infrastructure
Investment in existing infrastructure
Transport equipment IS/IT
LSP collaboration
Price on fossil fuelsSupply of oil
Alternative fuels
Development logistic providers
Development TPL providers
New-entrants
Transport solutions
Relations to logistic providers
IS/IT
Presence
OEMs’ behaviour
Congestions
Legislations
Fuel
External Competition
Market Share
Transport need executed by
TPL providers /transport mode
Figur 7-18 - The entire model
-91-
8 QUESTIONING THE MODEL
In this chapter the quality of the model that is created in the precedent chapter is discussed. At first the content of the model is analysed and then follows a discussion considering whether or not the model fulfil the criteria stated by Wallén (1996).
QUESTIONING THE MODEL
-92-
8.1 Focus and purpose with model As stated by Lindgren & Bandhold (2003) a scenario project can have different purposes. In VLC’s case it is a matter of studying the environment as to increase preparedness for its changes. At the same time the model visualises the organisation’s own capacity and how it can be adapted as to face the changes in the business environment. Of the four dimensions mentioned by Lindgren & Bandhold (2003), scenario projects within VLC that uses the model are placed in the Risk consciousness/need for renewal and New thinking/paradigm shift-quadrants. The main difference between those two dimension is that the first focus on the old business whereas the other on the new business. In Risk consciousness/need for renewal focus is on gaining insights about the surroundings as to see the need for renewal whereas in the New thinking/paradigm shift-quadrant a certain degree of insight is gained about the changing surroundings and thus the purpose is to evaluate strategies. (Lindgren & Bandhold, 2003). According to the authors of this report the model is constructed as to gain insight about the changes in the business environment, that is the external part, and to generate recommenda-tions adapted to VLC’s ability to respond to those changes, which is the internal part.
8.2 Porter’s five forces identified in the model Porter’s five forces of competition include the power of competitors, buyers, suppliers, substitutes and barriers to entry (Porter, 2004). When the model has been created those forces have been kept in mind in order to capture a wide range of driving forces that impact on VLC’s performance. As earlier mentioned in this report there is hard competition on the TPL-market, many big actors due to acquisitions and mergers and with small profit margins. The competition on the market depends first and foremost on the existing TPL-providers development, which is taken into account in the model as one part of the External competition. Nevertheless another threat to VLC, referred to as buyer power by Porter (2004), is if TPL-providers will not be used in the future. The customers would in that case turn directly to the transport providers, i.e. avoid one step in the existing distribution channel, which is implied in the driving force Develop-ment of transport providers. Another risk within buyer power that VLC faces is that they rely on a few large customers. These customers can put great pressure on VLC’s business since they know there value for VLC. The buyers’ impact on VLC is referred to in OEMs’ behaviour. Within the same area also the substitutes for transportation is considered. Substitutes for VLC’s services are OEMs’ insourcing of logistics services, since the demand for TPL-providers services will be reduced by that matter. Another threat against the demand of TPL-providers is if the automotive industry experienced an era of decentralisation or a change in the production system, which under certain circumstances would decrease the need of transportation. Driving forces related to these issues are identified as to change the variable OEMs’ manufacturing and sales concept, within OEMs’ behaviour. The power that the suppliers, in VLC’s case the logistics providers, pose is taken into account in the variable Logistics providers’ concept. VLC is dependent on its suppliers and it is thus essential that their relationship continues to be strong and reliable in the future. The suppliers’ concept has thus a major impact on VLC’s business concept, and they can exert great power since it is them that possess the transportation capacity. If there is a short supply of transporta-tion capacity they have an excellent dealing situation.

QUESTIONING THE MODEL
-93-
IS/IT is identified as very important in a TPL-provider’s concept, and thus creates a barrier to enter the market. Without sufficient technology it is not worth trying to enter market since this is a qualifier for the customers. The OEMs’ requirements are in total a barrier to enter the market, something that is treated within OEMs’ behaviour. Whether the market on average is hard to enter or not also depends on the governmental legislations. However the transportation market in Europe is rather free and cabotage activities have lately become legal however under certain restrictions. Those who actually chose to enter the market are accounted for in the driving force New-entrants which is connected to External competition. By this reasoning it has been clarified that all the forces stated by Porter (2004) have been considered in the model.
8.3 PEST factors identified in the model In this section it is shown that the model takes into account factors from all of the areas mentioned in a PEST-analysis. That the four types of factors are presented in the model is important since it proofs that different forces from the macroenvironment are considered, not leaving out any important area. Further it was proposed by van der Heijden (1997) to use PEST-analysis in scenario projects. Not all of the driving forces identified in the business macroenvironment, as to take part in the model, are placed within one of the four groups. The goal is rather to show that all are presented, something that is done in Table 8-1by grouping the most obvious driving forces from the model.
Political o Reduce accidents o Terror o Global warming o Emissions o Natures sensitivity o Pay for what you use o Customs clearance o Investments in new
infrastructure o Investments in existing
infrastructure o Price on fossil fuels
Economical o Low-cost countries o World trade
Social o Proximity to
markets/customers o Industrialisation o Shortage in staff/drivers
Technological o IS/IT o Alternative fuels o Transport solutions
Table 8-1 – Presentation of PEST-analysis. The driving forces identified as political are presented above. All the driving forces that are connected to the different kinds of legislations that affect VLC in the model are thought of as political since it is governments that trigger changes in those. Moreover other political
QUESTIONING THE MODEL
-94-
decisions such as the one considering investments in infrastructure and in one sense also the Price on fossil fuels are placed here. Low-cost countries and World trade are identified as economical factors that have an impact on VLC in the model since they presents economical aspect in the business environment. The factors identified as social are the ones that refer to characteristics of the society. The buying behaviour and the level of industrialisation in different regions have an impact on VLC since this creates a need of transportation. As for the last driving force, Shortage in staff/drivers, can be thought as to reflect what people wants to work with and thus is a product of the society's development. The technical forces changes the way activities are performed and are results of the technological development.
8.4 Fulfilment of criteria According to Wallén (1996) there are five criteria that a model needs to fulfil; systematic, validity, efficiency, model conditions, generalisation. To fulfil the first criterion, systematic, the model needs to be logic, free from contradiction and consequent (Wallén, 1996). The structure of this model is built up out of sections where external driving forces, external variables, external scenario agenda, targets, internal scenario agenda, internal variables and internal driving forces are the different sections. The driving forces are specified areas concern whilst the scenario agendas are more general. When using the model the user starts at an external driving force, which is a specified problem, and goes through the model, which implies more general problem areas, and finally ends up at an internal driving force, back to a specified area. This method has been found logic by the future main users of the model. Since, when using the model, the user must do some qualitative reasoning, two users posing the same scenario may end up at different end point. This is due to the way the model is created and because of the complexity of an industry’s environment it is hard to avoid it. As discussed earlier in this report it is impossible to create a model that visualizes a correct prediction of the future. Therefore it is not relevant to achieve total consequence when constructing this model. Contradictions may also arise depending on the reasoning made by the user. Again, due to the complexity, the researcher can not be sure that the model is totally free from contradictions. The theoretical validity means that all the incoming variables and parameters are relevant and the conceptual validity implies that all the conceptions used in the model needs to be defined. There is also an empirical validity which can be examined by testing whether or not the model can predict an experimental outturn. (Wallén, 1996). Since all incoming driving forces, variables, scenario agendas and targets as well as all the connections have been justified by multiple sources such as person at VLC and different external sources of information both the theoretical and conceptual validity are fulfilled. The empirical validity is though not fulfilled, which once again depend on the complexity and the fact that the model can not correctly predict the future. The user’s reasoning has an important impact on the outturn which makes it impossible to predict the outturn. It is important to keep in mind that when doing simplifications to increase the efficiency there is a risk that the model no longer presents a correct image of the reality (Wallén, 1996). When constructing the model the researchers have focused on making it as simple as possible

QUESTIONING THE MODEL
-95-
without loosing the credibility or the field of application. What would have been a more correct picture of the reality would have been to have an almost infinite number of incoming driving forces and connections, but simplifications and priority have made the model more efficiency optimised. The fourth criterion, model conditions, means that simplifications, assumptions, area of validity and additional conditions must be mentioned in the context (Wallén, 1996). In this report, as far as the researchers have had intention to, all the directives, delimitations, sources of error, analysing method and assumptions have been declared and justified. The model and the manual are parts of this report so the model conditions are in direct connection with the model. But it is decided that the model and the manual are to be able to be used separately from this report. The model conditions have been left out from the manual in order to make it as simply read as possible and only include the most important guidelines. For a user to get a deeper insight in the model and the structure of it he/she needs to read the report. The generalisation of the model has been discussed earlier on in this report. It is constructed for VLC and their activities but a certain level of generalisation have tried to be achieved by e.g. using external sources of information. The work process behind the model generation is general and can be used in other researches. In the definition and decomposition of this assignment has it been discussed what modification and in which way focus has been laid in order to make the model VLC specific. By definition, the driving forces, variables, scenario agenda and connections on the left side of the model can be generalized for all companies operating on the same market as VLC. But the targets and all the content to the right of them are VLC specific, so if other e.g. TPL providers wants to use this model they might have to revise this side of the model. Thereby has it been stated that this model fully fulfil the criteria efficiency and model conditions. The systematic is not fully fulfilled because of the fact that the complexity of the model makes it difficult to promise total freeness from contradictions. When it comes to validity both the theoretical and the conceptual validity are achieved but not entirely the one called empirical validity. Since the model is created for VLC’s purpose it do not fully fulfil the generalisation even though parts of it can be used by other TPL providers.

-96-

-97-
9 ASSIGNMENT DECOMPOSITION Create manual
In this chapter the decomposition of part two of the assignment, Create manual, is presented. This part is not as extensive as part one and is thereby not divided into steps. Questions to answer as to create a manual for the model and the method for answering those are presented here.

ASSIGNMENT DECOMPOSITION – CREATE MANUAL
-98-
9.1 Create manual Once the model is completed a manual needs to be constructed. This is because the creators of the model need to document how they want the model to be used. Those users that have not followed the work with the model need to be informed about how it is going to be used. The manual will answer the questions on how the model is created, what preparations need to be done before using it and how it should be used. For example the manual must explain where to start in the model, what to think of when following the connections that are set up and what shall be done when having reached a target.
• How is the model created? • How should it be used?
o What preparations need to be done before using the model? o Where to start in the model? o What to think of when following the connections?
• What to do when having reached the target? Method I.VI Before creating the manual the authors need to be clear about how it is going to be used. The supervisors at VLC will be questioned about how they want to use the model. Since they are the ones who have requested the model and certainly the main users of it their opinions are of great importance. Further external literature will be revised in order to find out how scenario projects are performed.
-99-
10 CREATE MANUAL
In this chapter the manual is presented. However because the model and the manual are thought to be used separately in the future this chapter starts with a short introduction of the model. It is though meant that this chapter could be separated from the rest of the report.

CREATE MANUAL
-100-
10.1 Description of model The model visualises VLC’s business environment and internal organisation. Those two parts, also called the external- and the internal part of the model, is linked together because of their mutual impact on common targets that has been selected by VLC. The model shall be used as a framework for qualitative reasoning about how to manage the future. The model is built up out of a certain number of driving forces, both external and internal. It is the driving forces that change when a mini-scenario is created. The mini-scenario can consider one or many driving forces. The driving forces in their turn have an impact on different variables in such a way that one or many driving forces can impact on the same variable. The variables are subsequently connected to scenario agenda. The scenario agenda have been identified as important areas of concern at VLC, both in the external environment and within the organisation. Finally are there connections between the scenario agenda and the targets that are set up as to be the most important performance indicators at VLC. The targets are the central point of the model. On the left hand side of them are the external scenario agenda and also the variables and driving forces that are identified as to have an impact on the external scenario agenda. Those variables and driving forces are also external, which means that VLC can not control and manage them. They change because of direct or indirect actions taken by actors in VLC’s business environment. Also trends in the TPL market can make driving forces and variables change. The internal scenario agenda with belonging variables and driving forces are found to the right of the targets and are such that VLC has a certain impact on. In the way that this model is created those driving forces can not be directly affected by a mini-scenario. Instead they are used as to work out areas of recommendations for what VLC should focus on as to react on external changes caused by a mini-scenario. All the connections in the model are justified by either external sources, persons at VLC or both. When setting up those connections the mission has been on keeping them as general as possible so that they are true for almost every mini-scenario, but since the model is going to be used by many different kinds of mini-scenarios a certain level of qualitative analysing need to be proceeded while working with every specific mini-scenario. This means that while working with a specific mini-scenario and following the connections there might be connections that the user find irrelevant in the specific case, it is then in the hands of the user to decide whether or not the connection is going to be considered. The user starts at the left side of the model, with the mini-scenario touching driving forces identified in the business environment and progress through the external part towards the targets. Once having reached the targets the user follows the connection through the right part of the model, i.e the internal. The model does not give any specific recommendations, only in which area(s) VLC needs to focus. It is up to the user to decide what VLC actually needs to do within the area generated by the model.

CREATE MANUAL
-101-
10.2 Manual Firstly the mini-scenario is to be constructed by the team performing the scenario project. There are multiple theories on how a mini-scenario can be built, however in VLC’s case for using this model the important thing is that the mini-scenarios are easy to understand and relate to, and to communicate.
Create mini-scenario
Afterwards, the driving force(s) that are affected by the mini-scenario will be identified. The driving force(s) can only be chosen out of the ones that are presented in the model’s mapping of the business environment, the left part of the model.
Identification of driving force(s) that are affected by the mini-scenario.
Once a mini-scenario is constructed and the driving forces affected are identified the mini-scenario should be inserted in the model. With qualitative reasoning around the driving force(s) that the mini-scenario affect the structure of the model will be followed. Starting at the left of the model the team should gradually reason themselves towards the targets that are affected by following the connections from the origin driving force(s). The connections between driving forces and variables and further to the scenario agenda and targets should be graded by the team depending on the estimated impact it has. Each connection shall be graded as having high-, medium- or insignificant impact.
Grading of external connections.
When having graded the connections leading to the targets it is qualitatively estimated how much the targets are affected in a certain mini-scenario. This information will be used when generating areas of recommendation, based on the internal side of the model. The areas that will be recommended to focus on within the organisation will be based on the targets’ development. The generation of areas of recommendation shall be held within the framework that is set up in the internal part of the model. By following the connections from the targets towards the right of the model, activities and abilities within VLC that affects the same targets are explored. In order to be able to prioritise the areas of recommendation also the connections in the internal part of the model should be graded.
Grading of internal connections.
By studying the connections it is thus possible to generate and prioritise areas of recommendations of how to heave a negative development of the targets.
Generate and prioritise areas of recommendations. Once areas of recommendations are identified for the mini-scenario(s), those that are considering a future that is highly probable should be used for the strategic dialogue within VLC. Continuously new mini-scenarios can be constructed and used in the model as to generate areas of recommendations in case of a particular future. It is also possible to introduce new connections or revise the model, it should be seen as a dynamic network and are first and foremost adapted to VLC and the concerns that they have today in 2007. However it is possible that new concerns or trends will develop and thus it is important to do appropriate changes or an extension of the model.

-102-

-103-
11 ASSIGNMENT DECOMPOSITION Mini-scenario case
In this chapter the third part of the assignment, Mini-scenario case, is decomposed. This part is divided into three steps, which will be briefly introduced in the first section. Each step is then decomposed into questions and appropriate methods as to answer them in separate sections.

ASSIGNMENT DECOMPOSITION – MINI-SCENARIO CASE
-104-
11.1 Steps in Mini-scenario case Mini-scenario case is the third and last part of the assignment presented in this report. This part is divided into three steps that will be performed when having a model and a manual to work with. In this third part of the assignment, a mini-scenario case will be constructed as to verify the manual. An external mini-scenario having an impact on one or a number of driving forces in the model will be constructed, which is presented by the first step in this part, Construct mini-scenario (III.I). This mini-scenario will then go through the model following the manual. By incorpora-ting a mini-scenario the way the model is constructed and the way the course of action is described in the manual will be studied, possibly revised and confirmed. The mini-scenario set up in the first step, considering changes in the business environment having an affect on one or a few driving forces, triggers an investigation of how VLC can face this change. Within which areas of actions VLC can affect the targets have been mapped out in part one of the assignment. These connections, between VLC’s internal variables and the targets, will be followed in the way that is described in the manual. In the end areas of recommendation on how to respond to the mini-scenario will be worked out. This step is called Mini-scenario in model (III.II). The study of the model in relation to the mini-scenario will be the test-case for the way to use the model. The evaluation of the manual will be performed in the step called Questioning the manual (III.III). The decomposition shortly introduced above is visualized in Figure 11-1.
Figure 11-1 – Partition of part three into steps.
11.2 Construct mini-scenario In this step a mini-scenario, considered as possible in the future on the market where VLC operates, will be constructed. The mini-scenario should be built up as to affect one or a few of the driving forces identified so as to change variable(s) in the business environment and further the targets. By restricting the number of driving forces that can change, the complexity will be reduced and the reasoning that will be done in the model is on a level that can be handled without loosing credibility. If many driving forces where allowed to change at the same time it would be very hard to handle the chain of reaction in all the variables and later on the combined affect on the targets. Also it would be impossible to avoid so called loops in the model. This step implies the search for a suitable mini-scenario, one that is realistic and relevant. There need to be a research considering what is going to happen in the mini-scenario and what driving force(s) that will be affected. The following requirements are set up as guidelines for a mini-scenario:
• One or a few number of driving forces changing, others fix. • Possible in the future.
The following questions have been set up: • What does this mini-scenario imply?
o What happens in the mini-scenario? • Which driving force(s) will be affected?

ASSIGNMENT DECOMPOSITION – MINI-SCENARIO CASE
-105-
Method II.I Information about what is thought to change in the future shall be sought for in literature and journals. The mini-scenario will be chosen because it is found to be the most appropriate for the model and VLC’s organisation. What happens in the mini-scenario, i.e. what changes in the chosen area of VLC’s business environment, will be examined both through literature studies and interviews.
11.3 Mini-scenario in model In this step the mini-scenario will be inserted in the model and on its way through the model the manual will be followed. Starting with changing the driving forces considered in the mini-scenario the affect on variables, the areas on the scenario agenda and targets should be studied, which implies the connections among them. The chain of reaction that the original change creates will be examined to see the combined affect on the targets. If the mini-scenario creates a negative impact on any of the targets, the area(s) for a proactive response by VLC shall be pointed out. This response is referred to as the recommendations for internal activities, preventing or decreasing the negative affect identified as the result of the mini-scenario. VLC wants to respond to external changes as to prevent negative affects on their organisation and to secure their wanted position on the market (Geyer, 2007).
• What does the manual say on how to use the model? • Which targets are affected by these changes in the business environment? • In what areas shall VLC work out recommendation as to respond to these changes?
Method III.II Throughout this step qualitative reasoning will be held in consultation with the supervisors and by applying literature found on the focused area of the model.
11.4 Questioning the manual By using the created mini-scenario in the model the manual will be tested. It should be determined whether the manual fulfils it purpose, i.e. explains for the user how to use the model, and if not it should be revised so that the final manual is satisfactory.
• Is something unclear, left out or wrong in the manual? • How to manage eventual deficiencies in the manual?
Method III.III To examine whether something is unclear, left out or wrong in the manual notes will be taken during the session where the mini-scenario is considered in the model by following the manual. If the manual needs to be revised this should be done and should then be tested again by using the same mini-scenario.

-106-

-107-
12 MINI-SCENARIO CASE
In this chapter the mini-scenario that is constructed as to test the manual is described. The mini-scenario is then interpreted in the model following the manual. Conclusions of the way of working with the model are presented.

MINI-SCENARIO CASE
-108-
12.1 Mini-scenario As to verify the guidelines for the model a mini-scenario has been constructed. Because of the researchers’ own interest and all the focus that has been in media was it decided to build the scenario around the driving force Global warming. The mini-scenario considers a future where the Kyoto Protocol is expanded as to imply transports. In the mini-scenario transports conducted by companies as to transport goods, both the ones that perform the transportation services in-house and those that outsource them, has to follow restrictions for emissions of carbon dioxide. The concept is similar to the restrictions of emissions of green house gases from producing companies’ factories in countries that has ratified the protocol, but for transports in this mini-scenario it only touches emissions of carbon dioxide and thus only the driving force Global warming is involved. The Kyoto Protocol that exists today has set up a reduction in percentage of green house gases, calculated from a certain year’s emissions and further is individually adapted to the involved countries’ conditions. Such an approach with different levels of restrictions for emissions from transports depending on a countries development and likely is probably necessary. An individual adaptation would protect regional transport providers and those who perform transportation in-house in countries that possess less developed transport fleet out of an environmental aspect, and which otherwise risk to be pushed out of the market by external big transport providers that are better equipped for such restrictions. This adaptation of restrictions is however disregarded in this mini-scenario and VLC will through their logistic providers have the same restrictions everywhere, not depending on in which country they operate. If a Kyoto Protocol would be expanded as to imply transports, intermodal solutions would become more important according to Huge Brodin (2007). By intermodal solutions the usage of transport modes would be better optimised and thus transport modes such as train that is more environmental friendly would be used more and contribute to less emissions (Huge Brodin, 2007). Thus the transport network would probably develop towards an extended use of the most environmental friendly transport modes if the Kyoto Protocol implied transports. The actors on the market have to adapt to this eventual development, and thus competitors and logistic providers may change their concepts. In this scenario TPL providers will change their Transport solutions, which can be seen as driving forces for Development TPL providers, as to meet the new requirements for emission friendly solutions. As example they would develop their IS/IT as to better be able to create intermodal solutions and further their relation to logistic providers would gain more importance since control is necessary. In this scenario the driving force LPs’ development are thought to be affected and thus change Logistic providers’ concept. Acquisitions and closer collaboration with TPL providers would occur since this would promote intermodal solutions (Huge Brodin, 2007). By including transports in the Kyoto Protocol OEMs are greatly affected since it is on them, as the transport buying company, that the restrictions will be posed. The fact that several transports today are bought in a chain, where the actual buyer never comes into contact with the transport provider, it could arise allocation problems considering how much emissions each company should stand as responsible for. In order to simplify that fact has been disregarded here. OEMs’ decision whether to outsource transportation services is in the mini-scenario affected by the restrictions. By having a more complex transport network where economies of scale can be of importance as to reduce emissions an effect is that more companies hires TPL providers as to take care of their logistic services. (Woxenius, 2007). At
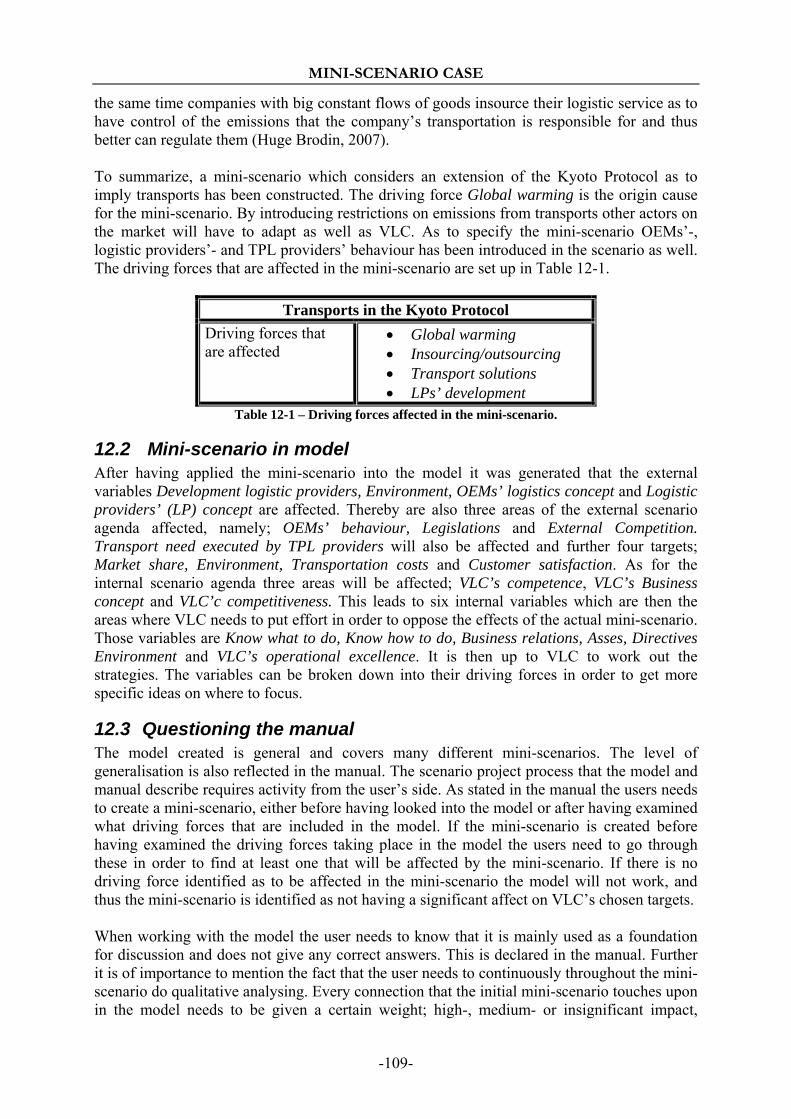
MINI-SCENARIO CASE
-109-
the same time companies with big constant flows of goods insource their logistic service as to have control of the emissions that the company’s transportation is responsible for and thus better can regulate them (Huge Brodin, 2007). To summarize, a mini-scenario which considers an extension of the Kyoto Protocol as to imply transports has been constructed. The driving force Global warming is the origin cause for the mini-scenario. By introducing restrictions on emissions from transports other actors on the market will have to adapt as well as VLC. As to specify the mini-scenario OEMs’-, logistic providers’- and TPL providers’ behaviour has been introduced in the scenario as well. The driving forces that are affected in the mini-scenario are set up in Table 12-1.
Transports in the Kyoto Protocol Driving forces that are affected
• Global warming • Insourcing/outsourcing • Transport solutions • LPs’ development
Table 12-1 – Driving forces affected in the mini-scenario.
12.2 Mini-scenario in model After having applied the mini-scenario into the model it was generated that the external variables Development logistic providers, Environment, OEMs’ logistics concept and Logistic providers’ (LP) concept are affected. Thereby are also three areas of the external scenario agenda affected, namely; OEMs’ behaviour, Legislations and External Competition. Transport need executed by TPL providers will also be affected and further four targets; Market share, Environment, Transportation costs and Customer satisfaction. As for the internal scenario agenda three areas will be affected; VLC’s competence, VLC’s Business concept and VLC’c competitiveness. This leads to six internal variables which are then the areas where VLC needs to put effort in order to oppose the effects of the actual mini-scenario. Those variables are Know what to do, Know how to do, Business relations, Asses, Directives Environment and VLC’s operational excellence. It is then up to VLC to work out the strategies. The variables can be broken down into their driving forces in order to get more specific ideas on where to focus.
12.3 Questioning the manual The model created is general and covers many different mini-scenarios. The level of generalisation is also reflected in the manual. The scenario project process that the model and manual describe requires activity from the user’s side. As stated in the manual the users needs to create a mini-scenario, either before having looked into the model or after having examined what driving forces that are included in the model. If the mini-scenario is created before having examined the driving forces taking place in the model the users need to go through these in order to find at least one that will be affected by the mini-scenario. If there is no driving force identified as to be affected in the mini-scenario the model will not work, and thus the mini-scenario is identified as not having a significant affect on VLC’s chosen targets. When working with the model the user needs to know that it is mainly used as a foundation for discussion and does not give any correct answers. This is declared in the manual. Further it is of importance to mention the fact that the user needs to continuously throughout the mini-scenario do qualitative analysing. Every connection that the initial mini-scenario touches upon in the model needs to be given a certain weight; high-, medium- or insignificant impact,

MINI-SCENARIO CASE
-110-
something that is explained in the manual. Because of this it is also recommended that the work is done by a team including two or more users. The weighting of the connections will result in a priority among the areas of recommendation that the model will generate. When having reached the right side of the model the paths that have been taken can be winded up and the weighting of the connections constituting the path can be added together in order to get an approximated “value” on the actual area of recommendation. In that way a priority among the areas of recommendation can be generated. It is then in the hands of the users and strategists at VLC to discuss whether or not VLC should act proactively in those areas in order to prevent negative effects from future changes in their business environment. To summarize, the researchers claim that the manual discuss all the important steps for the scenario project process within VLC where the model shall be used. They have not found it appropriate to do a more specific manual since the model is very general and too many directives probably could inhibit the creative thinking needed among the practitioners of scenario projects.

-111-
13 CONCLUSIONS
In this chapter the result of the study is presented. Further the researchers discuss the outcome of the study and what VLC are recommended to do as to improve their scenario planning activities.
CONCLUSIONS
-112-
13.1 Result Regarding the targets of the model five indicators have been identified as to represent VLC’s performance. Three of them are closely related to the company’s core values, these are; Customer satisfaction, Security & safety and Environment. By research in both internal and external sources of information has it also been found that Market share and Transportation costs are important indicators to consider in the future. The model includes an external- and internal scenario agenda which impact on the decided targets and refer to important areas of concern in VLC’s business environment and within the organisation. VLC clearly states that they hold a great concern about external areas such as Congestions, Legislations, Fuel and OEMs’ Behaviour and like many other companies they are also anxious about the future External competition. On the internal scenario agenda it is justified to let VLC’s presence, VLC’s competence and VLC’s business concept be areas of concern. Those three were often mentioned when doing research inside the organisation. A fourth theme on the internal scenario agenda concerns the competitiveness, which is a more general theme that all organisations worry about. VLC strives for keeping up the competitiveness on the dynamic and ever changing TPL market, this fourth theme is called VLC’s competitiveness. Both the external- and the internal scenario agenda have been further examined in order to find the incoming variables. A certain set of variables and accompanying driving forces have been identified. After having set all the scenario agendas, variables and driving forces additional connections were sought. The result of the modelling process is visualized in Figure 13-1. A manual explaining how to use the model has also been constructed. The model and the manual are thought of as to be used free standing from the report if desired. However first-time users do need to read the report in order to understand the underlying justification behind the chosen components and connections in the model. The manual and the way of working with the model have been tested by a mini-scenario considering global warming. This was done in order to revise the manual so that it is easy to understand and follow. Using the model requires a certain level of activity from the user’s side. It is needed that the users create a mini-scenario, either before having looked into the model or after having examined what driving forces that are included in the model. If the mini-scenario is created before having examined the driving forces the users then need to go through the driving forces in order to find at least one that will be affected by the mini-scenario. After having identified the driving force(s) affected by the mini-scenario the connections that go through the variables and scenario agendas to the targets and then through the internal scenario agenda to the internal variables and driving forces are to be given weights. When having reached the internal variables and driving forces the model has generated the areas of recommendation which is the goal of this process. Doing the weighting of the connections will result in a priority among the areas of recommendation that the model will generate. When having reached the right side of the model the paths that have been taken can be winded up and the weighting of the connections constituting the path can be added together in order to get an approximated “value” on the actual area of recommendation. In that way a priority among the areas of recommendation can be generated. It is then in the hands of the user and strategists at VLC to discuss whether or

CONCLUSIONS
-113-
not VLC should act proactively in those areas in order to prevent negative effects from future changes in their business environment. In order to verify the model it has been stated that it implies aspects from all of the five forces mentioned by Porter (2004) and from all areas in a PEST analyse. When considering the criteria stated by Wallén (1996) is has been found that the model created not fully fulfil the criteria. It has been stated that the model fulfil the criteria efficiency and model conditions. The systematic is not fully fulfilled because of the fact that the complexity of the model makes it difficult to promise total freeness from contradictions. Both the theoretical and the conceptual validity are achieved but not entirely the one called empirical validity. Since the model is created for VLC’s purpose it does not fully fulfil the criteria generalisation even though parts of it can be used by other TPL providers. The model is complex and general in such a way that it does not only work for one mini-scenario but for many different ones. The complexity is visualized in Figure 13-1 on the next page and according to Geyer (2007) the network of connections that may seem as totally unstructured is an important observation. The environment in which VLC operates is complex and mapping out all the connections which can be found among all the components is a heavy process that can not be presented by a totally clear picture. If so, it is sure that way too many aspects have been left out. (Geyer, 2007).

CONCLUSIONS
-114-
VLC’s Presence
VLC’s Competence
VLC’s Business Concept
Resources
LPs’ development
Know what to do
Know how to do
Logistic providers’ (LP) concept
Business relations
Assets
LPs’ presence
LPs’ products and servicesAlliancesMergers
AcquisitionsRelations to LPs
Development of TPLs
Capacity in transport modes
VLC’s Competi-tiveness
Directives security and safety
Directives environment
VLC’s operational excellence
TerrorThefts
Reduce accidents
Environmental care
IS/ITVLC’s KPIs
Security & Safety
Environ-ment
Custo-mer
Satis-faction
Trans-portation
Costs
OEMs’ logistics concept
OEMs’ manufacturing concept
OEMs’ service requirements
Low-cost countriesProximity to markets/
customersIndustrialization
World trade
Production system
Insourcing/Outsourcing
OEMs’ forecasting
TPL providers’ offer
Environment
Security and safety
Charges
Global warming
Reduce accidentsTerror
Natures sensitivity
Pay for what you use
Emissions
Customs clearance
Capacity in transport modes
Capacity in infrastructure
Utilisation of transport modes
Shortage in staff/drivers
Investments in new infrastructure
Investment in existing infrastructure
Transport equipment IS/IT
LSP collaboration
Price on fossil fuelsSupply of oil
Alternative fuels
Development logistic providers
Development TPL providers
New-entrants
Transport solutions
Relations to logistic providers
IS/IT
Presence
OEMs’ behaviour
Congestions
Legislations
Fuel
External Competition
Market Share
Transport need executed by
TPL providers /transport mode
Figure 13-1 – The entire model.
CONCLUSIONS
-115-
13.2 Discussion The result from this research is a complex picture describing how certain chosen driving forces affect a number of targets interpreting VLC’s performance. The model generates areas of recommendation which describe in what internal areas that VLC ought to focus. Due to limitation in time and because of directives given by the supervisors at VLC the model has been highly simplified and only qualitative analysing has been done. There is a risk that important areas have been left out when the incoming variables have been prioritised. In order to prevent this, a lot of contact has been held with people at VLC with very good insight in their business environment. Those people have given information used for prioritising the incoming components of the model which makes the model very VLC specific, however parts of it may also be seen as TPL provider specific. With no limitation in time and financial resources world leading experts in every area could have been interviewed which would have given a more general model with, eventually, higher level of reliability. If more time had been available and if VLC had not given any directives concerning the complexity the model could have been extended and containing more connections. If quantitative analysing had been done the impacts among the components could have been calculated and thereby more precise. That would have resulted in a more valid and reliable model. However this is practically impossible since the model are to handle many different mini-scenarios and the impacts would be different depending on the particular mini-scenario. The researchers behind this model construction project have analysed the collected data in a way that they find convenient and habitual. Mistakes might have occurred along the way if the collected data contains errors. Such errors might have occurred in the data collection phase where substance could have been left out in interviews due to either shortness in time, lack of structure or bad noting. Another source of error is the fact that the collected data might not touch directly on the area that it is used for in this research. Examples of this is that external sources such as journal articles have not been VLC specific or even TPL specific but still used to justify something that impact on either a general TPL provider or VLC. Components and connections might have been different if all these errors had not occurred. Since the model that has been created is constituted by certain selected components but is to be used in a very dynamic business with an environment that is continuously changing there is a need for continuous updating of the incoming components and also the targets of the model. Due to changes in the competitors’ action, the customers’ requirements, different kinds of regulations and so on, other components might need to be added and existing ones might need to be discarded. This is a work that will be left out for further research and continuous discussions. With this model, as a result of this research, VLC now has a tool and methodology for working with scenarios. It is made with focus on transportation and is thereby very useful for VLC since transportation services are their main business area. By using this model for the mini-scenarios constructed VLC can be better prepared for dealing with changes that will occur in their business environment in the future. Naturally, as time passes, they will have to confront many challenges as prerequisites changes but by using this model in the way that the researchers behind it have proposed they will get a clearer picture in where to put focus, i.e. in what areas to work extra hard. This will be a key factor to ensure that they are striving against a bright future at the transportation market and an important step in their work to become the first choice for managing transports in the future.

CONCLUSIONS
-116-
With this model VLC will not get any direct answers on how to act when changes occur but they will get a hint on what areas in their business that they will need to focus on in the future. More generally has this research resulted in a methodology for working with scenarios and a combination of two different research areas; scenario planning and modelling. It has from this research been proved that those two areas can be combined and the researchers therefore recommend other companies within the Volvo Group to do a similar project.
13.3 Recommendations for future work The model is dynamic, meaning that the surroundings and the organisation continuously should be screened for new components that should take part in the model. The model in this report implies the concerns that VLC has identified as to have an impact on their targets today, however this can change in the future. It is also possible that connections that are not part of the model at this stage should be implemented in the future. Thus the model requires continuous updates as to contribute to VLC's scenario planning in the best possible way. The way the model is presented can be improved. As it is now it can be difficult to see all the connections that one is interested in. An improvement can be done by drawing the model in different layers. For example can the targets be separated and drawn in different layers, that is all the components and connections that have to do with a certain target are drawn on a separate layer. This can be done with all the targets and when considering the entire model those layers are merged upon each other. The model that is constructed is based on qualitative reasoning, however it could be improved and extended as to imply quantifications. By quantification of different components impact on each other and further on the targets the "answers" that the model brings out can be more exact. Quantifications are however time consuming and it should be carefully examined whether such an approach is appropriate in the particular case. For VLC it is also interesting to stay updated on what other organisations which works within the same domain does. For example the researchers propose that the progress within MIT’s scenario project, SC2020, is reviewed continuously.

-117-
14 REFERENCES

REFERENCES
-118-
Ackoff, L. Russell (2006) A major mistake that managers make. Handbook of business strategy, Vol. 7 Issue 1. Aimi, Greg (2006) Will 3PLs Grab the Global Opportunity. Supply Chain Management Review, Vol. 10 Issue 6. Aleklett, K. & Campbell, J. C. (2003) The Peak and Decline of World Oil and Gas Production. Minerals & Energy- Raw Materials Report, Vol. 18 Issue 1. Andersson, Dan (1997) Third-party logistics – outsourcing logistics in partnerships. Linköping University, Linköping. Andersson, D., Berglund, M. and Pruth, M. (2002) Tredjepartslogistik. Linköping University, Linköping. Appels, T. & Struye de Swielande, H. (1998) Rolling Back the Frontiers: The Customs Clearance Revolution. The International Journal of Logistics Management, Vol. 9 Issue 1. Aronsson, H., Ekdal, B., Oskarsson, B. (2004) Modern logistik – för ökad lönsamhet. Wallin & Dalholm Boktryckeri AB, Lund. Aronsson, H. & Huge Brodin, M. (2006) The environmental impact of changing logistics structures. The International Journal of Logistics Management, Vol. 17 No. 3. Arbnor, I. & Bjerke, B. (1994) Företagsekonomisk metodlära. Studentlitteratur, Lund. Atkinson Helen (2003) Still room for small 3PLs. Journal of commerce, Vol. 4 Issue 2. Baladi Peter (1999) Knowledge and Competence Management: Ericsson Business Consulting. Business Strategy Review, Vol. 10 Issue 4. Baldwin, E. R., Martin P. and Ottaviano G. I. P. (2001) Global Income Divergence, Trade, and Industrialization: The Geography of Growth Take-Offs. Journal of Economic Growth, Vol. 6 No. 1. Bean, C. & Geraghty, K. (2003) Navigating the Road to KPI Success. Logistics & Transport Focus, Vol. 5 Issue 6. Berglund, Magnus (1997) Third-party logistics providers: towards a conceptual strategic model. Linköping University, Linköping. Berman, J. (2007) Bush signs maritime, air cargo inspection bill. Logistics Management, Vol. 46 Issue 8. Björklund, M. & Paulsson, U. (2003) Seminarieboken: att skriva, presentera och opponera. Studentlitteratur, Lund. Boll, Mats (2007). Project Manager, VLC.

REFERENCES
-119-
Bryman, A. & Bell, E. (2005) Företagsekonomiska forskningsmetoder. Liber ekonomi, Malmö. Carter, R. C. & Maloni, J. M. (2006) Opportunities for Research in Third-Party Logistics. Transportation Journal, Vol. 45 Issue 2. Christopher, Martin (2005) Logistics and Supply Chain Management, Creating Value-Adding Networks. Pearson Education, Dorchester. Churchman (2002) Systemanalys. ePan Prisma, Stockholm. Coronado Mondragon, E. A., Lyons, C. A., Michaelides, Z. and Kehoe, F. D. (2006) Automotive supply chain models and technologies: a review of some latest developments. Journal of Enterprise Information Management, Vol. 19 Issue 5. Coyle , Geoff (1999) Qualitative Modelling in System Dynamics or What are the wise limits of quantifications. A Keynote Address to the Conference of the System Dynamics Society, Wellington, New Zealand. Cruijssen, F., Cools, M. & Dullaert, W. (2007) Horizontal cooperation in logistics: Opportunities and impediments. Transport Research E: Logistics and Transportation Review, Vol. 42 Issue 2. Davidson, Jim (2005) The definitive Trend in Supply Chain Management. LQ, Vol. 11 Issue 1. Desouza K. C. & Awazu Y. (2005) Segment and destroy: the missing capabilities of knowledge management. Journal of Business Strategy Vol. 26 Issue 4. D’Este, Glen (1996) An event-based approach to modelling intermodal freight systems. International Journal pf Physical distribution & Logistics Management, Vol. 26 Issue 6. Einbock Marcus (2006) Effects of the Austrian road toll system on companies. International Journal of Physical Distribution & Logistics Management, Vol. 36 Issue 2. European Commission (1992) White Paper
(2001) White Paper – European Transport policy for 2010: time to decide. (2006) Plan of action for energy efficiency
Forrester (1961) Industrial dynamics. Cambridge MA: Productivity press. Fuel: Diesel& Beyond (2007). Fleet Owner Vol. 102 Issue 8. Geerlings, H. & Stead, D. (2003) The integration of land use planning, transport and environment in European policy and research. Transport Policy, Vol. 10 Issue 3. Geroski Paul (1998) Thinking creatively about your market: Crisps, perfume and business strategy Business Strategy Review, Vol. 9 Issue 2.

REFERENCES
-120-
Geyer, Dan (2007) Corporate Outlook Development, VLC. Grant B. D., Karagianni C. and Li M. (2006) Forecasting and stock obsolescence in whisky production. International Journal of Logistics: Research and applications, Vol.9 No.3. Greening & Turban (2000) Corporate Social Performance as a Competitive Advantage in Attracting a Quality Workforce. Business & Society, Vol. 39. Guttmann, Benny (2007) Vice President strategic planning & core values, VLC. Huge Brodin, Maria (2007-10-03) Senior university lecturer, IEI, Linköping University, Linköping. Hvittfeldt, Kjell-Åke (2007-07-03) Vice President, VLC. Jacobsen, Dag Ingvar (2002) Vad, hur och varför: om metodval i företagsekonomi och andra samhällsvetenskapliga ämnen. Studentlitteratur, Lund. Jobber, D. & Fahy, J. (2003) Foundations of marketing. McGraw-Hill Education, New York. Johnson, G. & Yip, G. (2007) Transforming Strategy. Business Strategy Review Spring 2007. Kelleher, G., El-Rhalibi, A. & Arshad, F. (2003) Scheduling for intermodal transport. Logistics Information Management, Vol. 16 Issue 5. Kerr, John (2006) What’s the Right Role for Global 3PLs? Logistics Management, Vol. 45 Issue 2. Korth, Kim (2007) Facing changing market demands. Automotive Design & Production, Vol. 119 Issue 6. Kotler, Philip (2003) Marketing Management 11th edition. Pearson Education, Inc., Upper Saddle River, New Jersey. Kyrö, Paula (2004) Benchmarking as an action research process. Benchmarking: An International Journal, Vol. 11 Issue 1. Lambert, D., Stock, J., and Ellram, L. (1998) Fundamentals of Logistics Management. McGraw-Hill Higher Education. Larsson Anders (2002) The Development and Regional Significance of the Automotive Industry: Supplier Parks in Western Europe. International Journal of Urban and Regional Research, Vol. 26 Issue 4. Lekvall, P. & Wahlin, C. (2001) Information för marknadsföringsbeslut. Högsbo grafiska, Göteborg. Lieb, R. & Miller, J. (2002) The Use of Third-party Logistics Services by Large US Manufacturers, The 2000 Survey. International Journal of Logistics: Research and Application, Vol. 5 Issue 1.

REFERENCES
-121-
Lindgren, M. & Bandhold, H. (2003) Scenario planning – the link between future and strategy. Creative Print & Design, Wales. Ludwig Christopher (2007) AL Europe Conference Report www.automotivelogisticseurope.com/autologisticseurope/article/ale-200703-conf-report-full.doc MacCarthy, B.L. & Atthirawong W. (2003) Factors affecting location decisions in international operations – a Delph study. International Journal of Operations & Production Management, Vol. 23 Issue 7. Makukha, K. & Gray, R. (2004) Logistics Partnerships Between Shippers and Logistics Service Providers: The Relevance of Strategy. International Journal of Logistics Research and Applications, Vol. 7 No.4. May H. Graham (2005) Transport in Europe: Where are we going? Foresight, Vol. 7 No. 6. McKinnon C. Alan (2006) A review of European truck tolling schemes and assessment of their possible impact on logistics system. International Journal of Logistics: Research and applications, Vol. 9 No.3. Mentzer, J. T. & Stank, P. T. (2006) Transportation Management Trends; The Gathering Storm. LQ, Vol. 12 Issue 1. Miles, Ian (2004) Scenario planning. Policy Research in Engineering, Science and Technology (PREST), University of Manchester, United Kingdom. MIT (2007), MIT’s homepage, www.sc2020.com Natter Ari (2007) Time Waits for No One. Traffic World, Vol. 271 Issue 32. Parry, G., Graves, A. and James-Moore, M. (2006) The threat to core competence posed by developing closer supply chain relationships. International Journal of Logistics: Research and Application, Vol. 9 Issue 3. Pidd (1998) Computer simulation in management science. John Wiley & Sons Ltd, Chichester. Porter E. Michael (2004) Competitive strategy: techniques for analyzing industries and competitors. Free Press, New York. Pruth, Magnus (2002) Kontrakt som styrmedel i TPL-samarbeten: existerande funktioner och utveckling av nya principer. Göteborg. Ramaswami Rama (2006) Cost confusion – An industry expert demystifies the fuel-transportation cost connection. Multichannel Marchant, Vol. 2 Issue 1.
REFERENCES
-122-
Reynolds B. Douglas (2000) The Energy Utilization Chain: Determining Viable Oil Alternative Technology. Energy Sources, Part A: Recovery, Utilization, and Environmental Effects, Vol. 22 Issue 3. Ribbink, D., Van Riel, C.R. A. and Semeijn, J. (2005) Policy Decisions and Modal Choice: An Example from the European Union. Transportation Journal, Vol. 44 Issue 1. Rothery, Andrew (1990) Modelling with spreadsheets. Studentlitteratur, Lund. Sathiendrakumar, R (2003) Greenhouse emission reduction and sustainable development. International Journal of Social Economics, Vol. 30 No.12. Sawhney, R. & Sumukadas, N. (2005) Coping with customs clearance uncertainties in global sourcing. International Journal of Physical Distribution & Logistics Management, Vol. 35 Issue 4. Schary & Skjött-Larsen (2001) Managing the global supply chain. Copenhagen business school press, Copenhagen. Schwartz, P. (1991) The Art of The Long View: Planning for the Future in an Uncertain World. Currency Doubleday, New York. Seideman, Tony (2003) Defining A Superior 3PL. World Trade, Vol. 16 Issue 10. Selviaridis, K. & Spring, M. (2007) Third party logistics: a literature review and research agenda. The International Journal of Logistics Management, Vol. 18 Issue 1. SHELL (2007) Shell’s homepage, www.shell.com Shinn, C. (2007) Financial KPIs –Understand key performance indicators and your half way to the loan you need. Professional Builder, Vol. 72 Issue 4. Sjöberg Caroline (2007-09-11, 2007-09-26), Environmental manager, VLC. Sussams, John E. (1992) Logistics Modelling. Pitman Publishing, London. The 3PL Origin and Evolution (2006). Traffic World, Vol. 270 Issue 22. The top 25 countries in North America, LQ Issue 4, 2005 Underwood Rick (2007) Outsourcing: Domestic Vs. Global. Food Logistics, Issue 95. Van der Heijden, Kees (1997) Scenarios – The Art of Strategic Conversation. John Wiley & Sons Ltd, Chichester. Volvo A (2007), Volvo’s homepage, www.volvo.com Volvo B (2007), internal documents.

REFERENCES
-123-
Vägverket (1997) Vägverkets samhällsekonomika kalkylmodell – Ekonomisk teroi och värderingar. Publikation 1997:130. Wallén, Göran (1996) Vetenskapsteori och forskningsmetodik. Studentlitteratur, Lund. Wallner, Jacques (2007) Stor brist på lastbilschaufförer. DN, 9th of June. Winterman, Denise (2007) All belly no brains. BBC News, 3rd of July. Woxenius, Johan (2005) Koldioxid – en ödesfråga för transporterna. Logistics in develop-ment, Chalmers University. Woxenius, Johan (2007), Docent, Logistics and transport, Chalmers University, Göteborg. WTO (2005), International Trade Statistics. Wälde, K. & Wood, C. (2004) The empirics of trade an growth: where are the policy recommendations. International Economics and Economic Policy, Vol. 1 Issue 2-3. Yin, Robert K. (2003) Case Study Research: design and methods. Sage Publications. 2006 Third-Party Logistics, Results and findings of the 11th annual study. John Langley, Capgemini

Definitions
EU European Union
GDP Growth Domestic Product
IS/IT Information System and
Information Technology
KPI Key Performance Indicator
Logistic provider (LP) The transport companies that VLC
contract as to execute the transports
LSP Logistic Service Provider
OEM Original Equipment Manufacturer –
refer to VLC’s customers in this
report
TPL Third Party Logistic
VLC Volvo Logistics Corporation
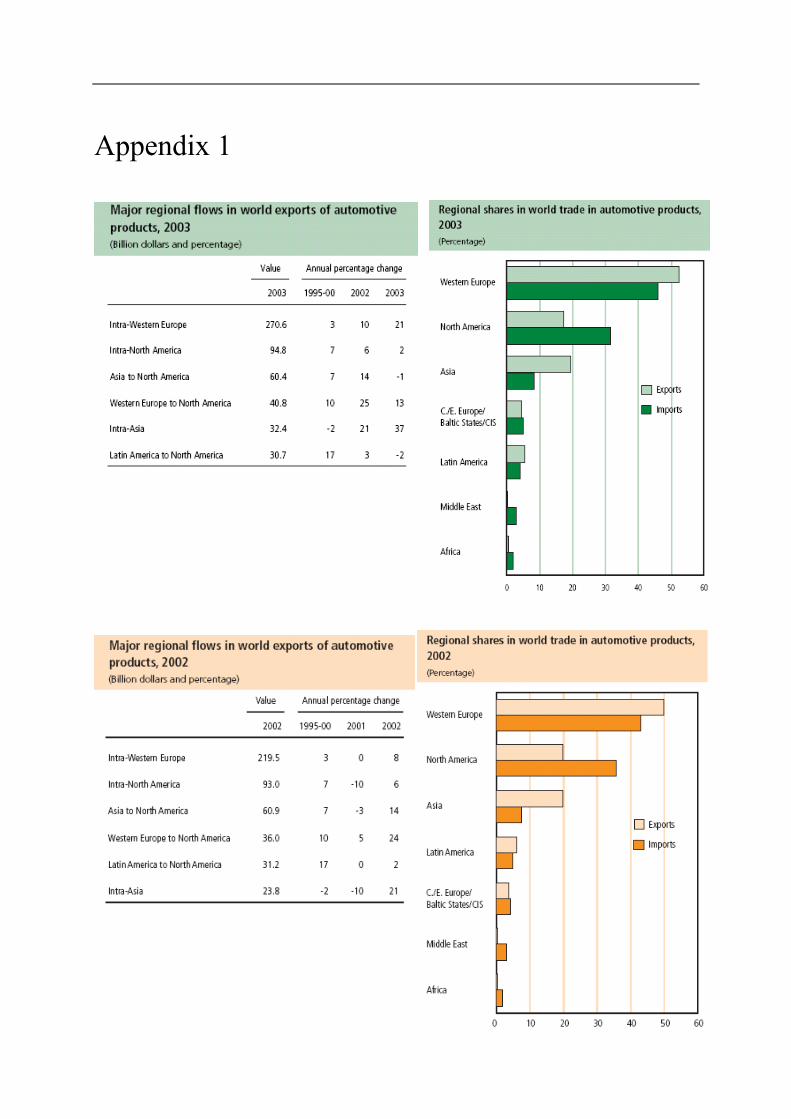
Appendix 1