Embed Size (px)
Citation preview

See discussions, stats, and author profiles for this publication at: https://www.researchgate.net/publication/260166692
A Memetic Optimization Strategy Based on Dimension Reduction
in Decision Space
Article in Evolutionary Computation · February 2014
DOI: 10.1162/EVCO_a_00122 · Source: PubMed
CITATIONS
12
5 authors, including:
Some of the authors of this publication are also working on these related projects:
Data-driven surrogate-assisted evolutionary fluid dynamic optimization View project
Handing Wang
University of Surrey
30 PUBLICATIONS 284 CITATIONS
SEE PROFILE
Shan He
University of Birmingham
70 PUBLICATIONS 1,791 CITATIONS
SEE PROFILE
All content following this page was uploaded by Handing Wang on 11 January 2015.
The user has requested enhancement of the downloaded file.

A Memetic Optimization Strategy Based onDimension Reduction in Decision Space
Handing Wang [email protected] Lab of Intelligent Perception and Image Understanding of Ministryof Education, International Research Center of Intelligent Perception andComputation, Xidian University, Xi’an, 710071, China
Licheng Jiao [email protected] Lab of Intelligent Perception and Image Understanding of Ministryof Education, International Research Center of Intelligent Perception andComputation, Xidian University, Xi’an, 710071, China
Ronghua Shang [email protected] Lab of Intelligent Perception and Image Understanding of Ministryof Education, International Research Center of Intelligent Perception andComputation, Xidian University, Xi’an, 710071, China
Shan He [email protected] of Computer Science, The University of Birmingham, B152TT, UK
Fang Liu [email protected] of Computer Science and Engineering, Key Lab of IntelligentPerception and Image Understanding of Ministry of Education,Xidian University, Xi’an, 710071, China
doi:10.1162/EVCO_a_00122
AbstractThere can be a complicated mapping relation between decision variables and objectivefunctions in multi-objective optimization problems (MOPs). It is uncommon that deci-sion variables influence objective functions equally. Decision variables act differently indifferent objective functions. Hence, often, the mapping relation is unbalanced, whichcauses some redundancy during the search in a decision space. In response to thisscenario, we propose a novel memetic (multi-objective) optimization strategy based ondimension reduction in decision space (DRMOS). DRMOS firstly analyzes the map-ping relation between decision variables and objective functions. Then, it reduces thedimension of the search space by dividing the decision space into several subspacesaccording to the obtained relation. Finally, it improves the population by the memeticlocal search strategies in these decision subspaces separately. Further, DRMOS hasgood portability to other multi-objective evolutionary algorithms (MOEAs); that is, itis easily compatible with existing MOEAs. In order to evaluate its performance, weembed DRMOS in several state of the art MOEAs to facilitate our experiments. Theresults show that DRMOS has the advantage in terms of convergence speed, diver-sity maintenance, and portability when solving MOPs with an unbalanced mappingrelation between decision variables and objective functions.
KeywordsMulti-objective optimization, evolutionary algorithm, memetic algorithm, dimensionreduction, local search, portability.
Manuscript received: November 7, 2011; revised: May 22, 2012, February 4, 2013, and November 13, 2013;accepted: February 1, 2014.C© by the Massachusetts Institute of Technology Evolutionary Computation xx(x): 1–32
Evolutionary Computation corrected proofdoi:10.1162/EVCO_a_00122 by the Massachusetts Institute of Technology

H. Wang, L. Jiao, R. Shang, S. He, and F. Liu
1 Introduction
Many excellent MOEAs have been developed recently, and some of them have beensummarized in the literature (Coello, 1999; Zitzler and Thiele, 1998; Zitzler et al., 2000;Khare et al., 2003). Among them, NSGA-II (Deb et al., 2002a) and SPEA2 (Zitzler et al.,2001) are the most popular. NSGA-II is well known for its fast non-dominated sort ondominance ranking and crowding distance on diversity maintenance, and SPEA2 iswell known for its environmental selection on the basis of both dominance ranking anddiversity maintenance. Recently, some MOEAs with new selection techniques have beenproposed. For example, ε-MOEA (Deb et al., 2005) adopts ε-dominance to improve itsperformance; MOEA/D (Zhang et al., 2008b) applies the decomposition idea as a newselection pressure; hypervolume-based MOEA (Bader and Zitzler, 2011) performs wellon many-objective optimization problems; TDEA (Karahan and Koksalan, 2010) usesthe territory defining idea in its diversity maintenance mechanism; and memetic-basedMOEAs (Goh et al., 2009; Knowles and Corne, 2000) use local search to solve MOPs.
As the mapping relation between the decision variables and the objective functionsof MOPs is considerably more complicated than that of single-objective optimizationproblems, MOEAs face new challenges. It is quite uncommon for an MOP that all itsdecision variables influence one objective function value to the same extent. An unbal-anced mapping relation in which different decision variables affect any given objectivevalue differently often appears. However, existing MOEAs treat all the decision vari-ables equally. Because of this, they waste their search resources on decision variablesthat only slightly affect one objective function. Thus, the unbalanced mapping relationcauses some redundancy as a result of unnecessary search. MOEAs should focus theirsearch resources on the decision variables that significantly affect the objective function,which is a type of dimension reduction. The mapping relation is a natural characteristicof MOPs, which can be regarded as prior knowledge. MOEAs using prior knowledgefor local search can be seen as memetic algorithms (MAs). In order to reduce the diffi-culty of MOPs, a considerable amount of work on dimension reduction (Brockhoff andZitzler, 2009; Saxena and Deb, 2007; Lopez Jaimes et al., 2009; Corne and Knowles, 2007)and prior knowledge-based MAs (Meuth et al., 2009; Ong et al., 2010) has already beencarried out. A brief introduction of these two types of technologies is presented below.
Dimension Reduction
Dimension reduction has been widely applied in the fields of data mining and statis-tics as it maximally approximates the original problems by keeping important featuresand deleting others. Thus, the difficulties of the original problems can be reduced.In the field of many-objective optimization problems (MOPs with more than threeobjectives), dominance relations (Kukkonen and Lampinen, 2007; Sato et al., 2007),preference-based methods (Thiele et al., 2009), visualization (Pryke et al., 2007) anddimension reduction (Brockhoff and Zitzler, 2009) are the four main topics. The studyof dimension reduction focuses mainly on the objective space. As the Pareto dominancerelation hardly contributes to the selection in many-objective optimization problems,it is necessary to reduce the dimension of the objective space. The dimension can bereduced when objectives are correlated (Ishibuchi et al., 2011). The mainstream meth-ods can be classified into three types: dimension reduction preserving the dominancerelation (Brockhoff and Zitzler, 2009), dimension reduction based on a feature selectiontechnique (Lopez Jaimes et al., 2008), and dimension reduction by PCA to remove theless important objectives (Jolliffe, 2002). In the decision space of an MOP, the linkage
2 Evolutionary Computation Volume xx, Number x
Evolutionary Computation corrected proofdoi:10.1162/EVCO_a_00122 by the Massachusetts Institute of Technology

A Memetic Optimization Strategy DRMOS
between variables also increases its difficulty (Deb et al., 2006). Some researchers haveattempted to reduce the dimension of decision space. For example, RM-MEDA (Zhanget al., 2008a) approximates a solution set by several lines.
MA
MA, emphasizing heuristic search is attracting increasing attention. Unlike the globalsearch evolutionary algorithm (EA), MA is a combination of heuristic local searchand global search (Meuth et al., 2009; Ong et al., 2010). In MA, a meme represents akind of local search. Lamarckian learning (Le et al., 2009; Ong and Keane, 2004; Lianget al., 2000a, 2000b), the multi-meme MA (Krasnogor and Smith, 2005), and Baldwinianlearning (Gong et al., 2010) are different types of MAs. Recently, the adaptive MA, whichadaptively selects suitable memes for different problems, has become popular in thefield of MAs (Ong et al., 2006). MAs are powerful in solving real-world problems withprior knowledge. Memes can be designed according to the prior knowledge. MAs aimto solve specific problems, such as traveling salesman problems (TSPs; Lim et al., 2008),job-shop scheduling problems (Hasan et al., 2009), filter design (Tirronen et al., 2008),HIV multidrug therapy design (Neri et al., 2007), and PMSM drives control design(Caponio et al., 2007). It is worth noting that MA has already been successfully appliedto MOPs (Goh et al., 2009; Knowles and Corne, 2000).
Taking the related work mentioned above as a foundation, we propose a memeticoptimization strategy based on dimension reduction in decision space (DRMOS) in thispaper. This strategy improves individuals by local search in the decision subspaces afterdimension reduction. Given below are the contributions of this paper.
Analysis of the Relation Between Decision Variables andObjective Functions
An unbalanced mapping relation between decision variables and objective functions isvery common in most MOPs, which is obtained as the prior knowledge for memeticlocal search strategies. DRMOS obtains the relation between decision variables andobjective functions by a statistical analysis approach from samples.
Memetic Local Search Strategy
With the above heuristic information about the relation between decision variablesand objective functions, DRMOS divides the decision space into several subspaces formemetic local search strategies, which decreases the dimension of the decision space.
Portability to Other MOEAs
DRMOS is similar to a patch in the system of MOEAs which can improve their perfor-mance on MOPs with the unbalanced mapping relation.
The rest of this paper is organized as follows. The related definitions are introducedin Section 2. Section 3 describes the details of DRMOS, such as its basic idea, a relationanalysis approach, memetic local search strategies, and its portability to MOEAs. Com-parative experiments with the applications of DRMOS to other MOEAs are presentedin Section 4. Finally, Section 5 concludes the discussion.
Evolutionary Computation Volume xx, Number x 3
Evolutionary Computation corrected proofdoi:10.1162/EVCO_a_00122 by the Massachusetts Institute of Technology
H. Wang, L. Jiao, R. Shang, S. He, and F. Liu
2 Related Definitions
2.1 Definitions of MOP
An m-objective optimization problem can be represented as Equation (1),
Minimize F(x) = (f1(x), f2(x), . . . fm(x))T
Subject to x ∈ X(1)
where X ⊂ Rn is its feasible space and x = {x1, x2, . . . , xn}T is the decision variable. F(x)is the objective function in an Rm space.
If x′ and x′′ are two decision vectors, then their corresponding objective values areF(x′) = (f1(x′), f2(x′), . . . fm(x′))T and F(x′′) = (f1(x′′), f2(x′′), . . . fm(x′′))T . If fi(x′) ≤ fi(x′′)(i = {1, 2, . . . , m}), and F(x′) �= F(x′′), then it is denoted as F(x′) ≺ F(x′′). x∗ ∈ X is Paretooptimal, only if there is no x ∈ X such that F(x) ≺ F(x∗). The set of all Pareto optimalsolutions in X is called the Pareto Set (PS). Further, the set of all the Pareto optimalobjective values PF = {F(x)|x ∈ PS} is called the Pareto Front (PF; Miettinen, 1999).
2.2 Decision Subspace
Decision variables influence objective function values differently in most MOPs, form-ing a type of unbalanced mapping relation. Equation (2) is an example used for explain-ing the unbalanced mapping relation. In Equation (2), decision variable x3 is unrelatedto objective f1. The search for x3 is unnecessary for f1. However, the case in Equation (2)is an extreme situation of the unbalanced mapping relation. Mostly, the unbalancedmapping relation appears in MOPs with some decision variables that have little in-fluence on some objective functions. In summary, redundancy does exist in the searchspace of some objectives. The decision space of MOPs with the unbalanced mappingrelation can be divided into several subspaces for dimension reduction.{
f1 = x2(1 − x1)
f2 = x3x1(2)
Ideally, for an MOP with m objectives, its decision space can be divided into m + 1decision subspaces. Subspace Si (1 ≤ i ≤ m) is the subspace spanned by the decisionvariables related to objective fi only. Equation (3) is its definition, where xJi
is theorthogonal basis of subspace Si, Ji is the index set of xJi
. L(xJi) is the subspace spanned
by decision variables xJi. It is noteworthy that the partial derivatives in Equation (3)
simply represent whether the decision variables and the objective functions are related(including both linear and nonlinear correlation). There are no requirements for thedifferentiability of the objective functions. The m + 1th decision subspace Sothers is theorthogonal complementary set of the former m subspaces’ union set, which is shown inEquation (4). Subspace Sothers is spanned by the decision variables related to multipleobjectives. As these m + 1 subspaces are definitely disjointed, their direct sum is theentire decision space as shown in Equation (5), where “+” means sum, and “⊕” meansdirect sum. The distance d in subspace S can be calculated using Equation (6), in whichJ is the index set of S’s orthogonal basis and dj is the projection on xj.
Si = L(xJi), Ji =
{j
∣∣∣∣ ∂fi
∂xj
�= 0, and∂fk
∂xj
= 0, 1 ≤ k ≤ m, k �= i
}(3)
Sothers =(
m∑i=1
Si
)⊥= L(xJothers ), Jothers =
m⋃i=1
Ji (4)
4 Evolutionary Computation Volume xx, Number x
Evolutionary Computation corrected proofdoi:10.1162/EVCO_a_00122 by the Massachusetts Institute of Technology

A Memetic Optimization Strategy DRMOS
S1 + . . . Si + . . . Sm + Sothers = S1 ⊕ . . . Si ⊕ . . . Sm ⊕ Sothers = Rm, (1 ≤ i ≤ m) (5)
d =√∑
j∈J
d2j (6)
It is clear that objective fi can be optimized in subspace Si independently, with noinfluence on the other objectives. It is obvious that subspace Si is smaller than the entiresearch space. The dimension of the decision space is reduced through the decisionsubspace division. For an individual P, objective fi can be optimized independentlyby simply searching in subspace Si. Then, the obtained individual P ′ cannot be worsethan P. In other words, subspaces Si (1 ≤ i ≤ m) only affect convergence. Further, thedecision variables in subspace Sothers are related to multiple objectives. Subspace Sothersis related to both convergence and diversity. If every objective function depends onall the decision variables in an MOP, it cannot be decomposed into such subspacesby the above strong assumption. It is still an unbalanced case if decision variables actdifferently for different objective functions. It is less progressive to search on the decisionvariables that influence objective functions slightly. The above concept is expanded forcommon MOPs in Section 2.3.
2.3 MOPs Can Be Dimension-Reduced in Decision Space
2.3.1 MOPs Can Be Strictly Dimension-Reduced in Decision SpaceIf an MOP can be decomposed into the above decision subspaces, the MOP can bedimension-reduced in its decision space. In other words, there are some decision vari-ables that are related only to some objectives. The definition of such a dimensionreduction’s condition is shown in Equation (7), where n is the dimension of the entiredecision space. If an MOP strictly satisfies the above definition, it can be referred to asstrictly dimension-reduced in the decision space.
|Sothers| < n (7)
2.3.2 MOPs Can Be Weakly Dimension-Reduced in Decision SpaceThe MOPs that can be strictly dimension-reduced in the decision space are very specialbecause the requirements of the decision subspace division are very strict. Withoutlosing generality, the requirements of strict dimension reduction should be relaxed forthe weak dimension reduction. Subspace Si (1 ≤ i ≤ m) is redefined as the subspacespanned by the decision variables that considerably impact objective fi only. If an MOPsatisfies Equation (7) in its redefined subspace, it has an unbalanced mapping rela-tion between decision variables and objective function values and it can be weaklydimension-reduced in the decision space. Furthermore, the relation between the deci-sion variables and the objective functions can be expressed in terms of some statisticalfeatures. Our specific approach is discussed in Section 3.2.
If the variance of one objective is large, it means that the decision variable has asignificant influence on that objective function; otherwise, it suggests that the influenceof the decision variable on that objective function is not significant.
Provided that an MOP can be weakly dimension-reduced in its decision space,the median of objectives’ variances can be set as the threshold for the measurement ofthe influence between one decision variable and objectives. If one objective’s varianceis larger than the threshold, the decision variable is regarded to have considerableinfluence on the objective.
Evolutionary Computation Volume xx, Number x 5
Evolutionary Computation corrected proofdoi:10.1162/EVCO_a_00122 by the Massachusetts Institute of Technology

H. Wang, L. Jiao, R. Shang, S. He, and F. Liu
Table 1: Different reduction rates of different 3-objective problems.
Case number Situation Reduction rate
1 |Sothers| = 12,|S1| = |S2| = |S3| = 0 02 |S1| = 12,|Sother| = |S2| = |S3| = 0 0.6673 |S1| = |S2| = |S3| = 4,|Sothers| = 0 0.8894 |S1| = |S2| = |S3| = |Sothers| = 3 0.667
Figure 1: Flowchart of DRMOS.
2.3.3 Reduction RateThe mapping relation between decision variables and objective functions in differentMOPs is different. The reduction rate is defined as Equation (8) to measure the degreeof dimension reduction in the decision space. The larger the reduction rate, the largeris the number of dimensions that can be reduced and the more is the computationalcost that can be saved. Further, a reduction rate of 0 means that the MOP cannot bedimension-reduced in the decision space. Considering an MOP with three objectivesand 12 decision variables as an example, in Table 1, we illustrate the definition ofreduction rate. In subspace Sothers, there are multiple objectives to be considered; conse-quently, their weights in the reduction rate are larger than the ones in subspaces Si (1 ≤ i
≤ m).
Rdecision reduction =(
1 − |Sothers| m + max(|S1| , . . . . |Si | , . . . |Sm|)nm
), (1 ≤ i ≤ m) (8)
3 Memetic Optimization Strategy Based on DimensionReduction in Decision Space
3.1 Basic Idea
All MOPs are considered as the problems that can be weakly dimension-reduced inDRMOS. DRMOS aims at improving the searching ability of existing MOEAs on suchMOPs. DRMOS obtains the mapping relation to reduce the dimension of the decisionspace and applies memetic local search strategies in the divided decision subspaces; theflow-chart of DRMOS is shown in Figure 1.
As shown in Figure 1, DRMOS consists of two major procedures, namely, rela-tion analysis and memetic local search. The former is used for gaining informationwhere the mapping relation is learned via sampling. Then the decision space is dividedinto several subspaces according to that heuristic information. Finally, memetic localsearch strategies are applied to optimize each objective in their corresponding decision
6 Evolutionary Computation Volume xx, Number x
Evolutionary Computation corrected proofdoi:10.1162/EVCO_a_00122 by the Massachusetts Institute of Technology

A Memetic Optimization Strategy DRMOS
subspaces. The relation analysis result is dynamically updated. Memetic local searchstrategies are adjusted according to the dynamical information updated by the relationanalysis approach.
3.2 Relation Analysis Approach
The mapping relation plays an important role in DRMOS. Some work on the predictionof such a relation has been done. For example, an artificial neural network (Adra et al.,2009; Gaspar-Cunha and Vieira, 2004) is used for mapping an objective space locallyback to the decision space; the estimation of distribution algorithm (EDA) in Larranagaand Lozano (2002) builds a probability distribution model of variables on the basis ofthe statistical information; a Bayesian network (Laumanns and Ocenasek, 2002; Khanet al., 2002) adopts a probabilistic model of variables. The mentioned work serves as aninspiration to form our relation analysis approach.
As mentioned above, our approach relies on a simple statistical characteristic ofsamples. It uses the variances of the samples’ corresponding objective values to predictthe level of their influence. If the variance of one objective is small, the decision variableimpacts the objective slightly; otherwise, it impacts the objective significantly. Themedian of all the objectives’ variances is set as a threshold for such measurement.The prediction of one decision variable to objectives can be obtained from the abovesamples locally with a credibility C. Multiple samplings and predictions are adopted inour approach. Their consistency increases C, while their inconsistency decreases C. Ourapproach is described in Table 2 in detail by MATLAB notations. In Table 2, C
(kj )i is the
credibility of the prediction between decision variable xj and objective fk after the ithsampling. When it is sufficiently high, the prediction can be used for the later memeticlocal search strategies. Because the mapping relation of xj to all the objectives in MOPsis independent, the total credibility C
j
totalican be calculated using Equation (9). Further,
Cj
totaliis used as a kind of probability to control the sampling on xj. That is, when C
j
totali
Evolutionary Computation Volume xx, Number x 7
Evolutionary Computation corrected proofdoi:10.1162/EVCO_a_00122 by the Massachusetts Institute of Technology

H. Wang, L. Jiao, R. Shang, S. He, and F. Liu
is large, too many times of sampling on xj are unnecessary.
Cj
totali=
m∏k=1
C(kj )i (9)
As indicated above, the obtained mapping relation is a kind of prediction result,which means that it may not be the right result. When all the credibility of decisionvariable xj (Cj
total) is larger than a threshold T, the relation prediction can be usedfor the decision subspace division. The process of relation analysis is very importantfor DRMOS. Without the mapping relation, memetic local search strategies cannot beapplied. T plays a very important role in DRMOS. If T is small, then the prediction maybe a wrong guide for memetic local search strategies in the divided subspace. If T islarge, it would incur a significant computational cost for sampling. The experimentalanalysis of the influence of T on the entire DRMOS is discussed in Section 4.2.
3.3 Memetic Local Search Strategy
According to the mapping relation obtained in the relation analysis approach, the entiredecision space can be divided into several disconnected subspaces for the separateoptimization. That is, objective fi can be optimized independently through a local searchin subspace Si, where the decision variables with little influence on other objectives canbe ignored. The memetic local search strategies in DRMOS aim at improving individualsthrough the search in subspace Si (1 ≤ i ≤ m) to optimize objective fi as shown in Table 3.Every objective is optimized in the corresponding subspace, which is relatively easy tobe solved even by a classical genetic algorithm (GA) in DRMOS. In the experimentsreferred to in this paper, a classical GA is used for the local search. The stopping criterionis 2000 function evaluations.
3.3.1 Two Memetic Local Search StrategiesConvergence and diversity are both important for MOEAs. Two memetic local searchstrategies are designed to improve the performance on convergence and diversity in DR-MOS. They both improve the individuals in subspace Si (1 ≤ i ≤ m) as shown in Table 3;however, they improve different individuals. Strategy 1 aims to improve the individualsin the current population to improve convergence. Strategy 2 aims at diversity. UnlikeStrategy 1, Strategy 2 does not choose the individuals in the current population. It addsartificial individuals in the less-explored areas of subspace Sothers, where the individu-als in the current population are not crowded by the harmonic distance measurement(Wang et al., 2010). As Table 4 shows, the center of the neighborhood of the individualwith the largest harmonic distance is used as the artificial individual in Strategy 2.
A memetic local search strategy requires extra function evaluations. Therefore,memetic local search strategies in DRMOS should be made good use of, but wastefunction evaluations if they are not properly used. For all MAs, the balance betweenglobal search and local search is an important research problem (Ishibuchi and Mu-rata, 1998; Ishibuchi et al., 2003; Jaszkiewicz, 2002). In DRMOS, when the results of the
8 Evolutionary Computation Volume xx, Number x
Evolutionary Computation corrected proofdoi:10.1162/EVCO_a_00122 by the Massachusetts Institute of Technology

A Memetic Optimization Strategy DRMOS
Table 4: Local search method in Sother.
Parameter: m: the number of objectives1 Calculate the m-neighbor harmonic distances in Sother of all the solutions.2 Find the individual P with the largest harmonic distance.3 Artificial individual Pa is the center of P’s m-nearest neighbors.4 Local search Pa in Si (1 ≤ i ≤ m) as in Table 3.
relation analysis approach are reliable (all the Cj
totalivalues are larger than T), memetic
local search strategies can be executed. In order to reduce the number of functionevaluations, DRMOS avoids improving the similar individuals in memetic local searchstrategies. DRMOS opens a set record to store the improved individuals. After an in-dividual is improved by a memetic local search, its decision variables are copied intorecord as a reference for the similarity measurement for the other individuals. In otherwords, before applying memetic local search strategies to a selected individual P, a sim-ilarity comparison with all the individuals in record is carried out, where the similarityis measured by the Euclidean distance in Sothers. If the distance is smaller than the 1/N
diagonal of the feasible area in Sothers, DRMOS will drop this individual and chooseanother one from the current population until the entire population is compared.
3.3.2 Interaction between Two StrategiesConvergence and diversity are two important topics in MOPs. However, when the com-putational time is limited, convergence must be considered first. In DRMOS, Strategy1 is employed first to improve convergence. When all the individuals in the currentpopulation are similar to the members in record, Strategy 2 is applied in order to adddiversity. The details are shown in Table 5. On one hand, the use of Strategy 1 can enablethe population to evolve toward the true PF; on the other hand, the use of Strategy 2can effectively maintain the diversity of the population.
Compared with the mutation strategy, Strategy 2 has more advantages. The mu-tation strategy has almost no prior knowledge. Although it also generates individualsin the less explored areas, the fitness of these individuals may be not sufficiently goodfor surviving in the selection after the mutation strategy. However, Strategy 2 generatesindividuals in the less-explored areas and improves them at the same time.
3.4 Portability
DRMOS is designed to improve existing MOEAs for the MOPs that can be weaklydimension-reduced in the decision space. DRMOS can be applied as an offspring
Evolutionary Computation Volume xx, Number x 9
Evolutionary Computation corrected proofdoi:10.1162/EVCO_a_00122 by the Massachusetts Institute of Technology

H. Wang, L. Jiao, R. Shang, S. He, and F. Liu
Figure 2: DRMOS embedding in MOEAs.
Table 6: Reference points for calculation of Hypervolume.
UF1 UF2 UF3 UF4
(2.47319,3.33898) (1.61623,1.34417) (1.53571,4.64725) (1.14112,1.15319)UF5 UF6 UF7 UF8
(6.28565,4.51234) (2.96617,2.47571) (3.02704,3.21249) (2.56648,16.0847,6.02378)UF9 UF10 ZDT1 ZDT2
(18.8221,16.5887,2.8220) (16.5010,29.7562,25.3066) (1.00000,1.17915) (1.00000,1.00000)ZDT3 ZDT4
(1.00000,1.00000) (1.00000,19.8939)
generation method; that is, DRMOS can be embedded in MOEAs by adding the in-dividuals obtained through DRMOS to the current population, as shown in Figure 2.
In Figure 2, the solid line represents the general flow of MOEAs, and the dotted linerepresents DRMOS. DRMOS does not affect the flow of MOEAs. Hence, DRMOS canbe easily introduced into MOEAs. In this paper, we refer to MOEA XXX with DRMOSas DR_XXX. For example, NSGA-II with DRMOS is called DR_NSGA-II.
4 Simulation Results
In order to evaluate the performance of DRMOS, DRMOS is embedded into severalpopular MOEAs. The experiment includes three parts: parameter analysis, an exper-iment on the two memetic local search strategies, and a comparative experiment onbenchmark problems.
4.1 Metrics
Many metrics can be used for evaluating the performance of MOEAs. Since every metrichas its own disadvantages, multiple metrics are employed in our experiments.
4.1.1 HypervolumeHypervolume (Zitzler and Thiele, 1999) evaluates the size of space in the objective space,covered by non-dominated solutions to a reference point. It can reflect both convergenceand maximum spread. In this study, the reference points are set as the maximum valuesobtained in the results of all the comparative algorithms, as given in Table 6.
10 Evolutionary Computation Volume xx, Number x
Evolutionary Computation corrected proofdoi:10.1162/EVCO_a_00122 by the Massachusetts Institute of Technology

A Memetic Optimization Strategy DRMOS
4.1.2 PurityPurity (Bandyopadhyay et al., 2004) is used for comparing the convergence ability ofcomparative algorithms. Q non-dominated solution sets from Q algorithms are includedin the comparison, written as Ri(1 ≤ i ≤ Q). R is the union set of Ri(1 ≤ i ≤ Q). R∗ isthe non-dominated solution set of R. R∗
i is defined as R∗i = {α|α ⊂ R∗ and α ⊂ Ri}. The
purity of the ith algorithm is Equation (10), where ri is the number of non-dominatedsolutions in Ri and r∗
i is the number of non-dominated solutions in R∗i . The larger
its value, the greater is the convergence that the algorithm has of all the comparedalgorithms.
Purityi = r∗i
ri
(10)
4.1.3 Minimal SpacingMinimal Spacing (Bandyopadhyay et al., 2004) is a modified version of the uniformitymetric SP (Van Veldhuizen and Lamont, 2000), as shown in Equation (11). In Equation(11), di is not duplicated, different from the one in SP. If we take solutions j and k asexamples, they are their own nearest neighbors. The distance from j to k is used as bothdj and dk in SP. This distance can only be used for one solution in Minimal Spacing.That is, when Minimal Spacing is calculated, all the used distances are marked. di is thenearest distance among the unmarked distances from solution i.
Sm =√√√√ 1
|N |N∑
i=1
(di − d)2 (11)
4.2 Parameter Analysis
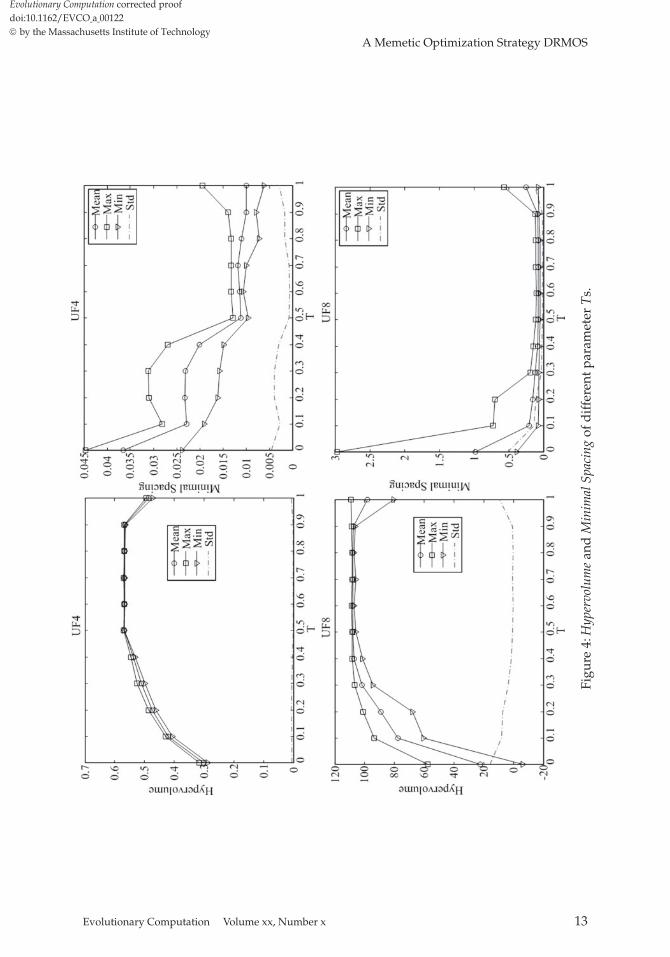
Compared with other MOEAs, parameter T is unique in DRMOS. Therefore, in thissection, we analyze the effect of parameter T on the behavior of the relation analysisapproach. NSGA-II with DRMOS is adopted for the experiment discussed in this section.The original crowding distance has some disadvantages with respect to diversity (Yanget al., 2010). In order to avoid this drawback, the diversity maintenance in Yang et al.(2010) is used. Thus, the algorithm is written as DR_NSGA-II_KN. As the range of Tis in [0,1], T is sampled uniformly by the interval 0.1 for the 2-objective problem UF4and the 3-objective problem UF8 in 300,000 function evaluations in the experiment. Onthe one hand, we analyze the behavior of the relation analysis approach by the numberof function evaluations and the accuracy rate of the divided subspaces, as shown inFigure 3. On the other hand, we also analyze the influence on the final result usingHypervolume and Minimal Spacing, as shown in Figure 4.
In Figure 3, the number of function evaluations increases with an increase in T.Our relation analysis approach increases the computational cost with an increase in T.When T is larger than 0.5, the accuracy rate reaches 1. The extra function evaluationsare useless. Similarly, the situation is reflected in the final result shown in Figure 4.When T is small, the performance of DRMOS is poor because the prediction result haslittle credibility. Then the subspaces are wrongly divided according to the incorrectinformation. Finally, the local search turns out to be ineffective. When T is larger than0.5, the performance of DRMOS drops gently because the memetic local search strategyis applied in the correctly divided subspaces. However, the large T for sampling incursa relatively high computational cost. From the above, we can see that there is a trade-off for the selection of T between the right mapping relation and the fewest functionevaluations.
Evolutionary Computation Volume xx, Number x 11
Evolutionary Computation corrected proofdoi:10.1162/EVCO_a_00122 by the Massachusetts Institute of Technology

H. Wang, L. Jiao, R. Shang, S. He, and F. Liu
Figure 3: Number of function evaluations and accuracy rate of relation analysis ofdifferent T s.
The principle of choosing T is “using the fewest function evaluations for the correctmapping relation.” From the result in Figures 3 and 4, 0.5 is the best option for the2-objective and 3-objective problems.
4.3 Experiment on Two Memetic Local Search Strategies
Strategy 1 and Strategy 2 are two memetic local search strategies for MOPs. Especially,Strategy 2 brings a new idea to multi-objective MAs. Therefore, its behavior is analyzedin this section by comparing the DR_NSGA-II_KNs with and without Strategy 2 onUF4 and UF8. All the parameter settings are the same as that in Section 4.2. The resultsof Purity, Minimal Spacing, and Hypervolume are shown in Table 7. We find that theDR_NSGA-II_KN with Strategy 2 has better performance on both convergence anddiversity than the DR_NSGA-II_KN without Strategy 2, especially on the 3-objectiveproblem UF8. Since Strategy 2 can add diversity to the population, it slightly improvesthe performance of MOEAs.
In order to show the interaction between Strategy 1 (for convergence) and Strategy2 (for diversity), the average call numbers of Strategy 1 and Strategy 2 of DR_NSGA-II_KN on UF4 and UF8 are recorded in Table 8. For the 2-objective problem UF4,Strategy 1 is called for 75 times, whereas Strategy 2 is called for five times. For the3-objective problem UF8, Strategy 1 is called for 34 times, whereas Strategy 2 is calledfor nine times. Strategy 2 is called more times for 3-objective problems than 2-objectiveproblems, because the diversity of 3-objective problems is harder to maintain than thatof 2-objective problems. Therefore, the interaction between Strategy 1 and Strategy 2 isrobust for different problems.
4.4 Benchmark Problems
As DRMOS aims to solve the MOPs that can be weakly dimension-reduced in the deci-sion space, we only employ such problems in the experiment. We choose the problemswhose reduction rates are not zero, such as the UF (Zhang et al., 2008b) and ZDT (Zit-zler et al., 2000) problems, rather than the DTLZ problems (Deb et al., 2002b). Theirreduction rates are shown in Table 9.
In order to present the portability of DRMOS, NSGA-II (Deb et al., 2002a), NSGA-II_KN, SPEA2 (Zitzler et al., 2001), and TDEA (Karahan and Koksalan, 2010) are chosen
12 Evolutionary Computation Volume xx, Number x
Evolutionary Computation corrected proofdoi:10.1162/EVCO_a_00122 by the Massachusetts Institute of Technology
A Memetic Optimization Strategy DRMOS
Figu
re4:
Hyp
ervo
lum
ean
dM
inim
alSp
acin
gof
dif
fere
ntpa
ram
eter
Ts.
Evolutionary Computation Volume xx, Number x 13
Evolutionary Computation corrected proofdoi:10.1162/EVCO_a_00122 by the Massachusetts Institute of Technology
H. Wang, L. Jiao, R. Shang, S. He, and F. Liu
Table 7: Metrics Purity, Minimal Spacing, and Hypervolume of the DR_NSGA-II_KNswith and without Strategy 2 (S2) on UF4 and UF8.
Purity Minimal Spacing Hypervolume
With S2 Without S2 With S2 Without S2 With S2 Without S2Average SD Average SD Average SD Average SD Average SD Average SD
UF4 0.5053 0.0224 0.4947 0.0224 0.0095 0.0009 0.0095 0.0007 0.3820 0.0004 0.3818 0.0004UF8 0.5020 0.0182 0.4980 0.0182 0.0686 0.0134 0.0730 0.0122 0.8941 0.0225 0.8918 0.0197
Table 8: Average call numbers of Strategy 1 and Strategy 2 of DR_NSGA-II_KN on UF4and UF8.
Strategy 1 Strategy 2
UF4 75 5UF8 34 9
Table 9: Reduction rate of existing test problems.
UF1∼UF7 UF8∼UF10 ZDT1∼ZDT4 DTLZ1∼DTLZ4
71.6% 82.2% 48.3% 0%
to embed DRMOS in the comparative experiment. The corresponding algorithms withDRMOS are called DR_NSGA-II, DR_NSGA-II_KN, DR_SPEA2, and DR_TDEA. In ad-dition, MOEA/D (Zhang et al., 2008b) is well known for its ability to solve complicatedMOPs such as the UF problems; hence, it is also included in the comparative algorithms.Finally, the results with respect to the median of the Hypervolume in our experimentsare presented below. The metrics Purity, Hypervolume, and Minimal Spacing are selectedto evaluate results. The experiment parameters are set as shown in Table 10.
4.4.1 Results4.4.1.1 UF1. UF1 is a complicated problem with 30 decision variables, and its PS isa complicated curve restricted by x1. The resulting PFs of DR_NSGA-II, DR_NSGA-II_KN, DR_SPEA2, DR_TDEA, NSGA-II, NSGA-II_KN, SPEA2, TDEA, and MOEA/Dare shown in Figure 5. In that figure, DRMOS improves the convergence and diversity ofthe corresponding MOEAs, among which DRMOS improves TDEA’s diversity the mostand SPEA2’s convergence the most. The performance of MOEAs with DRMOS is betterthan that of MOEA/D. Comparing the results of DR_NSGA-II and DR_NSGA-II_KN,we can see that the uniformity in NSGA-II is improved by the diversity maintenance inYang et al. (2010).
4.4.1.2 UF2. UF2 is a complicated problem with 30 decision variables, and its PS is acomplicated curve restricted by x1, having a tail with a more complicated curvature thanits front. The resulting PFs of DR_NSGA-II, DR_NSGA-II_KN, DR_SPEA2, DR_TDEA,
14 Evolutionary Computation Volume xx, Number x
Evolutionary Computation corrected proofdoi:10.1162/EVCO_a_00122 by the Massachusetts Institute of Technology

A Memetic Optimization Strategy DRMOS
Table 10: Parameter settings for comparative experiments.
Populationsize n
Number offunction
evaluations
No. ofindependent
runsCrossoverprobability
Mutationprobability
ThresholdT
Territoryparameter δ
for TDEA
110 (2-objectiveproblems forMOEA/D),
120 (3-objectiveproblems forMOEA/D),
100 (otheralgorithms)
300,000includingfunctionevaluationsof DRMOS
29 1 0.1 0.5 0.01(2-objectiveproblems),
0.1(3-objectiveproblems)
Figure 5: Results with respect to the median of the Hypervolume in 29 runs of ninealgorithms on UF1
NSGA-II, NSGA-II_KN, SPEA2, TDEA, and MOEA/D are shown in Figure 6. In thatfigure, DRMOS slightly improves the diversity of PF of these four MOEAs in f1 ∈[0.6, 1], where MOEA/D has poor diversity.
4.4.1.3 UF3. UF3 is a complicated problem with 30 decision variables, and its PS isa complicated curve restricted by x1. The resulting PFs of DR_NSGA-II, DR_NSGA-II_KN, DR_SPEA2, DR_TDEA, NSGA-II, NSGA-II_KN, SPEA2, TDEA, and MOEA/Dare shown in Figure 7. In that figure, DRMOS significantly improves the convergenceof all MOEAs, particularly TDEA. DRMOS also improves the diversity of NSGA-IIand NSGA-II_KN. For SPEA2, DRMOS slightly improves both its convergence anddiversity. MOEA/D maintains good convergence and diversity.
Evolutionary Computation Volume xx, Number x 15
Evolutionary Computation corrected proofdoi:10.1162/EVCO_a_00122 by the Massachusetts Institute of Technology

H. Wang, L. Jiao, R. Shang, S. He, and F. Liu
Figure 6: Results with respect to the median of the Hypervolume in 29 runs of ninealgorithms on UF2.
Figure 7: Results with respect to the median of the Hypervolume in 29 runs of ninealgorithms on UF3.
4.4.1.4 UF4. UF4 is a complicated problem with 30 decision variables, and its PF isa concave. Further, there are many local optima on its landscape. The resulting PFsof DR_NSGA-II, DR_NSGA-II_KN, DR_SPEA2, DR_TDEA, NSGA-II, NSGA-II_KN,SPEA2, TDEA, and MOEA/D are shown in Figure 8. In that figure, DRMOS improves
16 Evolutionary Computation Volume xx, Number x
Evolutionary Computation corrected proofdoi:10.1162/EVCO_a_00122 by the Massachusetts Institute of Technology

A Memetic Optimization Strategy DRMOS
Figure 8: Results with respect to the median of the Hypervolume in 29 runs of ninealgorithms on UF4.
MOEAs’ convergence, all the results of MOEAs with DRMOS converge to the true PF,and the results of the original MOEAs and MOEA/D all get trapped in local optima.Additionally, the diversity of MOEAs with DRMOS is maintained well, except in thecase of DR_SPEA2.
4.4.1.5 UF5 . UF5 is a complicated problem with 30 decision variables, and its PFconsists of 21 discrete points. The resulting PFs of DR_NSGA-II, DR_NSGA-II_KN,DR_SPEA2, DR_TDEA, NSGA-II, NSGA-II_KN, SPEA2, and TDEA are shown inFigure 9. In that figure, DRMOS improves the convergence and diversity of MOEAsso significantly that most of the PF are obtained, having a better performance thanMOEA/D.
4.4.1.6 UF6 . UF6 is a complicated problem with 30 decision variables, and its PFis discontinuous. The resulting PFs of DR_NSGA-II, DR_NSGA-II_KN, DR_SPEA2,DR_TDEA, NSGA-II, NSGA-II_KN, SPEA2, TDEA, and MOEA/D are shown inFigure 10. In that figure, DRMOS cannot improve the convergence of the MOEA signif-icantly. Although it improves the diversity, there is still room for improvement. At thesame time, MOEA/D does well in this aspect.
4.4.1.7 UF7. UF7 is a complicated problem with 30 decision variables. The resulting PFsof DR_NSGA-II, DR_NSGA-II_KN, DR_SPEA2, DR_TDEA, NSGA-II, NSGA-II_KN,SPEA2, TDEA, and MOEA/D are shown in Figure 11. In that figure, the convergence ofthe original MOEA is already very good, so that DRMOS improves them slightly, butDRMOS does improve their diversity considerably, particularly the diversity of TDEA.
4.4.1.8 UF8. UF8 is a 3-objective problem with 30 decision variables. The resulting PFsof DR_NSGA-II, DR_NSGA-II_KN, DR_SPEA2, DR_TDEA, NSGA-II, NSGA-II_KN,SPEA2, TDEA, and MOEA/D are shown in Figure 12. In that figure, DRMOS improvesthe convergence of these four MOEAs so well that their results converge to the true PF,
Evolutionary Computation Volume xx, Number x 17
Evolutionary Computation corrected proofdoi:10.1162/EVCO_a_00122 by the Massachusetts Institute of Technology

H. Wang, L. Jiao, R. Shang, S. He, and F. Liu
Figure 9: Results with respect to the median of the Hypervolume in 29 runs of ninealgorithms on UF5.
Figure 10: Results with respect to the median of the Hypervolume in 29 runs of ninealgorithms on UF6.
which is better than those of MOEA/D. Further, the diversity of MOEAs with DRMOSis improved. However, the diversity of DR_NSGA-II is the worst among the MOEAswith DRMOS, which is caused by the disadvantages of crowding distance.
18 Evolutionary Computation Volume xx, Number x
Evolutionary Computation corrected proofdoi:10.1162/EVCO_a_00122 by the Massachusetts Institute of Technology

A Memetic Optimization Strategy DRMOS
Figure 11: Results with respect to the median of the Hypervolume in 29 runs of ninealgorithms on UF7.
Figure 12: Results with respect to the median of the Hypervolume in 29 runs of ninealgorithms on UF8.
4.4.1.9 UF9 . UF9 is a 3-objective problem with 30 decision variables, and its PFis discontinuous. The resulting PFs of DR_NSGA-II, DR_NSGA-II_KN, DR_SPEA2,DR_TDEA, NSGA-II, NSGA-II_KN, SPEA2, TDEA, and MOEA/D are shown inFigure 13. In that figure, the convergence and diversity of MOEAs are improved by
Evolutionary Computation Volume xx, Number x 19
Evolutionary Computation corrected proofdoi:10.1162/EVCO_a_00122 by the Massachusetts Institute of Technology

H. Wang, L. Jiao, R. Shang, S. He, and F. Liu
Figure 13: Results with respect to the median of the Hypervolume in 29 runs of ninealgorithms on UF9.
DRMOS, but not satisfactorily. For example, the convergence and diversity of DR_TDEAare a little worse than that of the others.
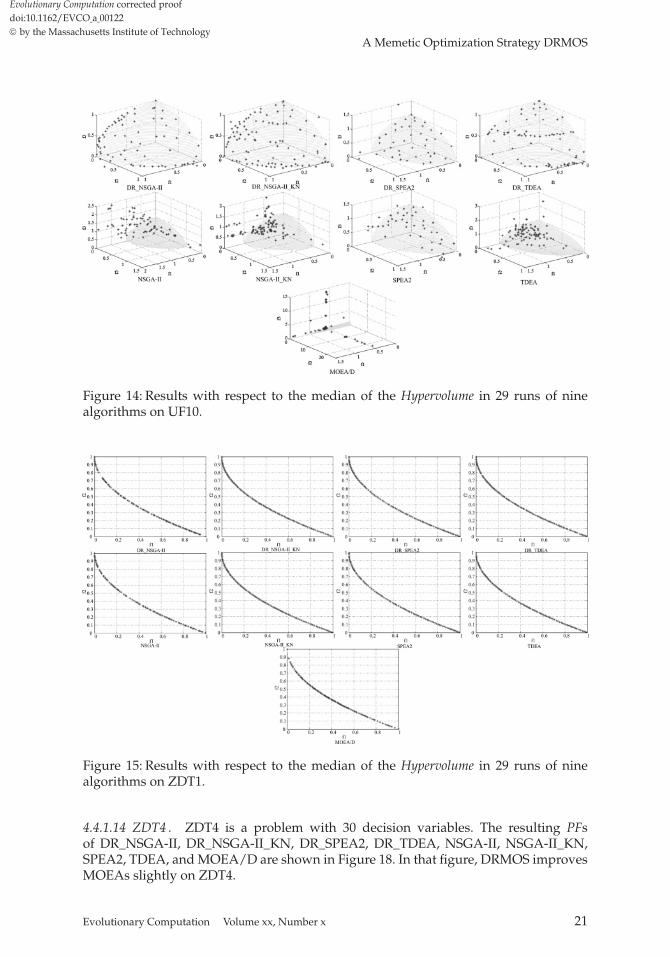
4.4.1.10 UF10 . UF10 is a complicated 3-objective optimization problem with 30 de-cision variables. The resulting PFs of DR_NSGA-II, DR_NSGA-II_KN, DR_SPEA2,DR_TDEA, NSGA-II, NSGA-II_KN, SPEA2, TDEA, and MOEA/D are shown in Figure14. In that figure, DRMOS improves the convergence of four MOEAs so well that theirresults converge to the true PF. Their diversity is improved less by DRMOS. The diver-sity of DR_NSGA-II, DR_NSGA-II_KN, DR_SPEA2, and DR_TDEA is not satisfactory.Further, neither the convergence nor the diversity of MOEA/D is good in the case ofUF10.
4.4.1.11 ZDT1 . ZDT1 is a problem with 30 decision variables. The resulting PFsof DR_NSGA-II, DR_NSGA-II_KN, DR_SPEA2, DR_TDEA, NSGA-II, NSGA-II_KN,SPEA2, TDEA, and MOEA/D are shown in Figure 15. In that figure, all the algo-rithms have good results of convergence and diversity. The results of DR_NASGA-IIand NSGA-II have relatively poor uniformity. Hence, DRMOS cannot improve MOEAsmuch on ZDT1, and it does not worsen MOEAs on ZDT1, either.
4.4.1.12 ZDT2. ZDT2 is a problem with 30 decision variables, and its PF is concave.The resulting PFs of DR_NSGA-II, DR_NSGA-II_KN, DR_SPEA2, DR_TDEA, NSGA-II, NSGA-II_KN, SPEA2, TDEA, and MOEA/D are shown in Figure 16. In that figure,DRMOS does not make MOEAs perform worse on ZDT2.
4.4.1.13 ZDT3. ZDT3 is a problem with 30 decision variables, and its PF is discon-tinuous. The resulting PFs of DR_NSGA-II, DR_NSGA-II_KN, DR_SPEA2, DR_TDEA,NSGA-II, NSGA-II_KN, SPEA2, TDEA, and MOEA/D are shown in Figure 17. In thatfigure, DRMOS does not improve MOEAs on ZDT3.
20 Evolutionary Computation Volume xx, Number x
Evolutionary Computation corrected proofdoi:10.1162/EVCO_a_00122 by the Massachusetts Institute of Technology
A Memetic Optimization Strategy DRMOS
Figure 14: Results with respect to the median of the Hypervolume in 29 runs of ninealgorithms on UF10.
Figure 15: Results with respect to the median of the Hypervolume in 29 runs of ninealgorithms on ZDT1.
4.4.1.14 ZDT4 . ZDT4 is a problem with 30 decision variables. The resulting PFsof DR_NSGA-II, DR_NSGA-II_KN, DR_SPEA2, DR_TDEA, NSGA-II, NSGA-II_KN,SPEA2, TDEA, and MOEA/D are shown in Figure 18. In that figure, DRMOS improvesMOEAs slightly on ZDT4.
Evolutionary Computation Volume xx, Number x 21
Evolutionary Computation corrected proofdoi:10.1162/EVCO_a_00122 by the Massachusetts Institute of Technology

H. Wang, L. Jiao, R. Shang, S. He, and F. Liu
Figure 16: Results with respect to the median of the Hypervolume in 29 runs of ninealgorithms on ZDT2.
Figure 17: Results with respect to the median of the Hypervolume in 29 runs of ninealgorithms on ZDT3.
In order to quantitatively explain the experiment results, the performance measuresPurity, Minimal Spacing, and Hypervolume are shown in Figures 19, 20, and 21 in boxplotsas a means of statistical analysis, and in Tables 11, 12, and 13, where the winner of
22 Evolutionary Computation Volume xx, Number x
Evolutionary Computation corrected proofdoi:10.1162/EVCO_a_00122 by the Massachusetts Institute of Technology

A Memetic Optimization Strategy DRMOS
Figure 18: Results with respect to the median of the Hypervolume in 29 runs of ninealgorithms on ZDT4.
the comparison between an MOEA and the MOEA with DRMOS is in bold. As wedo not embed DRMOS into MOEA/D, DR_MOEA/D is not applicable in Tables 12and 13.
Purity represents convergence. The aim of our comparative experiments is to ana-lyze the improvement of DRMOS embedded in classic MOEAs. The comparisons areperformed between MOEAs and the MOEAs with DRMOS. Thus, Purity is calculatedfrom the results of three algorithms: an MOEA, the MOEA with DRMOS, and MOEA/D.The results are shown in four groups in Table 11. From the boxplots in Figure 19, it is clearthat DRMOS increases the convergence abilities of MOEAs on the UF problems. ThePurity of MOEAs with DRMOS has a better value than their corresponding MOEAsand MOEA/D, particularly MOEAs with DRMOS outperforming the correspondingMOEAs on UF4 and UF5. For the ZDT problems, DRMOS has no improvement onconvergence. Sometimes, the Purity of MOEAs with DRMOS is a little worse, but notsignificantly.
Minimal Spacing is employed to evaluate the uniformity of results. From the boxplotsshown in Figure 20 and the data given in Table 12, DRMOS improves the uniformityof the corresponding MOEAs for the UF problems, although different MOEAs have adifferent uniformity ability. The uniformity of MOEAs decreased slightly for the ZDTproblems but this does not affect their PFs significantly.
Hypervolume is a metric for evaluating both convergence and maximum spread,and can be used as a general performance measure. From the boxplots shown in Fig-ure 21 and data given in Table 13, DRMOS improves MOEAs in the case of the UFproblems because the Hypervolume of MOEAs with DRMOS is larger than that of thecorresponding MOEAs. However, as the Hypervolume of the MOEAs with DRMOS andthe corresponding MOEAs are similar, the performance on the ZDT problems cannotbe improved by DRMOS.
Evolutionary Computation Volume xx, Number x 23
Evolutionary Computation corrected proofdoi:10.1162/EVCO_a_00122 by the Massachusetts Institute of Technology

H. Wang, L. Jiao, R. Shang, S. He, and F. Liu
Figure 19: Boxplots corresponding to Purity for all test problems, where 1 de-notes DR_NSGA-II; 2 NSGA-II; 3 MOEA/D; 4 DR_NSGA-II_KN; 5 NSGA-II_KN;6 MOEA/D; 7 DR_SPEA2; 8 SPEA2; 9 MOEA/D; 10 DR_TDEA; 11 TDEA; and 12MOEA/D.
4.4.2 DiscussionIn the case of the UF problems, DRMOS reduces the dimension of the decision spaceby sampling, and it adopts two memetic local search strategies in the divided decisionsubspaces. DRMOS increases the convergence speed and diversity, its performanceis even better than that of MOEA/D. DRMOS cannot improve the performance ofMOEAs on UF6 because of the unsuitable local search strategies. For the relativelysimpler ZDT problems, the advantages of DRMOS are not obvious. Because the re-duction rates of the ZDT problems are small, the dimension cannot be reduced sig-nificantly. DRMOS improves MOEAs slightly in the case of the ZDT problems. Fur-thermore, the relation analysis approach wastes some function evaluations in themeantime, which leads to a slightly worse performance than that of the originalMOEAs.
In general, DRMOS significantly improves convergence, diversity, and uniformityfor different MOEAs. Although different MOEAs have different advantages and dis-advantages, DRMOS improves the search ability on the MOPs that can be weaklydimension-reduced in the decision space. Moreover, DRMOA can be easily embeddedin existing MOEAs to improve their performance. For the MOPs that cannot be weaklydimension-reduced in the decision space, or the ones with small dimension reductionrates, the MOEAs with DRMOS degenerate to their original algorithms.
5 Conclusion
A memetic optimization strategy based on dimension reduction in decision space isproposed in this paper. This strategy reduces the dimension of the decision space by a
24 Evolutionary Computation Volume xx, Number x
Evolutionary Computation corrected proofdoi:10.1162/EVCO_a_00122 by the Massachusetts Institute of Technology

A Memetic Optimization Strategy DRMOS
Figure 20: Boxplots corresponding to Minimal Spacing for all test problems, where 1denotes DR_NSGA-II; 2 NSGA-II; 3 DR_NSGA-II_KN; 4 NSGA-II_KN; 5 DR_SPEA2; 6SPEA2; 7 DR_TDEA; 8 TDEA; and 9 MOEA/D.
relation analysis approach and two memetic local search strategies in order to improveperformance. DRMOS has good portability to existing MOEAs. The work discussed inthis paper has three major contributions as follows.
• Relation Analysis. DRMOS applies a simple model of sampling to obtain themapping relation between decision variables and objective functions, whichprovides the knowledge for dimension reduction in the decision space.
• Memetic Local Search Strategy. Memetic local search strategies in DRMOSare employed in the divided decision subspace, which decompose the compli-cated problem with high dimensions into several simple problems with lowdimensions. Two strategies aim at convergence and diversity, respectively.
• Portability. DRMOS can be embedded easily in existing MOEAs in order toapply its powerful performance to the MOPs that can be weakly dimension-reduced in the decision space, which has no influence on the other types ofproblems for the original performance of MOEAs.
DRMOS takes advantage of the information in the process of optimization to guidethe search. Although its superior performance has been shown by experiments, DR-MOS still has some disadvantages. (1) DRMOS is only effective in the case of the MOPs
Evolutionary Computation Volume xx, Number x 25
Evolutionary Computation corrected proofdoi:10.1162/EVCO_a_00122 by the Massachusetts Institute of Technology

H. Wang, L. Jiao, R. Shang, S. He, and F. Liu
Figure 21: Boxplots corresponding to Hypervolume for all test problems, where 1 denotesDR_NSGA-II; 2 NSGA-II; 3 DR_NSGA-II_KN; 4 NSGA-II_KN; 5 DR_SPEA2; 6 SPEA2;7 DR_TDEA; 8 TDEA; and 9 MOEA/D.
that can be weakly dimension-reduced. It degenerates to the original algorithm on theMOPs that cannot be weakly dimension-reduced in the decision space. As for the prob-lems that cannot be divided into subspaces, the memetic local search strategy is invalid.(2) Its performance is not satisfactory for the problems with discontinuous PFs, becausethe computational cost is not self-adaptively assigned according to the different situ-ations of PFs in DRMOS. The self-adaptive computational cost assignment is anothertopic of our future research. (3) The results show that DRMOS is not effective for theproblems with small reduction rates, because the relation analysis approach costs manyfunction evaluations rather than searching. Furthermore, the current relation analysisapproach is based on a relatively simple model. Some advanced technology such asstatistical learning methods and relation mining should be used in DRMOS.
Acknowledgments
This work was partially supported by the National Basic Research Program (973 Program) ofChina, under Grant 2013CB329402, an EU FP7 IRSES, under Grant 247619, the National NaturalScience Foundation of China, under Grants 61371201 and 61272279, the National Research Foun-dation for the Doctoral Program of Higher Education of China, under Grant 20100203120008, theFund for Foreign Scholars in University Research and Teaching Programs, under Grant B07048,and the Program for Cheung Kong Scholars and Innovative Research Team in University underGrant IRT1170. The authors are grateful for Xin Yao’s comments on the paper.
26 Evolutionary Computation Volume xx, Number x
Evolutionary Computation corrected proofdoi:10.1162/EVCO_a_00122 by the Massachusetts Institute of Technology

A Memetic Optimization Strategy DRMOS
Table 11: Values of Purity of all test problems.
NSGA-II NSGA-II_KN SPEA2 TDEA
Average SD Average SD Average SD Average SD
UF1 DR_XXX 0.5338 0.0367 0.5501 0.0413 0.5448 0.0348 0.6788 0.0560XXX 0.2719 0.0448 0.3557 0.0367 0.3790 0.0356 0.1697 0.0389
MOEA/D 0.1944 0.0510 0.0943 0.0325 0.0762 0.0244 0.1515 0.0446UF2 DR_XXX 0.4715 0.0211 0.4968 0.0198 0.4974 0.0169 0.5911 0.0263
XXX 0.2854 0.0259 0.3608 0.0169 0.4264 0.0178 0.2391 0.0159MOEA/D 0.2430 0.0311 0.1423 0.0220 0.0762 0.0214 0.1698 0.0268
UF3 DR_XXX 0.6852 0.1609 0.5780 0.1413 0.4613 0.1629 0.4255 0.2334XXX 0.0869 0.0723 0.2757 0.1076 0.2683 0.0870 0.0206 0.0161
MOEA/D 0.2280 0.1944 0.1464 0.1644 0.2704 0.1747 0.5540 0.2434UF4 DR_XXX 1.0000 0.0000 1.0000 0.0000 1.0000 0.0000 1.0000 0.0000
XXX 0.0000 0.0000 0.0000 0.0000 0.0000 0.0000 0.0000 0.0000MOEA/D 0.0000 0.0000 0.0000 0.0000 0.0000 0.0000 0.0000 0.0000
UF5 DR_XXX 0.8697 0.0891 0.8554 0.0885 0.8409 0.0800 0.6077 0.1834XXX 0.0000 0.0000 0.0000 0.0000 0.0000 0.0000 0.0000 0.0000
MOEA/D 0.1303 0.0891 0.1446 0.0885 0.1591 0.0800 0.3923 0.1834UF6 DR_XXX 0.0884 0.1051 0.0719 0.0926 0.0661 0.0981 0.0268 0.0212
XXX 0.1579 0.1646 0.1916 0.2057 0.1756 0.1494 0.0065 0.0083MOEA/D 0.7536 0.1690 0.7365 0.1876 0.7582 0.1855 0.9667 0.0227
UF7 DR_XXX 0.4116 0.0200 0.4281 0.0294 0.3596 0.0286 0.3924 0.0536XXX 0.2734 0.0384 0.3448 0.0520 0.4251 0.0430 0.1866 0.0981
MOEA/D 0.3151 0.0351 0.2271 0.0379 0.2153 0.0525 0.4210 0.0549UF8 DR_XXX 0.5115 0.0616 0.5041 0.0549 0.5162 0.0798 0.4887 0.0548
XXX 0.1673 0.0770 0.2219 0.0611 0.2299 0.0905 0.2128 0.0503MOEA/D 0.3213 0.0769 0.2740 0.0632 0.2539 0.0703 0.2985 0.0728
UF9 DR_XXX 0.6307 0.0814 0.6833 0.1151 0.6401 0.0832 0.3800 0.0796XXX 0.0401 0.0296 0.0223 0.0369 0.0268 0.0313 0.1328 0.1142
MOEA/D 0.3292 0.0854 0.2943 0.1045 0.3332 0.1007 0.4872 0.1377UF10 DR_XXX 0.7581 0.1440 0.7777 0.1429 0.7828 0.1455 0.6454 0.1952
XXX 0.0025 0.0081 0.0018 0.0068 0.0132 0.0410 0.0005 0.0026MOEA/D 0.2394 0.1428 0.2205 0.1410 0.2040 0.1375 0.3541 0.1955
ZDT1 DR_XXX 0.3386 0.0039 0.3395 0.0024 0.3384 0.0041 0.3271 0.0061XXX 0.3390 0.0035 0.3397 0.0024 0.3392 0.0039 0.3316 0.0066
MOEA/D 0.3224 0.0073 0.3208 0.0047 0.3224 0.0076 0.3413 0.0076ZDT2 DR_XXX 0.3373 0.0019 0.3377 0.0025 0.3372 0.0020 0.3259 0.0065
XXX 0.3374 0.0018 0.3378 0.0023 0.3372 0.0023 0.3309 0.0069MOEA/D 0.3253 0.0036 0.3245 0.0048 0.3256 0.0043 0.3432 0.0045
ZDT3 DR_XXX 0.3476 0.0120 0.3490 0.0101 0.3449 0.0110 0.3620 0.0214XXX 0.3544 0.0131 0.3530 0.0109 0.3483 0.0111 0.3814 0.0207
MOEA/D 0.2980 0.0220 0.2980 0.0205 0.3067 0.0215 0.2566 0.0216ZDT4 DR_XXX 0.4691 0.0201 0.4827 0.0208 0.4834 0.0211 0.4711 0.0280
XXX 0.4703 0.0211 0.4827 0.0208 0.4834 0.0211 0.4769 0.0274MOEA/D 0.0606 0.0412 0.0346 0.0417 0.0333 0.0422 0.0519 0.0538
Evolutionary Computation Volume xx, Number x 27
Evolutionary Computation corrected proofdoi:10.1162/EVCO_a_00122 by the Massachusetts Institute of Technology

H. Wang, L. Jiao, R. Shang, S. He, and F. Liu
Tabl
e12
:Val
ues
ofM
inim
alSp
acin
gof
allt
estp
robl
ems.
NSG
A-I
IN
SGA
-II_
KN
SPE
A2
TD
EA
MO
EA
/D
Ave
rage
SD
Ave
rage
SD
Ave
rage
SD
Ave
rage
SD
Ave
rage
SD
UF1
DR
_XX
X0.
0095
0.00
080.
0030
0.00
020.
0106
0.00
210.
0101
0.00
23N
AN
AX
XX
0.02
570.
0058
0.03
270.
0099
0.03
520.
0094
0.05
850.
0134
0.00
390.
0004
UF2
DR
_XX
X0.
0101
0.00
130.
0030
0.00
020.
0047
0.00
080.
0045
0.00
10N
AN
AX
XX
0.01
080.
0011
0.00
510.
0017
0.00
890.
0033
0.01
420.
0047
0.00
370.
0005
UF3
DR
_XX
X0.
0122
0.00
230.
0082
0.00
370.
0228
0.00
240.
0257
0.00
49N
AN
AX
XX
0.02
650.
0131
0.02
510.
0063
0.02
550.
0067
0.03
640.
0199
0.01
060.
0043
UF4
DR
_XX
X0.
0114
0.00
060.
0093
0.00
070.
0096
0.00
100.
0070
0.00
08N
AN
AX
XX
0.01
340.
0015
0.00
920.
0027
0.00
990.
0020
0.01
190.
0034
0.00
940.
0008
UF5
DR
_XX
X0.
0337
0.00
450.
0322
0.00
350.
0364
0.00
530.
0378
0.00
68N
AN
AX
XX
0.07
230.
0305
0.08
580.
0385
0.09
170.
0419
0.15
570.
1276
0.03
310.
0037
UF6
DR
_XX
X0.
0520
0.00
820.
0535
0.00
740.
0565
0.00
800.
0977
0.01
42N
AN
AX
XX
0.04
800.
0416
0.04
090.
0374
0.05
450.
0492
0.10
640.
0927
0.05
360.
0067
UF7
DR
_XX
X0.
0100
0.00
060.
0028
0.00
020.
0155
0.00
400.
0168
0.00
36N
AN
AX
XX
0.02
200.
0028
0.02
240.
0051
0.02
520.
0042
0.03
350.
0117
0.00
580.
0007
UF8
DR
_XX
X0.
1047
0.01
330.
0709
0.01
350.
0716
0.01
130.
0764
0.01
22N
AN
AX
XX
0.23
250.
0734
0.17
340.
0681
0.16
030.
0519
0.17
310.
0739
0.07
500.
012
UF9
DR
_XX
X0.
0906
0.02
400.
0818
0.02
160.
0907
0.02
200.
1143
0.03
25N
AN
AX
XX
0.45
810.
1874
0.45
220.
2242
0.50
460.
2216
0.21
630.
0692
0.10
090.
0200
UF1
0D
R_X
XX
0.12
300.
0208
0.10
950.
0156
0.11
650.
0223
0.13
220.
0288
NA
NA
XX
X0.
2417
0.10
690.
2302
0.16
120.
1585
0.05
410.
2230
0.07
310.
1110
0.01
93Z
DT
1D
R_X
XX
0.01
100.
0012
0.00
330.
0001
0.00
380.
0003
0.00
420.
0027
NA
NA
XX
X0.
0102
0.00
100.
0029
0.00
020.
0034
0.00
020.
0036
0.00
020.
0039
0.00
05Z
DT
2D
R_X
XX
0.01
120.
0015
0.00
330.
0001
0.00
380.
0004
0.00
370.
0003
NA
NA
XX
X0.
0103
0.00
080.
0030
0.00
020.
0034
0.00
020.
0037
0.00
030.
0039
0.00
06Z
DT
3D
R_X
XX
0.02
900.
0007
0.02
620.
0000
0.02
770.
0032
0.02
570.
0028
NA
NA
XX
X0.
0287
0.00
210.
0260
0.00
080.
0268
0.00
130.
0245
0.00
220.
0280
0.00
18Z
DT
4D
R_X
XX
0.01
080.
0011
0.00
330.
0001
0.00
720.
0101
0.00
390.
0003
NA
NA
XX
X0.
0100
0.00
080.
0029
0.00
040.
0035
0.00
040.
0696
0.36
070.
0041
0.00
07
28 Evolutionary Computation Volume xx, Number x
Evolutionary Computation corrected proofdoi:10.1162/EVCO_a_00122 by the Massachusetts Institute of Technology

A Memetic Optimization Strategy DRMOS
Tabl
e13
:Val
ues
ofH
yper
volu
me
ofal
ltes
tpro
blem
s.
NSG
A-I
IN
SGA
-II_
KN
SPE
A2
TD
EA
MO
EA
/D
Ave
rage
SD
Ave
rage
SD
Ave
rage
SD
Ave
rage
SD
Ave
rage
SD
UF1
DR
_XX
X7.
9131
e+0
1.29
46e-
37.
9167
e+0
1.19
00e-
37.
9163
e+0
1.54
31e-
37.
9159
e+0
3.04
92e-
3N
AN
AX
XX
7.85
43e+
08.
3469
e-2
7.84
78e+
09.
1612
e-2
7.81
39e+
08.
5622
e-2
7.73
37e+
01.
6247
e-1
7.88
03e+
01.
6993
e-2
UF2
DR
_XX
X1.
8284
e+0
6.42
63e-
41.
8322
e+0
5.93
49e-
41.
8338
e+0
3.16
77e-
41.
8336
e+0
2.75
05e-
4N
AN
AX
XX
1.82
34e+
02.
1762
e-3
1.82
81e+
01.
5463
e-3
1.82
70e+
02.
9476
e-3
1.77
98e+
08.
1234
e-3
1.80
25e+
08.
2006
e-3
UF3
DR
_XX
X6.
7854
e+0
4.50
86e-
36.
7886
e+0
3.22
26e-
36.
7731
e+0
2.05
19e-
36.
7695
e+0
3.54
10e-
3N
AN
AX
XX
6.51
28e+
05.
2076
e-1
6.58
84e+
06.
5639
e-2
6.58
86e+
06.
4911
e-2
6.09
22e+
08.
4377
e-1
6.66
02e+
02.
4319
e-1
UF4
DR
_XX
X6.
2901
e-1
4.85
76e-
46.
3014
e-1
7.07
08e-
46.
2988
e-1
6.79
27e-
46.
2982
e-1
6.59
75e-
4N
AN
AX
XX
5.31
76e-
18.
3824
e-3
5.36
96e-
18.
3331
e-3
5.38
71e-
17.
8182
e-3
5.27
43e-
18.
4661
e-3
4.91
25e-
11.
5925
e-2
UF5
DR
_XX
X2.
7699
e+1
1.08
14e-
12.
7716
e+1
8.90
45e-
22.
7648
e+1
1.54
18e-
12.
7665
e+1
1.26
87e-
1N
AN
AX
XX
2.29
02e+
11.
1229
e+0
2.27
29e+
11.
2970
e+0
2.24
06e+
11.
1283
e+0
2.16
20e+
11.
0950
e+0
2.63
91e+
11.
2971
e+0
UF6
DR
_XX
X6.
5450
e+0
7.31
90e-
26.
5442
e+0
7.34
65e-
26.
5529
e+0
6.54
65e-
26.
5429
e+0
6.58
20e-
2N
AN
AX
XX
5.46
65e+
07.
8403
e-1
5.28
70e+
06.
2662
e-1
5.43
05e+
06.
8668
e-1
5.16
61e+
05.
6455
e-1
6.71
92e+
01.
2797
e-1
UF7
DR
_XX
X9.
2127
e+0
5.25
28e-
49.
2166
e+0
6.94
32e-
49.
2061
e+0
3.71
91e-
39.
2052
e+0
4.56
28e-
3N
AN
AX
XX
9.19
15e+
02.
5094
e-2
9.19
33e+
02.
7202
e-2
9.07
40e+
04.
6109
e-1
8.72
29e+
08.
9918
e-1
9.00
86e+
06.
0469
e-1
UF8
DR
_XX
X2.
4781
e+2
1.86
51e-
12.
4718
e+2
2.81
36e+
02.
4686
e+2
4.67
95e+
02.
4783
e+2
2.57
08e-
1N
AN
AX
XX
2.44
45e+
24.
9390
e+0
2.47
80e+
28.
2368
e-2
2.46
23e+
23.
8505
e+0
2.40
75e+
25.
0347
e+0
2.36
86e+
27.
1091
e+0
UF9
DR
_XX
X8.
8032
e+2
4.61
04e-
18.
8059
e+2
3.91
50e-
18.
8077
e+2
8.46
89e-
28.
8028
e+2
8.90
85e-
1N
AN
AX
XX
8.66
13e+
25.
8196
e+0
8.70
17e+
24.
8483
e+0
8.68
79e+
23.
8653
e+0
8.67
05e+
23.
5323
e+0
8.69
65e+
23.
4293
e+0
UF1
0D
R_X
XX
1.24
19e+
42.
3643
e+1
1.24
04e+
48.
3769
e+1
1.24
19e+
42.
1024
e+1
1.24
22e+
41.
8994
e+0
NA
NA
XX
X1.
1700
e+4
2.08
52e+
21.
1686
e+4
1.82
32e+
21.
1697
e+4
2.14
75e+
21.
1598
e+4
1.10
99e+
21.
1647
e+4
1.39
73e+
2Z
DT
1D
R_X
XX
8.38
72e-
15.
2571
e-4
8.40
95e-
13.
9413
e-5
8.40
85e-
15.
4778
e-5
8.40
41e-
11.
3518
e-4
NA
NA
XX
X8.
3904
e-1
4.87
90e-
48.
4100
e-1
3.43
38e-
58.
4095
e-1
5.50
07e-
58.
4050
e-1
1.54
82e-
48.
3945
e-1
1.03
14e-
4Z
DT
2D
R_X
XX
3.26
37e-
16.
0622
e-4
3.28
51e-
13.
3327
e-5
3.28
47e-
19.
2658
e-5
3.28
03e-
11.
4160
e-4
NA
NA
XX
X3.
2664
e-1
3.27
95e-
43.
2856
e-1
3.76
13e-
53.
2851
e-1
4.94
36e-
53.
2809
e-1
1.26
34e-
43.
2801
e-1
3.37
47e-
5Z
DT
3D
R_X
XX
8.87
54e-
12.
6749
e-4
8.88
42e-
15.
0012
e-5
8.86
73e-
11.
4302
e-3
8.85
44e-
11.
1316
e-2
NA
NA
XX
X8.
8550
e-1
1.12
79e-
28.
8823
e-1
1.19
77e-
38.
8646
e-1
1.88
61e-
38.
8731
e-1
2.34
51e-
38.
8381
e-1
2.17
79e-
4Z
DT
4D
R_X
XX
1.95
53e+
15.
4229
e-4
1.95
56e+
12.
7921
e-5
1.95
52e+
11.
2566
e-2
1.95
55e+
11.
3772
e-4
NA
NA
XX
X1.
9554
e+1
3.32
80e-
41.
9549
e+1
2.70
62e-
21.
9556
e+1
3.83
67e-
41.
9555
e+1
1.36
88e-
41.
9544
e+1
3.91
39e-
3
Evolutionary Computation Volume xx, Number x 29
Evolutionary Computation corrected proofdoi:10.1162/EVCO_a_00122 by the Massachusetts Institute of Technology

H. Wang, L. Jiao, R. Shang, S. He, and F. Liu
References
Adra, S., Dodd, T., Griffin, I., and Fleming, P. (2009). Convergence acceleration operator formultiobjective optimization. IEEE Transactions on Evolutionary Computation, 13(4):825–847.
Bader, J., and Zitzler, E. (2011). HypE: An algorithm for fast hypervolume-based many-objectiveoptimization. Evolutionary Computation, 19(1):45–76.
Bandyopadhyay, S., Pal, S., and Aruna, B. (2004). Multiobjective GAs, quantitative indices, andpattern classification. IEEE Transactions on Systems, Man, and Cybernetics, Part B: Cybernetics,34(5):2088–2099.
Brockhoff, D., and Zitzler, E. (2009). Objective reduction in evolutionary multiobjective optimiza-tion: Theory and applications. Evolutionary Computation, 17(2):135–166.
Caponio, A., Cascella, G., Neri, F., Salvatore, N., and Sumner, M. (2007). A fast adaptive memeticalgorithm for online and offline control design of PMSM drives. IEEE Transactions on Systems,Man, and Cybernetics, Part B: Cybernetics, 37(1):28–41.
Coello, C. (1999). A comprehensive survey of evolutionary-based multiobjective optimizationtechniques. Knowledge and Information Systems, 1(3):129–156.
Corne, D., and Knowles, J. (2007). Techniques for highly multiobjective optimisation: Some non-dominated points are better than others. In Proceedings of the 9th Annual Conference on Geneticand Evolutionary Computation, pp. 773–780. ACM.
Deb, K., Mohan, M., and Mishra, S. (2005). Evaluating the ε-domination based multi-objectiveevolutionary algorithm for a quick computation of Pareto-optimal solutions. EvolutionaryComputation, 13(4):501–525.
Deb, K., Pratap, A., Agarwal, S., and Meyarivan, T. (2002a). A fast and elitist multiobjectivegenetic algorithm: NSGA-II. IEEE Transactions on Evolutionary Computation, 6(2):182–197.
Deb, K., Sinha, A., and Kukkonen, S. (2006). Multi-objective test problems, linkages, and evolu-tionary methodologies. In Proceedings of the 8th Annual Conference on Genetic and EvolutionaryComputation, pp. 1141–1148.
Deb, K., Thiele, L., Laumanns, M., and Zitzler, E. (2002b). Scalable multi-objective optimizationtest problems. In Proceedings of the IEEE Congress on Evolutionary Computation, CEC 2002, Vol.1, pp. 825–830.
Gaspar-Cunha, A., and Vieira, A. (2004). A hybrid multi-objective evolutionary algorithm usingan inverse neural network. In Proceedings of Hybrid Metaheuristics Workshop, HM 2004, pp.25–30.
Goh, C., Ong, Y., and Tan, K. (2009). Multi-Objective Memetic Algorithms, Vol. 171. Berlin: Springer-Verlag.
Gong, M., Jiao, L., and Zhang, L. (2010). Baldwinian learning in clonal selection algorithm foroptimization. Information Sciences, 180(8):1218–1236.
Hasan, S., Sarker, R., Essam, D., and Cornforth, D. (2009). Memetic algorithms for solving job-shopscheduling problems. Memetic Computing, 1(1):69–83.
Ishibuchi, H., Hitotsuyanagi, Y., Ohyanagi, H., and Nojima, Y. (2011). Effects of the existenceof highly correlated objectives on the behavior of MOEA/D. In Evolutionary multi-criterionoptimization. Lecture notes in computer science, Vol. 6576 (pp. 166–181). Berlin: Springer-Verlag.
Ishibuchi, H., and Murata, T. (1998). A multi-objective genetic local search algorithm and itsapplication to flowshop scheduling. IEEE Transactions on Systems, Man, and Cybernetics, PartC: Applications and Reviews, 28(3):392–403.
Ishibuchi, H., Yoshida, T., and Murata, T. (2003). Balance between genetic search and local search inmemetic algorithms for multiobjective permutation flowshop scheduling. IEEE Transactionson Evolutionary Computation, 7(2):204–223.
30 Evolutionary Computation Volume xx, Number x
Evolutionary Computation corrected proofdoi:10.1162/EVCO_a_00122 by the Massachusetts Institute of Technology

A Memetic Optimization Strategy DRMOS
Jaszkiewicz, A. (2002). On the performance of multiple-objective genetic local search on the 0/1knapsack problem: A comparative experiment. IEEE Transactions on Evolutionary Computa-tion, 6(4):402–412.
Jolliffe, I. (2002). Principal component analysis, Vol 2. Berlin: Springer.
Karahan, I., and Koksalan, M. (2010). A territory defining multiobjective evolutionary algorithmsand preference incorporation. IEEE Transactions on Evolutionary Computation, 14(4):636–664.
Khan, N., Goldberg, D., and Pelikan, M. (2002). Multi-objective Bayesian optimization algorithm.Paper presented at GECC02002 (p. 684). San Mateo, CA: Morgan Kauffman
Khare, V., Yao, X., and Deb, K. (2003). Performance scaling of multi-objective evolutionary al-gorithms. In C. Fonseca, P. Fleming, E. Zitzler, L. Thiele, and K. Deb, Eds. Evolutionarymulti-criterion optimization. Lecture notes in computer science, Vol. 2632. (pp. 376–390). Berlin:Springer-Verlag.
Knowles, J., and Corne, D. (2000). M-PAES: A memetic algorithm for multiobjective optimization.In Proceedings of the IEEE Congress on Evolutionary Computation, CEC 2000, pp. 325–332.
Krasnogor, N., and Smith, J. (2005). A tutorial for competent memetic algorithms: Model, taxon-omy, and design issues. IEEE Transactions on Evolutionary Computation, 9(5):474–488.
Kukkonen, S., and Lampinen, J. (2007). Ranking-dominance and many-objective optimization. InProceedings of the IEEE Congress on Evolutionary Computation, CEC 2007, pp. 3983–3990.
Larranaga, P., and Lozano, J. (2002). Estimation of distribution algorithms: A new tool for evolutionarycomputation, Vol 2. Berlin: Springer-Verlag.
Laumanns, M., and Ocenasek, J. (2002). Bayesian optimization algorithms for multi-objectiveoptimization. In Parallel problem solving from nature, PPSN VII. Lecture notes in computerscience, Vol. 2439 (pp. 298–307). Berlin: Springer-Verlag.
Le, M., Ong, Y., Jin, Y., and Sendhoff, B. (2009). Lamarckian memetic algorithms: Local optimumand connectivity structure analysis. Memetic Computing, 1(3):175–190.
Liang, K., Yao, X., and Newton, C. (2000a). Evolutionary search of approximated n-dimensional landscapes. International Journal of Knowledge Based Intelligent Engineering Sys-tems, 4(3):172–183.
Liang, K., Yao, X., and Newton, C. (2000b). Lamarckian evolution in global optimization. InProceedings of the 26th Annual Conference of the IEEE Industrial Electronics Society IECON 2000,Vol 4, pp. 2975–2980.
Lim, K., Ong, Y., Lim, M., Chen, X., and Agarwal, A. (2008). Hybrid ant colony algorithms forpath planning in sparse graphs. Soft Computing—A Fusion of Foundations, Methodologies andApplications, 12(10):981–994.
Lopez Jaimes, A., Coello, C., and Urıas Barrientos, J. (2009). Online objective reduction to dealwith many-objective problems. In Evolutionary multi-criterion optimization. Lecture notes incomputer science, Vol. 5467 (pp. 423–437). Berlin: Springer-Verlag.
Lopez Jaimes, A., Coello Coello, C., and Chakraborty, D. (2008). Objective reduction using afeature selection technique. In Proceedings of the 10th Annual Conference on Genetic and Evolu-tionary Computation, pp. 673–680.
Meuth, R., Lim, M., Ong, Y., and Wunsch, D. (2009). A proposition on memes and meta-memesin computing for higher-order learning. Memetic Computing, 1(2):85–100.
Miettinen, K. (1999). Nonlinear multiobjective optimization, Vol. 12. Berlin: Springer-Verlag.
Neri, F., Toivanen, J., Cascella, G., and Ong, Y. (2007). An adaptive multimeme algorithm fordesigning HIV multidrug therapies. IEEE/ACM Transactions on Computational Biology andBioinformatics, 4(2):264–278.
Evolutionary Computation Volume xx, Number x 31
Evolutionary Computation corrected proofdoi:10.1162/EVCO_a_00122 by the Massachusetts Institute of Technology

H. Wang, L. Jiao, R. Shang, S. He, and F. Liu
Ong, Y., and Keane, A. (2004). Meta-Lamarckian learning in memetic algorithms. IEEE Transactionson Evolutionary Computation, 8(2):99–110.
Ong, Y., Lim, M., and Chen, X. (2010). Memetic computation: Past, present and future [researchfrontier]. IEEE Computational Intelligence Magazine, 5(2):24–31.
Ong, Y., Lim, M., Zhu, N., and Wong, K. (2006). Classification of adaptive memetic algorithms:A comparative study. IEEE Transactions on Systems, Man, and Cybernetics, Part B: Cybernetics,36(1):141–152.
Pryke, A., Mostaghim, S., and Nazemi, A. (2007). Heatmap visualization of population based multiobjective algorithms. In Evolutionary multi-criterion optimization. Lecture notes in computerscience, Vol. 4403 (pp. 361–375). Berlin: Springer-Verlag.
Sato, H., Aguirre, H., and Tanaka, K. (2007). Controlling dominance area of solutions and itsimpact on the performance of MOEAs. In Evolutionary multi-criterion optimization. Lecturenotes in computer science, Vol. 4403 (pp. 5–20). Berlin: Springer-Verlag.
Saxena, D., and Deb, K. (2007). Non-linear dimensionality reduction procedures for certain large-dimensional multi-objective optimization problems: Employing correntropy and a novelmaximum variance unfolding. In Evolutionary multi-criterion optimization. Lecture notes incomputer science, Vol. 4403 (pp. 772–787). Berlin: Springer-Verlag.
Thiele, L., Miettinen, K., Korhonen, P., and Molina, J. (2009). A preference-based evolutionaryalgorithm for multi-objective optimization. Evolutionary Computation, 17(3):411–436.
Tirronen, V., Neri, F., Karkkainen, T., Majava, K., and Rossi, T. (2008). An enhanced memeticdifferential evolution in filter design for defect detection in paper production. EvolutionaryComputation, 16(4):529–555.
Van Veldhuizen, D., and Lamont, G. (2000). On measuring multiobjective evolutionary algorithmperformance. In IEEE Congress on Evolutionary Computation, CEC 2000, pp. 204–211.
Wang, Z., Tang, K., and Yao, X. (2010). Multi-objective approaches to optimal testing resourceallocation in modular software systems. IEEE Transactions on Reliability, 59(3):563–575.
Yang, D., Jiao, L., Gong, M., and Feng, J. (2010). Adaptive ranks clone and k-nearest neighborlist-based immune multi-objective optimization. Computational Intelligence, 26(4):359–385.
Zhang, Q., Zhou, A., and Jin, Y. (2008a). RM-MEDA: A regularity model-based multiobjective esti-mation of distribution algorithm. IEEE Transactions on Evolutionary Computation, 12(1):41–63.
Zhang, Q., Zhou, A., Zhao, S., Suganthan, P., Liu, W., and Tiwari, S. (2008b). Multiobjectiveoptimization test instances for the CEC 2009 special session and competition. Working ReportCES-887, School of Computer Science and Electrical Engineering, University of Essex, Colchester,UK.
Zitzler, E., Deb, K., and Thiele, L. (2000). Comparison of multiobjective evolutionary algorithms:Empirical results. Evolutionary Computation, 8(2):173–195.
Zitzler, E., Laumanns, M., Thiele, L., (2001). SPEA2: Improving the strength Pareto evolutionaryalgorithm. In Proceedings of EUROGEN 2001, Evolutionary Methods for Design, Optimizationand Control with Applications to Industrial Problems, pp. 1–21.
Zitzler, E., and Thiele, L. (1998). Multiobjective optimization using evolutionary algorithms: Acomparative case study. In Parallel Problem Solving from Nature, PPSN V. Lecture notes incomputer science, Vol. (pp. 292–301). Berlin: Springer-Verlag.
Zitzler, E., and Thiele, L. (1999). Multiobjective evolutionary algorithms: A comparative casestudy and the strength Pareto approach. IEEE Transactions on Evolutionary Computation,3(4):257–271.
32 Evolutionary Computation Volume xx, Number x
Evolutionary Computation corrected proofdoi:10.1162/EVCO_a_00122 by the Massachusetts Institute of Technology
View publication statsView publication stats