Embed Size (px)
Citation preview

A mathematical framework for modelling andevaluating natural gas pipeline networks under
hydrogen injection
F. Tabkhi, C. Azzaro-Pantel1 , L. Pibouleau, S. Domenech,
Laboratoire de Genie Chimique, UMR5503 CNRS/INP/UPS. 5 rue Paulin Talabot
F-BP1301, 31106 Toulouse cedex 1, France
Abstract
This article presents the framework of a mathematical formulation for modellingand evaluating natural gas pipeline networks under hydrogen injection. The modeldevelopment is based on gas transport through pipelines and compressors whichcompensate for the pressure drops by implying mainly the mass and energy bal-ances on the basic elements of the network. The model was initially implementedfor natural gas transport and the principle of extension for hydrogen-natural gasmixtures is presented. The objective is the treatment of the classical fuel minimizingproblem in compressor stations. The optimization procedure has been formulatedby means of a nonlinear technique within the General Algebraic Modelling System(GAMS) environment. This work deals with the adaptation of the current transmis-sion networks of natural gas to the transport of hydrogen-natural gas mixtures. Moreprecisely, the quantitative amount of hydrogen that can be added to natural gas canbe determined. The studied pipeline network,initially proposed by Abbaspour et al.(2005) is revisited here for the case of hydrogen-natural gas mixtures. Typical quan-titative results are presented, showing that the addition of hydrogen to natural gasdecreases significantly the transmitted power : the maximum fraction of hydrogenthat can be added to natural gas is around 6 mass percent for this example.
Key words: optimization, compressor, pipeline, hydrogen, natural gas
1 Introduction
Confronting more and more today’s urgent environmental challenges, such asthe control of the release of the gases with greenhouse effect, and facing withthe ever-increasing shortage in the fossil resources, the radical changes in en-ergy policies seem now inevitable. Among the various domains, hydrogen is
1 Corresponding author. Email adress: [email protected]
brought to you by COREView metadata, citation and similar papers at core.ac.uk
provided by Open Archive Toulouse Archive Ouverte

one of the energy alternatives full of promise. Preliminary studies have shownthat the transport of a mixture of natural gas and hydrogen is possible throughthe existing natural gas networks without pipeline modification as long as themass fraction of hydrogen remains sufficiently low (Castello et al. (2005)). Al-though hydrogen substitution perturbs little the fluid mechanics constraints ofthe system, the limitations fall into the tolerance of the construction materialsof the pipes, compressors and other elements of the natural gas infrastructures.This work is exclusively interested in the transmission pipeline of hydrogengas and, more exactly, in the adaptation of the current transmission networksof the natural gas to hydrogen transport.
The transition towards the situation in which hydrogen becomes an impor-tant energy carrier (Seymour et al. (2008)), needs decades but worldwide greatefforts are made in the field of hydrogen production, delivery, storage and uti-lization. In this view, an analysis of the potential of using the actual naturalgas pipeline systems for the delivery of hydrogen is a valid argument. Definingthe conditions under which hydrogen can be added to natural gas constitutes afirst step of this investigation. The chemical and physical properties of hydro-gen and natural gas differ significantly, which have an effect on safety relatedto gas transport and its utilization as well as on the integrity of the network.
Some authors have examined hydrogen transport by pipeline and a few reports(for instance, Castello et al. (2005), Smit et al. (2007), Tzimas et al. (2007),Haeseldonckx and D’haeseleer (2007)) discuss the use of existing natural gaspipelines to transport hydrogen or hydrogen-natural gas blends. It has beenhighlighted by previous researchers (Oney et al. (1994)) that this can be per-formed under certain conditions (mainly high production pressures and largeenough markets) to be economically feasible over long distances.
These are also the main objectives of the NATURALHY-project (supported bythe European Commission within a Thematic Priority on Sustainable EnergySystems of the Sixth Framework Programme) which investigates the condi-tions under which hydrogen can be added to natural gas with acceptableconsequences for safety, life cycle and socioeconomic aspects, durability ofthe system, gas quality management and performance of end-user appliances(Florisson et al. (2006)).
Among the recent works, the influence of hydrogen on the pressure drop inthe pipelines has been calculated by Schouten et al. (2004). In Parker (2004),the construction costs of natural gas transmission pipelines have been ana-lyzed and the impact of hydrogen in the global cost has been studied. Froman economic viewpoint, the cost of natural gas pipelines is a function of pipediameter and the cost of a hydrogen pipeline can be 50%-80% higher thanthat of a natural gas pipeline of the same size (Veziroglu and Barbir (1998)).Regional transportation costs could be as much as five times higher than nat-
2

ural gas, primarily because of the lower volumetric energy density of hydrogen(Whaley (2001)). Besides, hydrogen embrittlement of the steel under the highpressures environment of hydrogen constitutes a major concern: consequently,the transportation of a hydrogen-rich gas requires a great attention since hy-drogen embrittlement is characterized by a loss of ductility of a steel (Sherifet al. (2005)).
The remaining sections are devoted to the modelling of gas pipeline networksand to the influence of hydrogen injection in natural gas infrastructures. Thegeneral context is then proposed in Section 2. This paper has not the am-bition to give an answer to all questions that may arise, but may help toapproach the potential challenges of the exploitation of hydrogen as an energycarrier using current pipeline systems. The model used for gas transport andextended to the case of natural gas-hydrogen blends is the core of Section 3.The optimization procedure has been implemented by means of a nonlinearprogramming method involving the CONOPT resolution module within theGAMS environment (Brooke et al. (1988)). A case study then illustrates themethodology in Section 4. The possibility of low amounts of hydrogen injec-tion into natural gas pipelines will be analysed from a process engineeringviewpoint. The quantitative estimation and analysis of the maximal hydro-gen contents that are acceptable in the transported gas passing through theexisting infrastructures of the natural gas transmission and distribution aredetermined. Some typical results are then presented and discussed in Section5. Conclusions and perspectives are finally given in Section 6.
2 General context
2.1 Towards a hydrogen economy
In a world where energy demand is growing at unprecedented rates, pipelineswill continue to play an important role in safely and efficiently transportingoil and gas from often remote areas to their markets. Hydrogen is foreseen asan important and reliable energy carrier in the future sustainable energy soci-ety. This energy vector, which can be produced from different primary sourcesamong which the renewable energies, is exploitable in different stationary orportable applications. Hydrogen deployment scenarios can be based on one oftwo different fundamental assumptions concerning the level of decentralizationin production. Regardless of the primary energy sources and technologies used,hydrogen can be produced either at large scale facilities and then distributedto individual customers over a range of few tens to some hundreds kilome-ters (centralized production), or in the proximity of dispensing facilities orend-use appliances (on-site generation). Consequently, this yields principally
3

to two separate families of production and distribution pathways made ofneighbouring stages allowing the adoption of different technologies.
Gaseous hydrogen can be transported using several modes like pipeline, rail-road, tanker truck, and tanker ship. The chosen method depends on the dis-tance of transportation, the production method, the use, etc.... Regardingtransportation of hydrogen, along with conventional means, transportation viapipelines has been employed to make hydrogen available to a specific range ofmass consuming users.
Of course, the idea of adding hydrogen to gas via pipelines to satisfy theincreased demand for energy will require changes in the natural gas pipelineinfrastructure to enhance the reliability of the existing systems.
According to the analysis of the dedicated literature concerning hydrogen, itis foreseeable that the hydrogen economy will have to rely on a combinationof different delivery options and the share of application of each option willchange and evolve with time. This study only considers hydrogen-natural gasmixture transmission via pipeline networks. Thorough technical and economicstudies on the whole energy chain including production, storage, transport,distribution and utilization are the first steps to provide new industrial per-spectives.
2.2 Differences between the properties of hydrogen and natural gas
The physical and chemical properties of hydrogen differ significantly fromthose of natural gas. Tab. 1 shows some indicative values of relevant prop-erties for the gas chain from source to end user (some of them will be usedin the development of the model). As a result of these contrasting proper-ties, a system designed for natural gas cannot be used without appropriatemodifications for pure hydrogen, and vice versa. Even the addition of a cer-tain percentage of hydrogen to natural gas will have a direct impact on thecombustion properties, diffusion into materials and the behaviour of the gasmixture in air. These aspects are considered further below.
The addition of hydrogen to the natural gas modifies its transport and calorificproperties (Schouten et al. (2004)). Besides, a gas with higher hydrogen con-tent can have an impact on the safety of the transmission-distribution-utilizationchain, the durability and the reliability of the gas pipeline and the utilizationperformances for the end user.
4

Hydrogen, H2 Methane, CH4 Unit
Molecular weight 2.02 16.04 g/mol
Critical temperature 33.2 190.65 K
Critical pressure 13.15 45.4 bar
Acentric factor -0.215 0.008 -
Vapour density at normal boiling point 1.34 1.82 kg/m3
Vapour density at 293 K and 1 bar 0.0838 0.651 kg/m3
139 bar 10.58 111.2 kg/m3
Heat capacity at constant pressure at 25C 28.8 35.5 J/mol-K
Specific heat ratio (Cp/Cv) 1.4 1.31
Lower heating value, weight basis 120 48 MJ/kg
Higher heating value, weight basis 142 53 MJ/kg
Lower heating value, volume basis at 1 atm 11 35 MJ/m3
Higher heating value, volume basis at 1 atm 13 39 MJ/m3
Maximum flame temperature 1800 1495 K
Explosive (detonability) limits 18.2-58.9 5.7-14 vol% in air
Flammability limits 4.1-74 5.3-15 vol% in air
Autoignition temperature in air 844 813 K
Dilute gas viscosity at 299 K 9.10−6 11. 10−6 Pa.sec
Molecular diffusivity in air 6.1 10−5 1.6 10−5 m2/secTable 1Comparison between physical properties of hydrogen and methane as the princi-pal constituent of natural gas (Baade et al. (2001), Smith and Ness (1988), Padroand Keller (2001), Rivkin (2006), Zeberg-Mikkelsen (2001), Randelman and Wenzel(1988))
5

2.3 The impact of hydrogen on the natural gas system
In principle, hydrogen can be added to natural gas in either the high pressure,or the medium pressure, or in the low pressure distribution grid, but it must beremembered that the existing system was designed and constructed specificallyfor natural gas and, as explained above, the physical and chemical propertiesof hydrogen differ significantly from those of natural gas. In particular, theaddition of hydrogen to natural gas may have an impact on the followingaspects:
• Safety related to the transmission, distribution and use of gas: As-pects of pipeline systems, such as location, materials, wall thickness, safetydevices, etc., are designed on the basis of risk assessments. For instance, thedesign criteria for a pipeline in a populated area differ from the criteria fora pipeline in the countryside. As hydrogen is added, it will change the gasproperties and, as a consequence, the related risks will change. An addi-tional safety risk of using a natural gas system for hydrogen may arise fromthe fact that the potential leakage rate of hydrogen is much larger than thatof natural gas through the same sized leak (Markert et al. (2007)).
• Integrity of pipelines: Hydrogen may diffuse into materials and changetheir mechanical properties. For example, hydrogen embrittlement of steel,leading to an accelerated growth of micro cracks, is a well-recognized phe-nomenon. Hydrogen may also diffuse through polymers and thus result ina significant loss of hydrogen. This may affect the integrity of the systemand could also have an impact on safety. A related issue concerns conditionmonitoring and repair techniques of the delivery system.
• Gas quality management: It should be ensured that end users will re-main supplied with gas that meets the contractual specific cautions in orderto guarantee their safety, performance of end user appliances, and billing ac-curacy. Moreover, this is an issue if hydrogen is extracted from the mixture,and the remaining gas is supplied to end users further downstream.
• The performance of end user appliances: As the combustion propertieschange when hydrogen is added to natural gas, this may also affect theperformance of end user appliances. rs further downstream.
The remaining sections are devoted to the modelling of gas pipeline networksand to the influence of hydrogen injection in natural gas infrastructures.
3 Model extension to hydrogen-natural gas mixtures
A mathematical modelling of the gas transportation problem in networks waspreviously presented elsewhere (Tabkhi et al. (2006), Tabkhi (2008)). The
6
model is enough general to take into account various gases. As abovemen-tioned, the case of mixtures of natural gas and hydrogen is particularly ex-amined in this paper. The pressure drop in a gas pipeline, i.e., the essentialparameter to determine the required compression power for the transmission,has been derived from the differential momentum balance. Friction betweenfluid boundary layer and interior surface of the tube induces energy losses and,consequently, reduces the gas pressure.
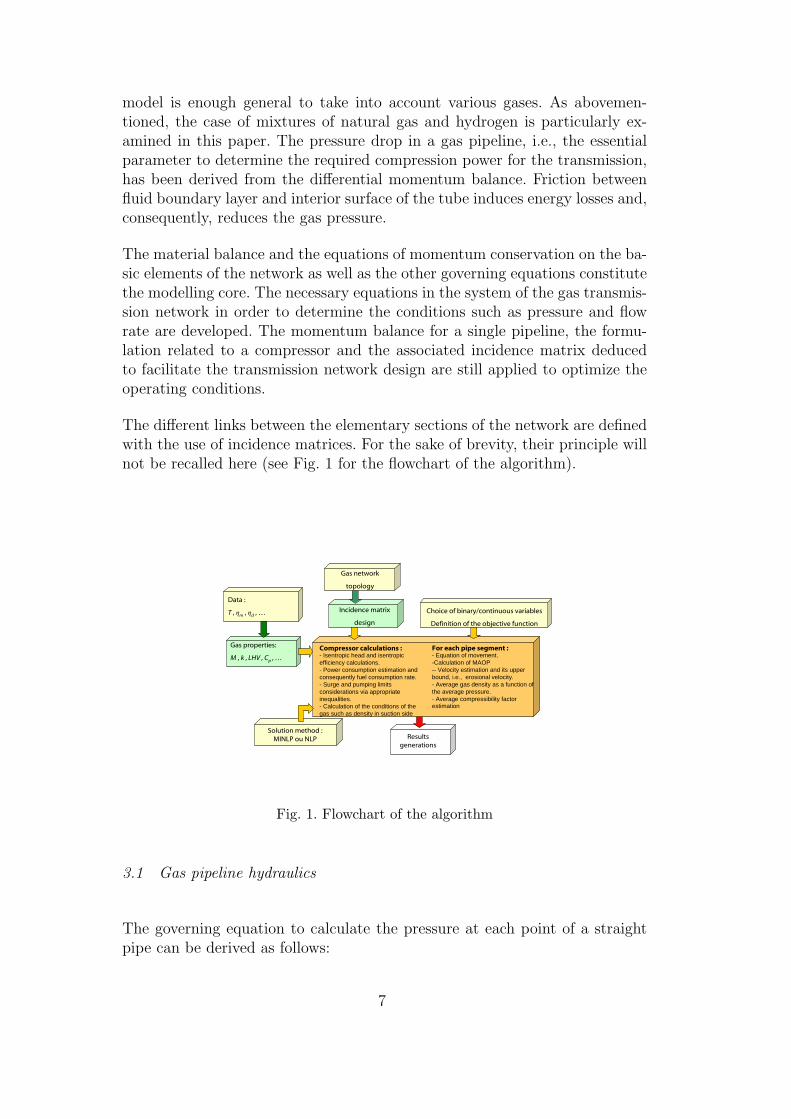
The material balance and the equations of momentum conservation on the ba-sic elements of the network as well as the other governing equations constitutethe modelling core. The necessary equations in the system of the gas transmis-sion network in order to determine the conditions such as pressure and flowrate are developed. The momentum balance for a single pipeline, the formu-lation related to a compressor and the associated incidence matrix deducedto facilitate the transmission network design are still applied to optimize theoperating conditions.
The different links between the elementary sections of the network are definedwith the use of incidence matrices. For the sake of brevity, their principle willnot be recalled here (see Fig. 1 for the flowchart of the algorithm).
Results
generations
Compressor calculations :- Isentropic head and isentropic efficiency calculations. - Power consumption estimation and consequently fuel consumption rate. - Surge and pumping limits considerations via appropriate inequalities.- Calculation of the conditions of the gas such as density in suction side
For each pipe segment :- Equation of movement.-Calculation of MAOP -- Velocity estimation and its upper bound, i.e., erosional velocity.- Average gas density as a function of the average pressure.- Average compressibility factor estimation
Gas properties:
M , k , LHV , Cp , …
Incidence matrix
design
Data :
T , ηm , ηd , …
Solution method :
MINLP ou NLP
Gas network
topology
Choice of binary/continuous variables
Definition of the objective function
Fig. 1. Flowchart of the algorithm
3.1 Gas pipeline hydraulics
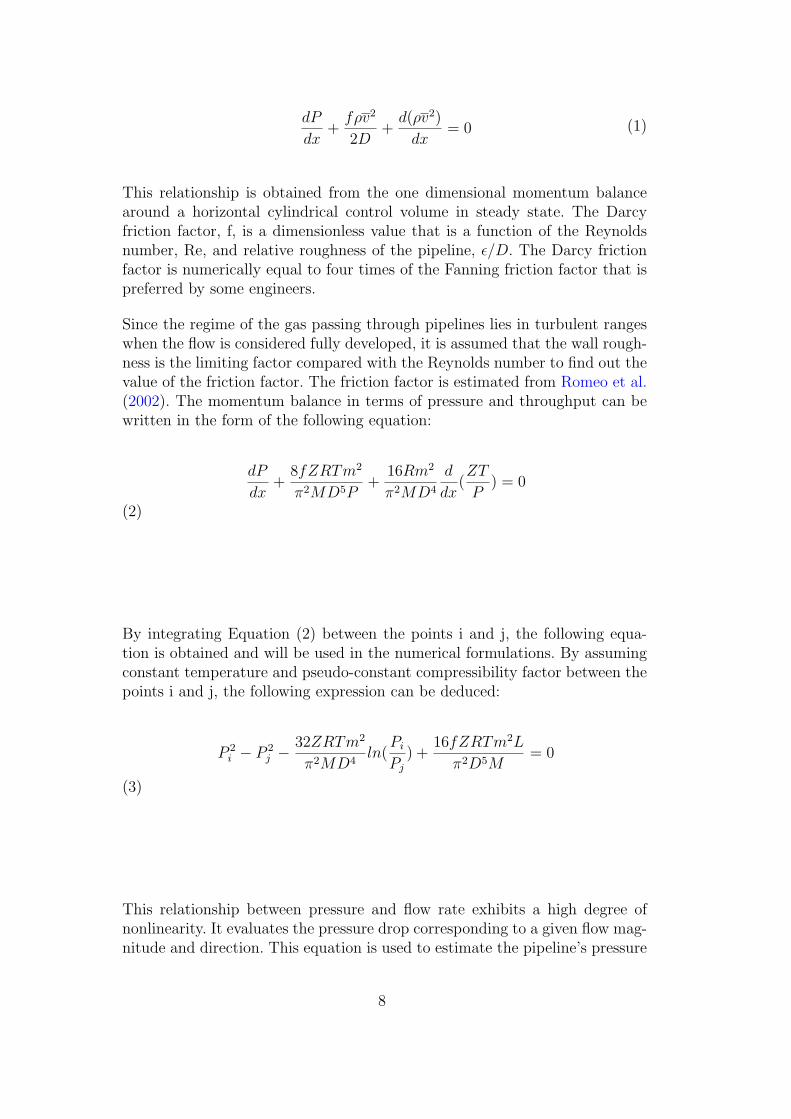
The governing equation to calculate the pressure at each point of a straightpipe can be derived as follows:
7
dP
dx+
fρv2
2D+
d(ρv2)
dx= 0 (1)
This relationship is obtained from the one dimensional momentum balancearound a horizontal cylindrical control volume in steady state. The Darcyfriction factor, f, is a dimensionless value that is a function of the Reynoldsnumber, Re, and relative roughness of the pipeline, ε/D. The Darcy frictionfactor is numerically equal to four times of the Fanning friction factor that ispreferred by some engineers.
Since the regime of the gas passing through pipelines lies in turbulent rangeswhen the flow is considered fully developed, it is assumed that the wall rough-ness is the limiting factor compared with the Reynolds number to find out thevalue of the friction factor. The friction factor is estimated from Romeo et al.(2002). The momentum balance in terms of pressure and throughput can bewritten in the form of the following equation:
dP
dx+
8fZRTm2
π2MD5P+
16Rm2
π2MD4
d
dx(ZT
P) = 0
(2)
By integrating Equation (2) between the points i and j, the following equa-tion is obtained and will be used in the numerical formulations. By assumingconstant temperature and pseudo-constant compressibility factor between thepoints i and j, the following expression can be deduced:
P 2i − P 2
j −32ZRTm2
π2MD4ln(
Pi
Pj
) +16fZRTm2L
π2D5M= 0
(3)
This relationship between pressure and flow rate exhibits a high degree ofnonlinearity. It evaluates the pressure drop corresponding to a given flow mag-nitude and direction. This equation is used to estimate the pipeline’s pressure
8
profile and can incorporate the pressure head that occurs due to the locationof the pipeline via the elevation changes.
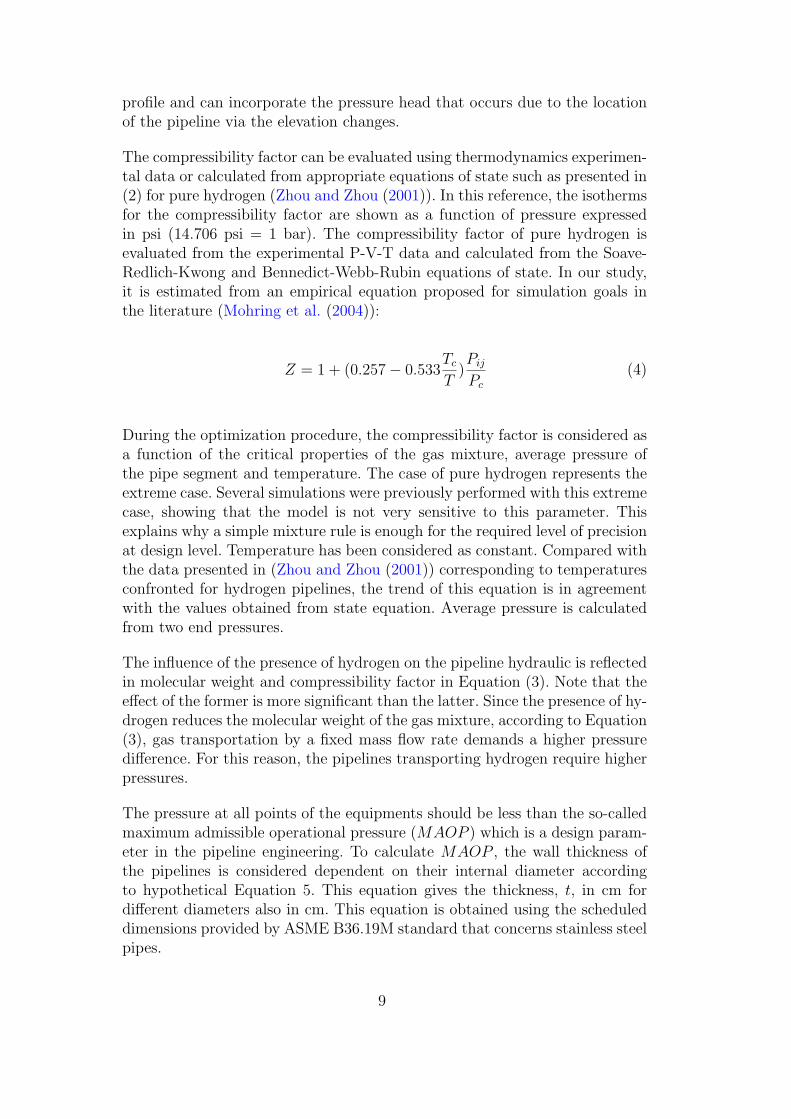
The compressibility factor can be evaluated using thermodynamics experimen-tal data or calculated from appropriate equations of state such as presented in(2) for pure hydrogen (Zhou and Zhou (2001)). In this reference, the isothermsfor the compressibility factor are shown as a function of pressure expressedin psi (14.706 psi = 1 bar). The compressibility factor of pure hydrogen isevaluated from the experimental P-V-T data and calculated from the Soave-Redlich-Kwong and Bennedict-Webb-Rubin equations of state. In our study,it is estimated from an empirical equation proposed for simulation goals inthe literature (Mohring et al. (2004)):
Z = 1 + (0.257− 0.533Tc
T)Pij
Pc
(4)
During the optimization procedure, the compressibility factor is considered asa function of the critical properties of the gas mixture, average pressure ofthe pipe segment and temperature. The case of pure hydrogen represents theextreme case. Several simulations were previously performed with this extremecase, showing that the model is not very sensitive to this parameter. Thisexplains why a simple mixture rule is enough for the required level of precisionat design level. Temperature has been considered as constant. Compared withthe data presented in (Zhou and Zhou (2001)) corresponding to temperaturesconfronted for hydrogen pipelines, the trend of this equation is in agreementwith the values obtained from state equation. Average pressure is calculatedfrom two end pressures.
The influence of the presence of hydrogen on the pipeline hydraulic is reflectedin molecular weight and compressibility factor in Equation (3). Note that theeffect of the former is more significant than the latter. Since the presence of hy-drogen reduces the molecular weight of the gas mixture, according to Equation(3), gas transportation by a fixed mass flow rate demands a higher pressuredifference. For this reason, the pipelines transporting hydrogen require higherpressures.
The pressure at all points of the equipments should be less than the so-calledmaximum admissible operational pressure (MAOP ) which is a design param-eter in the pipeline engineering. To calculate MAOP , the wall thickness ofthe pipelines is considered dependent on their internal diameter accordingto hypothetical Equation 5. This equation gives the thickness, t, in cm fordifferent diameters also in cm. This equation is obtained using the scheduleddimensions provided by ASME B36.19M standard that concerns stainless steelpipes.
9

t = 5210−3D + 98910−5 (5)
Recall that the MAOP depends also on the population density in the vicinityof the pipeline, the type of pipe material and employed welding as well as thetemperature deration factor (Menon (2005)). Since the operating pipeline pres-sure is higher in the case of hydrogen, its transport requires thicker pipelinescompared with natural gas.
An increase in flow rate due to an increase in pressure drop raises the gas ve-locity. An important factor in the treatment of compressible fluid flow throughpipelines is the erosional velocity. This velocity is sufficiently lower than sonicor critical velocity that is the maximum velocity which a compressible fluidcan reach in a pipe. In a pipeline, higher velocities in the course of a longperiod of time will cause the erosion of the inside surface of the tubes, elbowsand other joints. Moreover, increasing gas velocity can have a particular effecton the level of vibration and increase the noises (Tabkhi (2008)). The upperlimit of the gas velocity for the design purposes is usually computed empiri-cally with the equation proposed in(Menon (2005)). The following constrainthas thus been introduced in the model so that the flow velocity remains withina range where corrosion is minimized.
v < ve (6)
ve = 122
√ZRT
PM(7)
3.2 Compressor characteristics
The compressor stations compensate for the pressure drops due to frictionin the pipelines, valves and other joints, as well as those due to elevationchanges. In pipeline networks, compressor stations consume a small fractionof transported gas. The relation between suction and discharge pressures of acentrifugal compressor and the power transported to gas is represented usingdefinition of the isentropic height of the compressed fluid. In this paper, it isassumed that the compressors performances represented by classical charac-teristic curves, are compatible with the case of NG−H2. So, the normalizedparameters hi/ω
2, Qa/ω, and ηi are used to describe the characteristic curves
10

of the compressors obtained The rotation speed of all compressors is thuscomprised between two bounds.
4 Case study
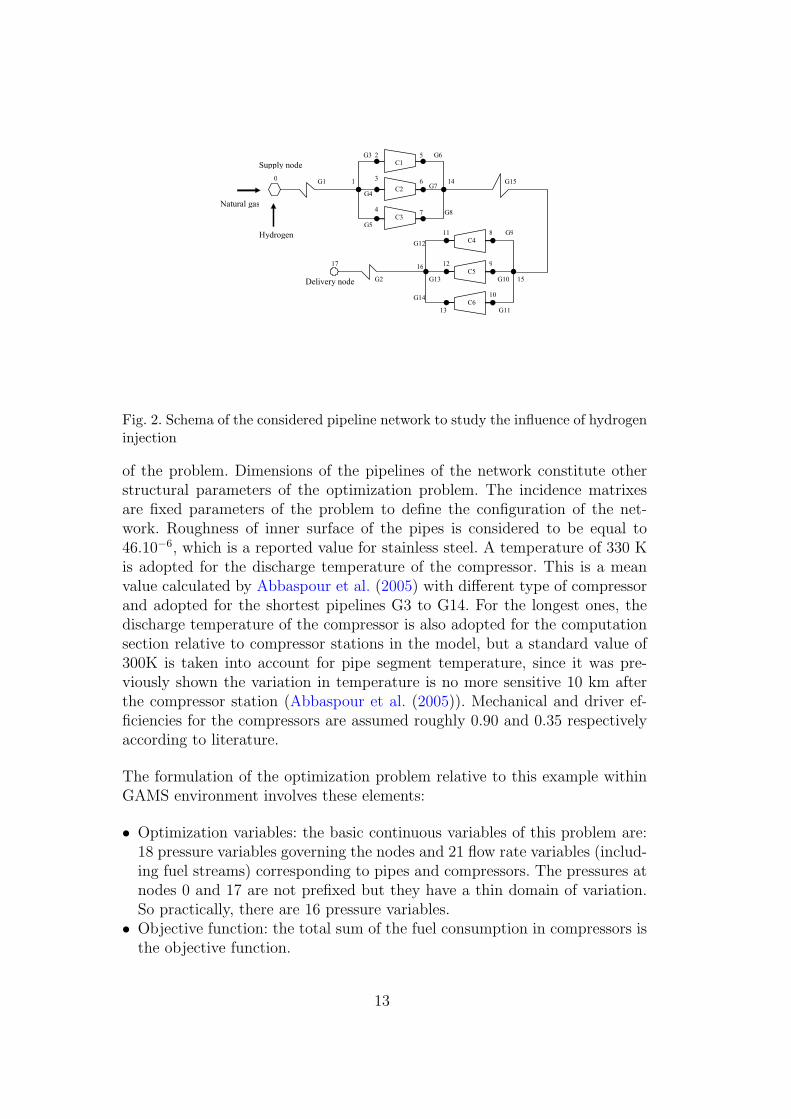
The example used as a test bench in this study is a didactic one inspired fromAbbaspour et al. (2005), but is enough representative of the elements thatmay take place in gas transport. The example, initially treated for the caseof natural gas, is revisited here for the case of natural gas-hydrogen mixtures.The pipeline network is presented in Fig. 2. Hydrogen is added to naturalgas. The composition of the natural gas is considered constant during theoptimization procedure.
This didactic network consists of three long pipelines of 100 kilometers. Thereare two compressor stations between these pipelines that operate to compen-sate for pressure drop in the transportation system. Each compressor stationincludes three parallel centrifugal compressors. In each station, there are sixpipelines of about one hundred meters that link the compressors together inparallel. As for each compressor unit, there is a stream that carries fuel toit, there will be 6 fuel streams which have not been shown in Fig. 2 to avoidcomplexity. For each compressor, this stream originates from suction node.The choice of the treated example thus explains why the compressor systemhas been chosen (with reference to the natural gas case).
This example may be seen to some extent as a particular extreme case in-volving a special effort from the compressor stations, due to the high pressuredrop in small pipe segments because of a lower cross sectional area than thatof the main pipe segments. It can be yet emphasized that the proposed modelis able to treat various cases of networks in which the compressor system is inbalance with the pipelines.
The set of the specifications of the pipelines which have been introduced hereas the parameters of the optimization problem is proposed in Tab. 2. In ad-dition, the wall thickness of each pipeline is calculated according to Equation(5).
Node 0 is the supply node and gas flows from this node towards node 17. Thereis neither input nor output in the other nodes. The composition of natural gasis considered as shown in Tab. 3 where the thermodynamic properties of thecomponents of gas are also presented.
The required thermodynamic properties of hydrogen are those previously givenin Tab. 1. They are introduced in the formulation as additional parameters
11

Pipeline tag G1 G2 G3 G4 G5
Diameter (m) 0.787 0.889 0.330 0.381 0.330
Length (m) 1,00E+05 1,00E+05 200 300 100
Pipeline tag G6 G7 G8 G9 G10
Diameter (m) 0.330 0.330 0.330 0.381 0.330
Length (m) 200 100 200 100 100
Pipeline tag G11 G12 G13 14 G15
Diameter (m) 0.432 0.330 0.330 0.330 0.838
Length (m) 100 100 400 100 1,00E+05Table 2Technical features of the pipelines of the system shown in Fig. 2
Component Methane Ethane Propane
Mole percent 70 25 5
Molecular weight 16.04 30.07 44.1
Critical temperature, K 190.6 305.4 369.8
Critical pressure, bar 46 48.8 42.5
Lower Heating Value, kJ/kg 50009 47794 46357
Heat capacity at constant pressure, kJ/(kmol.K) 35.663 52.848 74.916Table 3Composition of the natural gas and the thermodynamic properties of its components
12
G1
G2
G3
G4
G9
G8
G7 G15
G5
G12
G6
G10 G13
G11
G14
1
2
3
4
5
6
7
14
15
8
9
10
11
12
13
16
0
17
C1
C2
C3
C4
C5
C6
Supply node
Delivery node
Natural gas
Hydrogen
Fig. 2. Schema of the considered pipeline network to study the influence of hydrogeninjection
of the problem. Dimensions of the pipelines of the network constitute otherstructural parameters of the optimization problem. The incidence matrixesare fixed parameters of the problem to define the configuration of the net-work. Roughness of inner surface of the pipes is considered to be equal to46.10−6, which is a reported value for stainless steel. A temperature of 330 Kis adopted for the discharge temperature of the compressor. This is a meanvalue calculated by Abbaspour et al. (2005) with different type of compressorand adopted for the shortest pipelines G3 to G14. For the longest ones, thedischarge temperature of the compressor is also adopted for the computationsection relative to compressor stations in the model, but a standard value of300K is taken into account for pipe segment temperature, since it was pre-viously shown the variation in temperature is no more sensitive 10 km afterthe compressor station (Abbaspour et al. (2005)). Mechanical and driver ef-ficiencies for the compressors are assumed roughly 0.90 and 0.35 respectivelyaccording to literature.
The formulation of the optimization problem relative to this example withinGAMS environment involves these elements:
• Optimization variables: the basic continuous variables of this problem are:18 pressure variables governing the nodes and 21 flow rate variables (includ-ing fuel streams) corresponding to pipes and compressors. The pressures atnodes 0 and 17 are not prefixed but they have a thin domain of variation.So practically, there are 16 pressure variables.
• Objective function: the total sum of the fuel consumption in compressors isthe objective function.
13

• Constraints: obviously, there are two kinds of constraints consisting of:· Equality constraints: 18 mass balances around nodes, 15 equations of mo-
tion for the pipe arcs, 6 isentropic head equations for compressors , 6relationships between rotational speed, suction volumetric flow rate andhead of each compressor, 6 equations to calculate isentropic efficiency ac-cording , 6 equations to determine fuel consumption at each compressorunit.
· Inequality constraints: a lower bound for delivery flow rate (flow rate inarc G2) equal to 150 kg/s, an upper bound as well as a lower bound for thepressures of the nodes: MAOP as an upper bound and atmosphere pressureas a lower bound, sonic velocity and erosional velocity in the role of upperbounds of the velocities through pipes, lower and upper boundaries on therotation speed of all compressors (166.7 and 250 round/s respectively), alower bound on compressor throughput taken in account to avoid pumpingphenomenon, an upper bound on compressor throughput to prevent fromchocking phenomenon.
The total number of variables in this optimization problem is 39. The 6 rota-tional speeds of the compressors have not been explicitly considered as vari-ables, since the flow rates of the fuel streams have been already consideredas variables and for each compressor this latter is directly dependent on itsrotational speed. In total, there are 57 equality constraints and 76 inequalityconstraints.
It must be noted that the computational time is negligible in all the runscarried out for this example (inferior to 1s CPU).
5 Results and discussion
In this section, the results of the optimization problem considering the vari-ables of the network under different operating conditions are proposed. Themaximal amount of hydrogen in the natural gas is calculated for different en-ergetic capacities of the pipeline. The first optimization criterion is based onthe minimization of fuel consumption in the compressor stations. The secondone is related to the maximal capacity of the pipeline in various cases.
The procedure of optimization is implemented by means of a nonlinear pro-gramming method by using the module of resolution CONOPT within theenvironment GAMS (Brooke et al. (1988)). Let us recall that GAMS wasdesigned upon the principles of relational database theory and mathemati-cal programming methods. Relational database theory provides a structuredframework for developing general data organization and transformation capa-bilities. GAMS creates nonlinear models that will be solved with the CONOPT
14
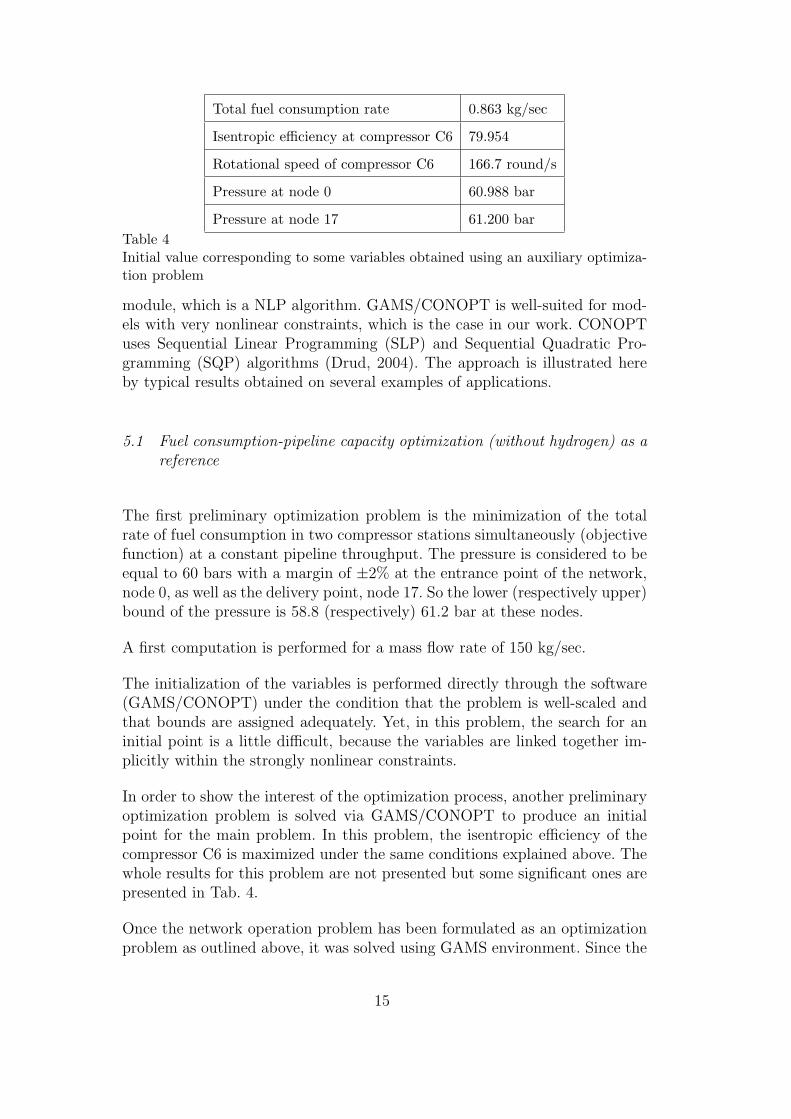
Total fuel consumption rate 0.863 kg/sec
Isentropic efficiency at compressor C6 79.954
Rotational speed of compressor C6 166.7 round/s
Pressure at node 0 60.988 bar
Pressure at node 17 61.200 barTable 4Initial value corresponding to some variables obtained using an auxiliary optimiza-tion problem
module, which is a NLP algorithm. GAMS/CONOPT is well-suited for mod-els with very nonlinear constraints, which is the case in our work. CONOPTuses Sequential Linear Programming (SLP) and Sequential Quadratic Pro-gramming (SQP) algorithms (Drud, 2004). The approach is illustrated hereby typical results obtained on several examples of applications.
5.1 Fuel consumption-pipeline capacity optimization (without hydrogen) as areference
The first preliminary optimization problem is the minimization of the totalrate of fuel consumption in two compressor stations simultaneously (objectivefunction) at a constant pipeline throughput. The pressure is considered to beequal to 60 bars with a margin of ±2% at the entrance point of the network,node 0, as well as the delivery point, node 17. So the lower (respectively upper)bound of the pressure is 58.8 (respectively) 61.2 bar at these nodes.
A first computation is performed for a mass flow rate of 150 kg/sec.
The initialization of the variables is performed directly through the software(GAMS/CONOPT) under the condition that the problem is well-scaled andthat bounds are assigned adequately. Yet, in this problem, the search for aninitial point is a little difficult, because the variables are linked together im-plicitly within the strongly nonlinear constraints.
In order to show the interest of the optimization process, another preliminaryoptimization problem is solved via GAMS/CONOPT to produce an initialpoint for the main problem. In this problem, the isentropic efficiency of thecompressor C6 is maximized under the same conditions explained above. Thewhole results for this problem are not presented but some significant ones arepresented in Tab. 4.
Once the network operation problem has been formulated as an optimizationproblem as outlined above, it was solved using GAMS environment. Since the
15

Node Pressure (bar) Node Pressure (bar) Node Pressure (bar)
0 61.200 6 66.919 12 65.510
1 47.359 7 67.030 13 65.186
2 47.042 8 58.324 14 66.809
3 47.122 9 58.260 15 58.386
4 47.192 10 58.354 16 65.072
5 67.018 11 65.185 17 58.800Table 5Pressure of natural gas at all of the nodes of the pipeline network
Arc Flow rate (kg/s) Arc Flow rate (kg/s) Arc Flow rate (kg/s)
G1 150.750 G6 49.186 G11 50.343
G2 150 G7 50.450 G12 50.200
G3 49.367 G8 50.559 G13 49.521
G4 50.637 G9 50.264 G14 50.279
G5 50.746 G10 49.587 G15 150.195Table 6Optimal values of the flow rate for each pipeline
problem is nonlinear, the CONOPT solver has been chosen. The resolutiontakes less than 1s CPU on a PC which is quite acceptable. Tab. 5 presents theresults relative to pressure computation at each node. Observe that at node0 (i.e., supply node), the algorithm has taken the maximum possible pressure(61.2 bar) whereas it has taken the minimum possible value (58.8 bar) at node17 (i.e., delivery node).
The value of objective function, that is the total fuel consumption in thecompressor stations, is equal to 0.750 kg/s (sum of individual compressorconsumptions, (see Tab. 8) which represents a significant reduction of 15%from the initial solution (0.863 kg/s) which may represent a viable solutionfor the practitioner. The values of the optimal flow rates through pipelines arepresented in Tab. 6.
In this case, the relative gas consumption in the stations (in mass percent-age of the input gas) is equal to 0.497 %. Additional information concerningcompressor operating conditions can be deduced from pressure and flow rateoptimal values (see Tab. 7) concerning: discharge flow rate, rotational speed,consumption ratio, isentropic head, isentropic efficiency and individual fuelconsumption of course. For each compressor, consumption ratio is defined asthe fuel consumption divided by the input mass flow rate.
16
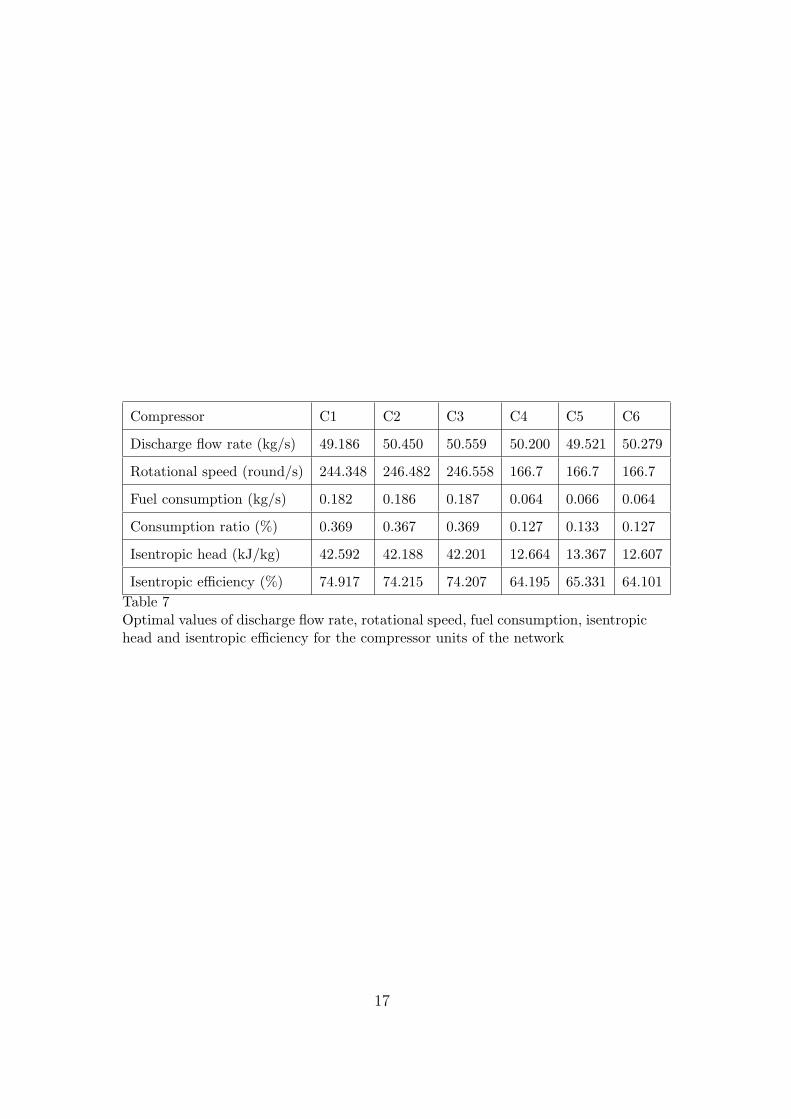
Compressor C1 C2 C3 C4 C5 C6
Discharge flow rate (kg/s) 49.186 50.450 50.559 50.200 49.521 50.279
Rotational speed (round/s) 244.348 246.482 246.558 166.7 166.7 166.7
Fuel consumption (kg/s) 0.182 0.186 0.187 0.064 0.066 0.064
Consumption ratio (%) 0.369 0.367 0.369 0.127 0.133 0.127
Isentropic head (kJ/kg) 42.592 42.188 42.201 12.664 13.367 12.607
Isentropic efficiency (%) 74.917 74.215 74.207 64.195 65.331 64.101Table 7Optimal values of discharge flow rate, rotational speed, fuel consumption, isentropichead and isentropic efficiency for the compressor units of the network
17

Pressure, bar 50 60 60
Throughput, kg/sec 130.81 150 159.3
Transmitted power, MW 6387 7324 7778
Fuel consumption, % of the input gas 0.683 0.50 0.677
Objective function Max(TP) Min(FC) Max(TP)Table 8Network optimization at two different end-point pressures (TP:Transmitted Power;FC:Fuel Consumption
Let us mention in this example that compressors involved in the second stationwork at their minimum rotational speeds whereas the compressors of the firststation work close to their maximum speeds.
Note that the network throughput is equal to the gas mass flow rate of thearc G2. The transmitted power of the pipeline is equal to 7324 MW at thisoptimum point (point A in Fig. 3 and (Tab. 8)). This quantity is the productof the pipeline delivery mass flow rate and the weight basis lower heating valueof the gas (48830 kJ/kg) computed as follows:
Ptrans = LHV mG2 (8)
Neglecting the constraint that states the pipeline throughput is constant at150 kg/sec, the computed minimum mass percentage of the input gas thatis consumed in the stations is equal to 0.33. The transmitted power of thepipeline is equal to 5630 MW at this optimum point. The result of this problemcorresponds to point B in Fig. 3.
If the pressure is now considered equal to 50 bar at the entrance point of thenetwork as well as at the delivery point, the network is not able to transport150 kg/sec, because of the limitations related to the lower bound of the com-pressors rotational speed. Using now the transmitted power of the network asan objective function (i.e., the so-called pipeline capacity maximization prob-lem), it is observed that the maximum pipeline capacity is only 130.81 kg/secat end-point pressures of 50 bar. It corresponds to a transmitted power of6387 MW. For this case, the mass percentage of the input gas consumed inthe stations is equal to 0.683 (Tab. 8).
Perfoming now the same optimization scheme (maximization of the transmit-ted power) at end-point pressure conditions of 60 bar, the transmitted poweris equal to 7778 MW at these end point pressures. It corresponds to a net-work throughput of 159.3 kg/sec. At this maximum pipeline throughput, 0.677percent of the supply gas is burnt in the turbines of the pressure stations. Ver-
18
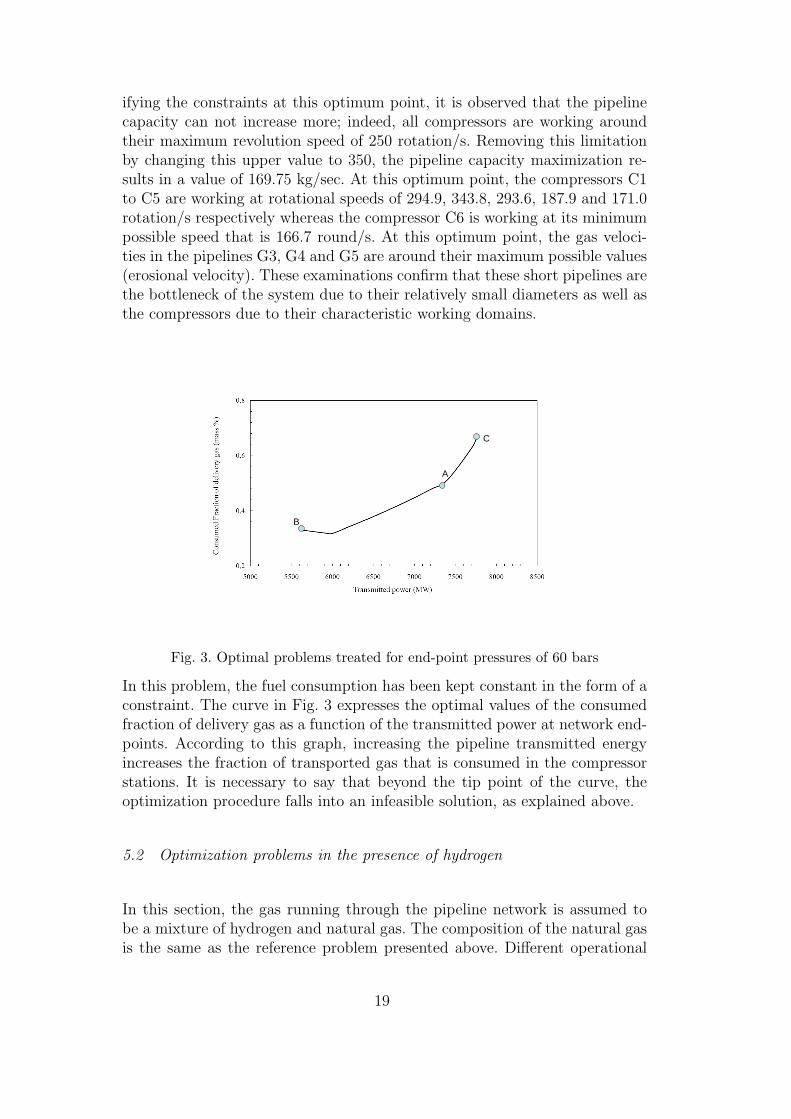
ifying the constraints at this optimum point, it is observed that the pipelinecapacity can not increase more; indeed, all compressors are working aroundtheir maximum revolution speed of 250 rotation/s. Removing this limitationby changing this upper value to 350, the pipeline capacity maximization re-sults in a value of 169.75 kg/sec. At this optimum point, the compressors C1to C5 are working at rotational speeds of 294.9, 343.8, 293.6, 187.9 and 171.0rotation/s respectively whereas the compressor C6 is working at its minimumpossible speed that is 166.7 round/s. At this optimum point, the gas veloci-ties in the pipelines G3, G4 and G5 are around their maximum possible values(erosional velocity). These examinations confirm that these short pipelines arethe bottleneck of the system due to their relatively small diameters as well asthe compressors due to their characteristic working domains.
A
B
C
Fig. 3. Optimal problems treated for end-point pressures of 60 bars
In this problem, the fuel consumption has been kept constant in the form of aconstraint. The curve in Fig. 3 expresses the optimal values of the consumedfraction of delivery gas as a function of the transmitted power at network end-points. According to this graph, increasing the pipeline transmitted energyincreases the fraction of transported gas that is consumed in the compressorstations. It is necessary to say that beyond the tip point of the curve, theoptimization procedure falls into an infeasible solution, as explained above.
5.2 Optimization problems in the presence of hydrogen
In this section, the gas running through the pipeline network is assumed tobe a mixture of hydrogen and natural gas. The composition of the natural gasis the same as the reference problem presented above. Different operational
19
conditions such as delivery pressure or hydrogen fraction in NG−H2 mixturescan be considered as the objective function. The same structure of the networkand specifications as those mentioned in Fig. 2 and Tab. 2 are used.
Initially, the gas passing through pipeline is considered pure hydrogen withoutnatural gas. Here, the pressure is considered to be equal to 60 bars witha margin of 2% at the entrance point of the network, node 0, as well asthe delivery point, node 17. After performing an optimization process whoseobjective function is the network transmitted power, the maximum achievablepipeline transmittable power is obtained 1272 MW that is equal to 16% ofits value in the case of pure natural gas (7778 MW). In this case (point C inin Fig. 3), the hydrogen consumption as station fuel is 0.176% of the inputhydrogen (10.534 kg/sec).
The observed reduction in the transmitted energy by the pipeline can bemainly attributed to the low molecular weight of hydrogen, i.e., about 10%of the value of natural gas (see Table (1) and the role of molecular weight inthe equation of motion). Because the mass basis LHV of hydrogen is about2.5 times of the corresponding value for natural gas, it reduces the impactof the low molecular weight of hydrogen on the reduction of the transmittedenergy by the pipeline. Other parameters such as compressibility factor play arelatively minor role. Yet, another factor can be here highlighted: the diametersof the pipelines existing in the compressor stations are so small that it isobserved that the gas average velocity tends to its upper limits (erosionalvelocity) in the case of pure hydrogen transport. Consequently, the mass flowrate can not increase any more.
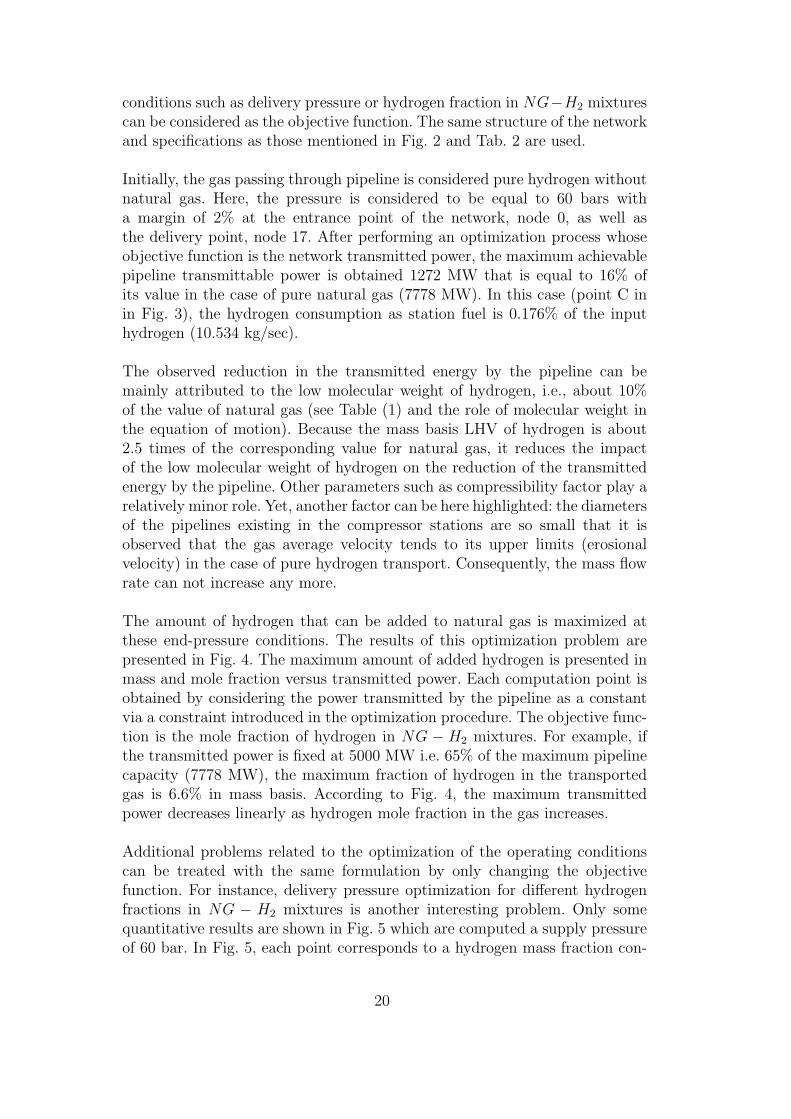
The amount of hydrogen that can be added to natural gas is maximized atthese end-pressure conditions. The results of this optimization problem arepresented in Fig. 4. The maximum amount of added hydrogen is presented inmass and mole fraction versus transmitted power. Each computation point isobtained by considering the power transmitted by the pipeline as a constantvia a constraint introduced in the optimization procedure. The objective func-tion is the mole fraction of hydrogen in NG − H2 mixtures. For example, ifthe transmitted power is fixed at 5000 MW i.e. 65% of the maximum pipelinecapacity (7778 MW), the maximum fraction of hydrogen in the transportedgas is 6.6% in mass basis. According to Fig. 4, the maximum transmittedpower decreases linearly as hydrogen mole fraction in the gas increases.
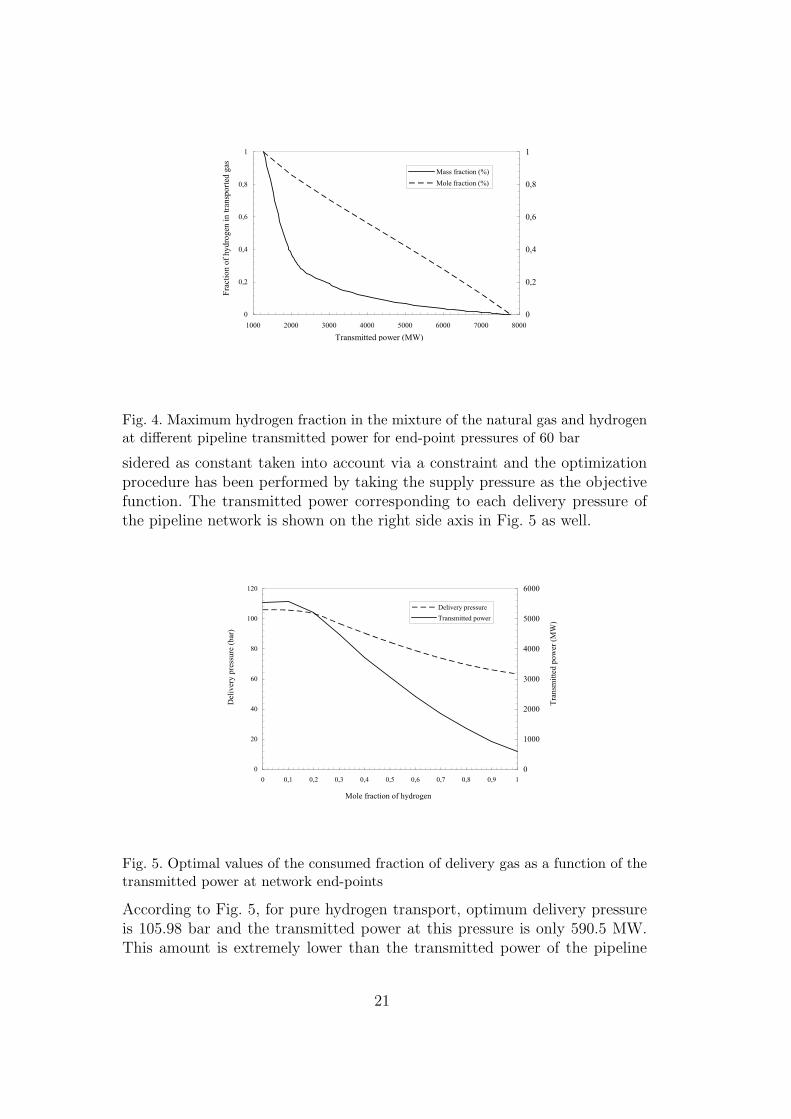
Additional problems related to the optimization of the operating conditionscan be treated with the same formulation by only changing the objectivefunction. For instance, delivery pressure optimization for different hydrogenfractions in NG − H2 mixtures is another interesting problem. Only somequantitative results are shown in Fig. 5 which are computed a supply pressureof 60 bar. In Fig. 5, each point corresponds to a hydrogen mass fraction con-
20
0
0,2
0,4
0,6
0,8
1
1000 2000 3000 4000 5000 6000 7000 8000
0
0,2
0,4
0,6
0,8
1
Mass fraction (%)
Mole fraction (%)
Fraction of hydrogen in transported gas
Transmitted power (MW)
Fig. 4. Maximum hydrogen fraction in the mixture of the natural gas and hydrogenat different pipeline transmitted power for end-point pressures of 60 bar
sidered as constant taken into account via a constraint and the optimizationprocedure has been performed by taking the supply pressure as the objectivefunction. The transmitted power corresponding to each delivery pressure ofthe pipeline network is shown on the right side axis in Fig. 5 as well.
0
20
40
60
80
100
120
0 0,1 0,2 0,3 0,4 0,5 0,6 0,7 0,8 0,9 1
0
1000
2000
3000
4000
5000
6000
Delivery pressure
Transmitted power
Delivery pressure (bar)
Mole fraction of hydrogen
Transm
itted power (MW)
Fig. 5. Optimal values of the consumed fraction of delivery gas as a function of thetransmitted power at network end-points
According to Fig. 5, for pure hydrogen transport, optimum delivery pressureis 105.98 bar and the transmitted power at this pressure is only 590.5 MW.This amount is extremely lower than the transmitted power of the pipeline
21

for natural gas without hydrogen which is 5547 MW at this supply pressure.
6 Conclusions and Perspectives
A mathematical modelling framework for gas pipeline networks was proposedin this study. A major interest of this work is to take into account the amountof hydrogen that can be added to the pipeline network traditionally devotedto the transportation of natural gas without any modification in the system.Defining the conditions under which hydrogen can be added to natural gasconstitutes a key point of this investigation as well as how much hydrogen canbe injected into the existing pipeline network while minimizing fuel consump-tion.
The principal hydraulic limiting factor for hydrogen introduction in an exist-ing pipeline is that hydrogen specific volume is much greater than this corre-sponding to natural gas which results in a strong decrease in pipeline through-put (mass flow rate) and consequently in the transmitted energy. However, apart of the reduction in transmitted energy is compensated by hydrogen LHV(weight basis) that is higher than the value corresponding to natural gas.
Several operational variables were selected as decision variables of gas pipelineoptimization problem. Optimization procedures including fuel consumptionminimization, amount of added hydrogen, transmitted power and deliverypressure maximization were performed for different gas mixtures of naturalgas and hydrogen using CONOPT/GAMS.
It has been shown that the maximum achievable fraction of hydrogen thatcan be added to natural gas is around 6 mass percent for the studied ex-ample. Addition of hydrogen to natural gas decreases the transmitted powersignificantly.
According to this study, an adaptation of the current networks of transmissionof natural gas to the transport of hydrogen seems yet possible until low valuesthat can be quantified with optimization tools such as the model proposed inthis study.
A perspective of this work is now to take into account safety constraints orcriteria in the design and operation phase. In that context, the use of mul-tiobjective optimization techniques constitutes a natural way and stochasticalgorithms such as Genetic Algorithms appear as serious candidates.
22

7 Nomenclature
D Pipeline diameter m
ε Pipeline diameter
f Darcy friction factor -
hi Compressor isentropic head m
ηi Adiabatic efficiency -
L Pipeline length m
LHV Low Heating Value at 25C, 1 bar MJ/kg
M Average molecular mass of the gas kg
Mi Molecular mass of species i kg
MAOP Maximum Allowable Operating Pressure
P Segment pipeline pressure Pa
Pc Pseudo-critical pressure of natural gas Pa
Pij Average pressure between two nodes i and j Pa
Qa Volumetric flow rate at suction side m3/s
R Universal gas constant 8.314 J/kmol-K
Re Reynolds number -
ρ Gas density kg/m3
T Temperature of natural gas K
Tc Pseudo-critical temperature of natural gas K
v Average gas velocity m/s
ve Erosional velocity m/s
x Pipe centreline direction m
ω Rotational speed rotation/s
Z compressibility factor -
23

References
Abbaspour, M., Chapman, K., Krishnaswami, P., JUN 2005. Nonisothermalcompressor station optimization. Journal of Energy Resources Technology-Transactions of the ASME 127 (2), 131–141.
Baade, W., Parekh, U., Raman, V., 2001. Hydrogen, Kirk-Othmer encyclopae-dia of chemical technology.
Brooke, A., Kendrick, D., Meeraus, A., Raman, R., 1988. GAMS Users Guide.GAMS Development Corporation.
Castello, P., Tzimas, E., Moretto, P., Peteves, S., 2005. Techno-economic as-sessment of hydrogen transmission & distribution systems in europe in themedium and long term. Tech. rep., The Institute for Energy, Petten, Nether-lands.
Florisson, O., Alliat, I., Lowesmith, B., Hankinson, G., 2006. The value of theexisting natural gas system for hydrogen, the sustainable future energy car-rier (progress obtained in the naturalhy-project). 23rd World gas conference,Amsterdam, Netherlands.
Haeseldonckx, D., D’haeseleer, W., 2007. The use of the natural-gas pipelineinfrastructure for hydrogen transport in a changing market structure. Inter-national Journal of Hydrogen Energy 32 (10-11), 1381–1386.
Markert, F., Nielsen, S., Paulsen, J., Andersen, V., Sep. 2007. Safety aspectsof future infrastructure scenarios with hydrogen refuelling stations. Inter-national Journal of Hydrogen Energy 32 (13), 2227–2234.
Menon, E., 2005. Gas pipeline hydraulics. Taylor & Francis Group.Mohring, J., Hoffmann, J., Halfmann, T., Zemitis, A., Basso, G., Lagoni, P.,
2004. Automated model reduction of complex gas pipeline networks. 36thannual meeting of pipeline simulation interest group, Palm Springs, Cali-fornia, USA.
Oney, F., Veziroglu, T. N., Dlger, Z., Oct. 1994. Evaluation of pipeline trans-portation of hydrogen and natural gas mixtures. International Journal ofHydrogen Energy 19 (10), 813–822.
Padro, C., Keller, J., 2001. Kirk-Othmer encyclopaedia of chemical technol-ogy,. Ch. Hydrogen energy, pp. 837–866.
Parker, N., 2004. Using natural gas transmission pipeline cost to estimatehydrogen pipeline cost. Master’s thesis, Institute of transportation studies,University of California, USA.
Randelman, R., Wenzel, L., 1988. Joule-thomson coefficients of hydrogen andmethane mixtures. Journal of chemical engineering data 33, 293–299.
Rivkin, C., 2006. Hazards and hazard mitigation techniques for natural gasand hydrogen fueling operations. Process safety progress 26, 27–34.
Romeo, E., Royo, C., Monzon, A., 2002. Improved explicit equations for es-timation of the friction factor in rough and smooth pipes. Chemical engi-neering journal 86(3), 69–374.
Schouten, J., Michels, J. P., Rosmalen, R., 2004. Effect of h2-injection on thethermodynamic and transportation properties of natural gas. International
24

journal of hydrogen energy 29(11), 1173–1180.Seymour, E. H., Murray, L., Fernandes, R., Jun. 2008. Key challenges to the
introduction of hydrogen–european stakeholder views. International Journalof Hydrogen Energy 33 (12), 3015–3020.
Sherif, S., Barbir, F., Veziroglu, T., 2005. Towards a hydrogen economy. Theelectricity journal 18(6), 62–76.
Smit, R., Weeda, M., de Groot, A., 2007. Hydrogen infrastructure developmentin the netherlands. International Journal of Hydrogen Energy 32 (10-11),1387–1395.
Smith, J., Ness, H. V., 1988. Introduction to chemical engineering thermody-namics.
Tabkhi, F., 2008. Optimization of gas transport networks. Ph.D. thesis, INPT.Tabkhi, F., C.Azzaro-Pantel, Pibouleau, L., Domenech, S., 2006. Optimisa-
tion de rseaux de transport de gaz naturel. In: 6meColloque des SystmesdInformation, Modlisation, Optimisation et commande en gnie des procds(SIMO06), Toulouse, 11-12 octobre 2006.
Tzimas, E., Castello, P., Peteves, S., 2007. The evolution of size and cost ofa hydrogen delivery infrastructure in europe in the medium and long term.International Journal of Hydrogen Energy 32 (10-11), 1369–1380.
Veziroglu, T., Barbir, F., 1998. Emerging technology series, hydrogen energytechnologies. Tech. rep., United Nations Industrial Development Organiza-tion, Vienna.
Whaley, T., 2001. Pipelines, Kirk-Othmer Encyclopaedia of Chemical Tech-nology.
Zeberg-Mikkelsen, C., 2001. Viscosity study of hydrocarbon fluids at reser-voir conditions, modeling and measurements. Ph.D. thesis, Department ofchemical engineering, Technical University of Denmark.
Zhou, L., Zhou, Y., 2001. Determination of compressibility factor and fugacitycoefficient of hydrogen in studies of adsorptive storage. International journalof hydrogen energy 26, 597601.
25