Embed Size (px)
Citation preview

1
Journal of the Meteorological Society of Japan Vol. 81., No.1, pp. 41-56, 2003 Copyright 2003, Meteorological Society of Japan(MSJ). Permission has been provided by MSJ to place a copy of the article on this server. MSJ will not guarantee that the copy provided here is an accurate one published in the journal.
A Look at the Relationship between the ENSO and the Indian Ocean Dipole
Karumuri Ashok # , Zhaoyong Guan * , and Toshio Yamagata† Institute for Global Change Research, 3173-25, Showamachi, Kanazawa-Ku, Yokohama City, Kanagawa 236-0001, Japan
ABSTRACT Using observed sea surface temperature data from 1871-1998, and observed wind data from 1958-1998, we have confirmed that the recently discovered Indian Ocean Dipole (IOD) is a physical entity. Many IOD events are shown to occur independently of the El Niño. By estimating the contribution from an appropriate El Niño index based on sea surface temperature anomaly in the eastern Pacific, we have shown that the major fraction of the IOD Mode Index is due to the regional processes within the Indian Ocean. Our circulation analysis shows that the Walker circulation during the pure IOD events over the Indian/Pacific Ocean is distinctly different from that during the El Niño events. Our power spectrum analysis, and wavelet power spectrum analysis show that the periodicities of El Niño and IOD events are different. The results from the wavelet coherence analysis show that, during the periods when strong and frequent IOD events occurred, the Indian Ocean Dipole Mode Index is significantly coherent with the equatorial zonal winds in the central Indian Ocean, suggesting that these events are well coupled. During the periods when there seems to be some relationship between the equatorial zonal winds in the central Indian Ocean and ENSO index, we do not see any significant coherence between the Indian Ocean Dipole Mode Index and the equatorial zonal winds in the central Indian Ocean, except after 1995, suggesting that most of the IOD events are not related to ENSO.
1. Introduction The El Niño/Southern Oscillation (ENSO) has
been recognized as an important manifestation of the tropical ocean-atmosphere-land coupled system. The recently discovered Indian Ocean Dipole (IOD; Saji et al., 1999; Behera et al., 1999; Webster et al, 1999) is another important manifestation of the tropical air-sea interaction. The Indian Ocean Dipole Mode Index (IODMI; denoted by IODMI ) is defined as the sea surface temperature anomaly (SSTA) difference between the tropical western Indian Ocean (50oE-70oE, 10oS- 10oN; henceforth referred to as the Box A for convenience) and the tropical southeastern Indian Ocean (90oE- 110oE, 10oS-equator, named as Box B) (Fig.1). El Niño and IOD events account for 30% and 12% of the tropical Indian Ocean SST variability respectively (Saji et al., 1999). It means that both of the aforementioned phenomena explain most of the tropical Indian Ocean variability.
The IOD events have a strong influence on the climate of not only the immediate neighboring regions such as East Africa and Indonesia (Saji et al., 1999), but also the Indian summer monsoon region (Ashok et al., 2001), East Asia (Saji and Yamagata, 2002b, Guan et al., 2002), the Mediterranean, Australia, and Brazil (Saji and Yamagata, 2002b).
Since some of the positive IOD events coincidentally occur with some strong El Niño events, as in 1997, an interesting issue on dependence/independence of the two phenomena, in addition to another interesting issue on the physical existence/non-existence of the IOD, has been raised (Allan et al., 2001). In this study, using the sea surface temperature (SST) and wind data, we claim that the Indian Ocean Dipole (IOD) is a physical mode of the tropical Indian Ocean, and not a statistical artifact. We also reconfirm that the IOD is an inherent mode of the Indian Ocean, as demonstrated by Saji et al. (1999).
The monthly mean GISST data (Rayner et al., 1996) from 1871-1998 has been used to compute the NINO3 SST index (area-averaged over the area 5oN-5oS, 150oW-90oW, denoted by 3NINOI ), IODMI and other necessary quantities. The NECP-NCAR 40-year (1958-1997) reanalysis data (Kalnay et al, 1996) have been used for the wind analysis. NCEP/NCAR wind data has been used widely for the last few years in tropical climate research (e.g. Krishna Kumar et al., 1999, Murtugdde et al., 2000, Wang et al., Ashok et al., 2001, Xie et al., 2002). Though the NCEP/NCAR precipitation data is underestimated, the circulation features are reasonable, as noted by Annamalai et al. (1999), who have also shown that the NCEP/NCAR wind data exhibit realistic large-scale interannual variations in the tropics, especially in the monsoon
---------------------------------------------- *Also at Nanjing Institute of Meteorology, Nanjing 210044, China †Also at Department of Earth & Planetary Science, Graduate
School of Science, The University of Tokyo, Tokyo 113 0033, Japan Tel: +81-45-778-5523 Fax: +81-45-778-5707 # Email for correspondence: [email protected]

2
region. Hence, for the present study dealing with large scale circulation features in the Indo-Pacific region, NCEP/NCAR wind data is appropriate.
In section 2 of this study, we show that IOD events as defined by Saji et al. (1999) do indeed exist. We show the circulation features of the so-called pure positive IOD events, i.e. those positive IOD events that are not associated with any El Niño signal in the Pacific. In section 3, we carry out correlation, power-spectrum, and wavelet variance analyses on the IOD
and ENSO’s SST indices. We also perform the wavelet coherence analysis on these SST indices as well as the central Indian Ocean zonal winds that are important for the wave dynamics and coupling of the Indian Ocean (Xie et al., 2001, Rao et al., 2002) to find out the relative influences of the external and
internal processes, and the temporal localization of the influences.
2. The IOD as an inherent mode, and its characteristic patterns
The IOD is basically characterized as the SSTA (Sea Surface Temperature Anomaly) of opposite signs prevailing over the Boxes A and B (Saji et al., 1999). During some years such as 1924, 1972 etc., it can be
seen that the IODMI is significant, though the bulk of the contribution to it comes from only one box (Fig.1). Nevertheless, the strong SSTA zonal gradient acts as a dipole, virtually. The SSTA assumes a dipole -like pattern when the area-averaged anomalies are plotted
Fig. 1 : The time-series of SSTA (in unit of oC) averaged over Box A (50oE-70oE, 10oS- 10oN; shown in red) and over Box B (90oE- 110oE, 10oS-equator; clear bars) during the dipole months. The sign of the SSTA over box A and that over Box B are opposite during these months. The thin black solid line is the Indian Ocean Dipole Mode Index, IODMI . The normalized equatorial zonal wind index (to be multiplied by 1.5; in m⋅s-1) defined by Saji et al.(1999), from 1958-1998, is shown as the dashed line.

3
(figure not shown). Such events are also very important owing to the impact of this zonal gradient on the climate of the surrounding regions like the Indonesian and African rainfall (Saji et al., 1999), and the Indian summer rainfall (Ashok et al., 2001).
Rao et al. (2002) found that, between 1877-1997, there occurred 14 ‘strong’ (i.e. during each of these years, the magnitude of the IODMI was more than its annual standard deviation) positive and 19 ‘strong’ negative IOD events. They show that 35% of these IOD events co-occur with ENSO events having the same phase of the corresponding IOD. Here, we will present a more detailed IOD occurrence statistics by stratifying the data on a monthly basis. To facilitate an easy discussion, we designate the term ‘dipole month’ for any month between April-November for which the
IODMI is significantly strong (magnitude of the IODMI of that month should be more than its monthly standard deviation). Similarly, an ENSO month designates any month when the magnitude of the
3NINOI exceeds the respective monthly standard deviation. The term ‘single month’ designates lonely dipole months that do not have another preceding or succeeding dipole month.
Of the 1536 months during our study period, the IOD type of SSTA can be seen in the Indian Ocean during 498 months (see Fig. 1). Table 1 presents some monthly statistics of the IODMI . It shows that during April-November months of the study period, 27% of the dipole months are associated with simultaneous ENSO months. During the months of April-August, only about 21% of the dipole months are associated with ENSO months. During September-November, the dipole months co-occurring with an ENSO month amount to 35% of the total dipole months, in agreement with Rao et al. (2002). We note that the co-occurrence refers to the simultaneous occurrence of the positive IOD phenomenon with an El Niño, or that of a negative IOD phenomenon with a La Niña. Actually, there are some years when this relationship
is not valid. It is interesting to note that there are some years when a warm ENSO event (El Niño) is associated with a positive IOD event (as in 1997), while there are some years when the El Niño events co-occur with a negative IOD event (e.g. 1909, 1992).
Similarly, some cold ENSO events (La Niña), such as in 1967, are accompanied by positive IOD events. Table 1 shows that the number of the designated dipole months is more during April-August, the developing season of the IOD (Saji et al., 1999), than those during the SON, the mature phase of the IOD events (Saji et al., 1999). Also, ENSO events generally tend to be stronger during SON, as compared to the period between April-August. These factors also indicate that not all IOD events may have been triggered by the ENSO. The fact that the number of the dipole months is more during April-August is understandable, as some of them do not develop into fully mature IOD events. However, the societal influence of these events may be substantial. Even the single months with significant IOD type of SSTA are important in the sense that they may have implications for the summer climates of the eastern Africa, the Indonesian archipelago, and India. Particularly, in the case of the Indian summer monsoon, the influences of the IOD and ENSO events are opposite (Ashok et al., 2001). Even a single dipole month may influence the monsoon circulation and rainfall through modulation of the intraseasonal meridional movement of the rainfall band over India.
The above discussion shows that the majority of the dipole months, and so the IOD events by extension, are independent of ENSO. The significant correlation between the IODMI and 3NINOI during some periods is largely due to the simultaneous occurrence of some of the IOD events and the ENSO events.
Using the NCEP/NCAR 40-year reanalysis, an interesting feature is obtained by the study of anomalous velocity potential patterns at different levels during the summer (JJAS) of 1961 (Fig.2a and 2b). During this typical IOD year, two separate
Table 1: Dipole month statistics ( 3NINOI is the NINO3 index and IODMI is the IOD index. The term ‘single month’ designates lone dipole months that do not have another preceding or succeeding dipole month)
Total Number of the months
during when the IODMI is
significant
Total Number of the months when both
the IODMI and 3NINOI are
significant
Months when the only
IODMI is significant
Single months
Single months that co-occur with ENSO
April-November 169 46 123 38 11
September-November
71 25 46 13 4
April-August 98 21 77 25 7
4 Walker circulation systems can be seen over the
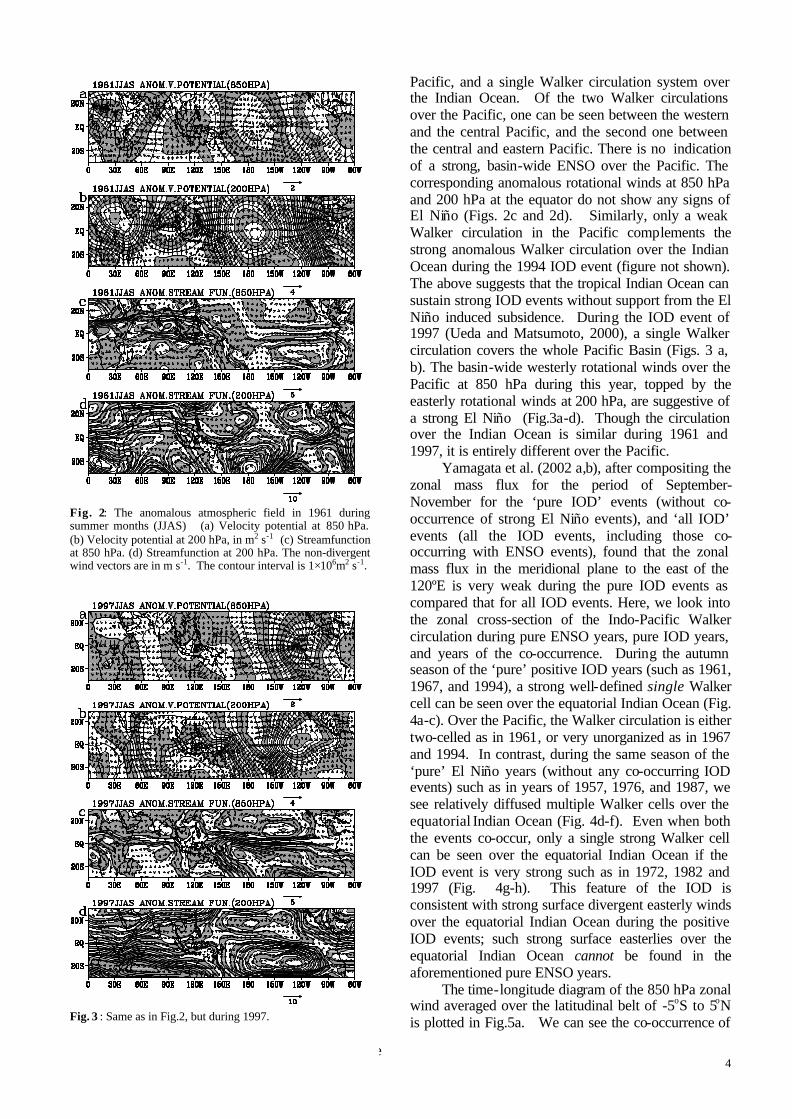
Pacific, and a single Walker circulation system over the Indian Ocean. Of the two Walker circulations over the Pacific, one can be seen between the western and the central Pacific, and the second one between the central and eastern Pacific. There is no indication of a strong, basin-wide ENSO over the Pacific. The corresponding anomalous rotational winds at 850 hPa and 200 hPa at the equator do not show any signs of El Niño (Figs. 2c and 2d). Similarly, only a weak Walker circulation in the Pacific complements the strong anomalous Walker circulation over the Indian Ocean during the 1994 IOD event (figure not shown). The above suggests that the tropical Indian Ocean can sustain strong IOD events without support from the El Niño induced subsidence. During the IOD event of 1997 (Ueda and Matsumoto, 2000), a single Walker circulation covers the whole Pacific Basin (Figs. 3 a, b). The basin-wide westerly rotational winds over the Pacific at 850 hPa during this year, topped by the easterly rotational winds at 200 hPa, are suggestive of a strong El Niño (Fig.3a-d). Though the circulation over the Indian Ocean is similar during 1961 and 1997, it is entirely different over the Pacific.
Yamagata et al. (2002 a,b), after compositing the zonal mass flux for the period of September-November for the ‘pure IOD’ events (without co-occurrence of strong El Niño events), and ‘all IOD’ events (all the IOD events, including those co-occurring with ENSO events), found that the zonal mass flux in the meridional plane to the east of the 120ºE is very weak during the pure IOD events as compared that for all IOD events. Here, we look into the zonal cross-section of the Indo-Pacific Walker circulation during pure ENSO years, pure IOD years, and years of the co-occurrence. During the autumn season of the ‘pure’ positive IOD years (such as 1961, 1967, and 1994), a strong well-defined single Walker cell can be seen over the equatorial Indian Ocean (Fig. 4a-c). Over the Pacific, the Walker circulation is either two-celled as in 1961, or very unorganized as in 1967 and 1994. In contrast, during the same season of the ‘pure’ El Niño years (without any co-occurring IOD events) such as in years of 1957, 1976, and 1987, we see relatively diffused multiple Walker cells over the equatorial Indian Ocean (Fig. 4d-f). Even when both the events co-occur, only a single strong Walker cell can be seen over the equatorial Indian Ocean if the IOD event is very strong such as in 1972, 1982 and 1997 (Fig. 4g-h). This feature of the IOD is consistent with strong surface divergent easterly winds over the equatorial Indian Ocean during the positive IOD events; such strong surface easterlies over the equatorial Indian Ocean cannot be found in the aforementioned pure ENSO years.
The time-longitude diagram of the 850 hPa zonal wind averaged over the latitudinal belt of -5oS to 5oN is plotted in Fig.5a. We can see the co-occurrence of
Fig. 2: The anomalous atmospheric field in 1961 during summer months (JJAS) (a) Velocity potential at 850 hPa. (b) Velocity potential at 200 hPa, in m2⋅s-1 (c) Streamfunction at 850 hPa. (d) Streamfunction at 200 hPa. The non-divergent wind vectors are in m⋅s-1. The contour interval is 1×10⁶m2⋅s-1.
Fig. 3 : Same as in Fig.2, but during 1997.

5
the IOD events with El Niño events during years such as 1972, 1982, and 1997. The ENSO-related zonal wind can be calculated by regressing the winds on to the NINO3 index. This part is subtracted from the total zonal wind, and the remainder is plotted in Fig. 5b. The easterly wind anomalies that are indicative of the positive IOD event over the eastern Indian Ocean are still strong during the years such as 1972, 1997
etc., even after removing the ENSO signal. Since the IOD starts earlier in the boreal spring and early summer, ENSO events such as in 1972 and 1997 appear to be initiated by the eastward propagation of the westerly anomalies in the Indian Ocean.
3. Relation between IOD and El Niño
Here we will study the statistical relation between the IODMI and 3NINOI in more detail. We decompose the sea surface temperature anomalies (SSTA) over the tropical Indian Ocean in the following fashion:
[ ] *IOIOIO SSTASSTASSTA += , (1)
where IOSSTA is the monthly anomaly from the
mean climatology, and [ ]IOSSTA is the area-averaged SSTA over the equatorial Indian Ocean (50oE-110oE, 10oS- 10oN). The time series of [ ]IOSSTA is the all-tropical Indian Ocean index, denoted as IATIO. The
*IOSSTA represents the spatially non-uniform
component of anomalous SST in this region. The correlation between the time series of the IATIO and that of the IOSSTA is positive everywhere and statistically significant in the whole tropical Indian Ocean, as the value at the 99% level of confidence is 0.07 (figure not shown). The correlation exceeds 0.80 in the central area of the tropical Indian Ocean. This means that the SSTA varies in phase everywhere in the tropical Indian Ocean in general, which is consistent with the first principal mode derived by the EOF analysis of SSTA in the tropical Indian Ocean (Saji et al., 1999). Lagged correlations between IATIO and
Fig. 4: (a-i) The height-longitude anomalous Walker circulation during September-October-November (SON), derived from the non-rotating zonal component of the velocity and the vertical velocity, during the years 1961, 1967, 1994, 1957, 1976, 1987, 1972, 1982, 1997 respectively. The colored contours in the background represent the divergent zonal winds (m⋅s-1); negative (positive) contours represent easterlies (westerlies)
Fig.4 : Con’d
. Fig.4 : Con’d

6
3NINOI are presented in Table 2, from which we see that the biggest correlation reaches the highest value of 0.60 when IATIO lags the 3NINOI by about 4 months. Therefore, any analysis based on the signal obtained from the SSTA averaged over the whole tropical Indian Ocean does always strongly involve the ENSO signal. This factor has mislead some researchers into believing that the Indian Ocean is just a slave to the Pacific phenomenon; the original IOD index (Saji et al., 1999) was introduced as difference of SST.
Although the correlation between the IODMI and the 3NINOI over the 128 years is 0.3, the correlation between these two quantities changes from time to time, as we can see from the 31-year sliding correlations between these two quantities (Fig. 6). The moving correlation values fall from 0.42 during 1882-1912 to a very low value of 0.09 during 1912-
1943. In the last two decades the correlations have risen up. Out of the 33 strong IOD events that occurred between 1877-1997, 9 IOD events have occurred during 1882-1912 period, a period when the IOD-ENSO correlations were very weak (Fig. 7; see
Fig. 5 : (a) The time-longitude distribution of the zonal wind anomalies (averaged over -5 oS to 5 oN). The contour interval is 2 m⋅s-1. The dashed lines represent negative values. The contours with value between –2 m⋅s-1 and 2 m⋅s-1 are not plotted. (b) similar to Fig. 5a, but for the ENSO-independent wind.
Table 2: The lagged correlation between the 3NINOI and IATIO ( 3NINOI is the NINO3 index and IATIO is the mean SSTA, averaged over the whole tropical Indian Ocean)
IATIO lagging to 3NINOI (Months)
-8 -5 0 2 3 4 5 6 15 18
Correlation 0.00 0.11 0.46 0.56 0.59 0.60 0.60 0.59 0.10 -0.01
Fig. 6: The 31-year moving correlations between the normalized IODMI , and normalized 3NINOI for the period from 1871 through 1998.

7
also Rao et al, 2002). The relatively low values of the
correlations between 1890-1957 generally support the point suggested by Saji et al. (1999) that the Indian Ocean Dipole may occur independently of the El Niño. There is also no consistent association between the phases of the ENSO and IOD. The IOD events, despite being associated with the ENSO events in some years, may be generated independently of ENSO.
In order to assess the ENSO influence on the IODMI , we have carried out a lag-correlation analysis
between the 3NINOI and IODMI . We present in Table 3, the correlation matrix between the IODMI and the
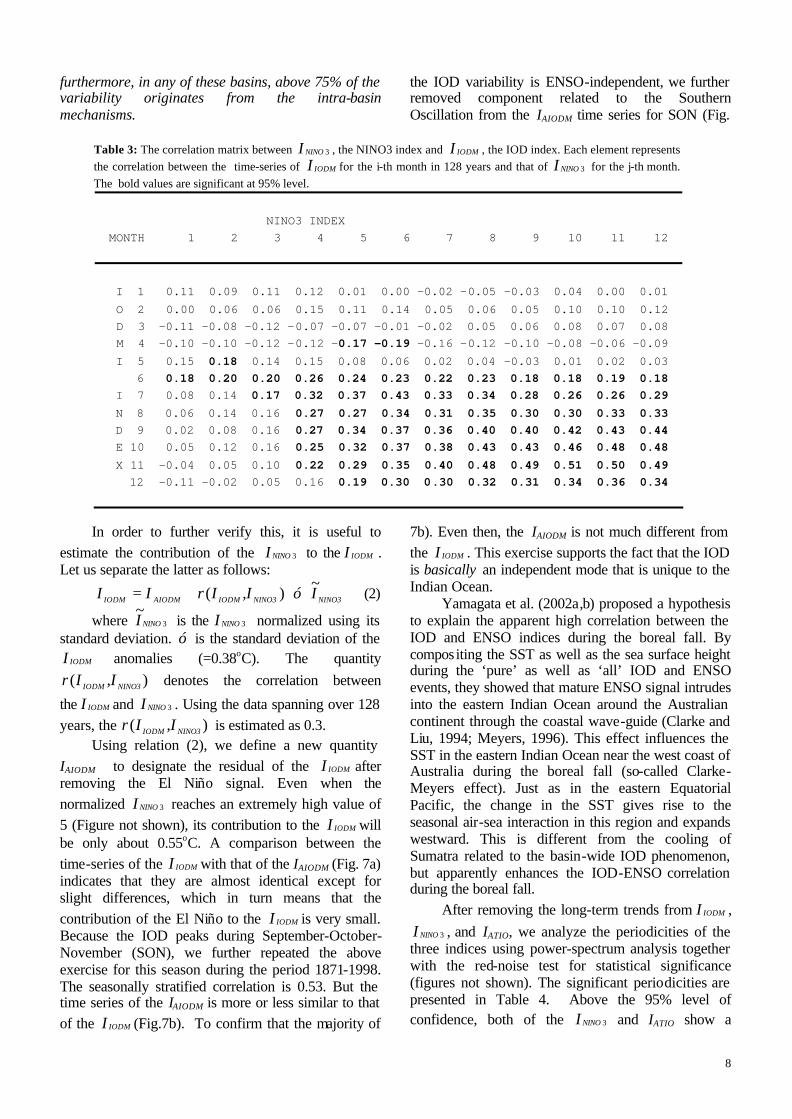
3NINOI for all the calendar months. Each element C ij in this table represents the correlation value between the 'i'th month of the 3NINOI and 'j'th month of the IODMI . Significant correlations are apparently found (above the significant value of 0.17 at 95% confidence). As we have discussed in the earlier sections, however, this reflects the simultaneous occurrence of some strong IOD and ENSO events. The monthly-stratified simultaneous correlation reaches a high of 0.5 during November, indicating a relatively strong statistical association between these events; however, it means that about 25% of their
variability is statistically interconnected, and that,
Fig. 7: (a) Time-series of the indices IODMI (solid) and IAIODM (dashed), for the period from 1871 through 1998. (b) time series of the normalized SON-seasonal means of the IODMI (solid), the normalized IAIODM (dashed), and the SOI-independent normalized IAIODM (+ signed); all the time series are for the period from 1871 through 1998.
Fig. 7 b
8
furthermore, in any of these basins, above 75% of the variability originates from the intra-basin mechanisms.
In order to further verify this, it is useful to estimate the contribution of the 3NINOI to the IODMI . Let us separate the latter as follows:
NINO3NINO3IODMAIODMIODM Ió,IIrII ~)( ⋅⋅+= (2)
where 3~
NINOI is the 3NINOI normalized using its standard deviation. ó is the standard deviation of the
IODMI anomalies (=0.38oC). The quantity )( NINO3IODM ,IIr denotes the correlation between
the IODMI and 3NINOI . Using the data spanning over 128 years, the )( NINO3IODM ,IIr is estimated as 0.3.
Using relation (2), we define a new quantity IAIODM to designate the residual of the IODMI after removing the El Niño signal. Even when the normalized 3NINOI reaches an extremely high value of 5 (Figure not shown), its contribution to the IODMI will be only about 0.55oC. A comparison between the time-series of the IODMI with that of the IAIODM (Fig. 7a) indicates that they are almost identical except for slight differences, which in turn means that the contribution of the El Niño to the IODMI is very small. Because the IOD peaks during September-October-November (SON), we further repeated the above exercise for this season during the period 1871-1998. The seasonally stratified correlation is 0.53. But the time series of the IAIODM is more or less similar to that of the IODMI (Fig.7b). To confirm that the majority of
the IOD variability is ENSO-independent, we further removed component related to the Southern Oscillation from the IAIODM time series for SON (Fig.
7b). Even then, the IAIODM is not much different from the IODMI . This exercise supports the fact that the IOD is basically an independent mode that is unique to the Indian Ocean.
Yamagata et al. (2002a,b) proposed a hypothesis to explain the apparent high correlation between the IOD and ENSO indices during the boreal fall. By compositing the SST as well as the sea surface height during the ‘pure’ as well as ‘all’ IOD and ENSO events, they showed that mature ENSO signal intrudes into the eastern Indian Ocean around the Australian continent through the coastal wave-guide (Clarke and Liu, 1994; Meyers, 1996). This effect influences the SST in the eastern Indian Ocean near the west coast of Australia during the boreal fall (so-called Clarke-Meyers effect). Just as in the eastern Equatorial Pacific, the change in the SST gives rise to the seasonal air-sea interaction in this region and expands westward. This is different from the cooling of Sumatra related to the basin-wide IOD phenomenon, but apparently enhances the IOD-ENSO correlation during the boreal fall.
After removing the long-term trends from IODMI , 3NINOI , and IATIO, we analyze the periodicities of the
three indices using power-spectrum analysis together with the red-noise test for statistical significance (figures not shown). The significant periodicities are presented in Table 4. Above the 95% level of confidence, both of the 3NINOI and IATIO show a
Table 3: The correlation matrix between 3NINOI , the NINO3 index and IODMI , the IOD index. Each element represents the correlation between the time-series of IODMI for the i-th month in 128 years and that of 3NINOI for the j-th month. The bold values are significant at 95% level.
NINO3 INDEX MONTH 1 2 3 4 5 6 7 8 9 10 11 12
I 1 0.11 0.09 0.11 0.12 0.01 0.00 -0.02 -0.05 -0.03 0.04 0.00 0.01 O 2 0.00 0.06 0.06 0.15 0.11 0.14 0.05 0.06 0.05 0.10 0.10 0.12 D 3 -0.11 -0.08 -0.12 -0.07 -0.07 -0.01 -0.02 0.05 0.06 0.08 0.07 0.08 M 4 -0.10 -0.10 -0.12 -0.12 -0.17 -0.19 -0.16 -0.12 -0.10 -0.08 -0.06 -0.09 I 5 0.15 0.18 0.14 0.15 0.08 0.06 0.02 0.04 -0.03 0.01 0.02 0.03 6 0.18 0.20 0.20 0.26 0.24 0.23 0.22 0.23 0.18 0.18 0.19 0.18 I 7 0.08 0.14 0.17 0.32 0.37 0.43 0.33 0.34 0.28 0.26 0.26 0.29 N 8 0.06 0.14 0.16 0.27 0.27 0.34 0.31 0.35 0.30 0.30 0.33 0.33 D 9 0.02 0.08 0.16 0.27 0.34 0.37 0.36 0.40 0.40 0.42 0.43 0.44 E 10 0.05 0.12 0.16 0.25 0.32 0.37 0.38 0.43 0.43 0.46 0.48 0.48 X 11 -0.04 0.05 0.10 0.22 0.29 0.35 0.40 0.48 0.49 0.51 0.50 0.49 12 -0.11 -0.02 0.05 0.16 0.19 0.30 0.30 0.32 0.31 0.34 0.36 0.34

9
periodicity of 43.5 months. But the IODMI has the most dominant periodicity of 62.5 months, whereas the
3NINOI does not have any significant peak at this periodicity. Thus, the IOD and ENSO occur basically on different time scales, and the former is less frequent than the latter. Since only 12% of the IOD variations are statistically explained by ENSO variations (Behera et al., 2002), the present results again support the fact that the IOD is basically a mode unique to the Indian Ocean. We claim, therefore, that the IOD and ENSO are, in principle, due to the inherent internal modes in the respective basin. However, once occurred, this does not exclude the interaction between two modes through the atmospheric bridge.
To study the localization of the IOD and ENSO events in time, and to identify the dominant periodicity during different decades, we have applied the wavelet power spectrum analysis (Torrence and Compo, 1998) to the time series of IODMI and 3NINOI . The IOD events occurred at the most dominant periodicity of quasi-pentadal timescale during 1871-1885, during the 1960s and 1970s, and from the early 1990s till 1998 (figures not shown). Furthermore, the
IODMI exhibits a periodicity of 2 years during 1900-1905, the early half of the 1960s, and during 1993-1994, and also a 3-year periodicity during 1890-1895. The decadal period is prominent during 1910-1935. The 3NINOI has a periodicity of 2-3 years during most of the study period. The quasi-pentadal and decadal periodicities are not as dominant as the period of 2 years. The variances of both IODMI and 3NINOI , during the period between 1920-1960, are relatively low as compared to those during the other period.
Based on the fact that the Southern Oscillation Index is correlated with the zonal and meridional winds at 0.57 and –0.51, Murtugudde et al. (2000) suggested that ENSO and IOD could be sometimes related via the atmosphere. At the same time, they note that many of the IOD events do not occur with
ENSO. Xie et al. (2002) find a strong correlation between the indices of off-equatorial Rossby waves in the south Indian Ocean, and ENSO during the selected period of 1970-1999; they indicate that ENSO exerts some effect on the Indian Ocean wind stress. It appears, however, that the analysis area is located further south of the IOD activities; they appear to have discussed another phenomenon (Rao, personal communication). Rao et al. (2002) showed that the interannual subsurface variability of the equatorial Indian Ocean is dominated by the IOD. Rao et al. (2002) further demonstrated that the equatorial ocean waves in response to the equatorial Indian Ocean zonal winds play a key role in the evolution of the subsurface dipole. Here, we carried out wavelet coherence analysis (Torrence and Webster, 1999) to understand the relative relationships of the remote forcing and the local processes in regard to the zonal wind anomalies over the central Indian Ocean. In the ensuing discussion, the area-averaged zonal wind anomalies over the central Indian Ocean (70º-90ºE, 5ºS to 5ºN), used by Saji et al. (1999) and Rao et al. (2002), will serve as an index to represent the equatorial zonal winds over the Indian Ocean (see Fig.1 for the time series). We refer to this index as the equatorial Indian Ocean zonal wind anomalies (EIOZWA).
From 1958 till the end of 1977, the variances of IODMI and the EIOZWA are significantly coherent at
periodicities of 1.5-6.5 years (Fig. 8a), indicating a strong coupling between them. On the other hand, the 3NINOI is coherent with the EIOZWA between 1958-1965 with a periodicity of about 7-8.5 years (Fig. 8b). During this period, if the IOD events were forced by the equatorial winds modulated by the ENSO, the coherence peaks should have the same periodicity in both cases. However, this is not the case, as shown in Figs. 8a and Fig. 8b. This suggests that IOD and ENSO events are not related during this period, at least in a linear manner. The less significant wavelet coherence between the IODMI and 3NINOI also attests this fact (Fig. 8c).
During 1978 to 1987, another sustained 3NINOI -EIOZWA variance coherence peak can be seen with peak periodicity varying between 3.5-4.5 years. Noticeably, there is no sustained coherence peak between the IODMI and the EIOZWA during this period. As we move further in time, from 1989 through 1997 it is seen that the IODMI is tightly coupled to the EIOZWA at periodicities between quasi-biennial and quasi-pentadal timescales (Fig. 8a). The 3NINOI , on the other hand, is coherent with the EIOZWA at periodicities of 1.5-3.5 years after 1995 (Fig. 8b). Apparently, during this period, there appears to be some interaction of the Pacific events
Table 4: The periodicities (in months) of the 3NINOI , IATIO, and
the IODMI ( 3NINOI is the NINO3 index, IATIO is the mean SSTA, averaged over the whole tropical Indian Ocean,
and IODMI is the IOD index)
Confidence Level( α) %95≥α %90%95 ≥>α
Periods in 3NINOI 43.5 ; 34.5 ; 17.9 16.4; 13.5
Periods in IATIO 43.5 58.8
Periods in IODMI 62.5 125.0; 25.6; 10.1

10
with the coupling processes in the Indian Ocean through the atmospheric bridge, as probably happened during the IOD event of 1997 (Ueda and Matsumoto, 2000). The wavelet coherency between the IODMI and
3NINOI (Fig. 8c) also brings out this aspect.
It is interesting to observe that the strong IOD events occur only when the IODMI-EIOZWA coherence is significant, and that, a strong coherence between the 3NINOI and EIOZWA is not necessary for the existence of the IOD events. This again suggests that the IOD events are regional coupled phenomenon, and may be independent from the ENSO events, as suggested by Saji et al. (1999) and Rao et al. (2002).
4. Concluding remarks
The present analysis of the observed data demonstrates that the physical existence of the IOD is beyond doubt. This shows quite a contrast to Dommenget and Latif (2002) and Hastenrath (2002).
The present result is also supported by the recent studies using Ocean GCMs, Atmospheric GCMs, and coupled GCMs, all of which resolved the expected dynamics (Vinayachandran, 2002, Iizuka et al, 2000, Ashok et al., 2001, Rao et al., 2002, Guan et al., 2002, Yu et al., 2002, Yu and Lau, 2002), and the recent surface and subsurface ocean data studies demonstrating that the evolution of the IOD is mostly independent of the Pacific influence (Vinayachandran et al., 1999, Rao et al., 2002, Yamagata et al., 2002a,b).
We have shown that the strong positive IOD events that occurred during the years such as 1961, 1967, and 1994 were not associated with El Niño in the Pacific. This fact shows that the Indian Ocean can sustain strong IOD events on its own, without the external forcing. We also showed that the Walker circulation over the Indian Ocean during the ‘pure’ IOD events is a single cell, while that during the pure ENSO years such as 1957, 1976, and 1987 is multi-celled and diffused.
It is also shown that, in general, the variance of the IOD Index explained by the variations of NINO3 Index is very small, although the correlation between these two indices reaches above 0.5 during the autumn. This relatively high correlation is primarily due to the co-occurrence of the ENSO and the IOD events.
The whole tropical Indian Ocean shows a high significant periodicity of 43.5 months, as does the tropical Pacific. The Indian Ocean, however, shows several other significant periodic variations as seen from the periodicities of both the whole Indian Ocean SSTA index and IODMI . In addition to the biennial tendency as suggested by Saji et al. (1999), the IOD Index has a more significant periodicity of 62.5 months that is different from the ENSO periodicities of 43.5, 34.5 and 17.9 months.
Some recent studies indicate that the off-equatorial Rossby waves are linked to ENSO (Xie et al, 2002). However, as suggested by the slow propagation speed of the Rossby waves, they appear to have discussed something different from IOD. Rao et al. (2002), however, have demonstrated the dominance of the IOD events in modulating the equatorial subsurface interannual variability via equatorial ocean dynamics. Our wavelet coherence studies from 1958 through 1997 show that there is a tight coupling between the IODMI and EIOZWA in the Indian Ocean during the IOD-dominant decades. Also, sustained and significant coherency can be seen between 3NINOI and EIOZWA during 1978-1987; no sustained peak can be seen in the wavelet coherency between the IODMI and EIOZWA for the same period because there are very few IOD events during the same period. These factors indicate that basin-wide coupled dynamics is essential
Fig. 8: (a) The wave coherency for the period from 1958-1997 between (a) the IODMI time series and the EIOZWA (b)
3NINOI and the EIOZWA (c) IODMI and 3NINOI . Values greater than 0.82 (significant at 95% confidence level, obtained from 1000 Monte-Carlo simulations of the white noise) are shaded.

11
for the existence of the IOD. Our coherence studies support Rao et al. (2002)’s argument that the IOD events may arise owing to regional air-sea interaction, rather than owing to external forcing. However, the 1997 event seems to be also connected to the concurrent ENSO event in the Pacific via the atmospheric bridge.
Since the IOD events may arise and exist independently of ENSO, the Indian Ocean is an important modulator of the tropical climate variability. The influence of the IOD is not limited to the tropics; it influences the global climate variability on time scales ranging from years to decades through the atmospheric teleconnections, as demonstrated in the recent literature (Saji et al., 1999, Ashok et al, 2001, Saji and Yamagata, 2002 a, b). Since the IODMI is susceptible to contamination by mature ENSO signals mostly owing to the Clarke-Meyers effect, it may be better to use the partial correlation approach to isolate the IOD impact on different climate phenomena, as introduced by Saji and Yamagata (2002b).
Acknowledgments: The authors thank J. McCreary, G. Meyers, B. N. Goswami, J. R. Kulkarni, A. S. Rao, S. K. Behera, and S. Masson for the helpful discussions during the course of this work. The authors are also grateful to N. Nicholls for his critical comments that helped in the improvement of this article. The authors also are grateful to the reviewers for their useful comments, and to C. Torrence for the wavelet analysis and wavelet coherence programs. Many of the figures presented in this work have been prepared using the GrADS software. References Allan, R., D. Chambers, W. Drosdowsky, H. Hendon, M. Latif,
N. Nicholls, I. Smith, R. Stone, and Y. Tourre, 2001: Clivar Exchanges 6, 18-22.
Annamalai, J. Slingo, K. R. Sperber, and , K. Hodges, 1999: The mean evolution and variability of the Asian summer monsoon: comparison of ECMWF and NCEP/NCAR analysis. Mon. Wea. Rev., 127, 1157-1186.
Ashok, K., Z. Guan and T. Yamagata, 2001: Impact of the Indian Ocean Dipole on the relationship between the Indian Monsoon rainfall and ENSO. Geophys. Res. Lett. 26, 4499-4502.
Behera, S. K., R. Krishnan and T. Yamagata, 1999: Unusual Ocean-Atmosphere conditions in the tropical Indian Ocean during 1994. Geophys. Res. Lett. 26, 3001-3004.
Behera, S. K., and T. Yamagata, 2002: Impact of the Indian Ocean Dipole on the Southern Oscillation (accepted by J. Met. Soc. Japan).
Clarke, A. J., and Liu, X., 1993: Observations and dynamics of the semi-annual and annual sea levels near the equatorial Indian Ocean boundary. J. Phys. Oceano., 23, 386-399.
Dommenget, D. and M. Latif, 2002: A cautionary note on the interpretation of EOF. J. Climate, 15, 216-225.
Guan, Z., K. Ashok and Yamagata, T., 2002: Summertime response of the tropical atmosphere to the Indian Ocean sea surface temperature anomalies. (submitted to J. Met. Soc. Japan).
Hastenrath, S., 2002: Dipoles, temperature gradients, and tropical climate anomalies. Bull. Amer. Meteor. Soc., 83, 61-78.
Iizuka, S., T. Matsuura and T. Yamagata, 2000: The Indian Ocean SST dipole simulated in a coupled general circulation model. Geophys. Res. Lett., 27, 3369-3372.
Kalnay, E., and coauthors, 1996: The NCEP/NCAR 40 year Reanalysis Project. Bull. Amer. Meteor. Soc., 77 , 437-471.
Krishna Kumar, K., B. Rajagopalan, and M. A. Cane, 1999: On the weakening relationship between the Indian monsoon and ENSO. Science, 284, 2156-2159.
Meyers, G., 1996: Variations of Indonesian through flow and the El Nino-Southern Oscillation. J. Geophys. Res., 101, 12255-12263.
Murtugudde, R., J.P. McCreary, and A. J. Busalacchi, 2000: Oceanic processes associated with anomalous events in the Indian Ocean with relevance to 1997-1998. J. Geophys. Res., 105, 3295-3306.
Rao, A. S., Behera, S. K., Masumoto, Y., and Yamagata, T., 2002: Interannual subsurface variability in the tropical Indian Ocean with a special emphasis on the Indian Ocean Dipole. Deep-Sea Res. II, 49, 1549-1572.
Rayner, N. A., E. B. Horton, D. E. Parker, C. K Folland & R. B.Hackett, 1996: Version 2.2 of the Global Sea Ice and Surface Temperature Data Set, 1903-1994. (Clim. Res. Tech. Note 74, published by Hadley Centre for Climate Prediction and Research, Meteorological office, London Road, Bracknell, RG12 2SY, 35pp).
Saji, N. H., B. N. Goswami, P. N. Vinayachandran & T. Yamagata, 1999: A dipole mode in the tropical Indian Ocean. Nature 401, 360-363.
Saji, N. H., and T. Yamagata, 2002a: The tropical Indian Ocean climate system from the vantage point of Dipole Mode events (submitted to J. Climate)
Saji, N. H., and T. Yamagata, 2002b: Interference of teleconnection patterns generated from the tropical Indian and Pacific Oceans (submitted to J. Climate)
Torrence, C., and G. P. Compo, 1998: A practical guide to wavelet analysis. Bull. Amer. Met. Soc., 79, 61-78.
Torrence, C., and P. J. Webster, 1999: Interdecadal changes in the ENSO-monsoon system. J. Climate, 12, 2679-2690.
Ueda, H., and Matsumoto, J., 2000: A possible triggering process of east-west asymmetric anomalies over the Indian Ocean in relation to 1997/98 El Niño. J. Met. Soc. Japan, 78, 803-818.
Vinayachandran, P.N., N. H. Saji, and T. Yamagata, 1999: Response of the equatorial Indian Ocean to an unusual wind event during 1994. Geophys. Res. Lett., 11, 1613-1616.
Vinayachandran, P. N., S. Iizuka and T. Yamagata, 2002: Indian Ocean dipole mode event in an ocean general circulation model Deep Sea Res . II, 49, 1573-1596.
Wang, B., R. Wu, K.-M. Lau, 2001: Interannual variability of the Asian summer monsoon: Contrasts between the Indian and Western North Pacific-East Asian monsoons, J. Climate, 14, 4073-4089.
Webster, P. J., A. Moore, J.Loschnigg and M. Leban, 1999: Coupled ocean- atmosphere dynamics in the Indian Ocean during 1997-98. Nature, 40, 356-360.
Xie S-P., H. Annamalai, F. A. Schott, and J. P. McCreary, 2002: Structure and mechanism of south Indian Ocean climate variability. J. Climate, 15, 864-878.
Yamagata, T., S. K. Behera, S. A. Rao, Z. Guan, K. Ashok, and H. N. Saji, 2002a: The Indian Ocean Dipole: a physical entity. Clivar Exchanges 24, pp 15-18, 20-22.
Yamagata, T., S. K. Behera, S. A. Rao, Z. Guan, K. Ashok, and H. N. Saji, 2002b: Comments on the Indian Ocean Dipole (submitted to Bull. Amer. Met. Soc.)
Yu, J. -Y., C. R. Mechoso, A. Arakawa, and J. C. Williams, 2002: Impacts of the Indian Ocean on the ENSO cycle. (Geophys. Res. Lett., in press).
Yu, J.-Y., K-M. Lau, 2002: Forced and intrinsic variability of the sea surface temperature in the Indian Ocean. (submitted to Geophys. Res. Lett.).

12