Embed Size (px)
Citation preview

GCE AS and A LEVEL BIOLOGY Specimen Assessment Materials 69
© WJEC CBAC Ltd.
Candidate Name Centre Number Candidate Number
0
INFORMATION FOR CANDIDATES This paper is in 2 sections, A and B. Section A: 70 marks. Answer all questions. You are advised to spend about 1 hour 30 minutes on this section. Section B: 20 marks; Options. Answer one option only. You are advised to spend about 20 minutes on this section. The number of marks is given in brackets at the end of each question or part-question. The assessment of the quality of extended response (QER) will take place in question 6.
A LEVEL BIOLOGY UNIT 4 Variation, Inheritance and Options SPECIMEN PAPER (2 hours) 90 marks
For Examiner’s use only
Question Maximum Mark
Mark Awarded
1. 12
2. 12
3. 14
4. 15
5. 8
Section A
6. 9
Section B Option 20
Total 90
ADDITIONAL MATERIALS In addition to this examination paper, you will require a calculator and a ruler. INSTRUCTIONS TO CANDIDATES Use black ink or black ball-point pen. Do not use gel pen. Do not use correction fluid. Write your name, centre number and candidate number in the spaces at the top of this page. Answer all questions. Write your answers in the spaces provided in this booklet.
PMT

GCE AS and A LEVEL BIOLOGY Specimen Assessment Materials 70
© WJEC CBAC Ltd.
1. Spermatogenesis in humans is controlled by a number of hormones. Attempts to
develop a male contraceptive pill have focussed on disrupting the sequence of processes involved in the release of the male hormones.
(a) The photomicrograph below shows a section through the seminiferous tubule of a mammal.
Use the letters on the diagram to identify the following. [2]
I. a cell that secretes testosterone …………
II. a gamete …………
III. a cell that will divide by mitosis …………
IV. a cell that must differentiate to become functional …………
J K
M
P O
L
PMT
GCE AS and A LEVEL BIOLOGY Specimen Assessment Materials 71
© WJEC CBAC Ltd.
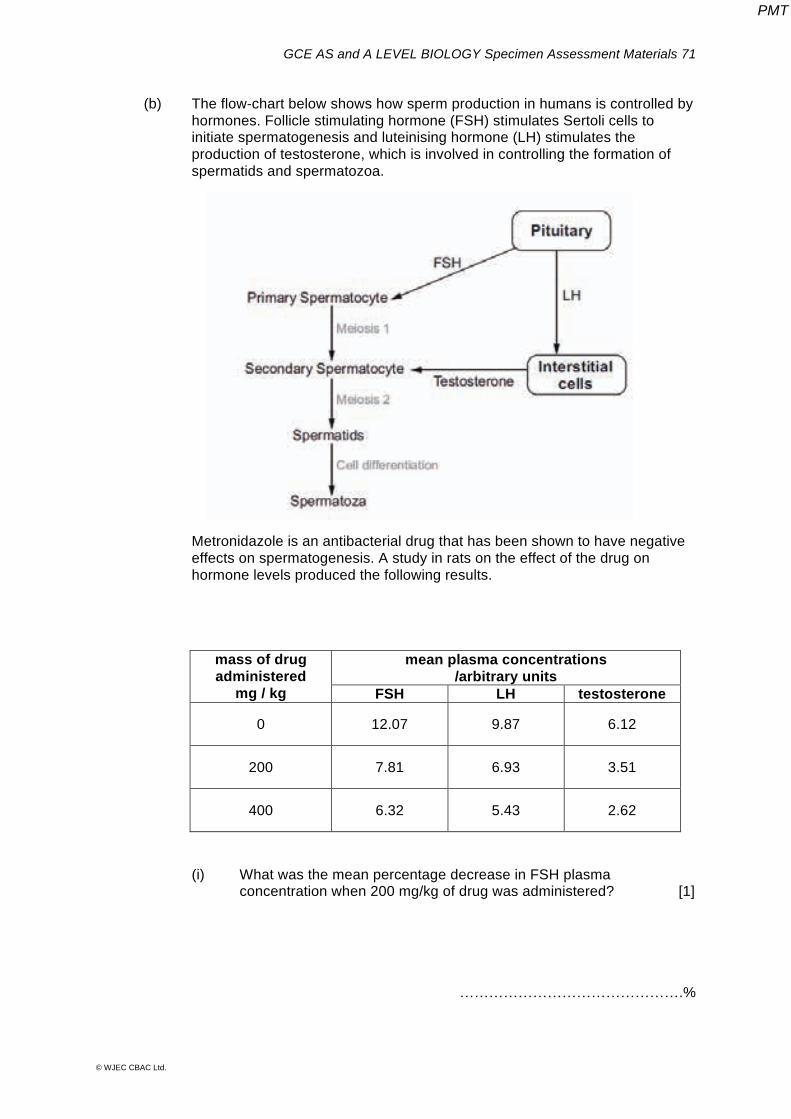
(b) The flow-chart below shows how sperm production in humans is controlled by hormones. Follicle stimulating hormone (FSH) stimulates Sertoli cells to initiate spermatogenesis and luteinising hormone (LH) stimulates the production of testosterone, which is involved in controlling the formation of spermatids and spermatozoa.
Metronidazole is an antibacterial drug that has been shown to have negative effects on spermatogenesis. A study in rats on the effect of the drug on hormone levels produced the following results.
mean plasma concentrations /arbitrary units
mass of drug administered
mg / kg FSH LH testosterone
0 12.07 9.87 6.12
200 7.81 6.93 3.51
400 6.32 5.43 2.62
(i) What was the mean percentage decrease in FSH plasma
concentration when 200 mg/kg of drug was administered? [1]
!!!!!!!!!!!!!!!.%
PMT

GCE AS and A LEVEL BIOLOGY Specimen Assessment Materials 72
© WJEC CBAC Ltd.
(ii) Calculate the mass of drug that would have to be administered to a rat
with a mass of 550g in order to achieve a relative dose of 200 mg/kg. [1]
……………………..
The scientists carrying out the study concluded that the metronidazole was most likely to have been acting on a part of the brain.
(iii) Use the information given to explain why the scientists may have
reached this conclusion. [4]
………………………………………………………………………………................
………………………………………………………………………………................
………………………………………………………………………………................
………………………………………………………………………………................ ………………………………………………………………………………................
………………………………………………………………………………................
………………………………………………………………………………................
………………………………………………………………………………................
(iv) Based on the evidence given, suggest two other sites where the metronidazole may have been acting, giving reasons for your answers. [4]
………………………………………………………………………………................
………………………………………………………………………………................
………………………………………………………………………………................
………………………………………………………………………………................
12
PMT

GCE AS and A LEVEL BIOLOGY Specimen Assessment Materials 73
© WJEC CBAC Ltd.
2. Arum maculatum is a spring-flowering plant found in Welsh woodland. The following observations were made on the structure of its flower through dissection.
The flowers are enclosed in a green, leaf-like structure called a spadix, with a ring of female flowers at the bottom and a ring of male flowers above them. A ring of hairs above the male flowers prevents insects that enter the spadix from leaving until fertilisation has occurred. The male flowers then ripen and the hairs wither. The spadix secretes a faecal odour and the temperature within the spadix can be up to 15oC warmer than the temperature of the surroundings. Once pollinated, the spadix dies, exposing the developing fruits, that turn a bright red colour as they ripen.
(a) Describe the sequence of events that take place during double fertilisation. [4] …………………………………………………………………………………………………..
.………………………………………………………………………….……………………… ………………………………………………………………………….………………………. …………………………………………………………………………………………………..
(b) What conclusions can you make regarding the types of pollination used by Arum maculatum to ensure fertilisation of its ovules? [5]
………………………………………………………………………………………………….. .………………………………………………………………………….……………………… ………………………………………………………………………….………………………. ………………………………………………………………………………………………….. ………………………………………………………………………………………………….. .………………………………………………………………………….……………………… ………………………………………………………………………….……………………….
hairs
male flowers
female flowers
Note: front of spadix has been removed
spadix
PMT

GCE AS and A LEVEL BIOLOGY Specimen Assessment Materials 74
© WJEC CBAC Ltd.
(c) The graphs below show the growing season of Arum maculatum and the relative light intensity reaching the ground in the woodlands where this plant grows. The table gives the mean monthly temperature in these woodlands.
Month J F M A M J J A S O N D Mean
temperature (oC)
5 4 8 10 12 13 15 16 10 8 5 4
Using your knowledge of photosynthesis explain how limiting factors affect the growth of Arum maculatum in April , July and November. [3] !!!!!!!!!!!!!!!!!!!!!!!!!!!!!!................
!!!!!!!!!!!!!!!!!!!!!!!!!!!!!!................
!!!!!!!!!!!!!!!!!!!!!!!!!!!!!!................
12
PMT

GCE AS and A LEVEL BIOLOGY Specimen Assessment Materials 75
© WJEC CBAC Ltd.
3. Dietary ethanol can be broken down by cells in the human body into ethanal which can then be converted into a two carbon molecule which is fed into the Krebs Cycle. Some people have mutations in the enzyme that catalyses this reaction and they are unable to metabolise ethanol.
(a) Ethanol dehydrogenase is found in the cytoplasm of cells, particularly in the
liver. The structure of the molecule is shown below.
A mutation in the DNA base sequence of the gene for ethanol dehydrogenase
caused a change in the primary structure of the protein at point X on the diagram. This reduces the ability of liver cells to breakdown toxic ethanol.
(i) What is meant by a gene mutation? [1]
!!!!!!!!!!!!!!!!!!!!!!!!!!!!!!.............
!!!!!!!!!!!!!!!!!!!!!!!!!!!!!!.............
(ii) Use your knowledge of protein synthesis to explain how this type of mutation could lead to a change in the tertiary structure of the protein. [4]
!!!!!!!!!!!!!!!!!!!!!!!!!!!!!!.............
!!!!!!!!!!!!!!!!!!!!!!!!!!!!!!.............
!!!!!!!!!!!!!!!!!!!!!!!!!!!!!!.............
!!!!!!!!!!!!!!!!!!!!!!!!!!!!!!.............
!!!!!!!!!!!!!!!!!!!!!!!!!!!!!!.............
X
PMT

GCE AS and A LEVEL BIOLOGY Specimen Assessment Materials 76
© WJEC CBAC Ltd.
(iii) During the conversion of ethanol into ethanal hydrogen atoms are
removed. Name a molecule that could accept these hydrogens. [1] ……………………………………………………………
(iv) Suggest how this conversion could increase ATP production. [1]
……………………………………………………………………………….............
……………………………………………………………………………….............
……………………………………………………………………………….............
(b) The All Wales Medical Genetics Service (AWMGS) provides specialist genetic services to individual patients and families with, or concerned about, rare genetic conditions.
DNA was extracted from two patients suffering from a defect in their ability to metabolise ethanol. Enzymes were used to cut samples of their DNA and the fragments were then separated using gel electrophoresis. The table below shows some of the enzymes available to cut DNA in this analytical technique. The arrows indicate where the enzymes cut the DNA.
Enzyme Recognition Site
AluI AG"CT
BamHI G"GATCC
EcoRI G"AATTC
HaeIII GG"CC
HindIII A"AGCTT
NotI GC"GGCCGC
Pst1 CTGCA"G
Taq1 T"CGA
(i) Name the type of enzyme used to cut the DNA. [1]
………………………………………………………
PMT

GCE AS and A LEVEL BIOLOGY Specimen Assessment Materials 77
© WJEC CBAC Ltd.
A part of the DNA base sequence for the ethanol dehydrogenase gene of the two patients is shown below.
(ii) From the information provided, conclude which enzymes were used to
cut the DNA samples. [2]
………………………………………………………………………………................
………………………………………………………………………………................
PMT

GCE AS and A LEVEL BIOLOGY Specimen Assessment Materials 78
© WJEC CBAC Ltd.
Gel electrophoresis of the fragments obtained for Patient A resulted in the bands shown below.
(iii) Draw lines on the graph to show the position of the fragments
obtained for Patient B. [2] (iv) Explain why the DNA fragments can be separated in this way. [2]
………………………………………………………………………………................
………………………………………………………………………………................
………………………………………………………………………………................
………………………………………………………………………………................
14
120
100
80
60
40
20
0
Patient A
Patient B
Num
ber o
f bas
es
Wells where samples were loaded
PMT

GCE AS and A LEVEL BIOLOGY Specimen Assessment Materials 79
© WJEC CBAC Ltd.
4. The common primrose has flowers that vary in the position of their anthers and the length of their styles. These characteristics are controlled by single genes as shown below:
Low anther position A Long style T High anther position a Short style t
Plants, pure breeding for long style and low anther position, were crossed with plants that were homozygous recessive for both characteristics. All the F1 produced flowers that had low anther positions and long styles. Some of the F1 offspring were then crossed together.
(a) Complete the diagram below to show the expected genotypes, phenotypes
and phenotype ratio of the F2 if inheritance of these characteristics follows standard Mendelian dihybrid inheritance. [5]
Parent phenotypes Long style, low anther x Short style, high anther
Parent genotypes ……………………… x …………………………
Parent gametes ……………………… x …………………………
F1 genotype ……………………… x …………………………
F1 phenotype Long style, low anther x Long style, low anther
F1 gametes …… …… …… …… x …… …… …… ……
F2 phenotypes
…………………………………………………………………………………………………
F2 genotypes
…………………………………………………………………………………………………
…………………………………………………………………………………………………
F2 phenotype ratio
………………………………………………………………………………………………
PMT

GCE AS and A LEVEL BIOLOGY Specimen Assessment Materials 80
© WJEC CBAC Ltd.
(b) One of the F1 was back-crossed with the double homozygous recessive parent. The results of this back-cross are shown below.
Low anther, long style 24 Low anther, short style 10 High anther, long style 13 High anther, short style 25
It was suggested that these characteristics are not inherited following Mendel’s second law as the observed numbers of this cross did not follow the expected 1:1:1:1 ratio.
Use χ 2 (chi2) to test if the anther position and the style length are inherited according to a standard dihybrid inheritance pattern or not. The null hypothesis for this test is that there is no statistical difference between the observed and the expected results.
(i) Complete the table to calculate the χ 2 value for this set of data. [3]
Phenotype Observed Numbers
(O)
Expected Numbers
(E)
Low anther, long style
24
Low anther, short style 10
High anther, long style
13
High anther, short style
25
∑
χ 2 = ……………………………..
PMT

GCE AS and A LEVEL BIOLOGY Specimen Assessment Materials 81
© WJEC CBAC Ltd.
(ii) Use your calculations and the probability table below to conclude whether to accept or reject the null hypothesis giving a reason for your answer. [4]
………………………………………………………………………………………….
…………………………………………………………………………………………. …………………………………………………………………………………………. …………………………………………………………………………………………. ………………………………………………………………………………………….
Probability Table for χ 2 Test
Degrees
of freedom
0.90
90%
0.80
80%
0.70
70%
0.50
50%
0.30
30%
0.20
20%
0.10
10%
0.05
5%
0.02
2%
0.01
1%
1 0.026 0.06 0.15 0.46 1.07 1.64 2.71 3.84 5.41 6.64
2 0.21 0.45 0.71 1.39 2.41 3.22 4.61 5.99 7.82 9.21
3 0.58 1.01 1.42 2.37 3.67 4.64 6.25 7.82 9.84 11.34
4 1.61 2.34 3.00 4.35 6.06 7.29 9.24 11.07 13.39 15.09
(c) One explanation for the deviation shown between the observed and expected
results was that the alleles for these characteristics are carried on the same chromosome.
With the use of annotated diagrams, explain how the F1 plant could give rise to four different gametes if the alleles show linkage.
[3]
15
PMT

GCE AS and A LEVEL BIOLOGY Specimen Assessment Materials 82
© WJEC CBAC Ltd.
5. Pregnancy testing involves detecting changes in the concentration of the hormones progesterone or human chorionic gonadotrophin (HCG) in blood or urine.
The graph shows how plasma concentration of these hormones changes during pregnancy.
(a) (i) Identify each of the two hormones shown in the graph and explain
which one would provide the best indication of pregnancy in the early stages. [3]
…………………………………………………………………………………………. ………………………………………………………………………..........................
………………………………………………………………………………………….
B
A
(weeks)
PMT

GCE AS and A LEVEL BIOLOGY Specimen Assessment Materials 83
© WJEC CBAC Ltd.
(ii) Describe the role of each of these hormones in the early stages of pregnancy.
I Hormone A: [1]
!!!!!!!!!!!!!!!!!!!!!!!!!!!!!!!
!!!!!!!!!!!!!!!!!!!!!!!!!!!............... !!!!!!!!!!!!!!!!!!!!!!!!!!!!!!!
II Hormone B. [2]
!!!!!!!!!!!!!!!!!!!!!!!!!!!!!!!
!!!!!!!!!!!!!!!!!!!!!!!!!!!............... !!!!!!!!!!!!!!!!!!!!!!!!!!!!!!!
(b) Pregnancy testing kits were developed in the early 1980s to detect one of
these hormones in urine.
The diagram shows the results of pregnancy testing in a sample of 1200 women at 5 and 21 days following ovulation. All women in the sample were subsequently shown to have conceived at the time of testing.
85.0
Percentage of women in sample (%)
PMT

GCE AS and A LEVEL BIOLOGY Specimen Assessment Materials 84
© WJEC CBAC Ltd.
(i) Explain why the negative results were treated as false negatives. [1]
………………………………………………………………………............... …………………………………………………………………………………
(ii) Calculate the number of women in the study who were given a positive result at 5 days post ovulation.
[1]
Number of women = ……………..
8
PMT

GCE AS and A LEVEL BIOLOGY Specimen Assessment Materials 85
© WJEC CBAC Ltd.
6. The Grand Banks is an area of sea off the coast of Newfoundland in Canada. It was once one of the most productive fishing grounds in the world for Atlantic cod.
The cod was fished heavily for about 50 years. About 60% of the total cod population
of reproductive age was harvested annually. Cod fishing in the Grand Banks was closed in1992 but by then the population was
less than 1% of what it had been. Cod grow evenly throughout their life.
The cod that remained when fishing was finally closed were much smaller and grew more slowly than the cod that lived in the Grand Bank several decades previously.
With reference to the information provided above and your knowledge of evolution, explain the changes observed in the phenotype of the Atlantic cod.
(The quality of your extended response will be assessed in this question.) [9QER] !!!!!!!!!!!!!!!!!!!!!!!!!!!!!!!!!!!!!.. !!!!!!!!!!!!!!!!!!!!!!!!!!!!!!!!!!!!!.. !!!!!!!!!!!!!!!!!!!!!!!!!!!!!!!!!!!!!..
PMT

GCE AS and A LEVEL BIOLOGY Specimen Assessment Materials 86
© WJEC CBAC Ltd.
………………………………………………………………………………………………….. ………………………………………………………………………………………………….. ………………………………………………………………………………………………….. ………………………………………………………………………………………………….. ………………………………………………………………………………………………….. ………………………………………………………………………………………………….. ………………………………………………………………………………………………….. ………………………………………………………………………………………………….. ………………………………………………………………………………………………….. ………………………………………………………………………………………………….. ………………………………………………………………………………………………….. ………………………………………………………………………………………………….. ………………………………………………………………………………………………….. ………………………………………………………………………………………………….. ………………………………………………………………………………………………….. ………………………………………………………………………………………………….. ………………………………………………………………………………………………….. ………………………………………………………………………………………………….. ………………………………………………………………………………………………….. ………………………………………………………………………………………………….. ………………………………………………………………………………………………….. ………………………………………………………………………………………………….. ………………………………………………………………………………………………….. ………………………………………………………………………………………………….. ………………………………………………………………………………………………….. ………………………………………………………………………………………………….. …………………………………………………………………………………………………..
PMT

GCE AS and A LEVEL BIOLOGY Specimen Assessment Materials 87
© WJEC CBAC Ltd.
………………………………………………………………………………………………….. ………………………………………………………………………………………………….. ………………………………………………………………………………………………….. ………………………………………………………………………………………………….. ………………………………………………………………………………………………….. ………………………………………………………………………………………………….. ………………………………………………………………………………………………….. ………………………………………………………………………………………………….. ………………………………………………………………………………………………….. ………………………………………………………………………………………………….. ………………………………………………………………………………………………….. ………………………………………………………………………………………………….. ………………………………………………………………………………………………….. ………………………………………………………………………………………………….. ………………………………………………………………………………………………….. ………………………………………………………………………………………………….. ………………………………………………………………………………………………….. ………………………………………………………………………………………………….. ………………………………………………………………………………………………….. ………………………………………………………………………………………………….. ………………………………………………………………………………………………….. ………………………………………………………………………………………………….. ………………………………………………………………………………………………….. ………………………………………………………………………………………………….. ………………………………………………………………………………………………….. ………………………………………………………………………………………………….. …………………………………………………………………………………………………..
PMT

GCE AS and A LEVEL BIOLOGY Specimen Assessment Materials 88
© WJEC CBAC Ltd.
………………………………………………………………………………………………….. ………………………………………………………………………………………………….. ………………………………………………………………………………………………….. ………………………………………………………………………………………………….. ………………………………………………………………………………………………….. ………………………………………………………………………………………………….. ………………………………………………………………………………………………….. ………………………………………………………………………………………………….. ………………………………………………………………………………………………….. ………………………………………………………………………………………………….. ………………………………………………………………………………………………….. ………………………………………………………………………………………………….. ………………………………………………………………………………………………….. ………………………………………………………………………………………………….. ………………………………………………………………………………………………….. ………………………………………………………………………………………………….. ………………………………………………………………………………………………….. ………………………………………………………………………………………………….. ………………………………………………………………………………………………….. ………………………………………………………………………………………………….. ………………………………………………………………………………………………….. ………………………………………………………………………………………………….. ………………………………………………………………………………………………….. …………………………………………………………………………………………………..
9
PMT

GCE AS and A LEVEL BIOLOGY Specimen Assessment Materials 89
© WJEC CBAC Ltd.
SECTION B: OPTIONAL TOPICS
Option A: Immunology and Disease
Option B: Human Musculoskeletal Anatomy
Option C: Neurobiology and Behaviour
Answer the question on one topic only. Place a tick (!) in one of the boxes above, to show which topic you are answering. You are advised to spend about 20 minutes on this section.
PMT

GCE AS and A LEVEL BIOLOGY Specimen Assessment Materials 90
© WJEC CBAC Ltd.
Option A: Immunology and Disease 7. Influenza is endemic in most communities and is characterised by large scale
outbreaks that can reach world-wide proportions. There are three distinct varieties, A, B and C that can be subdivided into many serotypes. Classification and identification of strains of the virus are based on immunological analysis of their surface proteins. Attempts to develop a 100% effective vaccine have failed, with most available vaccines affording, at best, about 60% protection.
The diagram shows the structure of an influenza virus.
(a) Using the information above answer the following questions. (i) Define the term endemic.
[1] !!!!!!!!!!!!!!!!!!!!!!!!!!
(ii) What is the term used to describe ‘"large scale outbreaks that !reach world-wide proportions’?
[1] !!!!!!!!!!!!!!!!!!!!!!!!!!
(b) Research into vaccine development has focussed largely on the neuraminidase and haemagglutinin proteins.
(i) Describe how you could test for the presence of protein in a sample of
the virus. [2]
!!!!!!!!!!!!!!!!!!!!!!!!!!!!!!!!!!. !!!!!!!!!!!!!!!!!!!!!!!!!!!!!!!!!!.
Haemagglutinin protein which binds virus to cell surfaces
Neuraminadase protein which transfers virus across cell membrane
Polymerase protein which synthesises RNA
Nucleoprotein protein associated with reproduction
PMT

GCE AS and A LEVEL BIOLOGY Specimen Assessment Materials 91
© WJEC CBAC Ltd.
(ii) Explain why research into influenza vaccines has focussed on these proteins. [2] ………………………………………………………………………..........................
………………………………………………………………………………………….
………………………………………………………………………..........................
………………………………………………………………………………………….
………………………………………………………………………………………….
(iii) It has been found that the haemagglutinin protein stimulates a strong
immune response but shows a high degree of antigenic variation over time while the neuraminidase protein is less immunologically active but shows far less variation between strains and over time.
Evaluate the choice of neuraminidase as the better option for
research into developing a vaccine that would provide effective, long-term immunity against the influenza virus. [3]
……………………………………………………………………….......................... ………………………………………………………………………………………….
………………………………………………………………………..........................
………………………………………………………………………………………….
………………………………………………………………………………………….
PMT

GCE AS and A LEVEL BIOLOGY Specimen Assessment Materials 92
© WJEC CBAC Ltd.
(c) The graph shows how blood antibody concentration against Rubella changed in a 12 month old child following injection with Rubella antigen at day 0 followed by a booster injection at day 40.
(i) Following the first injection with Rubella antigen the concentration of antibodies against the virus remained low for several days.
State the time taken for a protective level of antibody to be produced following the first injection.
[1] !!!!!!!!!!!!!
(ii) Explain why the time taken to produce the antibody level required for immunity was much shorter following the booster injection. [2]
!!!!!!!!!!!!!!!!!!!!!!!!!!!!!!!!!!.
!!!!!!!!!!!!!!!!!!!!!!!!!!!..........................
!!!!!!!!!!!!!!!!!!!!!!!!!!!!!!!!!!.
!!!!!!!!!!!!!!!!!!!!!!!!!!!!!!!!!!.
PMT

GCE AS and A LEVEL BIOLOGY Specimen Assessment Materials 93
© WJEC CBAC Ltd.
(d) The child, who had not been previously exposed to measles, was given a
separate immunisation against the measles virus at Day 40 - the same day that she received the booster injection against Rubella.
(i) On the same graph draw a line to show how the blood antibody
concentration against measles would change between days 40 and 60. [2]
(ii) Explain why the blood antibody concentration against measles
would change in this way. [3]
………………………………………………………………………………………….
………………………………………………………………………..........................
………………………………………………………………………………………….
………………………………………………………………………………………….
(e) The photograph shows the result of an ELISA (enzyme-linked immunosorbent assay) used to determine the concentration of antibodies in the plasma. The process is summarised below. 1. Rubella antigen is immobilised on an inert plastic matrix 2. the test sample is diluted and 0.4cm3 of the diluted plasma is placed in a separate well of the plate 3. anti-human antibodies which have an enzyme attached are then added – when a suitable substrate is added a colour change is observed 4. absorbance of light at 492nm is then measured 5. the concentration of antibody in the diluted sample is determined from a standard curve of absorbance at 492nm for known antibody concentrations
PMT

GCE AS and A LEVEL BIOLOGY Specimen Assessment Materials 94
© WJEC CBAC Ltd.
A 0.4cm3 sample of plasma from a person infected with Rubella was diluted by a factor of 10-3 from its original concentration. It was found to have a mean absorbance of 0.24 at 492nm. Using the standard curve of the absorbance of light at 492nm of known antibody concentrations shown below, calculate the mass of antibody present in 1cm3 of the original sample of plasma. Give your answer in mg cm-3. [3]
Antibody concentration: !!!!!!!!!mg cm-3 of plasma.
20
Concentration of antibody / ng cm3
Abs
orba
nce
of li
ght a
t 492
nm /a
.u.
PMT
GCE AS and A LEVEL BIOLOGY Specimen Assessment Materials 95
© WJEC CBAC Ltd.
Option B: Human Musculoskeletal Anatomy
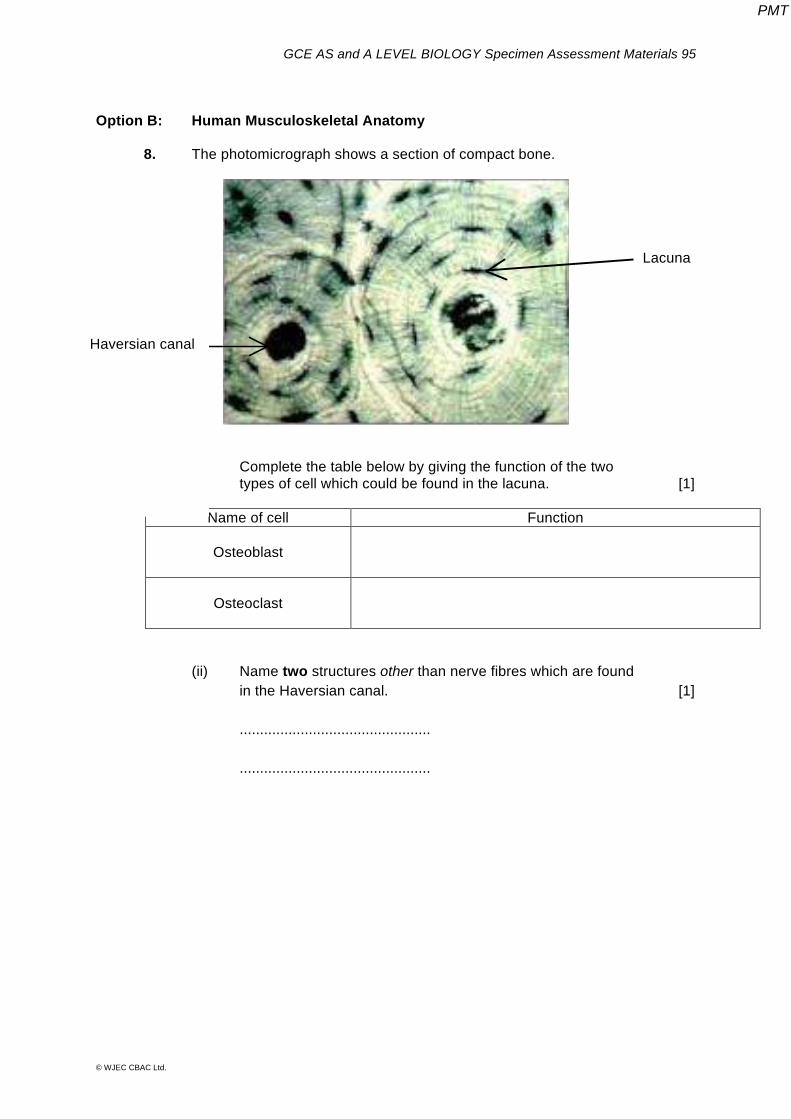
8. The photomicrograph shows a section of compact bone.
(a) (i) Complete the table below by giving the function of the two types of cell which could be found in the lacuna. [1]
Name of cell Function
Osteoblast
Osteoclast
(ii) Name two structures other than nerve fibres which are found in the Haversian canal. [1]
............................................... ...............................................
Haversian canal Haversian canal
Lacuna
PMT

GCE AS and A LEVEL BIOLOGY Specimen Assessment Materials 96
© WJEC CBAC Ltd.
(iii) (iii) The photographs below show human vertebrae. Identify which image
shows a cervical vertebra and use the photograph to describe how its structure is adapted to its function in the vertebral column. [2]
A B C
Cervical vertebra …………………………………… Adaptations to function ……………………………………………………….
………………………………………………………………………………………….
………………………………………………………………………………………….
………………………………………………………………………………………….
(b) Health workers in Wales have observed a rise in the number of cases of rickets in some parts of the country. It has been suggested that a reduction in outdoor play and the consumption of fewer dairy products could be contributing towards this.
Explain how these lifestyle changes could result in the development of rickets in young children. [5]
………………………………………………………………………………………………….. ………………………………………………………………………………………………….. ………………………………………………………………………………………………….. ………………………………………………………………………………………………….. …………………………………………………………………………………………………..
………………………………………………………………………………………………….. ………………………………………………………………………………………………….. …………………………………………………………………………………………………..
PMT

GCE AS and A LEVEL BIOLOGY Specimen Assessment Materials 97
© WJEC CBAC Ltd.
(c) The electron micrograph shows a section of muscle.
Micrograph 1 Micrograph 2
(i) Name the molecules labelled A and B in the micrograph above. [2]
A …………………………………….................. B ……………………………………..................
(ii) Identify the type of section shown in the micrographs above. [1] ................................................................................................................ (iii) Micrograph 2 above shows a section taken through the outside of the
A band of the sarcomeres. Draw a labelled diagram below to represent a similar section taken
through the I band of the sarcomere. [1]
A
B
PMT

GCE AS and A LEVEL BIOLOGY Specimen Assessment Materials 98
© WJEC CBAC Ltd.
(d) The length of the A band in human muscle is 1.85 µm. 0.25 µm at the centre of the myosin filament does not have myosin heads. There are 6 myosin heads in 40 nm of myosin filament.
Calculate how many myosin heads there are in each myosin filament. Show your working. [3]
Number of myosin heads = ……………..
(e) Doctors examined a patient suffering from weak, uncoordinated muscular contraction. Tests showed that the patient had lower than normal blood calcium levels. Doctors concluded that this was a possible cause of the symptoms observed.
Explain why the low calcium levels could have resulted in the symptoms observed. [4] ……………………………………………………………….................................................
……………………………………………………………….................................................
……………………………………………………………….................................................
……………………………………………………………….................................................
……………………………………………………………….................................................
……………………………………………………………….................................................
……………………………………………………………….................................................
……………………………………………………………….................................................
……………………………………………………………….................................................
……………………………………………………………….................................................
……………………………………………………………….................................................
……………………………………………………………….................................................
20
PMT

GCE AS and A LEVEL BIOLOGY Specimen Assessment Materials 99
© WJEC CBAC Ltd.
Option C: Neurobiology and Behaviour 9. Below is a diagram of the left hemisphere of the brain showing four areas that are
involved in speech and language.
(a) (i) Identify areas A, B, C and D in the diagram: [3] A ……………………………………… B ……………………………………… C ……………………………………… D ………………………………………
(ii) Describe the role played by Wernicke’s area and Broca’s area in speech and language. [2]
…………………………………………………………………………………
………………………………………………………………………............... …………………………………………………………………………………
PMT

GCE AS and A LEVEL BIOLOGY Specimen Assessment Materials 100
© WJEC CBAC Ltd.
(b) Functional Magnetic Resonance Imaging (fMRI) is a technique for examining activity of the brain. During investigations, the subjects were given a book to read while their brain activity was monitored. The images produced were then examined and the results shown on the table below.
Brightest areas of brain Individual A B C D
1 ! ! ! ! 2 ! !
The scientists concluded that individual 2 was reading silently. What conclusions should be reached regarding the activities of individual 1? Explain your answer. [1]
……………………………………………………………….....................................
……………………………………………………………….....................................
……………………………………………………………….....................................
……………………………………………………………….....................................
PMT
GCE AS and A LEVEL BIOLOGY Specimen Assessment Materials 101
© WJEC CBAC Ltd.
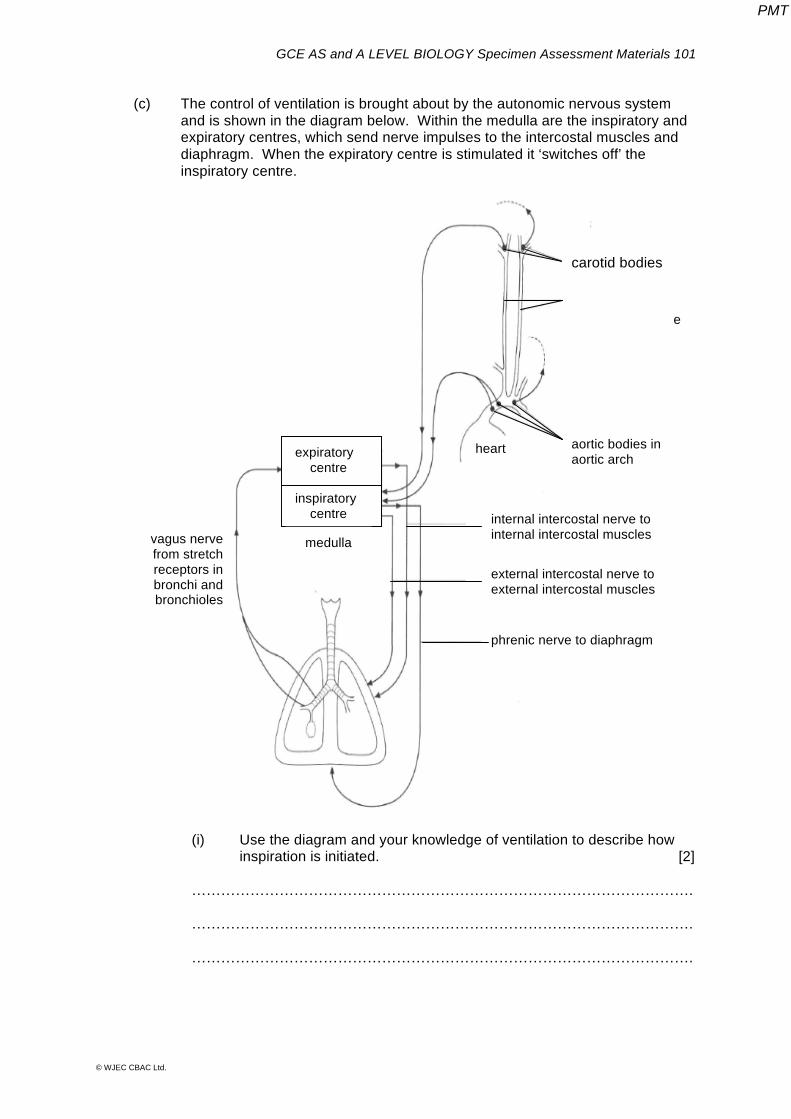
(c) The control of ventilation is brought about by the autonomic nervous system and is shown in the diagram below. Within the medulla are the inspiratory and expiratory centres, which send nerve impulses to the intercostal muscles and diaphragm. When the expiratory centre is stimulated it ‘switches off’ the inspiratory centre.
(i) Use the diagram and your knowledge of ventilation to describe how inspiration is initiated. [2]
…………………………………………………………………………………………. …………………………………………………………………………………………. ………………………………………………………………………………………….
carotid bodies
expiratory centre
common carotid arteries either side of neck
aortic bodies in aortic arch
heart
carotid bodies
internal intercostal nerve to internal intercostal muscles
phrenic nerve to diaphragm
vagus nerve from stretch receptors in bronchi and bronchioles
external intercostal nerve to external intercostal muscles
inspiratory centre
medulla
PMT

GCE AS and A LEVEL BIOLOGY Specimen Assessment Materials 102
© WJEC CBAC Ltd.
(ii) Use the diagram and your knowledge to explain the mechanism by which the ventilation rate is increased during exercise. [4]
…………………………………………………………………………………………. …………………………………………………………………………………………. …………………………………………………………………………………………. …………………………………………………………………………………………. ………………………………………………………………………………………….
(d) A student set up an experiment to investigate the effectiveness of different types of insect repellent. The diagram below shows the apparatus that she used.
The insect repellent was sprayed into the branch of the glass tube labelled E
and then 20 mosquitoes were introduced to the bottom of the tube. The student recorded the number of mosquitoes that entered the branch of the tube labelled F in two minutes. The student repeated the experiment and the apparatus was rinsed with water after each trial. The same volume and concentration of insecticide was sprayed in each trial. The data obtained is shown below.
(i) Suggest how the apparatus was set up for the control experiment. [1] ………………………………………………………………………………………….
Number of mosquitoes entering branch F Repellent Trial 1 Trial 2 Trial 3 Trial 4 Trial 5 mean Standard
deviation Control 10 9 8 12 11 10.0 1.41 Brand A 11 14 12 13 11 12.0 1.17 Brand B 16 17 19 18 17 17.4 1.02 Brand C 19 16 13 10 9 13.4
stimulus to attract mosquitoes
E F
Glass tubing
Mosquitoes introduced here
PMT

GCE AS and A LEVEL BIOLOGY Specimen Assessment Materials 103
© WJEC CBAC Ltd.
(ii) What type of behaviour is being exhibited by the mosquitoes in
response to the repellent? [1] !!!!!!!!!!!!!!!!!!!!!!!!!!!!!!!!!!.
(iii) Calculate the standard deviation for brand C by completing the table below and using the formula given. [3]
19 5.6 31.36 16 2.6 6.76 13 -0.4 0.16 10 -3.4 11.56 9 -4.4 19.36 =
The formula for standard deviation is:
Where = individual trial results for Brand C = mean results for Brand C = number of trials for Brand C = sum of
Standard deviation for Brand C = !!!!!!!!!!
(iv) What conclusion could be reached regarding the effectiveness of the different types of insect repellent? Comment on the strength of evidence for this conclusion. [3]
!!!!!!!!!!!!!!!!!!!!!!!!!!!!!!!!!! !!!!!!!!!!!!!!!!!!!!!!!!!!!!!!!!!! !!!!!!!!!!!!!!!!!!!!!!!!!!!!!!!!!!
20
PMT